
Abstract
The authors examine the relationship between the variation of policy choices on offer in a party system and citizen satisfaction. Cross-national analyses, based on 12 countries from 1976 to 2003, are presented that suggest that when party choices in a political system are more ideologically proximate to the mean voter position in left–right terms, overall citizen satisfaction increases. The central implication of this finding is that party positions matter for understanding within-country changes in satisfaction.
Cross-national empirical studies suggest that the quality of political representation is linked to citizen satisfaction. Consensual systems are “kinder and gentler” (Lijphart, 1999) and minimize differences in system support between “winners” and “losers” (Anderson & Guillory, 1997). Previous theoretical and empirical research on democratic representation emphasizes the primacy of the mean (or median) voter’s policy preference as the starting point for democratic representation (Downs, 1957; Erikson, MacKuen, & Stimson, 2002; Huber & Powell, 1994; McDonald & Budge, 2005; Powell, 2000; Stimson, MacKuen, & Erikson, 1995). The normative underpinning of these studies is that citizen satisfaction is enhanced when public policy reflects the preferences of the mean voter. 1
We move to integrate both groups of research, on citizen satisfaction and mean voter representation, by evaluating the normative claim that representation of the mean voter position enhances citizen satisfaction. We present empirical analyses that support the hypothesis that when party systems offer more policy choices that are proximate to the mean voter position, satisfaction increases.
There are several reasons why examining this claim is important. First, this research contributes to the study of citizens’ attitudes toward representative democracy by providing a direct test of normative claims about democratic politics that have dominated the study of party competition and democracy. These claims roughly add up to the notion that ceteris paribus citizens are more satisfied when policy representation takes place and that evaluating median (or mean) voter representation is appropriate for measuring policy representation at the country-level (McDonald & Budge, 2005; Powell, 2000). However, we depart from the authors cited above by emphasizing the diversity of party alternatives instead of government–citizen congruence. 2 This approach engages democratic theory from the point of view that it is crucial for all parties to “voice” citizen demands for policy. On this point, Gary Cox (1997) notes that the representative process can be defined “in terms of whether each voter can find a legislator who advocates similar views” (p. 236). The normative value of focusing on all of the parties represented in the legislature and the diversity of policy alternatives that they offer is neatly summarized by Sartori (1976), who argues, “Parties are channels of expression. That is to say, parties belong, first and foremost, to the means of representation: They are an instrument, or an agency, for representing the people by expressing their demands” (p. 27).
Second, the findings we report suggest another reason for studying parties’ policy positions. Recent studies by Tavits (2007) and Meguid (2005, 2008) link party positions to election outcomes. Tavits explores the electoral effects of “principled” and “pragmatic” policy shifts, and she reports parties gain support when their policy statements emphasize “pragmatic” (as opposed to “principled”) policy dimensions. This emphasis cues voters that the party is likely to achieve its objectives and ameliorate the relevant policy problem (such as the economy, poverty, crime, etc.). Meguid (2005, 2008) argues that popular support for “niche” parties, such as the green and radical right parties, is largely determined by the actions of mainstream parties in the political system. Meguid concludes that the electoral competitiveness of these parties is greatest when two conditions are met: first, that a mainstream party engages such parties on their primary issue dimension (e.g., the environment for green parties), thereby enhancing the salience of this dimension; second, that the mainstream party adopts an “adversarial” position along the issue dimension of the niche party. The empirical findings that we report below suggest that in addition to explaining election outcomes, parties’ policy positions are important because they are directly linked to our understanding of citizen satisfaction with democracy.
Third, there has been a resurgence of scholarship that has taken up elite polarization in the United States (see, e.g., Butler, 2007; McCarty, Poole, & Rosenthal, 2006). To the extent that the findings of our comparative study can be applied to the American context, it suggests that an additional reason for focusing on U.S. elite polarization is that it may be associated with citizen (dis)satisfaction.
Below we develop a measure of the average party policy distance from the mean voter position (average party policy extremism), and we explore the relationship between average party extremism and citizen satisfaction in 12 countries from 1976 to 2003. The empirical analyses reported below support the conclusion that citizen satisfaction increases when parties in a political system are, on average, more proximate to the mean voter position. By contrast, as left–right party ideologies become distinctly noncentrist, overall satisfaction decreases. The above finding brings to the fore perhaps a surprisingly understudied area in the literature on system support that highlights the role of relatively short-term factors (i.e., changes in the diversity of policy alternatives for electors) on short-term fluctuations in system support. This study represents a move in this direction.
Satisfaction With Democracy: Cross-National Approaches
An important area of research on system support (satisfaction) emphasizes the role of culture and values. In the Almond and Verba (1963) tradition, system support is related to political values and beliefs that are prevalent in a country and are transmitted through socialization (Norris, 1999; also see Inglehart, 1977, 1990). Another set of influential studies concludes that constitutional arrangements significantly affect attitudes toward the system (Anderson & Guillory, 1997; Birch, 2008; Criado & Herreros, 2007; Lijphart, 1999). Citizens tend to be more satisfied in consensual systems than in majoritarian systems (Anderson & Guillory, 1997; Lijphart, 1999). In an award-winning study, Anderson and Guillory (1997) report the finding that the institutional context mediates attitudes toward the democratic system. Whether a citizen is a member of the political majority (i.e., the “winners”) or political minority (the “losers”) matters because winners are more satisfied than losers. However, the difference in satisfaction between winners and losers varies across political systems. Losers in consensual systems tend to be more satisfied because there are safeguards for the protection of democratic minorities, which minimize utility losses for that group.
The results of Anderson and Guillory (1997) are corroborated by Lijphart (1999) in his comparative study of 36 countries. Lijphart (1999, p. 286) documents 17-percentage-point differences in satisfaction, on average, between citizens living in consensual systems and citizens in majoritarian systems. There are several dimensions on which consensual systems outperform majoritarian systems including the representation of women in parliament, political equality, and voter turnout.
Recent studies suggest that individual perceptions of representation are directly related to attitudes toward the system. Aarts and Thomassen (2008) analyze data from the Comparative Study of Electoral Systems to determine how notions of accountability and representation affect evaluations of the democratic system. They report findings that these attitudes are better predicted by perceptions of representation than by perceptions of accountability.
Taken together, the cross-national studies of Lijphart (1999), Anderson and Guillory (1997), and Aarts and Thomassen (2008) suggest that enhancing representative linkages between political elites and citizens increases satisfaction. 3 We address the inquiry from a slightly different perspective. Although institutional arrangements (as well as cultural values) are generally stable, the diversity of party policy choice varies within party systems quite significantly. 4 We examine the diversity of party policy alternatives on offer, and how evaluations of the democratic system change when these offerings vary around the mean voter position. The key independent variable, average party policy extremism, measures the diversity of party policy alternatives from one election year to the next. This measure of political representation allows for system support to be “conditional and responsive to the ebbs and flows of everyday politics” (Rovner, 2004, p. 106). It can thus be used to analyze the relationship between system support and representation within several institutional contexts.
The Citizen Satisfaction Hypothesis
There are indications about the relevance of policy representation for attitudes toward the system. Paskeviciute (2006, p. 2) associates government policy representation with system support, 5 and this relationship has been suggested by a number of additional studies. In the United States, Miller (1974, pp. 968-70) finds that cynicism and distrust toward the system between 1964 and 1970 can in part be explained by the distance between public opinion and the government positions on these policy areas. In the highly polarized political environment of the late 1960s, parties found it increasingly difficult to find an optimal position in the issue space that represents a majority of public opinion. Further research by the same author(s) has been extended to the European context arriving at similar conclusions (Miller & Listhaug, 1998) and has been confirmed by other studies (Borre & Andersen, 1997).
Here we argue that the accuracy of representation is measured through the mean voter position. Indeed, previous empirical and theoretical treatments of democratic representation have emphasized the primacy of the median voter as the starting point for democratic representation (Downs, 1957; McDonald & Budge, 2005; Powell, 2000). Their research proposes that governments or parties are empowered by the preferences of the pivotal actor in the issue space, namely, the median voter. The theoretical consideration underpinning these arguments is not who governs but rather “from what policy position does governance emanate” (McDonald & Budge, 2005, p. 25). If representative democracy should be sensitive to the preferences of the majority, the way to achieve this is to identify and empower the median voter. The position of the median voter is crucial because “a knowable and coherent” majority cannot be formed without her or him. Moreover, the median parliamentarian (defined in part by its median voter support) is the “policy king”: legislatures voting under majority rule ensure that the median preference is represented in the policy output (McDonald & Budge, 2005, p. 26). If representation of the median voter is a proxy for the quality and accuracy of representation then it should be positively related to system support.
We note that we depart from these authors by focusing on party policy alternatives instead of policy outputs. Our central theoretical expectation is based on a slight modification to the concept of party choice. Several prominent scholars have noted that parties matter for political representation because each party provides a vehicle through which citizens may express their preferences (Sartori, 1976; also see Carey & Hix, 2011). The implication is that more parties enhance choice. Our key modification, and contribution, is to slightly refine this notion of choice to assert that although party choice matters, representative party choice matters more for citizen satisfaction. In concrete terms, we combine the left–right measures of parties’ policy platforms to create a measure of average party policy extremism, which is computed based on the average policy distance from the mean voter position for each party competing in the election (discussed below). We consider whether attitudes toward the system are affected when this measure of average party extremism contracts or expands. For example, do citizens tend to be more supportive of the system when parties are more dispersed in the political spectrum, or do they express more support when parties converge toward the median position? The above considerations, based on median mandate theory and party choice, motivate our central hypothesis, which we label the citizen satisfaction hypothesis:
Hypothesis 1 (H1): Increases in average party policy extremism cause decreases in satisfaction with democracy.
Data and Measurement
The citizen satisfaction hypothesis posits that increases in the average party policy extremism depress citizen satisfaction with democracy. To test this proposition we develop longitudinal, cross-national measures of citizen satisfaction with democracy, the mean left–right voter position, and parties’ policy programs.
The Dependent Variable: Satisfaction With Democracy
To test the citizen satisfaction hypothesis it is necessary to measure citizen satisfaction with democracy and party proximity to the mean left–right voter position. The longitudinal measure of satisfaction with democracy derives from the Eurobarometer surveys from 1976 (the first year that the satisfaction with democracy item appears on the survey) until 2003 (the most recent year for which the Comparative Manifesto Project [CMP] data are available). In these surveys, approximately, 2,000 respondents per country each year were asked to place themselves on a 4-point scale with the question: “On the whole, are you very satisfied, fairly satisfied, not very satisfied or not at all satisfied with the way democracy works in our country?”. Citizen satisfaction (i.e., satisfaction) is computed as the percentage of respondents who report that they are either “very” or “fairly” satisfied with democracy in a country election year. This question’s wording has remained consistent for the years of the investigation. Moreover, it is the same indicator that has been used in several related studies (see, e.g., Aarts & Thomassen, 2008; Anderson & Guillory, 1997). 6
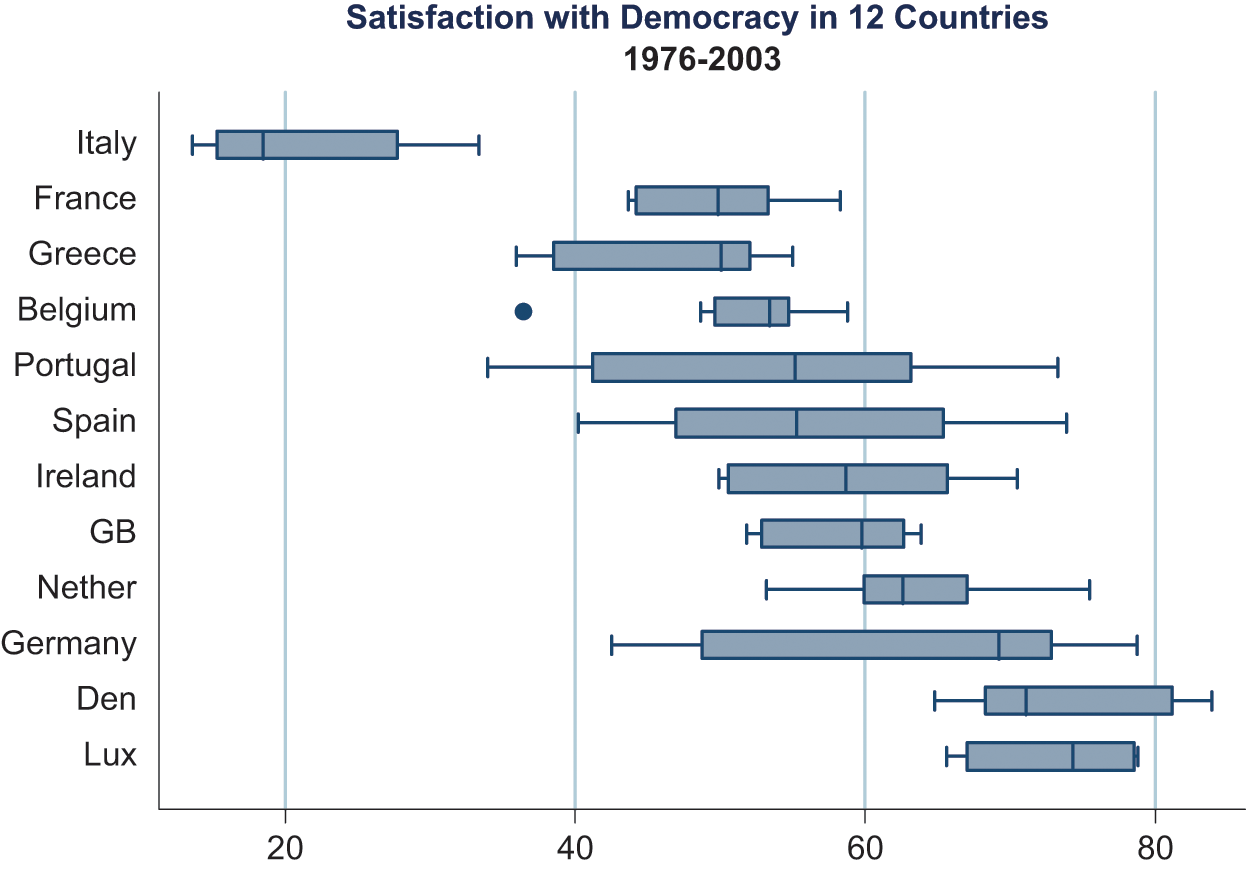
The distributions of the satisfaction variable are presented in Figure 1 for the 12 countries in the analysis. The box plots represent reported satisfaction levels with democracy for the election years in each country, and they depict several important qualities of the satisfaction variable. In the period covered by our data, Italy is on average the country with the lowest citizen satisfaction, whereas Denmark and Luxembourg exhibit consistently high levels of satisfaction. Portugal, Germany, and Spain exhibit the most variation in satisfaction across time, and Belgium has rather stable satisfaction levels from one election year to another.
Distribution of satisfaction
Measuring the Key Independent Variable: Average Party Policy Extremism
Although the measurement for the dependent variable is straightforward—in the sense that we rely on just one question that is included consistently in the Eurobarometer surveys—measurement of the independent variable, average party policy extremism, is more complicated. Although the measure of average party policy extremism requires only three pieces of information per country (these are the ideological placements of parties, the ideological placements of voters, and the parties’ vote shares), scholars disagree over how to aggregate party position measures into a valid country-level estimate of party policy extremism.
To measure average party policy extremism, it is first necessary to measure the mean voter position so that it is possible to determine how far parties’ policies deviate from the center of the voter distribution. Similar to the citizen satisfaction measure, the mean voter position is based on an additional item included in the Eurobarometer survey. The survey also asked citizens to place themselves on a 1–10 left–right ideological scale. 7 The average of these self-placements constitutes the mean voter position.
To measure party policy positions over time, we employ estimates from the CMP. These data are composed of party manifestos from the main political parties in 25 democracies in the postwar period and provide the only longitudinal and cross-national estimates of party policies. The analytical payoff of the CMP data is that they allow us to map party positions over the entire time period and in all of the countries under investigation. 8 Moreover, as the content of party programs is often the result of intense intraparty debate, the CMP estimates should be reliable and accurate statements about parties’ positions at the time of elections. Indeed, these measures are generally consistent with those from other party positioning studies, such as those based on expert placements, citizen perceptions of parties’ positions, and parliamentary voting analyses. This provides additional confidence in the longitudinal and cross-national reliability of these estimates (see Hearl, 2001; Laver, Benoit, & Garry, 2003). 9
Although the methods used by the CMP to map party policy positions based on election programs are described at length elsewhere, we briefly review these methods here. 10 Under the CMP framework, policy preferences are characterized by systematic examination of party stances on policies based on content analysis of election programs (Budge, Klingemann, Volkens, Bara, & Tanenbaum, 2001). Individual coders isolate “quasi-sentences” in a party’s policy program and pair them with policy categories (e.g., education, defense, law and order, morality, etc.) using a preestablished, common classification scheme. The classification scheme is made up of 56 categories, and the percentages of each category provide the basis for estimating the policy priorities of a party. The left–right ideological scores for parties’ policy programs range from –100 (extreme left) to +100 (extreme right). We note that we have recalibrated the CMP estimates to fit on the conventional 1–10 Eurobarometer scale. 11
In constructing a measure of dispersion, scholars present different arguments about whether or not the parties’ positions should be weighted by their size (see Alvarez & Nagler, 2004; Dow, 2001; Kollman, Miller, & Page, 1998). 12 Both of these arguments appear reasonable, and, consequently, below we report empirical analyses for both weighted and unweighted measures of party system dispersion. The weighted measure of average party policy extremism (WPE) is defined as follows,

where,
V k = the mean voter left–right ideological self-placement in country k
P jk = the ideological position of party j in country k
VS jk = vote share for party j in country k
The alternative to weighing parties’ positions by their vote shares is to weight all parties equally. This measure is the unweighted measure of the average party policy extremism (UPE), and it is constructed as follows,
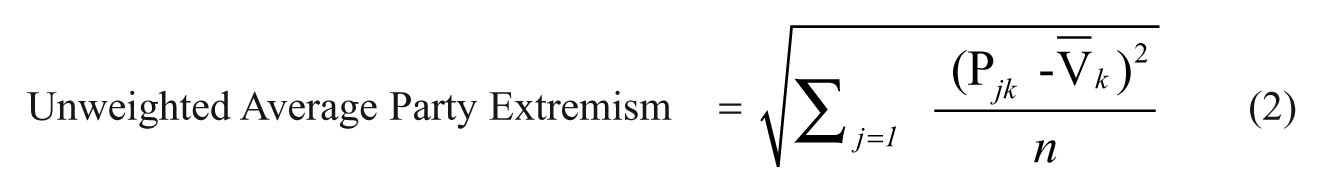
where,
n = the number of parties included in the analysis for country k
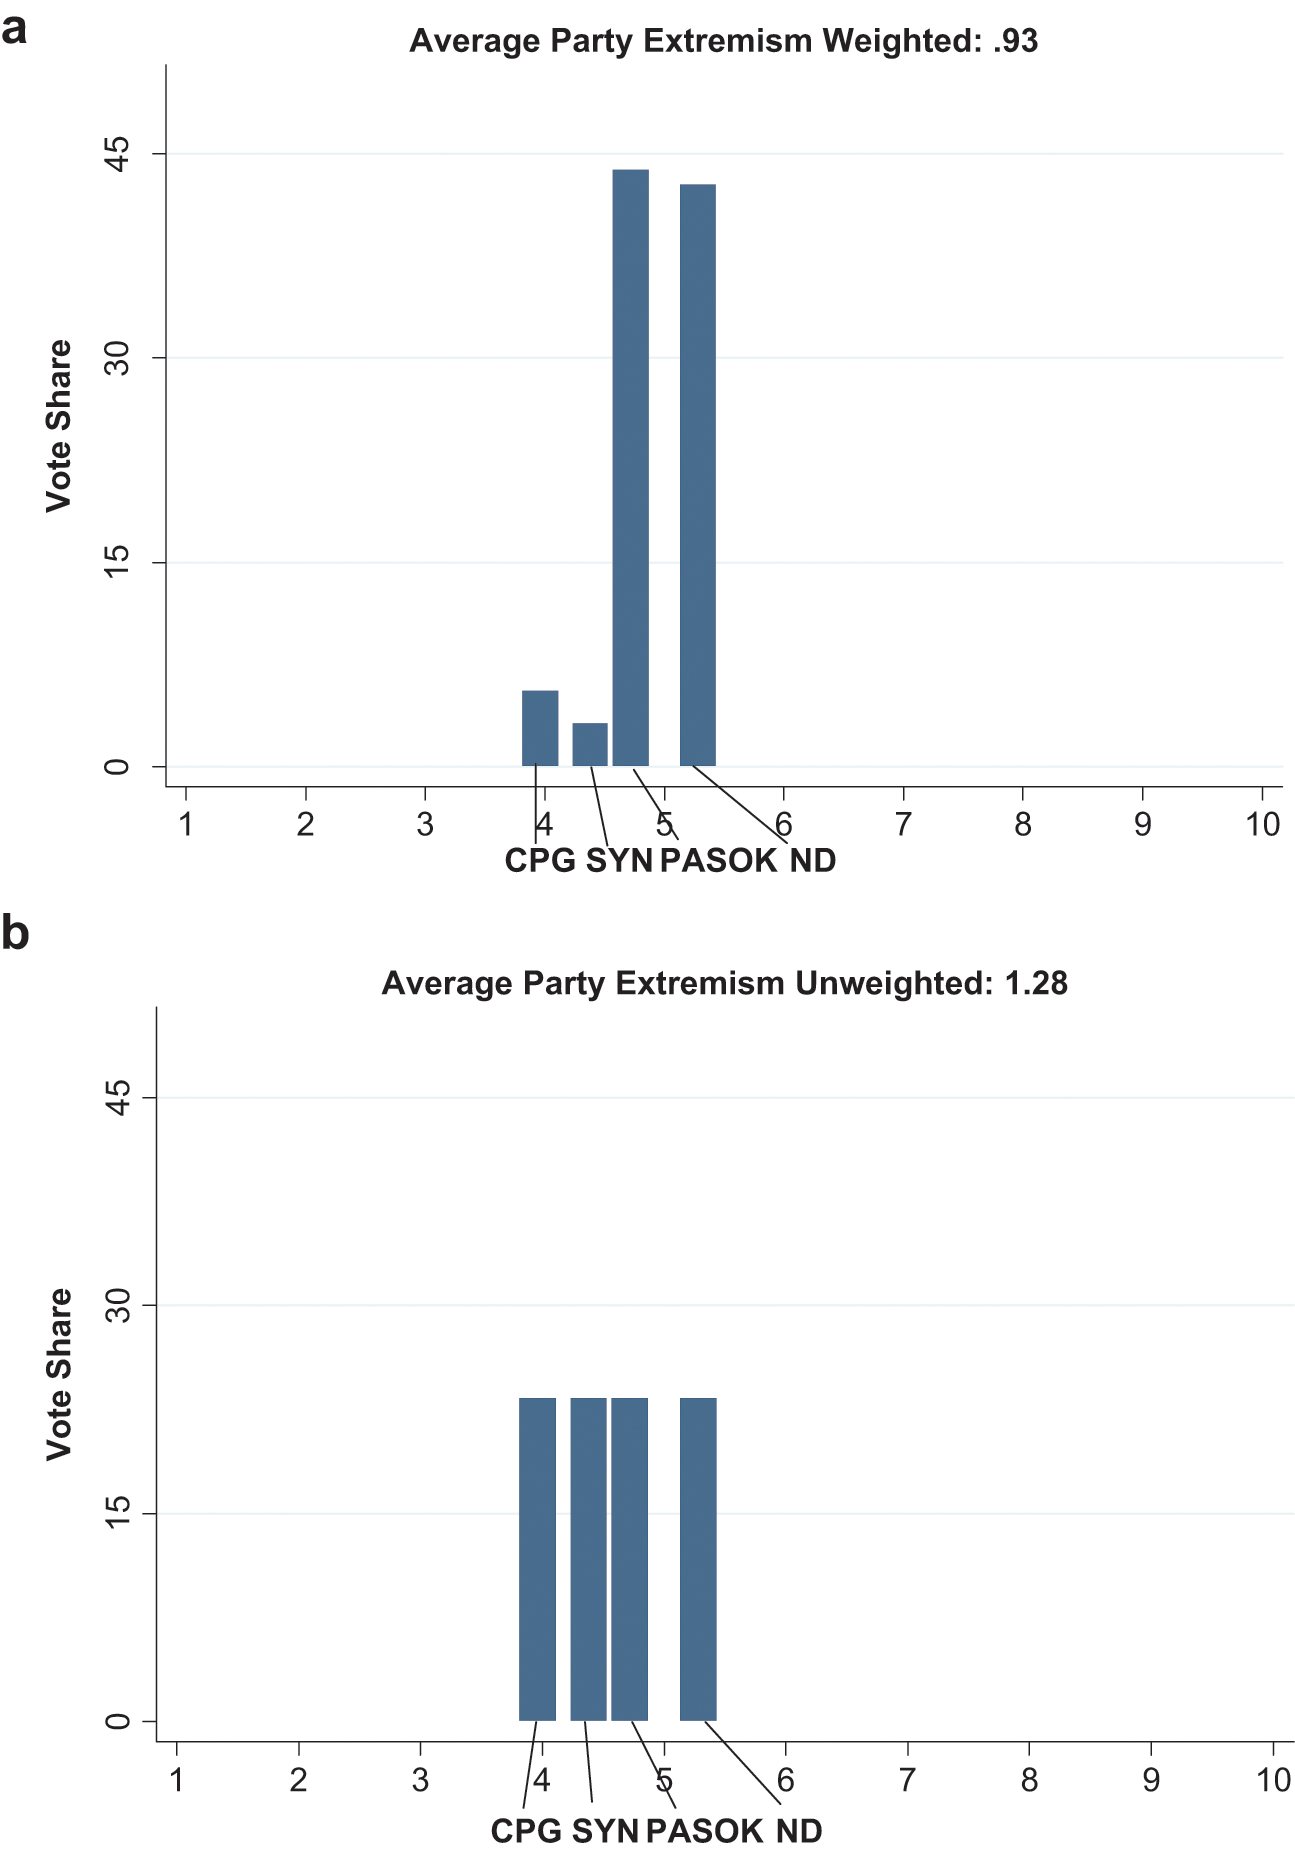
To visualize the mechanics of the unweighted (UAPE) and weighted (WAPE) measures of average party system extremism, refer to Figures 2a and 2b, which depict the Greek national parliamentary elections in 2000. For this election year, the WAPE measure is calculated as 0.93, whereas UAPE is calculated as 1.28. The explanation is straightforward for why the weighted version of average party extremism is less than the unweighted version. PASOK and New Democracy are coded as centrist parties in the Greek System, and they combine for a vast majority (87%) of the vote in the 2000 general election. When the parties’ positions are weighted by their vote share, the influence on our measure from extreme parties, such as the Greek Communist Party (CPG), is moderated as in this case when the CPG received only 5.5% of the vote. Hence, the score for the weighted version of average party extremism (0.93) is significantly lower than the unweighted score when all party positions are weighted equally (1.28).
Demonstrating the weighted and unweighted measures of average party extremism: The 2000 Greek national elections
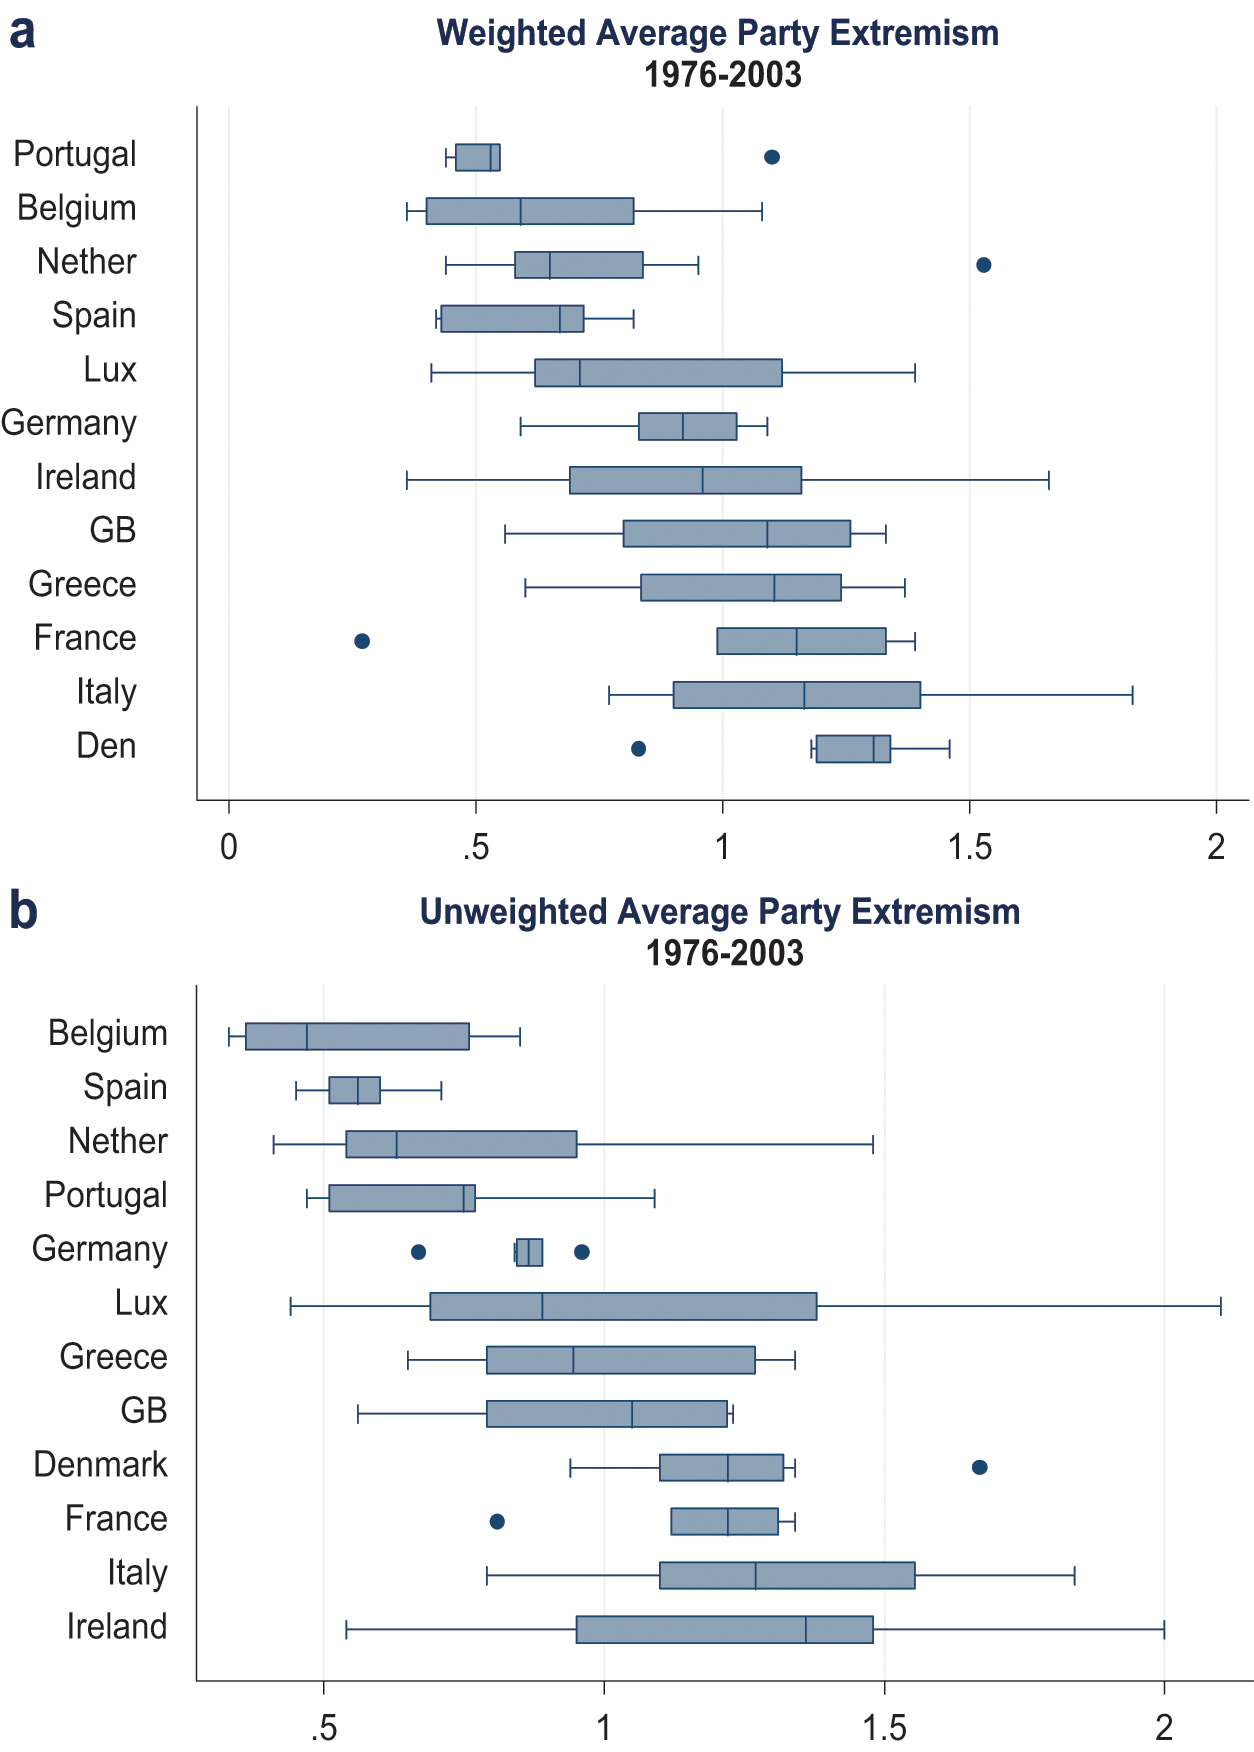
Figures 3a and 3b show distributions of the weighted and unweighted versions of the independent variable. The box plots presented in these figures can be interpreted similarly to those in Figure 1. Namely, large box plots indicate greater variation in average party extremism over time within a country. Indeed, each measure exhibits considerable variation across time with the exception of the unweighted German estimates and the weighted Portuguese estimates. We also note that similar versions of this measure have been employed in recent studies of policy dispersion (see, e.g., Ezrow, 2007; Hellwig, Mikulska, & Gezgor, 2010).
Distribution of weighted and unweighted average party extremism
Testing the Citizen Satisfaction Hypothesis
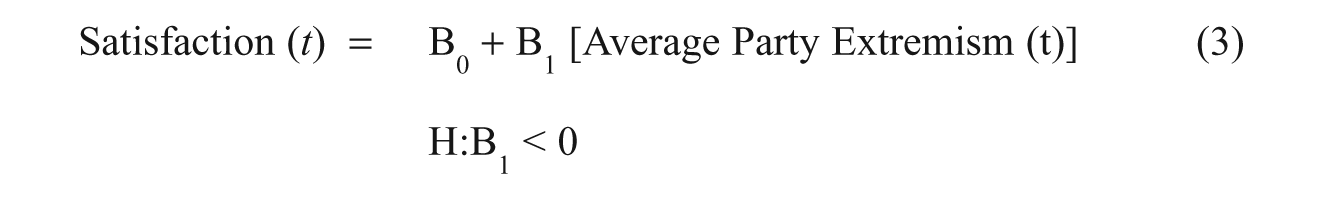
Recall that the citizen satisfaction hypothesis predicts a negative relationship between the degree of average party policy extremism and citizen satisfaction, that is, that as party policy alternatives drift away from the mean voter (measured by increases in average party policy extremism), citizen satisfaction with democracy decreases. The parameters of an ordinary least squares regression model are estimated to evaluate the citizen satisfaction hypothesis. Our basic specification is given below:
Given the structure of the data, serially correlated errors within countries are a possibility. That is, the causal processes that generate the satisfaction score at election t, could also be operating at election t−1. Thus, treating these observations as independent could be a problem. A Wooldridge test of serial correlation (see Drukker, 2003) for each specification suggests the absence of autocorrelation in our models. 13 As such, corrections for first order autocorrelation such as the inclusion of a lagged dependent variable in the model should not be necessary. The inclusion of satisfaction with democracy in the previous election year (t-1) in for the parameter estimates of several model specifications that we report serves only as an additional control variable and a more stringent test of our hypothesis. 14 Therefore, we have estimated the parameters of a model that incorporates the lagged version of the dependent variable, satisfaction (t−1):

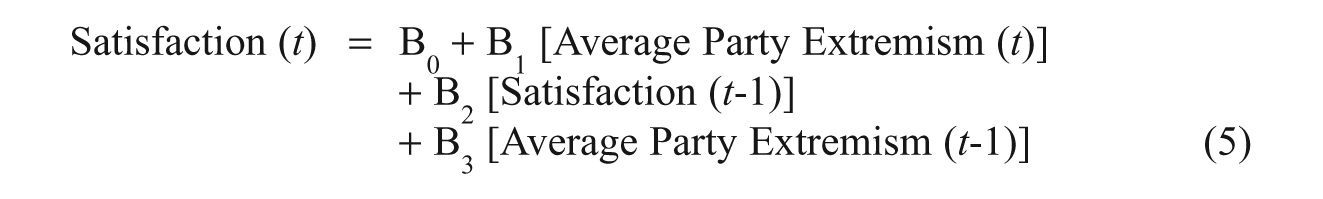
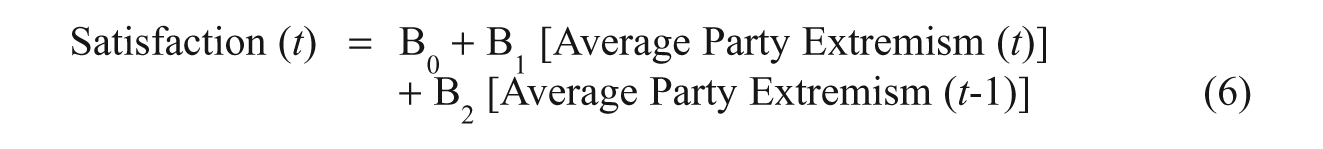
There are several empirical studies which conclude that there are temporal lags between parties’ policy shifts and the reactions of citizens (e.g., Adams & Somer-Topcu, 2009). Moreover, there are studies that suggest that including the lagged dependent variable dampens the effects of the lagged independent variables on the political phenomena being explained (see Plümper, Troeger, & Manow, 2005). Accordingly, we also estimate the parameters of the following specifications in Equations 5 and 6:
Results for the Basic Specification
The analysis encompassed 90 election year measures of average party policy extremism in Britain, Italy, Denmark, Belgium, France, Greece, Spain, Luxembourg, the Netherlands, Portugal, Ireland, and Germany in the period 1976–2003. 15 The data are best characterized as time-series cross-sectional (TSCS) as the set of observations include an average of six election measurements per country, across 12 Western European democracies. Estimating a simple regression on the TSCS data can lead to erroneous conclusions if there are unobserved differences among countries (Green, Kim, & Yoon, 2001; Hsiao, 2003). Thus, we estimate country-specific effects to ensure that unobserved differences between countries are not driving the major findings. We also estimate country-specific effects because the theoretical underpinnings of this study focus on intracountry and over-time variation of the dependent variable (rather than cross-national variation). 16
The parameter estimates for the basic specification are presented in columns 1 and 2 of Table 1. In the table, the coefficients estimating the effect of the average party extremism (t) variable on the satisfaction (t) variable are negative and reach statistical significance, regardless of whether the calculations are based on the WAPE variable (column 1) or the UAPE variable (column 2). These parameter estimates support the citizen satisfaction hypothesis (H1), that contractions in average party extremism systematically increase citizen satisfaction with democracy. This finding is labeled the Average Party Centrism Result.
Bivariate and Multivariate Analyses of Citizen Satisfaction
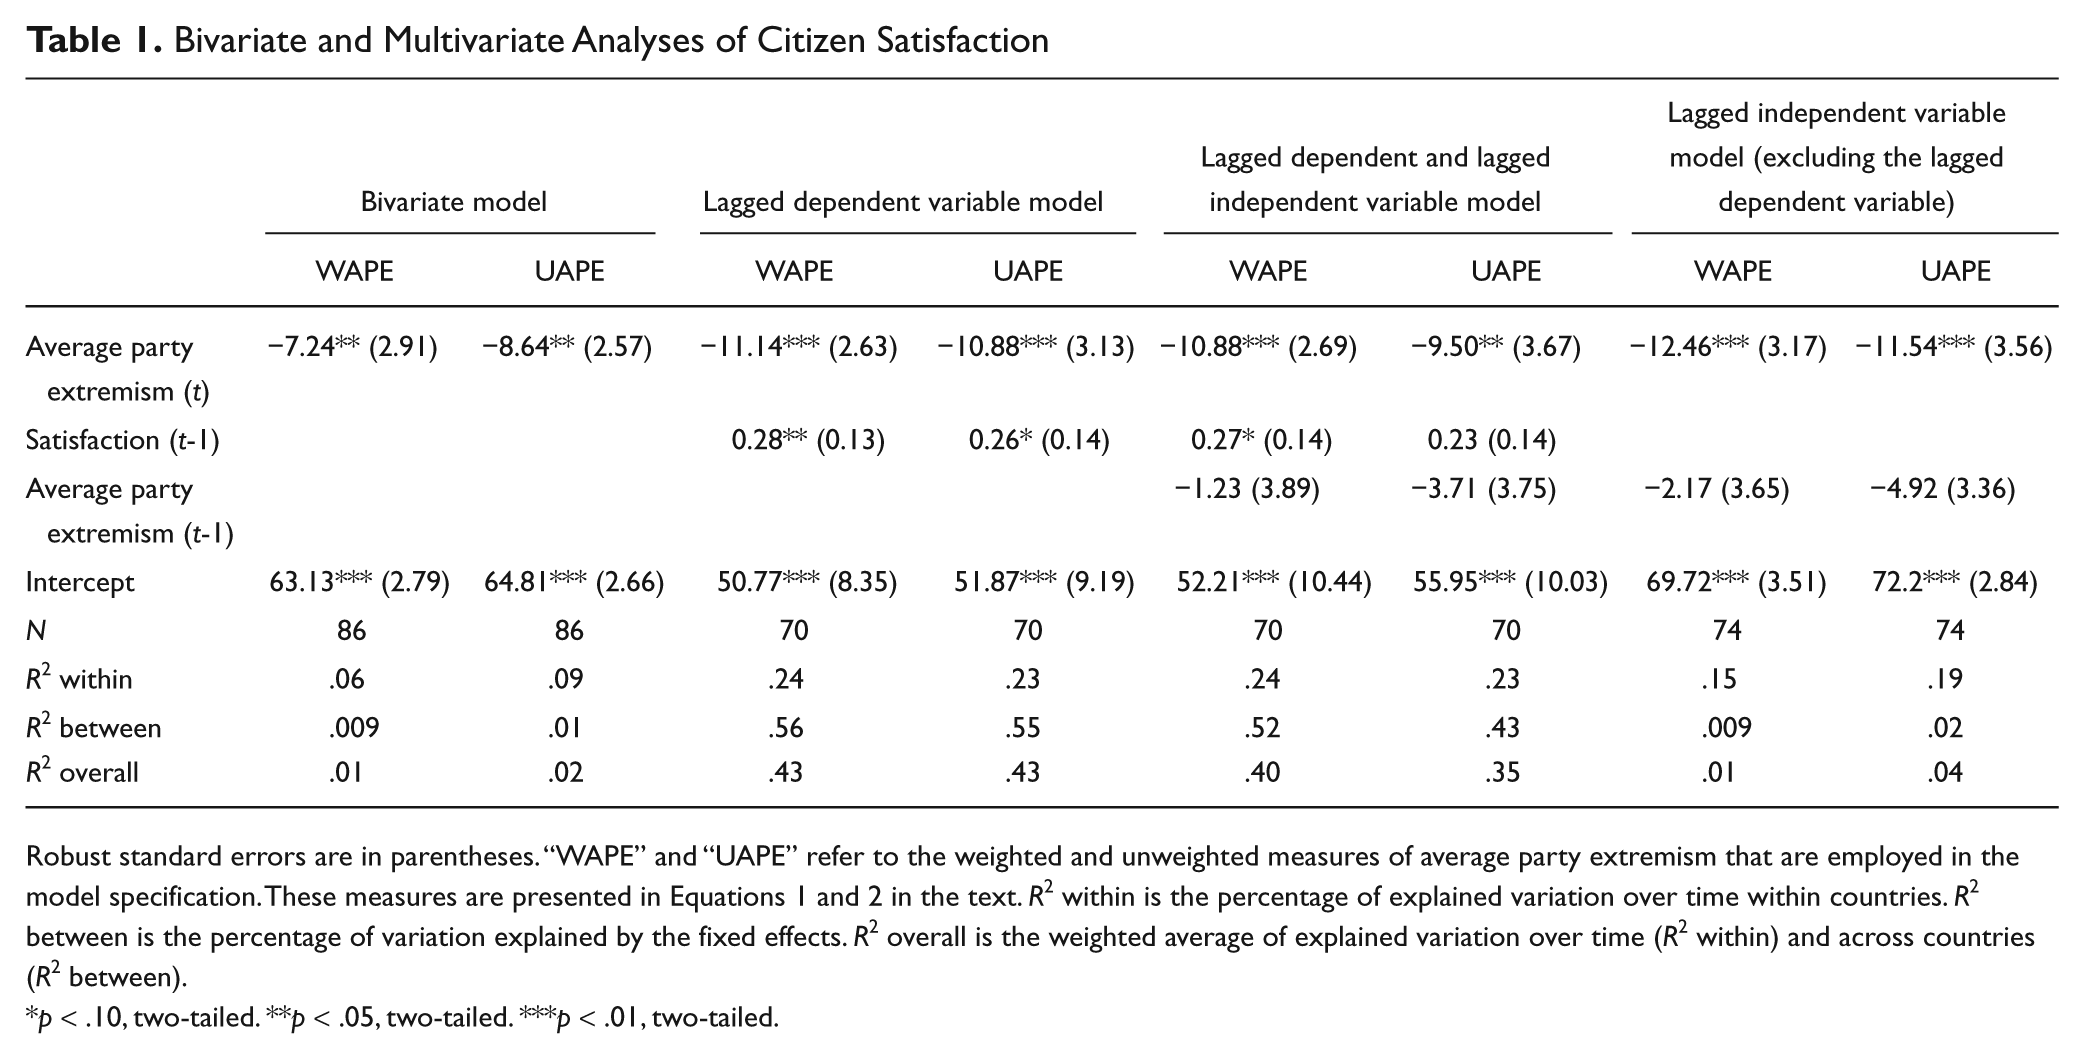
Robust standard errors are in parentheses. “WAPE” and “UAPE” refer to the weighted and unweighted measures of average party extremism that are employed in the model specification. These measures are presented in Equations 1 and 2 in the text. R2 within is the percentage of explained variation over time within countries. R2 between is the percentage of variation explained by the fixed effects. R2 overall is the weighted average of explained variation over time (R2 within) and across countries (R2 between).
p < .10, two-tailed. **p < .05, two-tailed. ***p < .01, two-tailed.
The negative and statistically significant parameter estimates on the average party extremism (t) variable in columns 3–6 of Table 1 continue to support the Average Party Centrism Result. Inclusion of the lagged dependent variable or the lagged independent variable does not influence our central findings. The two models that include the lagged dependent variable (columns 3–6) predictably perform better in terms of the reported percentage of explained variance than the two specifications that exclude lagged satisfaction (columns 1–2 and 7–8).
With respect to the citizen satisfaction hypothesis (H1), the size of the coefficients on the average party extremism (t) variable is substantively significant. For each of the models presented in Table 1, a one-unit increase in either WAPE or UAPE produces an estimated effect of between a 7- and 12-percentage point drop in satisfaction, along with the commensurate increase in dissatisfaction. Based on the coefficients on the average party extremism (t) variable reported in columns 3 and 4, a 0.58 increase in WAPE and a 0.43 increase in UAPE, representing the interquartile ranges of these variables, would tend to produce decreases in citizen satisfaction levels by 6.46 and 4.68 percentage points, respectively.
An obvious consideration is to what extent average party policy extremism is actually a cause of citizen dissatisfaction with democracy, as opposed to being a symptom of dissatisfaction. An alternative causal narrative is that radical parties are a vehicle through which citizens express their anger at some perceived failing of the mainstream parties in the political system, or as a vehicle for expressing dissatisfaction with the political system more generally. Under this scenario, the emergence of parties on extreme left or right will increase average party extremism, but in this case it would be a symptom of voter dissatisfaction rather than a cause of dissatisfaction.
On this point, we note that the strongest evidence of temporal effects in either direction is present in model specifications where we estimate the dependent variable as the mean satisfaction score (instead of using percentages). When this version of the dependent variable is employed, the parameter estimates on the average party extremism (t-1) variable are negative and statistically significant in several of the model specifications. These estimates signify a process in which citizens are responding to parties’ policy positions rather than to the process described above. If we observe that citizens are responding to parties’ policy positions from the previous electoral period, then we can rule out the notion that citizens’ current satisfaction levels caused the preceding arrangement of parties’ policy positions.
The Institutional, Economic, and Full Model Specifications
Although the results reported above provide evidence that citizen satisfaction varies with the average centrism of parties’ policy choices on offer in a political system, there are several alternative explanations that would account for the variance in aggregate satisfaction scores. Anderson and Guillory (1997) and Lijphart (1999) identify institutional factors relating to constitutional design and party system size. In addition, there are straightforward reasons to expect that economic factors such as unemployment, inflation, and GDP are linked to changes in satisfaction. We explore each of these explanations in turn.
Measuring Proportionality and the Number of Political Parties
The two system-level variables that we introduce to the empirical analyses here are disproportionality (t) and the number of parties (t). Here we follow Lijphart (1999), who measures these institutional characteristics for 36 democracies over the period 1945–1996. Lijphart in turn relies on Gallagher (1991) to measure electoral system disproportionality, which varies with the squared differences between parties’ vote shares and their subsequent seat shares in parliament. 17 According to this measure larger differences between votes and seats indicate greater disproportionality.
We use the effective number of parliamentary parties developed by Laakso and Taagepera (1979) to estimate the number of competitors in the party system. The Laakso–Taagepera (L-T) measure is constructed so that large parliamentary parties are counted more heavily than small parties. Thus, if four parties are competing and each receives 25% of the seats in parliament, the L-T measure of the effective number of parties is four, whereas if two large parties each control 40% of the seats in parliament and two smaller parties each control 10% of the seats, the effective number of parties is about three. 18
We rely on Appendix B of Gallagher and Mitchell (2008) for our country election year measures of disproportionality (t) and number of parties (t). We note that these systemic measures do not lend themselves to an across-time test of our hypothesis as they exhibit very little variation over time. 19 In addition, our model specification, which includes country-specific intercepts, targets intracountry variation and not intercountry variation. Nonetheless, our institutional measures do vary over time, and given their prominence in the cross-country satisfaction studies, we estimate the parameters of the institutional model specification in columns 1 and 2 of Table 2. The parameter estimates for the disproportionality (t) and number of parties (t) variables are close to zero and fail to reach statistical significance. This suggests that slight changes in the size of the party system or in proportionality do not result in short-term changes in citizen satisfaction. More importantly, for our study, the substantive conclusions remain unchanged.
Multivariate Analyses of Citizen Satisfaction: Institutional, Economic, and Full Model Specifications
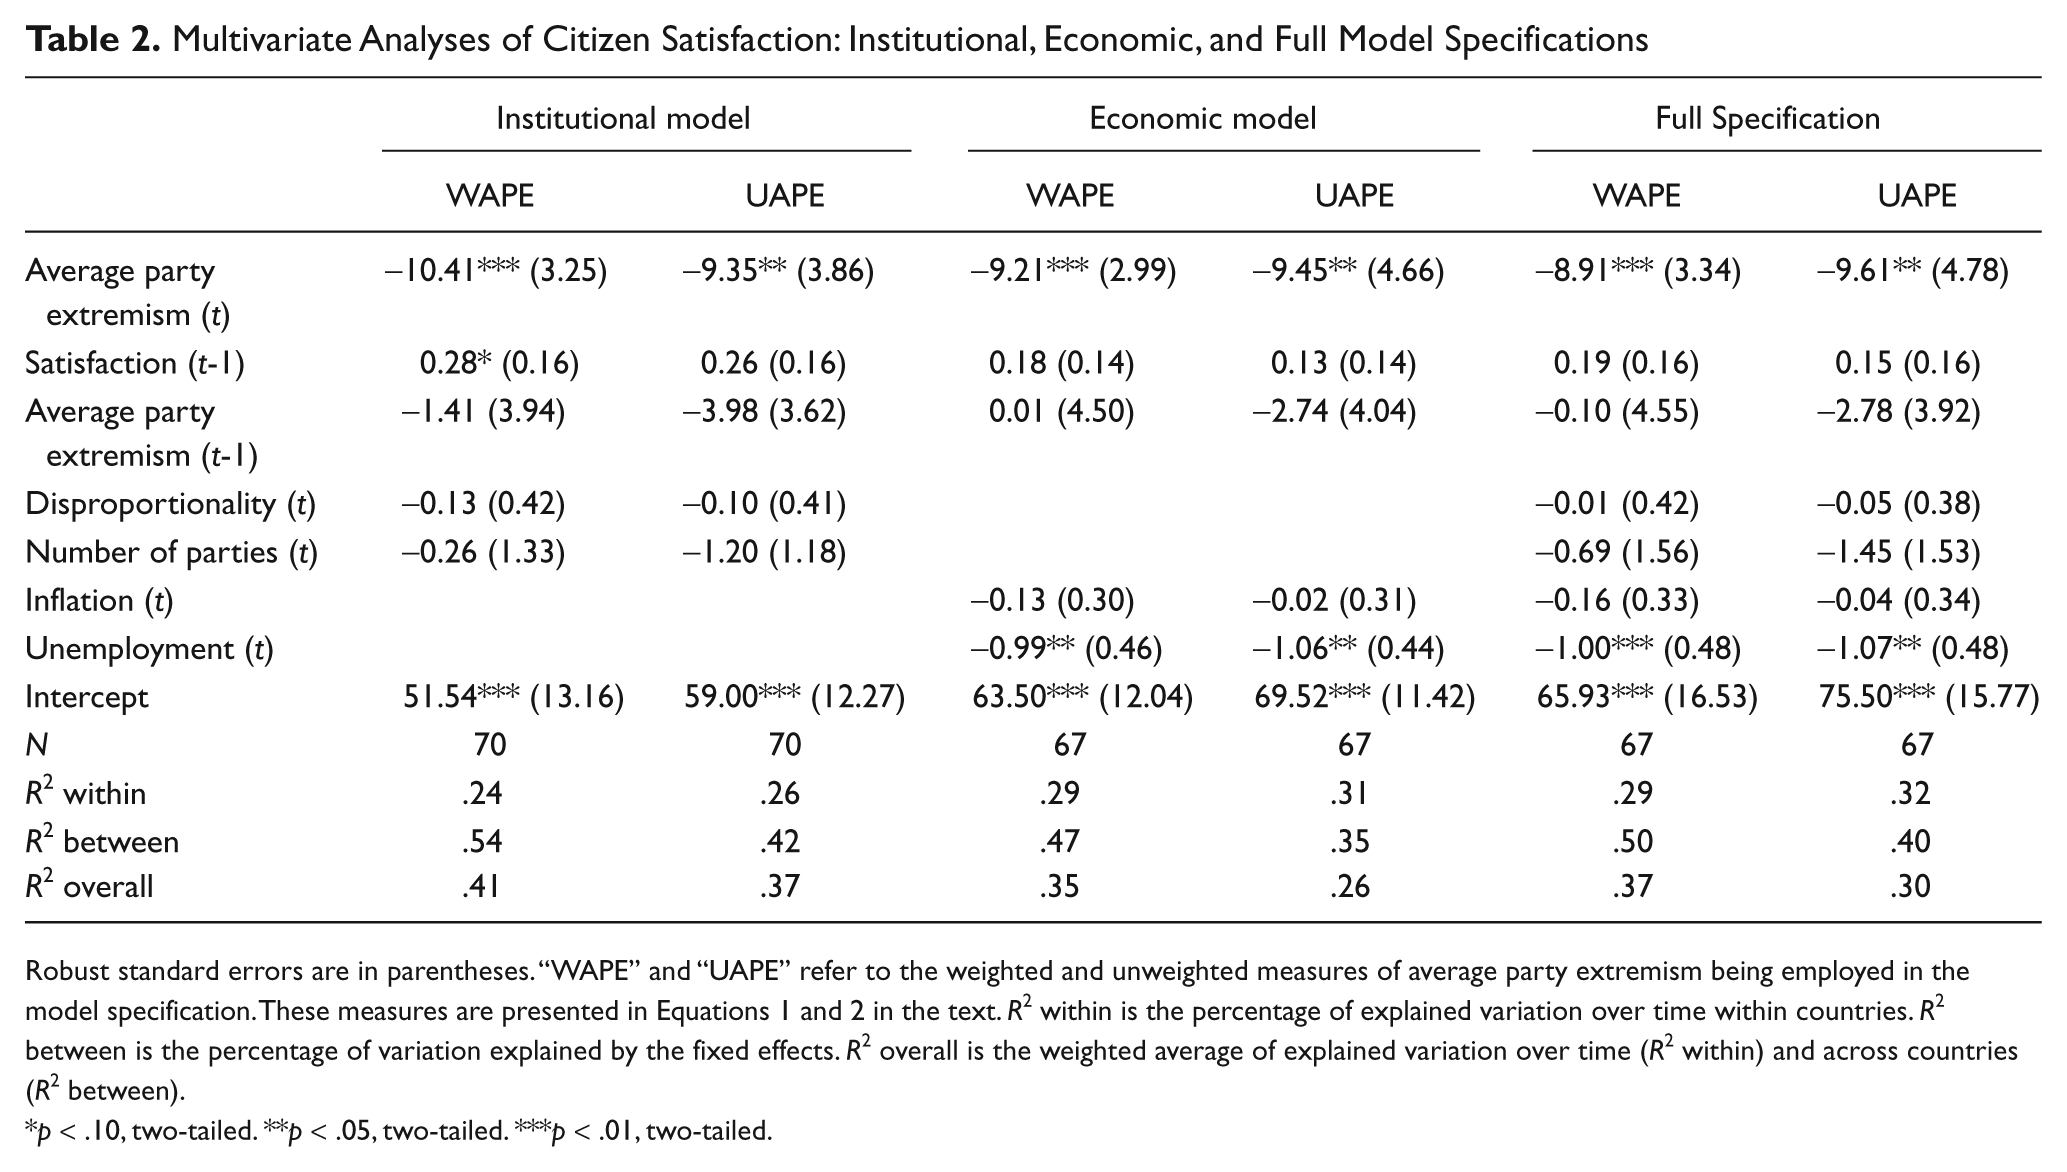
Robust standard errors are in parentheses. “WAPE” and “UAPE” refer to the weighted and unweighted measures of average party extremism being employed in the model specification. These measures are presented in Equations 1 and 2 in the text. R2 within is the percentage of explained variation over time within countries. R2 between is the percentage of variation explained by the fixed effects. R2 overall is the weighted average of explained variation over time (R2 within) and across countries (R2 between).
p < .10, two-tailed. **p < .05, two-tailed. ***p < .01, two-tailed.
The Economic Model
Taking into account Easton’s (1975) theoretical claims and the empirical findings from numerous studies, it would be foolish to exclude economic indicators in our models. The use of inflation and unemployment as independent variables is done here for empirical and theoretical reasons. The empirical reason is that a number of studies have established a connection between system support and economic conditions. The theoretical justification is based on Easton’s work, and his distinction between diffuse and specific support for the system. According to Easton, individual support toward a system manifests itself either as diffuse support that is, support for democracy as a concept, an arrangement of political life, or an ideal, or as support toward the output that the system provides (specific support), that is, support for the performance of the system across a number of areas. Studies on support for institutions have stressed the importance that economic performance has for political trust and support (Clarke, Nitish, & Kornberg, 1993; Gilley, 2006). Therefore, answers to the question “How satisfied are you with the way democracy works in your country?” will inevitably tap into perceptions of specific support and are likely to be driven, to an extent, by the general economic outlook and context in a given country at a given time. To adequately assess our hypothesis, the model specification includes economic indicators on the right-hand side of the equation. Measures of economic well-being, unemployment rates (unemployment (t)), and inflation (inflation (t)) are not only theoretically but also empirically relevant as previous studies have shown. 20
Accordingly, we estimate the parameters of the economic model specification in columns 3 and 4 of Table 2. The parameter estimates on the unemployment (t) variable are negative and statistically significant, which provides evidence that citizen satisfaction decreases when unemployment rates increase. The coefficient on the inflation (t) variable is close to zero and insignificant, which suggests that inflation is not systematically linked to citizen satisfaction when controlling for unemployment.
Columns 5 and 6 in Table 2 report the parameter estimates for a fully specified model, which controls for both institutional effects and economic effects. The coefficient estimates for this model and for the model specifications reported above continue to support the citizen satisfaction hypothesis (H1). A one point increase in average party extremism can account for about a 9% drop in overall satisfaction according to the estimates in columns 5 and 6 of Table 2.
In addition to the institutional and economic control variables, we conducted a series of additional robustness checks. 21 We reestimated the parameters of each model specification presented in Tables 1 and 2: using a measure of the dependent variable that is computed as the mean satisfaction response on the Eurobarometer survey, using several constructions of the independent variable (average party extremism), omitting on a country-by-country basis each country from the analyses, 22 controlling for corruption (following arguments made by Tavits, 2008), and performing “errors in variables” analyses to account for possible sources of measurement error. The results of all of these additional empirical analyses continued to support the citizen satisfaction hypothesis.
In addition, our analysis of a single left–right dimension could potentially bias our results because of the omission of additional cross-cutting policy dimensions. Two important studies by Kriesi et al. (2008) and Marks, Hooghe, Nelson, and Edwards (2006) identify an additional noneconomic cultural dimension in Western Europe for our time period. We evaluated this possibility by reestimating the parameters of the model specifications described above for Britain, the Netherlands, and Italy, because Benoit and Laver (2006, chap. 5) identify these party systems as revolving primarily around left–right economic issues. 23 We compared estimates from these countries to the estimates for the nine remaining multidimensional party systems, and each set of estimates supports the citizen satisfaction hypothesis.
Conclusion
Citizen satisfaction is central to general theories of democracy. Although previous research correctly emphasizes cross-national variation in citizen satisfaction levels, to date there has been very little systematic research examining dynamic intracountry changes in satisfaction. Rather than addressing how various institutional settings affect satisfaction, our study holds institutions constant. We attend instead to the intracountry features that contribute to changes in satisfaction. We report evidence that contractions in the diversity of policy alternatives on offer in a political system are accompanied by increases in the aggregate level of citizen satisfaction with democracy. The central implication of this result is that it supports the normative arguments underpinning many prominent cross-national studies of political representation that emphasize the role of the mean voter position (see, e.g., Erikson et al., 2002; McDonald & Budge, 2005; Powell, 2000; Stimson et al., 1995). On this point, G. Bingham Powell (2000) has commented, “The appropriate normative standard for the congruence of citizens and policymakers is the position of the median citizen” (p. 164).
The Average Party Centrism Result is also relevant to recent studies by Hobolt and Klemmensen (2008) and Adams, Ezrow, and Somer-Topcu (2011) on how voters are reluctant to respond to party policy positioning. Hobolt and Klemmensen conclude that the range of voters’ issue concerns moves, but is not significantly moved by, the issue diversity of party leaders’ speeches. In addition, Adams et al. (2011) report cross-national results that suggest that voters do not systematically adjust their own left–right policy preferences when parties change their policy statements. The central implication for all of these studies is that although it seems plausible for a small group of party elites to respond to citizens, citizens appear less likely to respond systematically in kind to these policy platform changes. The evidence presented here suggests that effects of parties’ programmatic shifts are reflected in voter attitudes by degrees of system support.
This finding raises several interesting questions for future research. We hope research on parties’ policy offerings will eventually be extended to consider how they affect satisfaction levels across groups of voters (e.g., extreme voters). Another possible direction follows a recent study by Timothy Hellwig (2008), who concludes that the saliency of the left–right dimension varies across countries. Based on the Hellwig study it is plausible that there is greater applicability of the Average Party Centrism Result to democracies where the saliency of the left–right dimension is enhanced.
In some regard this finding is refreshing for normative visions of democracy. The central implication is that policy representation translates into citizen support for democratic institutions and that citizens respond to their ideological “menu” of policy choice. However, another implication is that citizens are more content with convergent outcomes than with divergent ones, which highlights the trade-off between policy representation and policy choice. Based on the results we have reported, citizens in industrialized democracies prefer the former over the latter. Choices matter, of course, but proximate choices matter more.
Footnotes
Acknowledgements
Both authors contributed equally to this article. Earlier versions of the article were presented to the Measuring Policy Preferences, Outcomes, and Representation panel at the general conference of the European Consortium for Political Research, Potsdam, September 10–12, 2009, and at the annual meetings of the Midwest Political Science Association in Chicago, April 2–5, 2009. The authors thank Jim Adams, Dawn Brancati, Tim Hellwig, Jeffrey Karp, Gail McElroy, G. Bingham Powell, Margit Tavits, Vera Troeger, and the anonymous readers for their insightful comments on earlier drafts.
The authors declared no potential conflicts of interests with respect to the authorship and/or publication of this article.
The authors received no financial support for the research and/or authorship of this article.
1.
With respect to this point, Michael McDonald and Ian Budge comment that the median preference “provides an anchor point for majority opinion”, and they maintain, “[I]t is the endorsed policy position that minimizes differences with all the others. . . . It thus provides everyone with the best they can get in public policy terms under the existing distribution of individual preferences” (McDonald & Budge, 2005, p. 5). G. Bingham ![]() observes that “a government at the position of the median voter is as close to its electorate as it can possibly be” (p. 164).
observes that “a government at the position of the median voter is as close to its electorate as it can possibly be” (p. 164).
2.
Measuring effects of government–citizen congruence on satisfaction is the crucial next step for research developing in this area. Two important studies along these lines by Kim (2009) and ![]() have reported findings that individuals’ satisfaction increases when the government position is more proximate to their policy preferences.
have reported findings that individuals’ satisfaction increases when the government position is more proximate to their policy preferences.
3.
The connection between democratic representation and system support has been made in contexts outside of the domestic political systems of Western Europe that we concentrate on here. Two widely cited studies by Evans and Whitefield (1995) and ![]() , analyzing democratic performance and system support in Central Europe and the European Union, report findings that support this connection.
, analyzing democratic performance and system support in Central Europe and the European Union, report findings that support this connection.
4.
We note a few important exceptions where voting rule changes have occurred. Prior to 1994, members of the Italian Chamber of Deputies were selected based on proportional representation electoral rules (PR). In the 1994 election, Italy moved to a “mixed” system, where three quarters of the seats were filled using plurality voting and the remaining seats via PR. France experimented with PR in 1986, but then switched back to its dual ballot plurality voting system in 1988.
5.
6.
The authors acknowledge scholarly reservations as to what this indicator really taps into (Fuchs, Guidorossi, & Svensson, 1995; also see Canache, Mondak, & Seligson, 2001). The counterargument is that this question does not actually measure the legitimacy of the democratic system but rather support for the performance of the system. Although we do not attempt to resolve this issue, we nevertheless discuss model specifications below in which several factors (e.g., unemployment levels) are included that might account for “performance” related variation in the dependent variable.
7.
Specifically, the Eurobarometer surveys ask, “In political matters, people talk of ‘the left’ and ‘the right.’ How would you place your views on this scale?”
8.
In Mapping Policy Preferences II the Comparative Manifesto Project [CMP] updates its estimates of parties’ policy positions through 2003 and expands the number of countries for which it places parties (Klingemann, Volkens, Bara, Budge, & McDonald, 2006).
9.
Debate exists over which approach (e.g., expert opinions, citizen perceptions, or codings of manifestos) is the most accurate for measuring parties’ policy positions. A special issue of Electoral Studies analyzes the trade-offs that accompany each of these approaches (Marks, 2007). We rely on the CMP data because the data set covers a longer time period than the alternatives.
10.
For a more thorough description of the coding process, see Appendix 2 in Budge, Klingemann, Volkens, Bara, and Tanenbaum (2001).
11.
We recalibrated the CMP estimates to fit on 1–10 scale using the following equation: (CMP estimate × 9/200) + 5.5.
12.
The argument for weighting party system dispersion by party size is that such weighting accounts for the fact that the small parties in some countries have virtually no political influence. The arguments for relying on an unweighted measure of party system dispersion are that a parties’ policy influence does not necessarily correlate with vote (or seat) share. In addition, small parties provide a vehicle through which voters can express their policy preferences, regardless of whether or not such parties significantly influence government policy outputs.
13.
The null hypothesis of “no first order autocorrelation” cannot be rejected with p values ranging from .22 to .90.
14.
All models presented below have been estimated excluding the lagged dependent variable and the results remain unchanged.
15.
Satisfaction estimates for Germany post-1990 were calculated by combining East and West German Eurobarometer samples and weighting them relative to their population size.
16.
Hausman tests on the models reported below suggest that a fixed effects estimator is both efficient and more consistent than a random effects one.
17.
The equation for the Gallagher Index of Disproportionality is
18.
19.
The measure we employ in the statistical analyses picks up important exceptions described in the Note 5. For example, the dual ballot plurality voting system in France is scored as highly disproportional in 1981 (16.04); then it drops significantly with the brief change to PR in 1986 (7.23); and then the system scores high again in 1988 (11.84) when France readopts the pre-1986 voting rules.
20.
For measures of unemployment and inflation we rely on publications from the International Monetary Fund and the World Bank. Issues of multicollinearity led us to exclude GDP per capita from the economic and full model specifications. However, these parameters have been estimated with the inclusion of GDP per capita as an independent variable and the substantive results remained unchanged.
21.
22.
In addition, we have estimated the bivariate relationships between average party extremism and citizen satisfaction on a country-by-country basis. When we employ weighted average party extremism, 9 of the 12 coefficient estimates are in the expected direction (except for Denmark, Portugal, and Spain), and for unweighted average party extremism the coefficient estimates are in the expected direction for 10 of the 12 countries (except for Portugal and Spain).
23.
Based on experts’ ratings of parties’ positions, ![]() , chap. 5) report factor analyses that for the countries listed above there is a “first dimension” that explains at least 3 times as much variance as the second and that the first dimension can be straightforwardly interpreted in terms of the left–right dimension of economic policy.
, chap. 5) report factor analyses that for the countries listed above there is a “first dimension” that explains at least 3 times as much variance as the second and that the first dimension can be straightforwardly interpreted in terms of the left–right dimension of economic policy.