
Abstract
Despite waves of democratic backsliding over the last decade, most global citizens still claim to support democracy. On the other hand, many citizens become more supportive of specific anti-democratic actions when their preferred political side can benefit. How, then, do citizens justify their consistent “explicit support for democracy” with their more malleable support for the implementation of liberal democracy? This paper uses cross-national survey data from 74 countries and two methods—a standard cross-sectional analysis and a within-country variation design—to show that a citizen’s conceptualization of democracy, or what democracy means to them, is subject to partisan-motivated reasoning. In other words, citizens are more likely to conceptualize democracy in illiberal terms, like emphasizing the need for obeying authority, when their preferred political party is in power. The findings suggest one’s conception of democracy can be a fluid attitude that citizens mold to match their partisan self-interest.
Keywords
Introduction
On the night of Donald Trump’s election in 2016, Viktor Orbán, the right-wing illiberal leader of Hungary, released a message on Facebook saying: “democracy is still alive.” The irony is clear, as Orbán has slowly dismantled democracy in Hungary, while Trump challenged longstanding norms in the United States (Lührmann et al., 2020). The phenomenon of elected leaders claiming to support democracy while simultaneously attacking the very democratic institutions that brought them to power has characterized the global “third wave of autocratization” (Lührmann & Lindberg, 2019). Scholars have also observed a similar divide between explicitly claiming to support democracy and support for individual tenets of liberal democracy in public opinion surveys. The literature examining attitudes among the mass public, however, has typically either analyzed changes to these two concepts together or not investigated how and why they can change differently. From the Orbán quote above, however, it appears that the illiberal leader has a different definition of “democracy” than political scientists (see Coppedge et al., 2011) or his partisan opponents. How, then, does partisan self-interest differentially impact whether citizens explicitly claim to support democracy versus their support for potential anti-democratic actions? Is this difference explained by a partisan-motivated change in their understanding of what democracy means?
The literature surrounding support for democracy is broad and robust. Despite being a somewhat vague concept, the literature typically operationalizes support for democracy using survey questions that ask: whether respondents believe democracy is appropriate and desirable; to compare democracy to an undemocratic alternative; or to evaluate undemocratic actions or forms of government (Claassen, 2020, p. 122). Responses to these questions have been shown to predict the prospects for democracy (Claassen, 2020; Inglehart & Welzel, 2005; Qi & Shin, 2011), impact individual voter behavior (Booth & Seligson, 2009; Gunther et al., 2007), and other non-voting forms of political participation (Bakule, 2021). These survey questions, however, often measure different constructs and many citizens appear to hold contradictory views (Ariely & Davidov, 2011; Schedler & Sarsfield, 2007). Despite this finding and the knowledge that these attitudes are consequential, the literature has not thoroughly investigated how certain events can have a differential impact on citizens’ explicit support for democracy versus their preference for specific actions that are antithetical to liberal democracy.
In this article, I argue that citizens’ partisan self-interest can drive different changes in their explicit support for democracy versus their support for specific anti-democratic actions and offer an explanation for how citizens justify these changes. Using two different methods to analyze data from the sixth and seventh waves of the World Values Survey (WVS) and the fifth wave of the European Values Study (EVS), I show that supporters of the regime in power are more favorable toward specific actions that violate tenets of liberal democracy, but do not profess less “explicit support for democracy.” To satisfy their understanding that democracy has normative value while simultaneously supporting specific anti-democratic actions, I theorize and show that partisans in power are more likely to conceptualize democracy in illiberal terms—like emphasizing the need for authority and deemphasizing the importance of civil rights. In this sense, given the broad nature of democracy as a concept, the data show that citizens are free to take an á la carte approach to constructing an understanding of democracy that fits their partisan self-interest.
The results offer a better understanding of how citizens’ support for democracy can be responsive to the changing political context. Specifically, it demonstrates how the social desirability behind the term “democracy” (Inglehart, 2003) means that answers to survey questions that directly ask about the desirability of democracy are less subject to partisan self-interest. On the other hand, it is clear that some aspects of “support for democracy,” notably those that deal with the power and rules of government, are subject to change based on the appeal of partisan gain. Lastly, the data also shows the meaning of democracy for individual citizens is also subject to partisan self-interest—creating a clear narrative that citizens who support the regime can claim to explicitly support democracy, while simultaneously supporting individual anti-democratic actions because those actions fit within their molded understanding of what democracy means.
The structure of the article is as follows. It will begin by briefly reviewing the existing literature that explains the various sub-components of support for democracy and what impacts them. Second, I will then present a theoretical argument that articulates how the three concepts are differently subject to partisan-motivated reasoning. Third, the article will introduce the survey data, describe the methods, and discuss the operationalization of the variables. Fourth, it will present and discuss the results from the two studies. Finally, it will conclude with a discussion of the limitations of the study and the implications of the findings.
Supporting What Kind of Democracy?
Empirical studies consistently find that most citizens around the world express support for a democratic political system and democratic values, even in authoritarian regimes (Inglehart, 2003; Inglehart & Welzel, 2005; Norris, 1999; Voeten, 2016). Simply expressing support for democracy when asked, however, does not necessarily mean that citizens won’t support specific actions that erode aspects of liberal democracy. In fact, many citizens might support democracy in the abstract but reject core principals of liberal democracy, which Schedler and Sarsfield (2007) refer to as “democrats with adjectives.” Therefore, it’s best to separate one’s “explicit support for democracy,” which is operationalized by survey questions that directly ask about democracy, versus a respondent’s support for specific anti-democratic actions or potential alternatives to democratic governance. This latter concept is often measured by questions that query respondents about support for aspects of liberal democracy or specific autocratic alternatives to democracy, but importantly do not use the word “democracy” in the question (Ariely & Davidov, 2011; Magalhães, 2014).
Despite the known differences in the two concepts, much of the literature that analyzes the effect of partisanship on support for democracy typically focus on specific anti-democratic actions. For example, numerous studies show that for many Americans, partisanship can take precedence over a commitment to democratic values (Albertus & Grossman, 2021; Berliner, 2022; Carey et al., 2020; Graham & Svolik, 2020). This matches similar findings from Latin America (Carlin & Singer, 2011; Singer, 2018) and Africa (Moehler, 2009) that show that approval of the current regime can lower support for vertical and horizontal accountability measures. Additionally, Fossati et al. (2022) and Sasmaz et al. (2022) find that citizens in Indonesia and Turkey, respectively, were more likely to support anti-democratic actions if it benefited their party, which matches Mazepus and Toshkov’s (2021) finding that Europeans were more supportive of anti-democratic actions if their party was in power.
The effects of partisan-motivated reasoning seen through a “winner-loser” gap are also present in related concepts. Existing studies have shown that after elections, citizens who supported the election winners were more trustful of the country’s political institutions (see: Hooghe, 2018, pp. 625–828, for a robust discussion) and were more satisfied with the way democracy was functioning in their country (Blais et al., 2017; Loveless, 2021; Singh et al., 2012)—although Farrer and Zingher (2019) found this latter finding to only be true in Western Europe. These studies greatly expand our knowledge of how partisan interest can impact citizen preferences toward democracy and governance in their country.
The existing literature points to some existing findings that are necessary for theoretical development. These findings will be tested in the data analysis section. First, given the “almost universal lip-service” to democracy and the broad understanding that democracy has normative value, I hypothesize that “explicit support for democracy” will not be meaningfully altered by whether a citizen supports the current governing regime.
Support for the current governing regime will not be associated with meaningful changes to a citizen’s “explicit support for democracy.”
On the other hand, the above literature strongly suggests that citizens are more supportive of specific anti-democratic actions if they perceive partisan benefit from such policies. Assuming the governing regime stands to benefit from democratic erosion, this leads to a clear second hypothesis:
Support for the current governing regime will be associated with greater citizen support for specific anti-democratic actions.
These hypotheses raise a question unanswered by the existing literature: how do citizens justify their consistent “explicit support for democracy” with their more malleable support for specific anti-democratic actions? In this article, I offer a theory that explains how citizens can maintain “explicit support for democracy,” while supporting specific anti-democratic actions that can give their side a partisan advantage. I hypothesize that citizens will alter their conceptualization of democracy to fit their partisan self-interest. In other words, citizens that support the regime in power will be more likely to conceptualize democracy in terms of the majority’s right to rule, executive power, and the need for stability. Those in the opposition, however, will be more likely to consider democracy in terms of civil liberties and the rights of the opposition. This allows both sides to assert their support for democracy, despite disagreeing on specific actions or policies that are antithetical to liberal democracy. When considering König et al.’s (2022, p. 9) categories for conceptions of democracy, it’s clear how certain conceptions of democracy might be in a political party’s partisan interest. For example, a liberal conception of democracy emphasizes a strong set of civil liberties and fair elections. For the opposition, strong civil liberties, like an ability to organize, protest, and petition the government, are key to their future political goals. On the other hand, an authoritarian conception of democracy emphasizes unchecked power for certain individuals (de Regt, 2013; Kirsch & Welzel, 2019). For those supporting the regime in power, they may see partisan benefit from an unchecked executive that is free to mettle in elections, harass the opposition, or control the press. Therefore, if citizens have a strong understanding that democracy has normative value, but are free to construct their own understanding of the broad concept, they are likely to understand democracy in a way that is consistent with their own partisan interest. This leads to a third hypothesis:
Support for the current governing regime will be associated with more illiberal citizen conceptualizations of democracy.
The theory is supported by the existing literature that observes variation in how citizens conceptualize democracy. Although most global citizens conceptualize democracy in a liberal model (Canache, 2012), many scholars find that the word “democracy” can carry different connotations across countries (Alemán & Woods, 2016; Davidov et al., 2014; Schaffer, 2014) and within them (Davis et al., 2021). Notably, using WVS data, studies have shown that some citizens, especially in authoritarian countries, have poor understandings of democracy, even associating the phrase with rule by the army or religious figures (Cho, 2015; Zagrebina, 2020). In fact, these latter understandings of democracy have been called “authoritarian notions of democracy,” which often associate democracy with the obedience to wise rulers whose delegated authority can allow them to avoid constitutional checks and public accountability (Kirsch & Welzel, 2019; Kruse et al., 2019). Additionally, the literature suggests that understandings of democracy can be predictive of future political behavior. Citizens understanding democracy in an illiberal way can limit vertical accountability constraints on anti-democratic actions. If citizens do not see subtle attacks on democracy as such, then regimes eroding democracy won’t be punished for their transgressions. Albertus and Grossman (2021) find that most citizens can identify clear instances of anti-democratic transgressions, but much of modern autocratization includes actions that may appear plausibly consistent with democracy—especially for citizens who do not hold a strictly liberal conceptualization of the term (Lührmann & Lindberg, 2018). Lastly, exactly how citizens understand democracy can also impact their own political participation, like rates of voting and participation in protest (Canache, 2012; Oser & Hooghe, 2018). Despite the wide range of conceptualizations of democracy, and the importance of how citizens understand the term, the literature has largely neglected how these citizen conceptualizations can change or are driven by partisan interests. In other words, research has only considered one’s conceptualization of democracy as a long-term value, rather than a fluid attitude that citizens can update depending on their interests.
Data, Methods, and Results
To evaluate the theory, I will combine two different methods using data from the WVS and EVS. The first method is an observational study that will examine cross-sectional data from the seventh wave of the WVS and the fifth wave of the EVS, which were administered in conjunction from 2017 to 2022. While the observational study is informative, it can be difficult to make claims about attitudinal change using only cross-sectional data. Given these concerns, I supplement the observational design with a within-country variation approach that leverages multiple survey waves. For this method, I draw on data from the joint survey described above, but also the sixth wave of the WVS, which was fielded from 2010 to 2014. By using two survey waves, I can create within-country variation for the political coalitions supporting the government in power. The two methods will use the same four dependent variables and list of controls.
Dependent Variables
The operationalization of the dependent variables will be consistent across the two methods. Generally speaking, the dependent variables have been operationalized in the literature using data from the WVS. There are a few instances where I need to update the operationalization due to changes in the question wording and a few instances where I believe I can make slight innovations to better operationalize key concepts.
Explicit Support for Democracy
The first dependent variable, explicit support for democracy, measures whether citizens express support for a democratic political system and value living in a democracy when directly asked. Importantly, these questions directly use the term “democracy,” which often invokes “lip-service” support for a “motherhood” concept (Inglehart, 2003; Mattes, 2018). This concept commonly appears in the literature and scholars had coalesced around an index that combined two items from the WVS questionnaire (Ariely & Davidov, 2011; Inglehart & Welzel, 2003; Jamal & Nooruddin, 2010; Krieckhaus et al., 2014; Magalhães, 2014). The first item asks respondents to rate whether it is very good, fairly good, fairly bad, or very bad to have a democratic political system.
The second item used by these studies is a “Churchill” question that asked respondents whether they agreed that “democracy may have problems, but it is better than any other form of government.” This question was included in the third and fourth waves of the WVS but was removed in later waves. Instead, I opted to include a question that was added in the fifth, sixth, and seventh waves that asks respondents to rate on a scale from 1 to 10 how important it is for them to live in a country that is governed democratically. This question similarly measures whether a respondent values democracy when explicitly asked and has been used in prior studies as a part of indices to measure a citizen’s broader “support for democracy” (Cho, 2014; Claassen, 2020; Claassen & Magalhães, 2022; Ulbricht, 2018). To create the index, I inverted the first question so higher values equate to stronger support for democracy, scaled both questions to range from zero to three so they retain equal weight in the index, and then summed the values of the two questions for each respondent in the data. The exact question wordings for all survey items used to construct dependent variables are located in Appendix A.
Rejection of Anti-Democratic Actions
The second dependent variable, rejection of anti-democratic actions, measures whether a respondent supports general policies that are antithetical to liberal democracy, but importantly does not use the term “democracy” in the question wording. In the literature, this has been referred to as support for autocratic alternatives, authoritarian sentiment, or support for democracy “in practice.” Regardless of the exact term, studies that utilize WVS data have usually combined two questions (Inglehart & Welzel, 2003; Krieckhaus et al., 2014; Magalhães, 2014). The first asks respondents to rate whether it is very good, fairly good, fairly bad, or very bad to have a strong leader who does not have to bother with parliament and elections. The second asks respondents whether it is very good, fairly good, fairly bad, or very bad to have the army rule. I have scaled the two questions so they each range from zero to three, with higher values indicating a less favorable (and therefore more pro-democracy) response. I then summed the values for the two questions to create an index that ranges from zero to six for a respondent’s rejection of anti-democratic actions.
As an additional robustness check, I have also added an additional dependent variable to measure a general preference for authority. The survey asks each respondent to choose which of the following is most important: maintaining order in the nation; giving people more say in important government decisions; fighting rising prices; and protecting freedom of speech. The additional dependent variable, deemphasize order, is a dummy variable that takes the value of one if the respondent ranked anything other than “maintaining order in the nation” as the most important. Of the 124,208 respondents who answered the question, 76,639 answered something other than maintaining order.
Conceptualization of Democracy
Democracy is a “thick” concept that contains multiple layers and can be difficult for average citizens to define (Schaffer, 2014). Notably, König et al. (2022) identify six categories for conceptions of democracy: liberal, direct, substantive, stealth, populist, and authoritarian. Given the various dimensions, it is difficult to measure exactly what “democracy” means to everyday citizens with survey data. Some measures use an inductive approach, whereby researchers ask open-ended questions and sort the answers after the fact (Canache, 2012; Carrión, 2008).
Others have used a more deductive approach, where indicators are linked to a predefined understanding of democracy. Many scholars, for example, use a battery of questions included in the fifth, sixth, and seventh waves of the WVS to operationalize how citizens are conceptualizing democracy. In the battery, the survey gives each respondent a series of possible “characteristics” of democracy and asks them to rate, on a scale from 1 to 10, how “essential” the characteristic is to democracy. While still limited in some ways, the battery of questions allows respondents to include a range of characteristics into their understanding of democracy without needing to make tradeoffs between them (Norris, 2011; Welzel, 2011). 1 For the purposes of this article, I am mostly interested in gaining a general sense of whether the respondent has an illiberal conceptualization of democracy that prioritizes benefits for those in power or a more liberal understanding that emphasizes strong civil rights. To accomplish this task with the available data, I create an index from two survey items that represent a liberal and illiberal understanding of democracy. I classify the main “liberal” characteristic of democracy to be “civil rights protect people from state oppression” and the primary illiberal characteristic to be “people obey their rulers.” The former has been used to operationalize a liberal conception of democracy and the latter has been used to operationalize an authoritarian conception of democracy (König et al., 2022, p. 15).
I construct the index by subtracting a respondent’s answer to the illiberal characteristic of democracy from the liberal characteristic. Therefore, if a respondent believes that people obeying their rulers is more “essential” to democracy than civil rights, then the respondent would have a lower combined score on the index. The index ranges from −10 to 10. 2 Although this metric only captures a small sliver of a citizen’s broader understanding of democracy, it serves as a simple understanding of whether a respondent’s understanding of democracy ranges in a more liberal or illiberal direction.
Model and Controls
The two studies use a multilevel linear regression with random intercepts and slopes at the country level for the explanatory variable of interest—with the goal of analyzing within-country variation given the difficulty in comparing these attitudes across cultural contexts. Models that have deemphasize order as the dependent variable report the average marginal effects from a multilevel logistic regression with random intercepts and slopes at the country level for the key independent variable. The models also include a list of demographic control variables (see Solt, 2008, 2012 for a discussion). Notably, I include a variable for age and dummy variables for whether the respondent identified as male, was married, and had children. The WVS converts detailed country-specific educational attainment into an ordinal variable that indicates if the respondent has a low, medium, or high level of education. I have turned these into dummy variables and omitted the medium level of education to serve as the comparison group. I have also included a dummy variable, employed, that represents respondents who are employed full time, part time, or are self-employed. I have also included a dummy variable, unemployed, if the respondent voluntary disclosed that they were unemployed. These two employment variables are in comparison to retirees, students, housewives, and “others.” Descriptive statistics for all variables for the respective populations of the two studies are located in Appendix C. The data are also weighted at the respondent level to be nationally representative for age, sex, education, and region for respective countries, meaning that all standard errors are obtained using a robust sandwich estimator that accounts for unspecified heteroskedasticity (Dupraz, 2013).
Study 1: Observational Analysis of 74 Countries
This study uses the joint survey data from the seventh wave of the WVS and the fifth wave of the EVS. The two survey waves were administered in conjunction and interviewed 153,716 respondents across 90 countries from 2017 to 2022 (EVS/WVS, 2022). The surveys targeted a nationally representative sample of country populations and included over 231 variables. Most countries in Europe were covered by the EVS, while the WVS administered surveys in the Americas, Africa, and Asia.
To operationalize those citizens that support the current government, I first identified which political parties in each country supported the ruling government at the time of the survey. I relied on the V-Parties dataset’s “Government Support” (v2pagovsup) variable to determine if a political party supported the current government (Lindberg et al., 2022). 3 I then created a dummy variable for each respondent, partisan in power, that indicates if they expressed support for one of the political parties that V-Parties indicates was supportive of the regime in power at the time of the survey. 4 The coding scheme was irrelevant in a small handful of countries, like those that did not have a competitive party system (e.g., China, Belarus, Jordan, and Vietnam), those where the executive was not clearly affiliated with a political party (e.g., Peru and Thailand), and those where there was a power transition while the survey was in the field (Armenia, Iceland, and Malaysia). The resulting dataset included 74 countries and territories comprising 127,061 possible respondents. The list of countries included in the study, the political parties coded as partisans in power, and the rationale for excluded countries are located in Appendix B. Of the possible 127,061 respondents, 42,787 were coded as partisans in power. The number is significantly less than 50% because 34,198 citizens claimed to not support any of the major parties in their respective country.
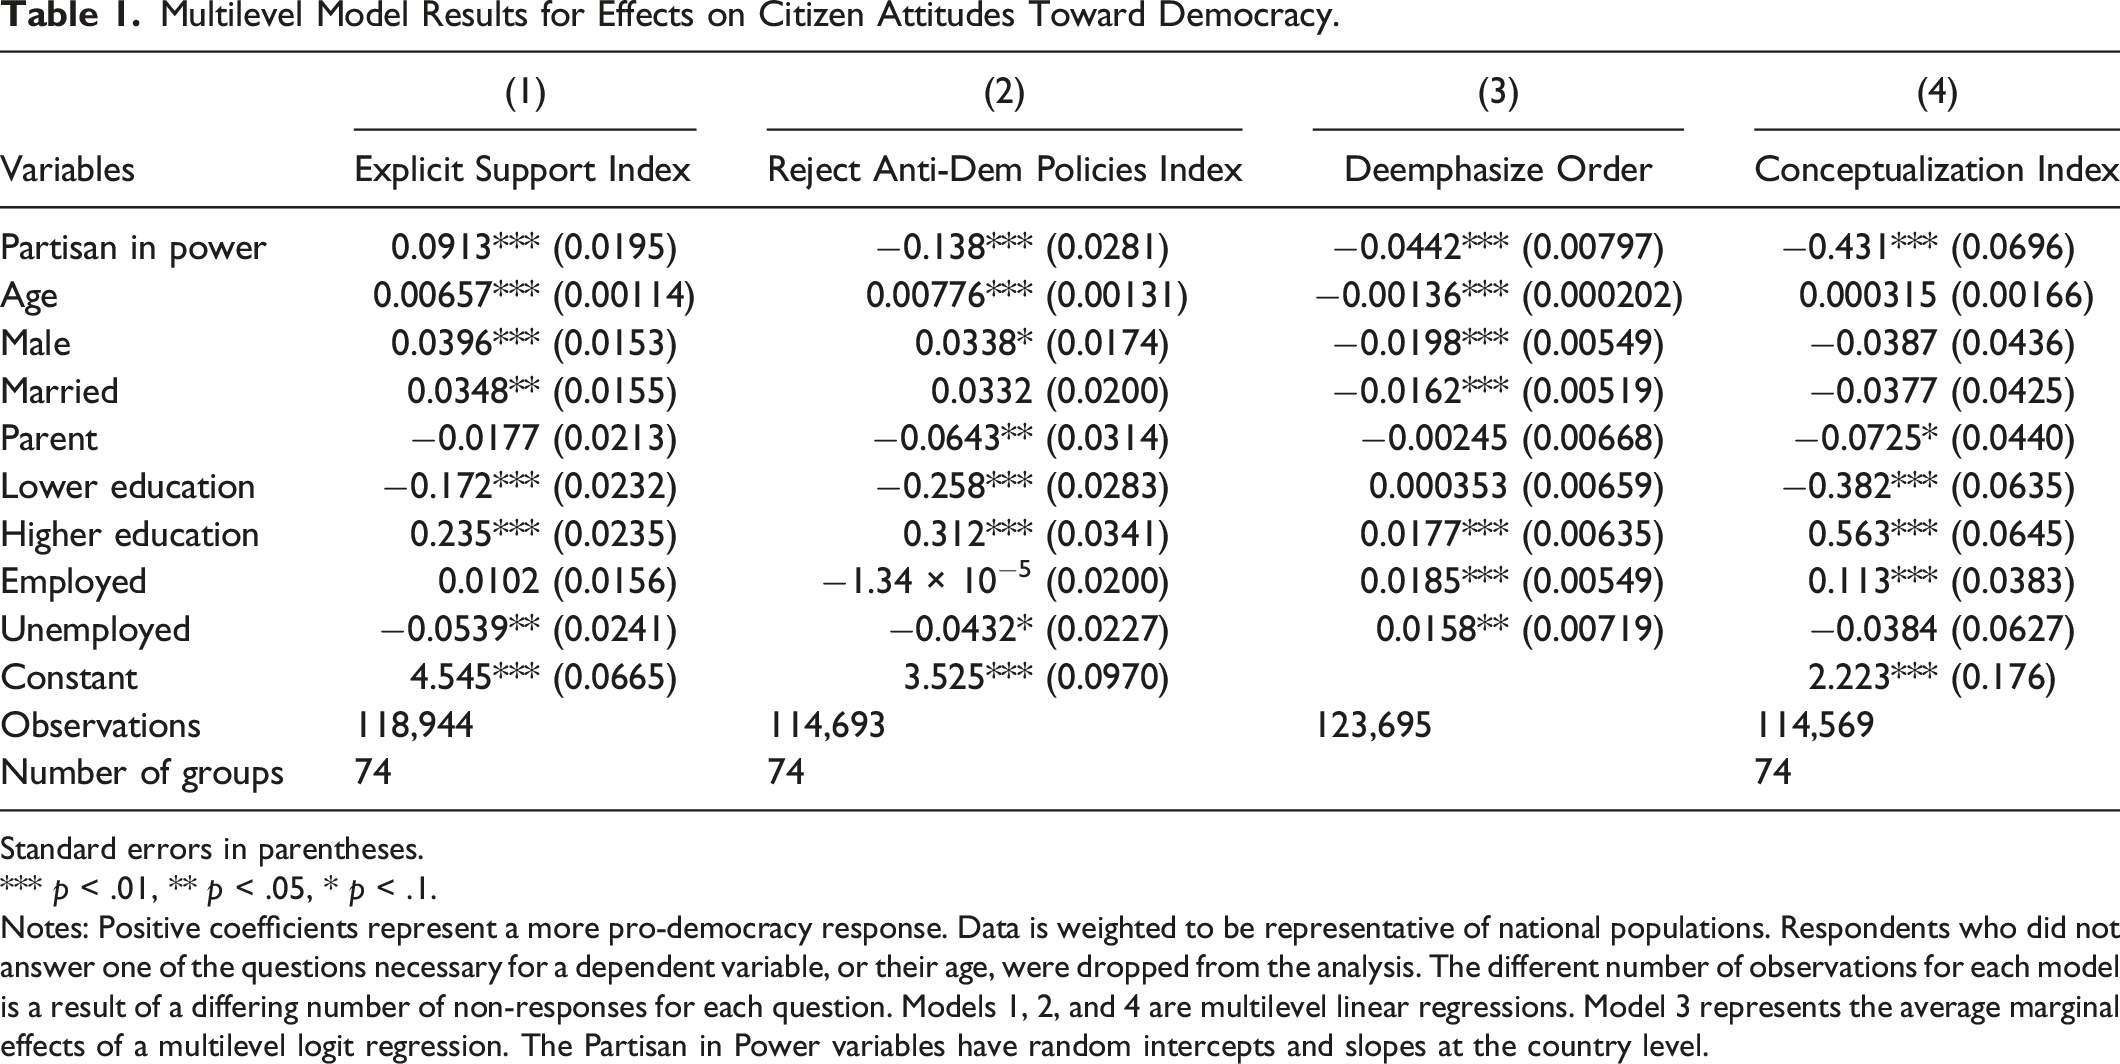
Multilevel Model Results for Effects on Citizen Attitudes Toward Democracy.
Standard errors in parentheses.
*** p < .01, ** p < .05, * p < .1.
Notes: Positive coefficients represent a more pro-democracy response. Data is weighted to be representative of national populations. Respondents who did not answer one of the questions necessary for a dependent variable, or their age, were dropped from the analysis. The different number of observations for each model is a result of a differing number of non-responses for each question. Models 1, 2, and 4 are multilevel linear regressions. Model 3 represents the average marginal effects of a multilevel logit regression. The Partisan in Power variables have random intercepts and slopes at the country level.
The second model measures the effects on a respondent’s rejection of having a strong executive and having the army takeover when the government is incompetent. Unlike the first model, partisans in power were significantly less likely to reject these specific anti-democratic actions—a finding that is strongly consistent with the existing literature (Cohen et al., 2022; Mazepus & Toshkov, 2021; Singer, 2018) and provides evidence for hypothesis 2. As an additional robustness check to measure a more general authoritarian sentiment, model 3 displays the average marginal effects of a multilevel logistic regression predicting the probability that a respondent emphasized maintaining order over other alternatives. Model 3 suggests that partisans in power were 4.4% more likely to prioritize something other than “maintaining order in the nation”—even after controlling for the slew of demographic variables and including random intercepts and slopes at the country level.
What is not explained by the literature, however, is how partisans in power might be rationalizing their increasing explicit support for democracy with their simultaneous growing support for specific anti-democratic actions. The empirical puzzle is even more noteworthy when considering there is a statistically significant and positive correlation coefficient of 0.25 between the two dependent variables in the first two models. Similarly, when examining the coefficients on the control variables in the first two models, factors that typically drive explicit support for democracy also typically drive rejection of autocratic alternatives. The lone exception is the partisan in power variable—which has a statistically significant and opposite impact on the two dependent variables in the models.
In this paper, I offer a theory that citizens will alter their conceptualization of democracy to satisfy their understanding that “democracy” has normative value with their desire for the political benefits that come from democratic erosion. As can be seen in the fourth model, on average, partisans in power held more illiberal conceptualizations of democracy by being more likely to claim that democracy requires people to obey their rulers, while deemphasizing that democracy requires the protection of civil rights. It is worth noting that a coefficient of −0.431 on a scale that ranges from −10 to 10 does not represent a monumental overhaul in one’s understanding of democracy but instead reflects a small, but significant movement toward a more illiberal conceptualization. The partisan in power variable does, however, have a notable impact when comparing it to other controls variables. Appendix D1 reports the beta coefficients for Table 1, which standardizes the impact of independent variables to compare the magnitudes of effect. As can be seen in model 4 in Appendix D1, a respondent’s political affiliation was equally impactful to determining their understanding of democracy as their level of education—as the magnitude of the beta coefficient on the partisan in power variable was about equal to the two education variables. The results suggest that partisan interests can be a significant driver of one’s conceptualization of democracy and provide strong evidence for hypothesis 3.
While the results tell a clear story when combining the 74 countries into a single set of models, the design raises an obvious question: is the story similar across the 74 countries, or is it predominantly driven by a distinct subset? To begin analyzing this question, I ran models 1, 2, and 4 for each of the individual 74 countries and I have reported the coefficients and the significance for the partisan in power variable for each country in Appendixes D.2. The results are not entirely consistent across the 74 countries and often reflect differences in the ruling party compared to the opposition. For example, in some countries, like Serbia or Finland, right-wing governing regimes were less liberal than the opposition and the partisan in power variable has a negative and statistically significant effect regardless of whether the dependent variable is a respondent’s explicit support for democracy, rejection of autocratic alternatives, or conceptualization of democracy. In the other cases, like in Slovenia, the governing coalition is more liberal than the opposition and the three coefficients are all positive and statistically significant. In all of these cases, however, and in 61 out of 74 cases, the coefficient on the partisan in power variable for predicting one’s explicit support for democracy is larger in size than the coefficient predicting one’s support for autocratic alternatives—suggesting the difference in the coefficients shown on the partisan in power variable between the first and second models in Table 1 is driven by a broad subset of the cases and not a distinct few.
When further considering how the effect may vary across countries, it might be reasonable to expect that citizens are more likely to alter their conceptualization fastest when there is more at stake. If democracy is salient and a pressing political issue, it would likely drive citizens to more quickly update their understandings of democracy to meet their more salient partisan self-interests. To test this question, I collected three characteristics for each country from V-Dem: the strength of liberal democracy (v2x_libdem), the change in the strength of liberal democracy over the last 5 years, and the degree of political polarization (v2cacamps) (Coppedge, Gerring, Knutsen, Lindberg, Teorell, Alizada et al., 2022). The values for each country in the study are displayed in Appendix D3. Andorra and Puerto Rico are not included in the V-Dem dataset and therefore were excluded from the extended analysis, which brought the total sample of countries to 72. To test if the effect is stronger for more democratic, backsliding, or more polarized societies, I have re-run the models but cut the sample of countries in half to only include the 36 least democratic countries (Appendix Table D4), the 36 most democratic countries (Appendix Table D5), the 36 countries with the greatest decline in the strength of liberal democracy in the 5 years preceding the survey (Appendix Table D6), the 36 countries with the greatest strengthening of liberal democracy in the 5 years preceding the survey (Appendix Table D7), the 36 most polarized countries (Appendix Table D8), and the 36 least polarized countries (Appendix Table D9).
The results presented in Appendix D suggest that the effects displayed in Table 1 are most prominent in countries with weak democracies, in countries experiencing greater democratic backsliding, and in countries that are polarized. In fact, the difference between the coefficients on the partisan in power variable when measuring its effect on explicit support for democracy versus rejection of autocratic alternatives is larger in weaker democracies compared to stronger democracies, in more backsliding versus less backsliding countries, and in more polarized societies. Additionally, the coefficient on the partisan in power variable is more negative when predicting the conceptualization index—implying that partisans in power have a more illiberal understanding of democracy—for weaker democracies, countries experiencing greater democratic backsliding, and more polarized societies.
It is also quite clear from Appendix D, however, that the effect still applies for stronger democracies, countries with less democratic backsliding, and less polarized societies. Even in these subsets of the data (Appendix Tables D5, D7, and D9), the coefficients on the partisan in power variable are statistically significant (at least at the 10% level) and in the same direction as those displayed in Table 1. To test a “least likely” sample of countries, I even limited the sample to the 10 countries 6 that were in the top 20 strongest democracies and the top 20 least polarized countries (Appendix Table D.10), many of which were northern European democracies. In this subsample, the coefficients lose their statistical significance, but the coefficients remain in their expected direct and are close to achieving statistical significance in the second and third models. Taken together, the expanded results suggest that the findings displayed in Table 1 are a common, albeit not completely universal, pattern that emerges across the 74 countries in the sample.
There is one additional concern with the data analysis: the WVS has a high rate of non-response, especially on more complex questions pertaining to democracy. For example, of the possible 127,061 possible respondents, 12,061 did not respond to or were not asked 7 at least one of the questions used to create the conceptualization of democracy index that serves as the dependent variable in model 4. While most studies drop these respondents, which was done in Table 1, there are often concerns that those citizens who choose not to respond are not a random sample. By dropping those respondents, the researcher can risk substantially biasing the sample (King et al., 2001). To combat these concerns and perform an additional robustness check, Table D.11 in the appendix displays models 1, 2, and 4, but with filling in the missing values for questions required for the dependent variables and a respondents age. 8 I used multivariate normal regression to impute the values, which uses an iterative Markov chain Monte Carlo method (Rubin, 1987). By using a multiple imputation technique, the analysis explicitly accounts for uncertainty associated with filling in missing data by yielding parameter estimates that average over a number of plausible replacement values (Enders, 2010, p. 189). As can be seen, the significance on the partisan in power variable is robust in all three models and the coefficients are largely unchanged.
Study 2: Changes in Views of Democracy from Before and After Changes of Power
While the observational study is informative, it can be challenging to make claims about attitudinal change from cross-sectional data. To combat this concern, I supplement the observational study with a second design that utilizes within-case variation by leveraging the joint WVS and EVS survey that was fielded from 2017 to 2022, but also the sixth wave of the WVS, which interviewed over 89,000 respondents across 60 countries from 2010 to 2014. 9
To select cases, I identify countries that were included in the sixth wave of the WVS from 2010 to 2014 and the joint survey from 2017 to 2022, but also experienced a change of power between the two survey waves. 10 To operationalize a change of power, I use the V-Dem’s variable for “election executive turnover,” which identifies country-year instances of turnover in the executive office as a result of a national election (Coppedge, Gerring, Knutsen, Lindberg, Teorell, Alizada et al., 2022). For these cases, supporters of some parties were in power during the 2010–2014 survey wave and then were in the opposition in the 2017–2022 wave. On the other hand, supporters of other parties were in the opposition and then were in power. 11 This allows for observing the difference in attitudinal change for partisans that moved into power between the survey waves and partisans that were removed from power.
The case selection strategy yielded 14 countries, each with one survey wave from the sixth wave of the WVS (2010–2014) and one survey wave from the joint WVS and EVS survey (2017–2022). The list of countries and the years of their respective survey waves are listed in Appendix B. From the 28 individual survey waves, there are 38,990 possible respondents. Of those, 10,503 supported political parties that were in the opposition in the first survey wave but won the election between the two surveys. These respondents are given a value of one on the dummy variable Rose to Power, while all other respondents receive a zero. Of the remaining respondents, 10,628 supported parties that were in power in the first wave but lost the election between survey waves. These respondents are given a value of one on the dummy variable Fell from Power. For example, in the United States, Republican partisans in the 2011 WVS survey and the 2017 WVS survey will receive the value of one for Rose to Power because the party won the 2016 presidential election, while Democrats will receive the value of one for Fell from Power.
To execute the within-case variation design, I also include the variable Partisan In Power, which takes the value of one if the respondent was in a party that fell from power and the survey was in the first wave for the respective country, or if the respondent supported a party that rose to power and the survey was in the second wave for the respective country. Following the example from the United States, Republican partisans in the 2017 survey and Democrats in the 2011 survey would be labeled as Partisan In Power. Therefore, the variables Rose to Power and Fell from Power control for ideological differences between the coalitions. Their coefficients are in comparison to respondents who did not claim to support a party or claimed to a support a party that was never in government, while Partisan In Power captures the differential effect of the party being in control of government irrespective of that party’s ideological disposition across the two survey waves. The dependent variable for the four models, the list of controls, and the use of a multilevel modeling with random country intercepts and slopes on the key independent variable are the same as the first study.
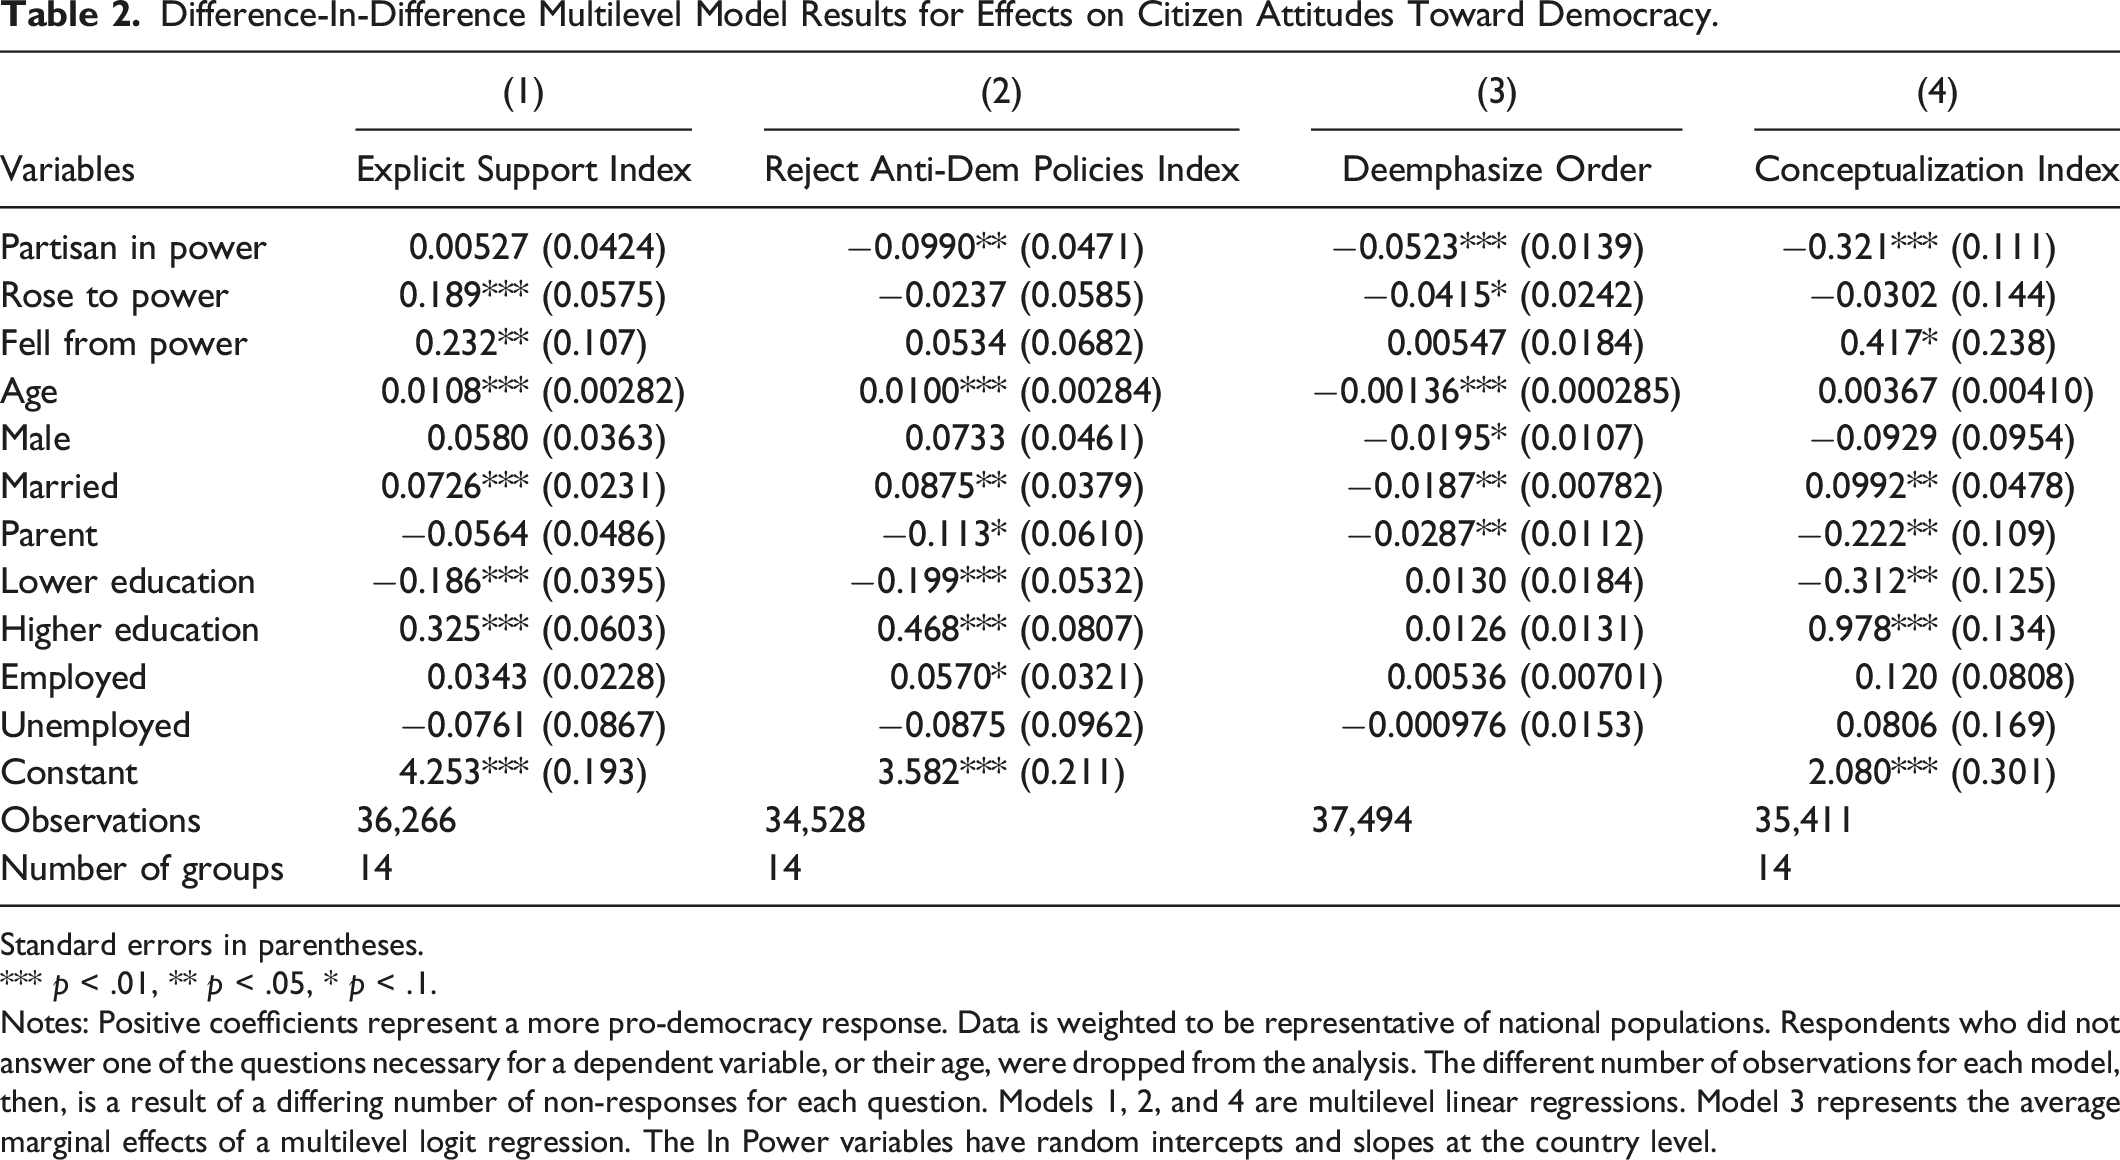
Difference-In-Difference Multilevel Model Results for Effects on Citizen Attitudes Toward Democracy.
Standard errors in parentheses.
*** p < .01, ** p < .05, * p < .1.
Notes: Positive coefficients represent a more pro-democracy response. Data is weighted to be representative of national populations. Respondents who did not answer one of the questions necessary for a dependent variable, or their age, were dropped from the analysis. The different number of observations for each model, then, is a result of a differing number of non-responses for each question. Models 1, 2, and 4 are multilevel linear regressions. Model 3 represents the average marginal effects of a multilevel logit regression. The In Power variables have random intercepts and slopes at the country level.
When considering how partisans in power might justify their continued explicit support for democracy with their growing comfort with specific anti-democratic actions, the fourth model suggests that when citizens support a party in power, their conceptualization of democracy begins to deemphasize civil rights and emphasize obeying authority. The negative coefficient in model 4 is slightly smaller in the second study but provides additional evidence for hypothesis 3 while using intra-country variation for the party in power. The beta coefficients and the robustness check that imputes missing values are located in Appendix E.1 and E.3, respectively.
Like the first study, when examining the individual countries more closely, there are some deviant cases and there is not a single homogenous story that explains the results in Table 2, but rather some general trends that are common and contribute to the findings. To examine the individual cases more closely, Table E.2 in the appendix displays the average score on the conceptualization index (the dependent variable in model 4) by country and coalition. Additionally, Figure 1 reflects the coefficients and the 95% confidence intervals for the partisan in power variable that results when running model 4 for each of the 14 cases.
12
As is clear in Figure 1, there are two cases where the coalition rising to power actually changes their conception of democracy to be more liberal vis-à-vis the coalition falling from power—a trend that is contrary to the overall findings and hypothesis 3. A brief examination of the two cases, New Zealand and Argentina, does reveal some limitations of the design. Coefficients on partisan in power variable predicting conceptualization index for individual cases.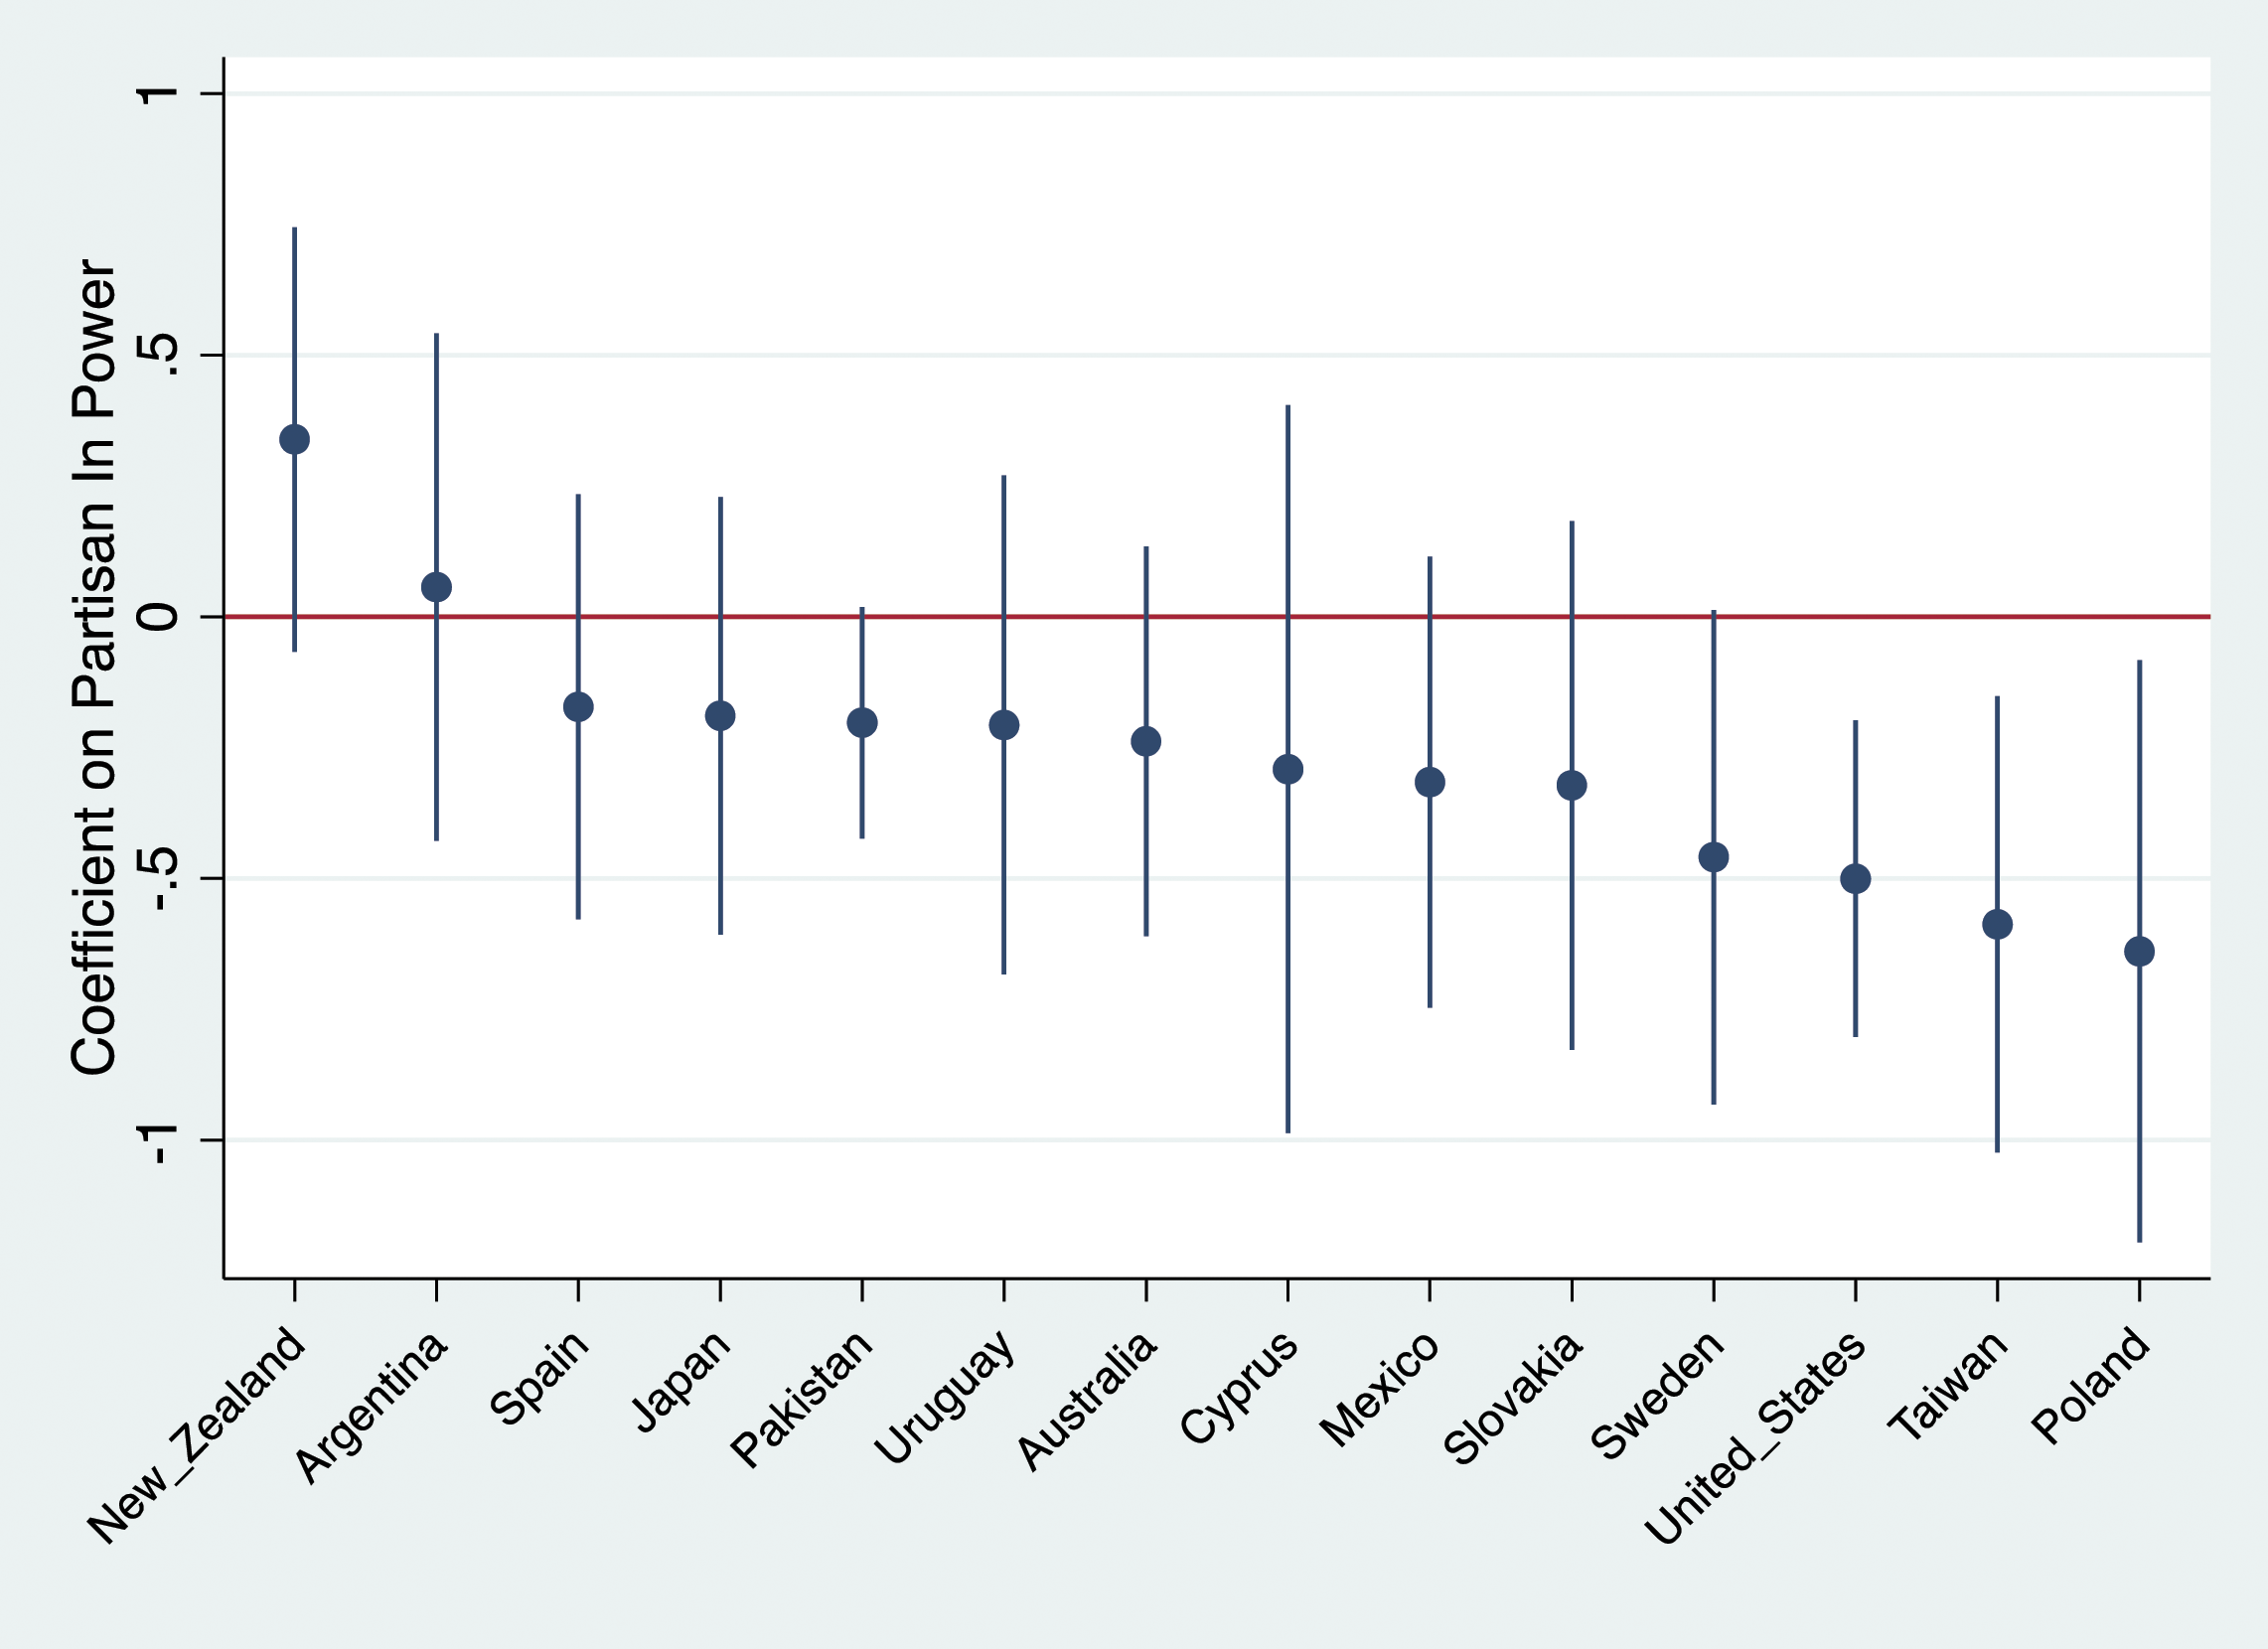
The first and largest deviant case is New Zealand. In the sixth wave of the WVS in 2011, the New Zealand National Party was in control of government. In 2017, an odd Labor-led coalition, which included the further left Green party and the nationalist New Zealand First party, ousted the long-serving center-right New Zealand National Party. Of the respondents coded as rose to power in the two waves of the survey, 76% said they support the Labor Party—compared to 7% who said they would support New Zealand First and 17% who said they would support the Greens. As can be seen in Appendixes E.1, those that rose to power in New Zealand had a significantly more liberal understanding of democracy in the second wave. So why would supporters of a coalition comprised primarily of a center-left and a far-left party have a more liberal conceptualization of democracy relative to their partisan opponents in 2020 than 2011 despite their potential partisan interest in understanding democracy through a lens of authority?
My hypothesis is that the extremely salient trend of the rise of nationalist right, especially in the English-speaking world, during this time caused the center-left parties in New Zealand to rally to liberal democracy—despite their immediate partisan interests. In fact, the leader of the Labor Party, Jacinda Ardern, has criticized Donald Trump (Oppenheim, 2017) and sharply rejected the global populist trend (Graham-McLay, 2020). Therefore, when it comes to emphasizing civil rights as a critical component of democracy, their response to international trends superseded their own partisan interest. This points to a potential limitation of the within-case design: it assumes there are no time trends (aside from the change of power) that could have a heterogenous impact on the different coalitions.
In Argentina, 13 the variable Rose to Power takes the value of one if a respondent said they would support the Together for Change coalition, the Radical Civic Union party, or the Republican Proposal Party. In 2013, during the sixth wave of the WVS, the coalition was weak and only 85 respondents out of a possible 1030 claimed to support one of the three parties. In the years following, however, the general dissatisfaction with the ruling Peronist regime united the opposition behind Mauricio Macri, the center-right mayor of Buenos Aires, who offered a nonconfrontational campaign that emphasized an anti-populist message focused on economic liberalization and social tolerance (Romero & Gilbert, 2015; Schiumerini, 2019). Therefore, in 2017 during the seventh wave of the WVS, the coalition led by Macri was no longer a minor force in Argentine politics like it was in 2013. As a result, in the 2017 survey wave, 306 out of the 1003 respondents claimed to support Together for Change, Radical Civic Union, or Republican Proposal.
Therefore, it is clear that the coalition greatly expanded from 2013 to 2017—with a major concentration of that expansion taking place in the wealthier urban sections of the country (Calvo, 2019). As a result, it’s possible that rather than the coalition’s supporters gaining a more liberal conceptualization of democracy vis-à-vis their fellow citizens, the coalition grew to include some of the country’s most liberal citizens. This points out a second limitation of the within-case variation design: when attributing the coefficients to attitudinal change, it assumes that the coalitions are constant between the two survey waves—even if some of these effects can be mitigated by including control variables like education.
While it might be true that the global trends impacting New Zealand or the coalition shifts impacting the Argentine case might be having the opposite effect on right-wing parties that rose to power in Poland and the United States—cases with strong negative coefficients—it is notable that 12 out of the 14 cases had negative coefficients on the Partisan In Power variable, with many of them achieving or approaching statistical significance. An examination of the individual cases in Appendixes E.2 emphasizes the heterogeneity across countries, but the finding observed in model 4 remains constant across most cases. For example, many of the cases are examples of center-right or right-wing coalitions defeating center-left or left-wing coalitions. Interestingly, there is some variation in the movement between coalitions in their conceptualization of democracy. As can be seen in the Appendixes E.2, the negative coefficient displayed in Figure 1 for Australia is driven by a center-right coalition made up of the Liberal and Nationalist parties rising to power and having a less liberal conception of democracy, while the center-left Labor party falling out of power takes a more liberal conception of democracy.
In other instances of right-wing parties moving into power, however, the negative coefficient is driven more strongly by one of the coalitions. In the United States, the coefficient is mostly driven by the right-wing Republican party taking power and having a more illiberal conception of democracy, while in Poland, the coefficient is mostly driven by the moderate Civic Platform coalition leaving power and having a more liberal conception. In Japan, the center-right party taking power actually has a more liberal conception of democracy after taking power, but their more liberal shift is significantly smaller than their center-left rivals who were moving out of power. Despite the heterogeneity in the specific stories for each country, in 12 out of the 14 cases, coalitions rising to power had understandings of democracy that became more illiberal relative to their partisan opponents when moving from the survey wave before the election to the wave after the election. It should also be noted that this story also applies in Pakistan, Mexico, and Taiwan—countries where the political cleavages vary from the left-right divide commonly seen in Europe, the United States, Australia, and New Zealand.
Overall, while the second study does have some limitations and is not infallible for an individual case, by averaging the effect across the 14 cases, it provides additional evidence that supplements the first study. Taken together, the two studies show a clear pattern that citizens will adjust their conceptualization of democracy, even slightly, to accommodate their partisan interest.
Discussion
The findings from the two studies tell a similar story. First, a citizen’s preferred political party holding power does not reduce their support for democracy when directly asked. If anything, the results from the first study suggest that these citizens might be slightly more likely to express support for democracy. On the other hand, models 2 and 3 in the 2 studies strongly suggest that these same citizens will be more likely to support specific anti-democratic actions or alternatives to democracy, like increasing the power of the executive to bypass the legislature. These findings are largely consistent with the existing literature but raise an unanswered question: how do people justify their continued “lip service” to democracy with their increased support for anti-democratic actions? The results from the fourth model in the two studies suggest that these citizens are more likely to hold an illiberal conceptualization of democracy. In other words, when democratic principles stand in the way of potential partisan gain, citizens update their definition of democracy to fit their partisan interests.
While the effects in the regression output regarding a citizen’s conception of democracy are somewhat small, the operationalizations are blunt and meant for a generalized cross-national study. It’s easy to see how these findings can be applied to a more specific context. For example, Hungarian citizens who support the current authoritarian-populist regime (Norris & Inglehart, 2019) may believe that limiting the free press is crucial to Hungarian democracy. Similarly, Republican partisans in the United States may view strict restrictions on voting access as a necessary component of protecting American democracy. When considering this is the contextualized application of these findings, it’s unsurprising that these subtle changes in understandings of democracy might only marginally register on a question asking respondents to rate the essentialness to democracy of “people obeying their rulers” or “civil rights protect people from state oppression.” Future research on this subject should examine how a citizen’s conceptualization of democracy is specifically molded by politically salient issues in their home countries. Certainly, more specific and contextualized survey data that can operationalize all of König et al.’s (2022) categories for conceptions of democracy, or even interview-based research, can help add significant details to the broad-based findings in this article.
Additionally, I do not believe these findings are contradictory to Graham and Svolik’s (2020) assertion that most citizens are able to identify clear anti-democratic transgressions. Instead, the two findings, taken together, create a clearer story that can help understand why many leaders attack democracy behind a “democratic façade” (Lührmann & Lindberg, 2018). If most citizens have normative commitments to democracy and can identify clear democratic transgressions, but also if democracy is a “thick” concept that can be molded to fit partisan interests, then rational leaders trying to stay in power would identify policy options that offer partisan benefit, but are also plausibly consistent with democracy. The result, then, is that whether the action actually transgresses the tenets of democracy becomes just another political issue that partisans bicker over.
The findings have broad implications for scholars and pro-democracy stakeholders. First, the findings suggest that scholars should consider one’s understanding of democracy to be as much a fluid political attitude as it is a core long-term value. It is important to note, however, that it’s unlikely that citizens will drastically change their definitions of democracy overnight, which is supported by the smaller coefficients in this article. With that said, even small changes in one’s conceptualization can be impactful. Importantly, much of modern democratic erosion takes place behind a “democratic façade” (Lührmann & Lindberg, 2018), so backsliding often plausibly appears as normal democratic procedure. Therefore, only minor changes in one’s conceptualization of democracy can be the difference in viewing these actions as violations of democracy or not.
Second, the findings reinforce that researchers should take caution when asking respondents about “democracy.” Not only does the term carry different meanings across different contexts, but the meanings can fluctuate for individual citizens depending on their immediate partisan interests. This is not to say that the questions are not valuable and cannot be informative, but it’s critical that scholars are cautious when interpreting findings that use these questions.
Third, scholars should pay special attention to the relationship between citizen interests and the understanding of core political concepts. This paper shows that partisan interests can impact how citizens understand democracy, but can reinforcing the meaning of concepts also shape policy preferences? For example, does being exposed to messaging about how a specific policy is undemocratic reduce support for that policy? In other words, how robust is the normative value of the term “democracy” and can shaping understandings of democracy actually shape policy preferences? While this paper shows that interests can shape the understanding of concepts, can the causal arrow go the other way as well?
Lastly, pro-democracy stakeholders should know that getting citizens to value “democracy” broadly is not enough to advance pro-democracy positions. General calls for “defending democracy” may sound attractive and even poll well among the mass public, but they are not a specific and clear call to action. Instead, stakeholders need to shine a light on democratic erosion and clearly articulate why they are in violation of the core tenets of democracy. By making a more direct case, pro-democracy stakeholders could prevent citizens from seeing democratic erosion as consistent with democracy when it suits their partisan interests. In other words, fighting for democracy may be more about defining democracy than by getting citizens to defend the idea.
Supplemental Material
Supplemental Material - What Kind of Democracy Do We All Support? How Partisan Interest Impacts a Citizen’s Conceptualization of Democracy
Supplemental Material for What Kind of Democracy Do We All Support? How Partisan Interest Impacts a Citizen’s Conceptualization of Democracy by James D. Bryan in Comparative Political Studies
Footnotes
Acknowledgments
I would like to thank Carl LeVan, Agustina Giraudy, Austin Hart, Ian Reynolds, Anastassiya Perevezentseva, Hatem Zayed, Ozan Cetin, and Grace Benson for their consistent feedback and support in developing the project, as well as the editors and three excellent peer reviewers for their time and attention. I would also like to thank attendants at the Midwest Political Science Association Annual Conference and the American University Tri-School Conference for their thoughtful comments and feedback, especially David Barker, Katsunori Seki, Valentin Daur, and Seongjoon Ahn.
Declaration of Conflicting Interests
The author declared no potential conflicts of interest with respect to the research, authorship, and/or publication of this article.
Funding
The author received no financial support for the research, authorship, and/or publication of this article.
Data Availability Statement
Replication materials can be found at Bryan (2022). Underlying data for the replication materials from the World Values and European Values Study can be found at https://www.gesis.org/en/services/finding-and-accessing-data/european-values-study/integrated-values-surveys-ivs-1981-2021. Underlying data from V-DEM can be found at: ![]()
Supplemental Material
Supplemental material for this article is available online.
Notes
Author Biography
References
Supplementary Material
Please find the following supplemental material available below.
For Open Access articles published under a Creative Commons License, all supplemental material carries the same license as the article it is associated with.
For non-Open Access articles published, all supplemental material carries a non-exclusive license, and permission requests for re-use of supplemental material or any part of supplemental material shall be sent directly to the copyright owner as specified in the copyright notice associated with the article.