
Abstract
A large literature shows that election outcomes affect satisfaction with democracy by separating voters into winners and losers. Moving beyond victory and defeat, I theorize that elections themselves boost satisfaction due to the psychosocial, representational, and economic utility they provide to citizens. I test my expectations across three separate studies. These leverage survey fieldwork that was interrupted by elections in several countries (Study 1), cross-national panel survey data (Study 2), and a survey experiment (Study 3). The timing of survey interviews in each study helps isolate the impact of elections from that of winning and losing in the sense of a voter’s party entering government. Results together show that elections increase satisfaction with democracy, and an investigation of the theoretical mechanisms suggests that this relationship is driven by the representational and economic benefits of elections.
Elections are the keystone of the democratic process. They underscore the social and political freedoms inherent to democracy and provide citizens with the opportunity to hold politicians to account and contribute to the policymaking process. While a large literature makes it clear that elections can foster a gap in satisfaction with democracy (SWD) between those who voted for winners and losers (e.g., Anderson & Guillory, 1997; Blais & Gélineau, 2007; Conroy-Krutz & Kerr, 2015; Singh et al., 2012), I argue that the effect of elections on SWD is not alone driven by the content of votes. The mere act of voting has psychosocial consequences that increase SWD. Further, free and fair elections engender SWD independent from voting by affirming the representational role of electoral democracy, which becomes even more pronounced as politicians engage in programmatic vote-seeking. Lastly, elections enhance SWD because they align with periods of economic growth and the distribution of targeted benefits. Elections’ ability to engender SWD matters because it is linked to salving outcomes, such as a disinclination toward extremist parties (e.g., Arzheimer, 2009; König, 2022), contentment with democratic institutions (e.g., Donovan & Karp, 2006), and support for democracy as a system of government (e.g., Auerbach & Petrova, 2022).
The correlation between elections and SWD has been recognized, most recently and most thoroughly by Higashijima and Kerr (2023). However, existing theories do not provide a comprehensive treatment of the elements connecting elections and democratic satisfaction. At the same time, existing empirical work does not tease out elections’ direct causal impact independent of pre-election phenomena, such as campaigns, or post-election occurrences, such as the separation of voters into winners and losers.
I propose a theory that explores why and how elections enhance satisfaction, considering their psychosocial, representational, and economic ramifications. The research designs I use to test this theory are built to identify elections’ unique causal effects on SWD. In Study 1, I conduct one of the largest-ever interrupted survey analyses, exploiting quasi-random variation in exposure to parliamentary elections in eight developed democracies. In Study 2, I assess within-person changes in SWD with panel data collected before and after elections in five democracies, again belonging to the developed world. In Study 3, I use a survey experiment that leverages the 2023 Finnish parliamentary election.
Results from all three studies provide evidence of a positive causal effect of elections on SWD. An investigation of the theoretical mechanisms behind this relationship suggests that it is driven by elections’ representational and economic benefits. Further, in each study, I identify the effect of elections on satisfaction before governments were formed, which helps isolate elections’ influence from that of one’s party entering or being excluded from government—the most common measure of winning and losing. Results of follow-up analyses are also consistent with the claim that elections’ effects on SWD operate independent of winning and losing, even when considering the success or failure of a voter’s party in terms of vote and seat shares. In the conclusion, I discuss the policy implications of my findings and their potential to generalize to low-integrity elections and to the Global South.
Relevant Literature
Scholarly debate over the conceptual meaning of satisfaction with democracy spans nearly three decades. SWD is today largely seen as a mid-level indicator falling between diffuse support for different regime types or abstract institutions and specific support for particular political actors or bodies. Whatever it may tap into, SWD predicts an array of important outcomes, as outlined above. Researchers have accordingly invested significant effort into identifying its economic and political foundations (for a review, see Singh & Mayne, 2023). The overwhelming majority of literature examining the electoral bases of SWD focuses on winning and losing, and it is well-established that electoral victory is a key correlate of satisfaction (examples include, inter alia, Anderson & Guillory, 1997; Blais & Gélineau, 2007; Conroy-Krutz & Kerr, 2015; Singh et al., 2012).
Given the well-established winner-loser gap in satisfaction with democracy, it is provocative that there is no direct link between voters’ perceptions of having won and SWD (Daoust et al., 2023). Such a pattern is possible because elections can increase SWD independent of the substance of one’s ballot. Consistent with this, studies leveraging panel data often show that, even among electoral losers, SWD stays constant or increases after elections (cf. Blais et al., 2017; Beaudonnet et al., 2014; Esaiasson, 2011; Kölln & Aarts, 2021; Kostelka & Blais, 2018; Plescia et al., 2021; Singh et al., 2012; van der Meer & Steenvoorden, 2018; for an exception, see Hansen et al., 2019).
Further, there is broad evidence of a general association between elections and satisfaction with democracy. Satisfaction in the public rose following the 1981 French presidential election (Kornberg & Clarke, 1992, p. 225), the 1997 Canadian federal election (Blais & Gélineau, 2007), the 1999 New Zealand general election (Banducci & Karp, 2003; Karp & Bowler, 2001), the 2012 Dutch general election (van der Meer & Steenvoorden, 2018, appendix C), and the 2017 German federal election (Fahey et al., 2022). SWD also tends to be relatively high in surveys held during election years in Sweden (Strömbäck & Johansson, 2007) and throughout Europe (Clarke et al., 1993; Quaranta & Martini, 2016). Esaiasson (2011) uncovers a rise in SWD after a handful of elections in developed democracies, and Han and Chang (2016, pp. 95–96) find that, across countries, SWD declines with the amount of time since elections, a result that is echoed by Higashijima and Kerr (2023) and Loveless (2021).
Following from the established association between elections and SWD, I advance my first hypothesis:
Elections increase satisfaction with democracy.
Why Elections Increase Satisfaction with Democracy
Several of the studies demonstrating a correlation between elections and SWD provide explanations for this connection. Blais and Gélineau (2007, p. 426) highlight that elections can foster perceptions of regime legitimacy, and Banducci and Karp (2003, pp. 444–447) suggest that such perceptions are driven by campaigns and media coverage. Strömbäck and Johansson (2007, pp. 81–82) discuss the potential for elections to induce news consumption, political interest, and political trust, and van der Meer and Steenvoorden (2018, p. 41) emphasize their ability to underscore accountability and the peaceful transfer of power. Higashijima and Kerr (2023, pp. 713–714) argue that elections provide citizens with opportunities to engage with politicians, which can increase political information, while at the same time strengthening citizens’ bargaining power with the state and political elites.
These studies highlight distinct mechanisms linking elections to democratic satisfaction. In doing so, they point to a broad, multifaceted relationship that warrants a more integrated theoretical approach. Here, I advance a theory explaining why and how elections enhance satisfaction that takes into account their psychosocial, representational, and economic effects.
The act of casting a ballot brings about psychosocial benefits which, in turn, strengthen demo- cratic attitudes. Psychologically, individuals care about the way decisions are made (Frey et al., 2004), and involvement in meaningful tasks can induce positive moods (Erber & Tesser, 1992). It thus follows that democratic citizens should be more optimistic when they take part in the governing process, and evidence suggests this is the case. Tavits (2008) and Weitz-Shapiro and Winters (2011) find that voters report being happier than abstainers, while Bruter and Harrison (2020, chps. 3 and 7) detail that the emotions experienced by voters are generally positively valenced.
Socially, turning out can induce SWD by engendering interpersonal connections. Polling places can be festive, and taking part in an election gives one the chance to chat with others who are contributing to the democratic process. This type of constructive interpersonal political communication has a positive association with perceptions of democratic performance (Desmet et al., 2015; Hoerner & Hobolt, 2020). Even standing in polling queues, if not unreasonably long, can generate positive emotions (Bruter & Harrison, 2020, chp. 3).
Considering the psychosocial benefits of participating in elections, I put forth my second hypothesis:
Elections increase satisfaction with democracy through the psychosocial benefits associated with the act of voting.
Elections, when free and fair, also serve as a palpable reminder that, at the societal level, citizens have the right to pick their own leader. As Clarke et al. (1993, p. 1002) note, “free, competitive elections are a key symbol of the bona fides of democratic political systems and a central organizing feature of their political life.” Similarly, Bruter and Harrison (2020, p. 38) recognize that elections can “validate the premise of representation. . . and make citizens feel they control their political system.”
Elections can also increase SWD through their programmatic and material payoffs. As Higashijima and Kerr (2023, p. 714) point out, politicians work harder to connect with voters at election time, making it easier for citizens to garner programmatic and particularistic benefits. On the programmatic side, representatives are more responsive to citizens’ policy desires at election time (Ahuja, 1994). This boost in substantive representation helps explain why citizens are especially confident in politicians and democratic institutions shortly after elections are held (e.g., Holmberg, 1999; Hooghe & Stiers, 2016). Indeed, democratic representation itself fosters satisfaction with democracy (e.g., Kölln & Aarts, 2021; Mayne & Hakhverdian, 2017).
Taking into account elections’ symbolic and concrete influences on representation, I advance my third hypothesis:
Elections increase satisfaction with democracy by underscoring democratic representation.
On the particularistic side, citizens are especially attentive to election-year performance (e.g., Healy & Lenz, 2014), and, recognizing this, leaders tend to deliver goods and strategically target spending when they must face voters (e.g., Baskaran et al., 2015; Cole, 2009). Incumbents also stimulate markets at election time, thus creating favorable macroeconomic conditions. While clientelistic vote seeking and political budget cycles are most pronounced in developing countries (Brender & Drazen, 2005; Hicken, 2011), they also feature in advanced democracies (de Haan & Klomp, 2013; Dipoppa & Grossman, 2020).
The economic upturns that coincide with elections help explain why people are especially optimistic about their country’s economic future shortly after elections are held (Adam, 2014). This optimism can, in turn, improve democratic satisfaction (e.g., Christmann, 2018; Quaranta & Martini, 2016), as can strong macroeconomic conditions themselves (e.g., Claassen & Magalhães, 2022; Clarke et al., 1993). As Krishnarajan (2023) argues, national elections that coincide with periods of economic growth make citizens tend to feel more politically efficacious and attached to democracy, and such attitudes can improve SWD.
Considering the material payoffs and economic upswings that coincide with elections, I advance my final hypothesis:
Elections increase satisfaction with democracy because they provide economic benefits.
Identifying the causal impact of elections on SWD is challenging, as satisfaction could itself cause participation (cf. Ezrow & Xezonakis, 2016; Karp & Milazzo, 2015; but see Kostelka & Blais, 2018). SWD may even precede the advent of elections, given that incumbents are known to hold contests when conditions are favorable (e.g., Balke, 1990; Smith, 2004) and that pre-election campaigns may engender satisfaction (Higashijima & Kerr, 2023). At the same time, there are likely many unobservable factors related to participation, election timing, and SWD. To overcome these challenges, as well as to establish the breadth of the effect of elections on SWD, I conduct three separate studies in various countries: a quasi-experiment; a panel analysis; and a randomized experiment.
Study 1: Public Opinion Surveys Interrupted by Elections
In this study, I estimate the effect of elections on SWD by leveraging the quasi-random timing of survey fieldwork relative to elections. Recent research uses interrupted survey designs in a variety of settings (for a review, see Muñoz et al., 2020, p. 187). In some cases, the interrupting event is something unpredictable, such as a terror attack (e.g., Ferrín et al, 2020; Singh & Tir, 2023). In others, it is more foreseeable, such as a visit by a foreign leader (e.g., Goldsmith et al., 2021).
Elections fall into the latter group of more predictable events, as even unscheduled contests are announced ahead of time. As such, it may be incautious to assume that respondents interviewed just before and just after the election are, on average, equal on unobservables. Instead, foreseeable events during fieldwork produce a setup similar to a typical regression discontinuity (RD) design, in which a “discriminating variable” determines whether an observation is treated. Here, the discriminating variable is time, and treatment occurs if the respondent was interviewed on or after election day.
Some assumptions must be met for valid causal identification using this setup. First, per the excludability assumption, the timing of interviews cannot affect the outcome through other channels. Here, salient events coterminous with elections need to be ruled out. In Section 13 of the Supplemental Material, I summarize trending Google searches in each country as the elections approach. Election-related terms always land in the top five trending searches, and there is no evidence of public attention being directed toward contemporaneous events that could alter SWD. Excludability would also be violated if SWD affects election timing. As discussed above, leaders may schedule elections on the basis of public attitudes, at least in parliamentary systems. However, the narrowness of the fieldwork windows I leverage rules out the possibility that endogenous election timing drives my results. An empirical investigation of the excludability assumption, discussed below, helps establish its veracity.
As pre-election campaigns may themselves engender satisfaction (Higashijima & Kerr, 2023), SWD could drift upward in the period before the contest. This does not invalidate my RD design, which, per the continuity assumption, requires that the trend in mean SWD would not display a discontinuity among treated or untreated respondents at the time of an election were it not to have taken place (Cattaneo et al., 2019; Cuesta & Imai, 2016). However, a violation of the continuity assumption could arise due to the tendency of many survey organizations to employ nonrandom fieldwork strategies, such as oversampling a particular demographic group toward the end of a fieldwork period. I discuss investigations of the continuity assumption below and in Sections 1 and 2 of the Supplemental Material.
I gathered information on the timing of elections and fieldwork in every survey conducted by each of the following organizations from their inception through 2020: the Eurobarometer (Standard); the European Social Survey (ESS); the European Values Study/World Values Survey (EVS/WVS); and the International Social Survey Programme (ISSP). 1 My search involved comparing the fieldwork dates of nearly 3000 surveys to the electoral calendars of over 50 countries across 45 years.
I retained any survey with fieldwork that overlapped a parliamentary election and for which data were available on respondents’ interview dates and level of satisfaction with democracy. As no ISSP surveys are punctuated by national elections, all are excluded from the analysis data. While two Austrian surveys in the EVS/WVS were bisected by elections, held in 1999 and 2008, I exclude these in the main analyses because the EVS/WVS asks about satisfaction with “the political system.” As shown below, results are robust to the inclusion of the EVS/WVS surveys.
The countries and years in my sample in which intervening elections were held are: Croatia (2011); Greece (1989, 2004, and 2009); Ireland (2007); Italy (1992); the Netherlands (2006 and 2012); Portugal (2005, 2015, and 2019); Spain (1989 and 2004); and Sweden (2014 and 2018). In a review of these elections, I found no evidence of unusual contentiousness or seriously disputed results. Further, each country-year is rated above 0.90 on V-Dem’s Clean Elections Index (Coppedge et al., 2021), which ranges from 0 to 1. Details of the survey fieldwork dates and interrupting elections are provided in Section 12 of the Supplemental Material. Ultimately, my analysis data include nearly 17,000 people across these 15 interrupted surveys and eight countries, with 53% of respondents interviewed before election day and 47% interviewed on election day or afterward.
The focus on parliamentary elections helps provide a test of my theoretical prediction that elections increase satisfaction net of winning and losing. The RD setup identifies the immediate impact of elections, and it took several days, weeks, or even months after each intervening election in my sample for a governing coalition to be formed. 2 Thus, any post-election changes in SWD could not be due to electoral victory or defeat in the sense of one’s preferred party joining or being excluded from the governing executive.
It remains a definite possibility that effects are influenced by expectations about the coalition’s composition or observations of how one’s party performed relative to others. I cannot test this in Study 1 given that the surveys do not include questions about vote choice in the intervening elections. In any case, responses to vote choice items, or other items capturing party preferences, would be gauged post-treatment, and conditioning on these would likely introduce bias (Montgomery et al., 2018). In Studies 2 and 3, I am able to condition effects on pre-treatment measures of vote choice and preferences.
The categories provided to survey respondents in the SWD items vary across organizations. To harmonize responses, I code them so that higher values always indicate more satisfaction. I then transform the resulting variable to range from 0 to 10 within survey programs. 3 To enhance precision and help account for potential covariate imbalances, I adjust for gender, age, education, and income. See Section 14.1 of the Supplemental Material for more information on the survey items and their coding.
Most closely related to the goals of this study, Anderson et al. (2005, pp. 52–56) compare Eurobarometer survey responses before and after five elections. However, Anderson et al. compare respondents in separate Eurobarometer surveys, rather than those within the same survey. This means different respondents are interviewed before and after elections and are separated by several months, which makes it difficult to attribute differences in SWD to elections alone.
Results
In Figure 1, I plot the relationship between SWD and time over the range of fieldwork for the surveys in my sample. While SWD trends upward in the immediate pre- and post-election periods, there is also a clear discontinuity: SWD sharply increases on election day before continuing its upward trajectory. Trend in satisfaction with democracy around election day. Note. The dashed black curve tracks predicted values from a locally smoothed polynomial regression fit to observations recorded before election day. The solid red curve tracks predicted values from a locally smoothed polynomial regression fit to observations recorded on and after election day. Shaded areas indicate 95% confidence intervals. The number of observations is 16,671, with 8,882 recorded before election day and 7,789 on or after election day. Data are from the ESS and the Eurobarometer.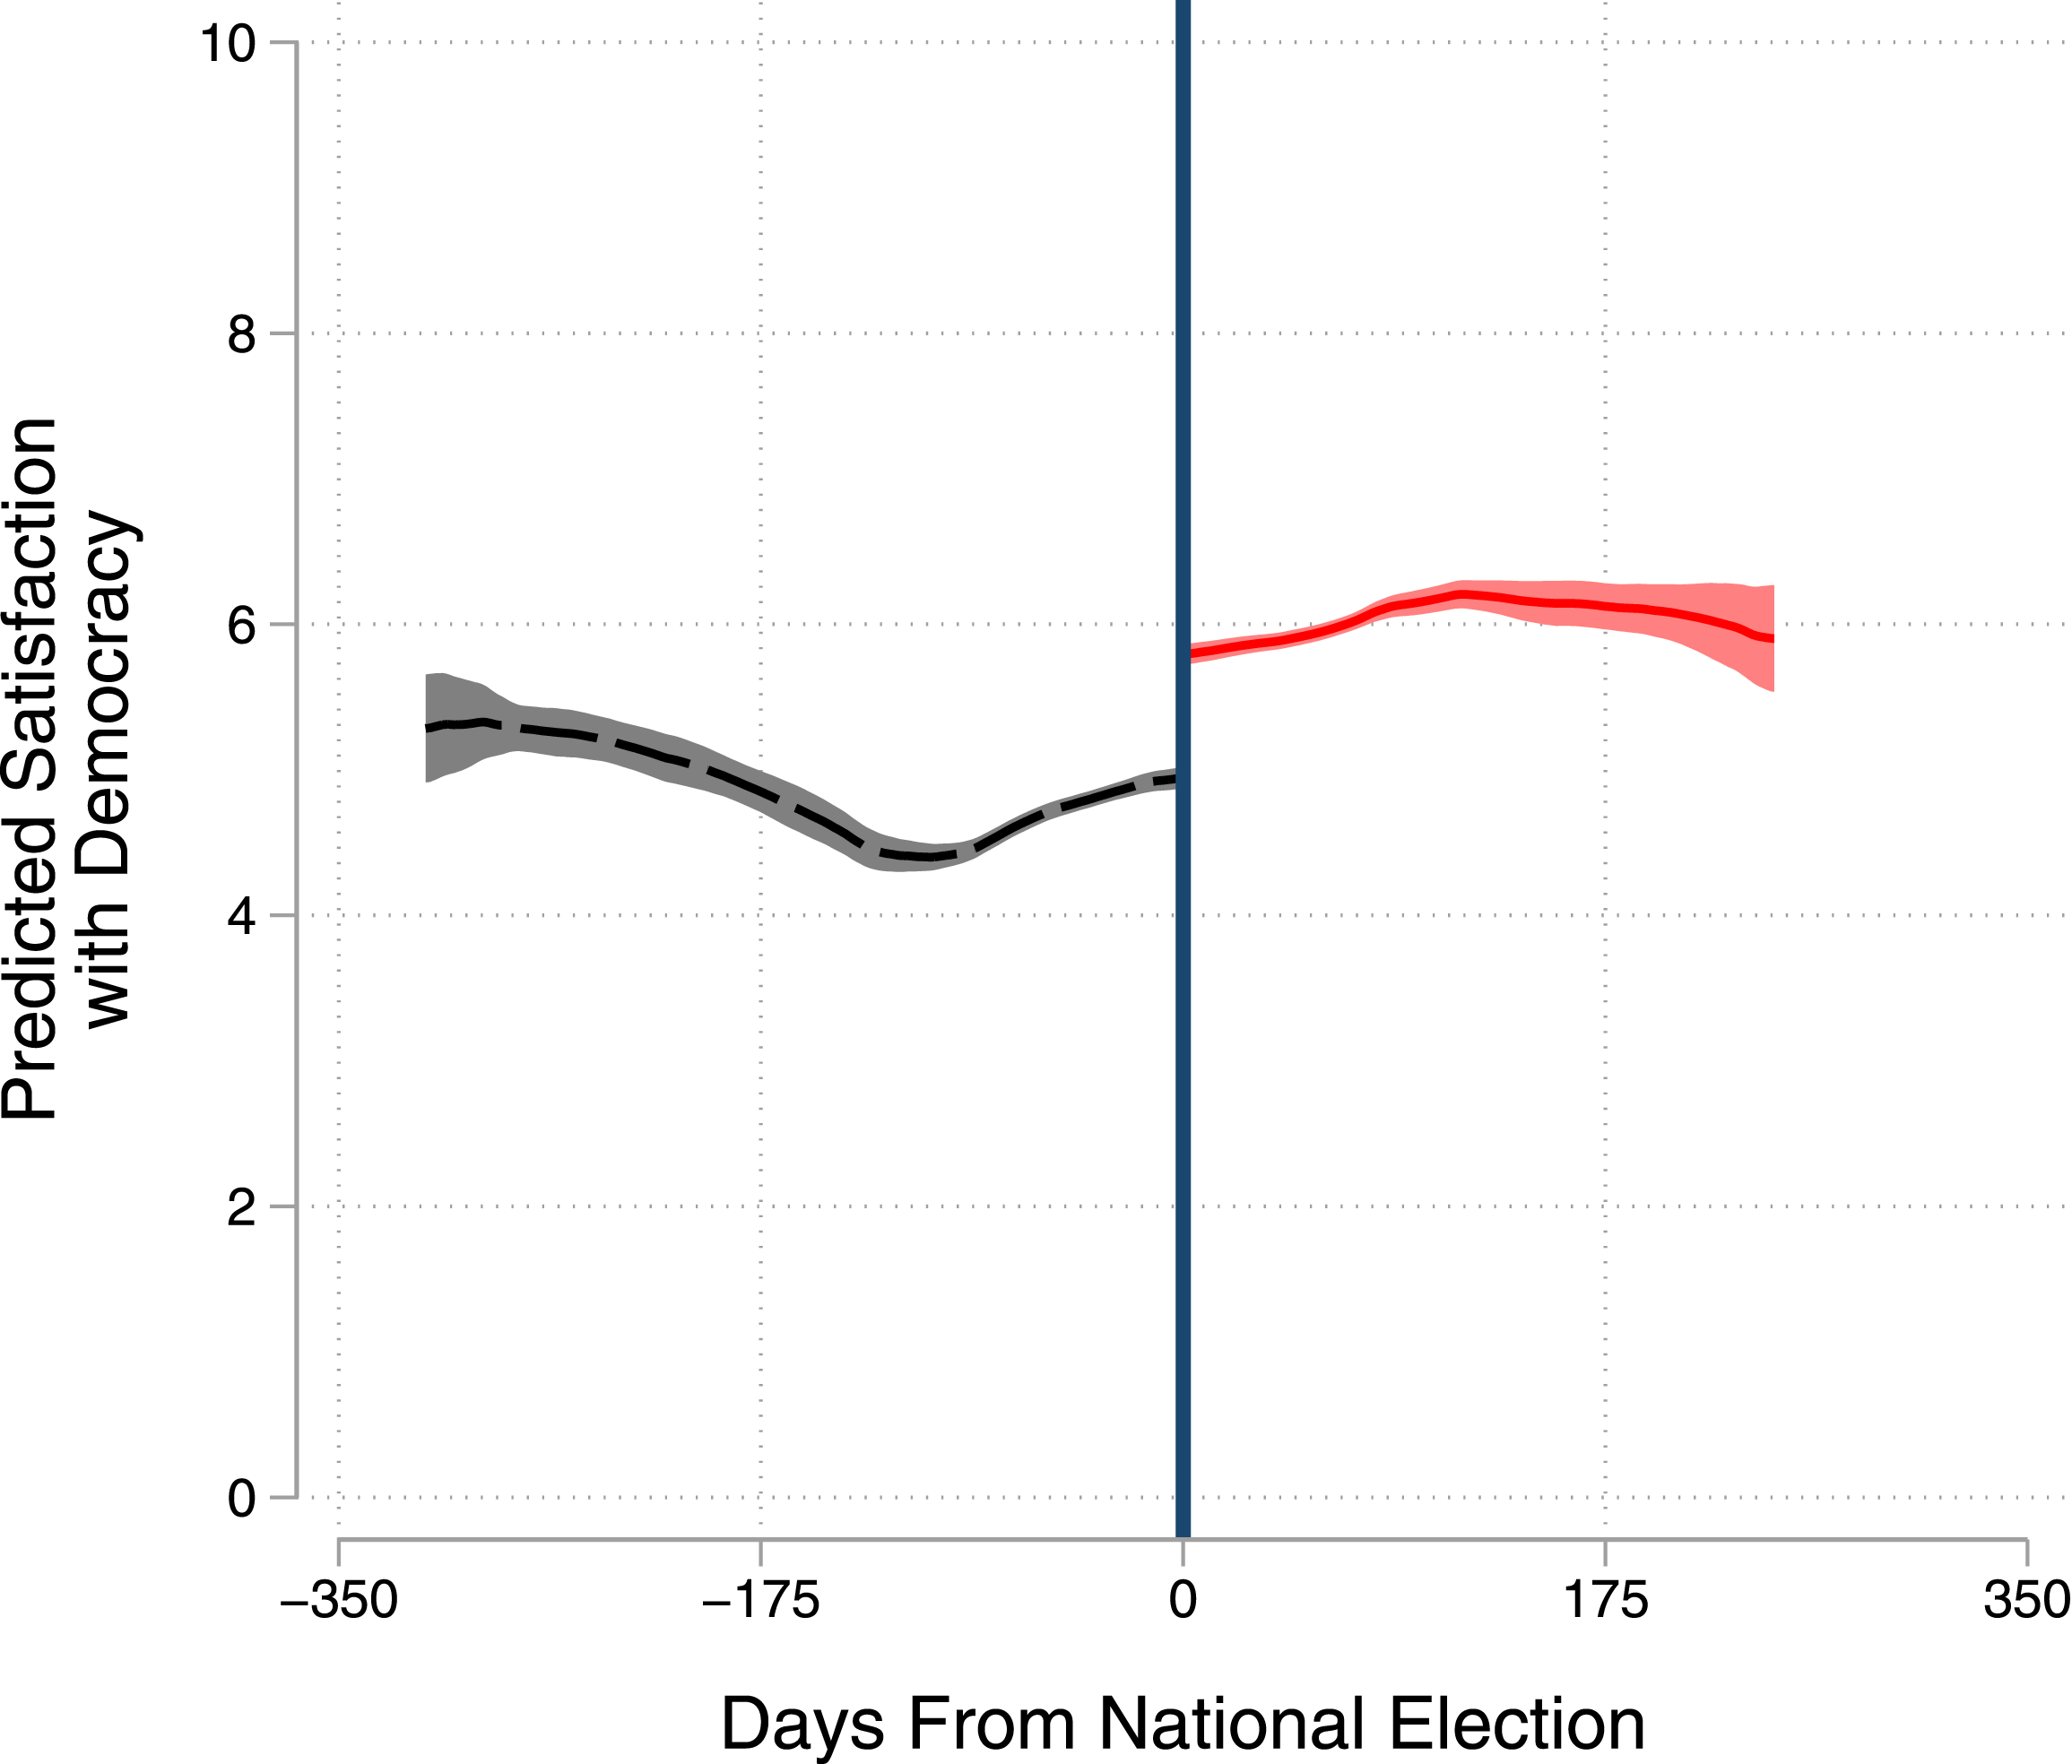
To more precisely estimate the impact of elections, I turn to the RD approach. In my main model, I regress SWD on the number of days from the election in interaction with a dummy variable that differentiates survey interviews that took place before the election from those held on or after election day.
4
I include survey-level fixed effects, meaning estimates are derived on the basis of within-survey variation and are not confounded by contextual factors, such as electoral rules or political culture. Results, shown at the top of Figure 2, verify a precisely estimated upward impact of elections on SWD (about 0.23 units, with a two-sided p-value <.001). Thus, Hypothesis 1, which expects that elections increase SWD, is supported. In Section 9.1 of the Supplemental Material, I show that the effect of elections on SWD does not vary with demographic characteristics. Estimated effects of elections on satisfaction with democracy, interrupted surveys. Note. Estimates are from regression discontinuity models that include a linear trend of the number of days from the election on either side of election day. The models include survey-level fixed effects. All estimates are adjusted for gender, age, education, and income. Horizontal lines indicate 95% confidence intervals. Satisfaction with democracy is scaled to range from 0 to 10 in all models. The number of observations is: main model, 16,671; model with other countries, 21,868; using the Foa et al. (2020) measure, 14,684; with EVS/WVS included, 19,067; with control for contacts, 12,413. Data are from the ESS, the Eurobarometer, and the EVS/WVS.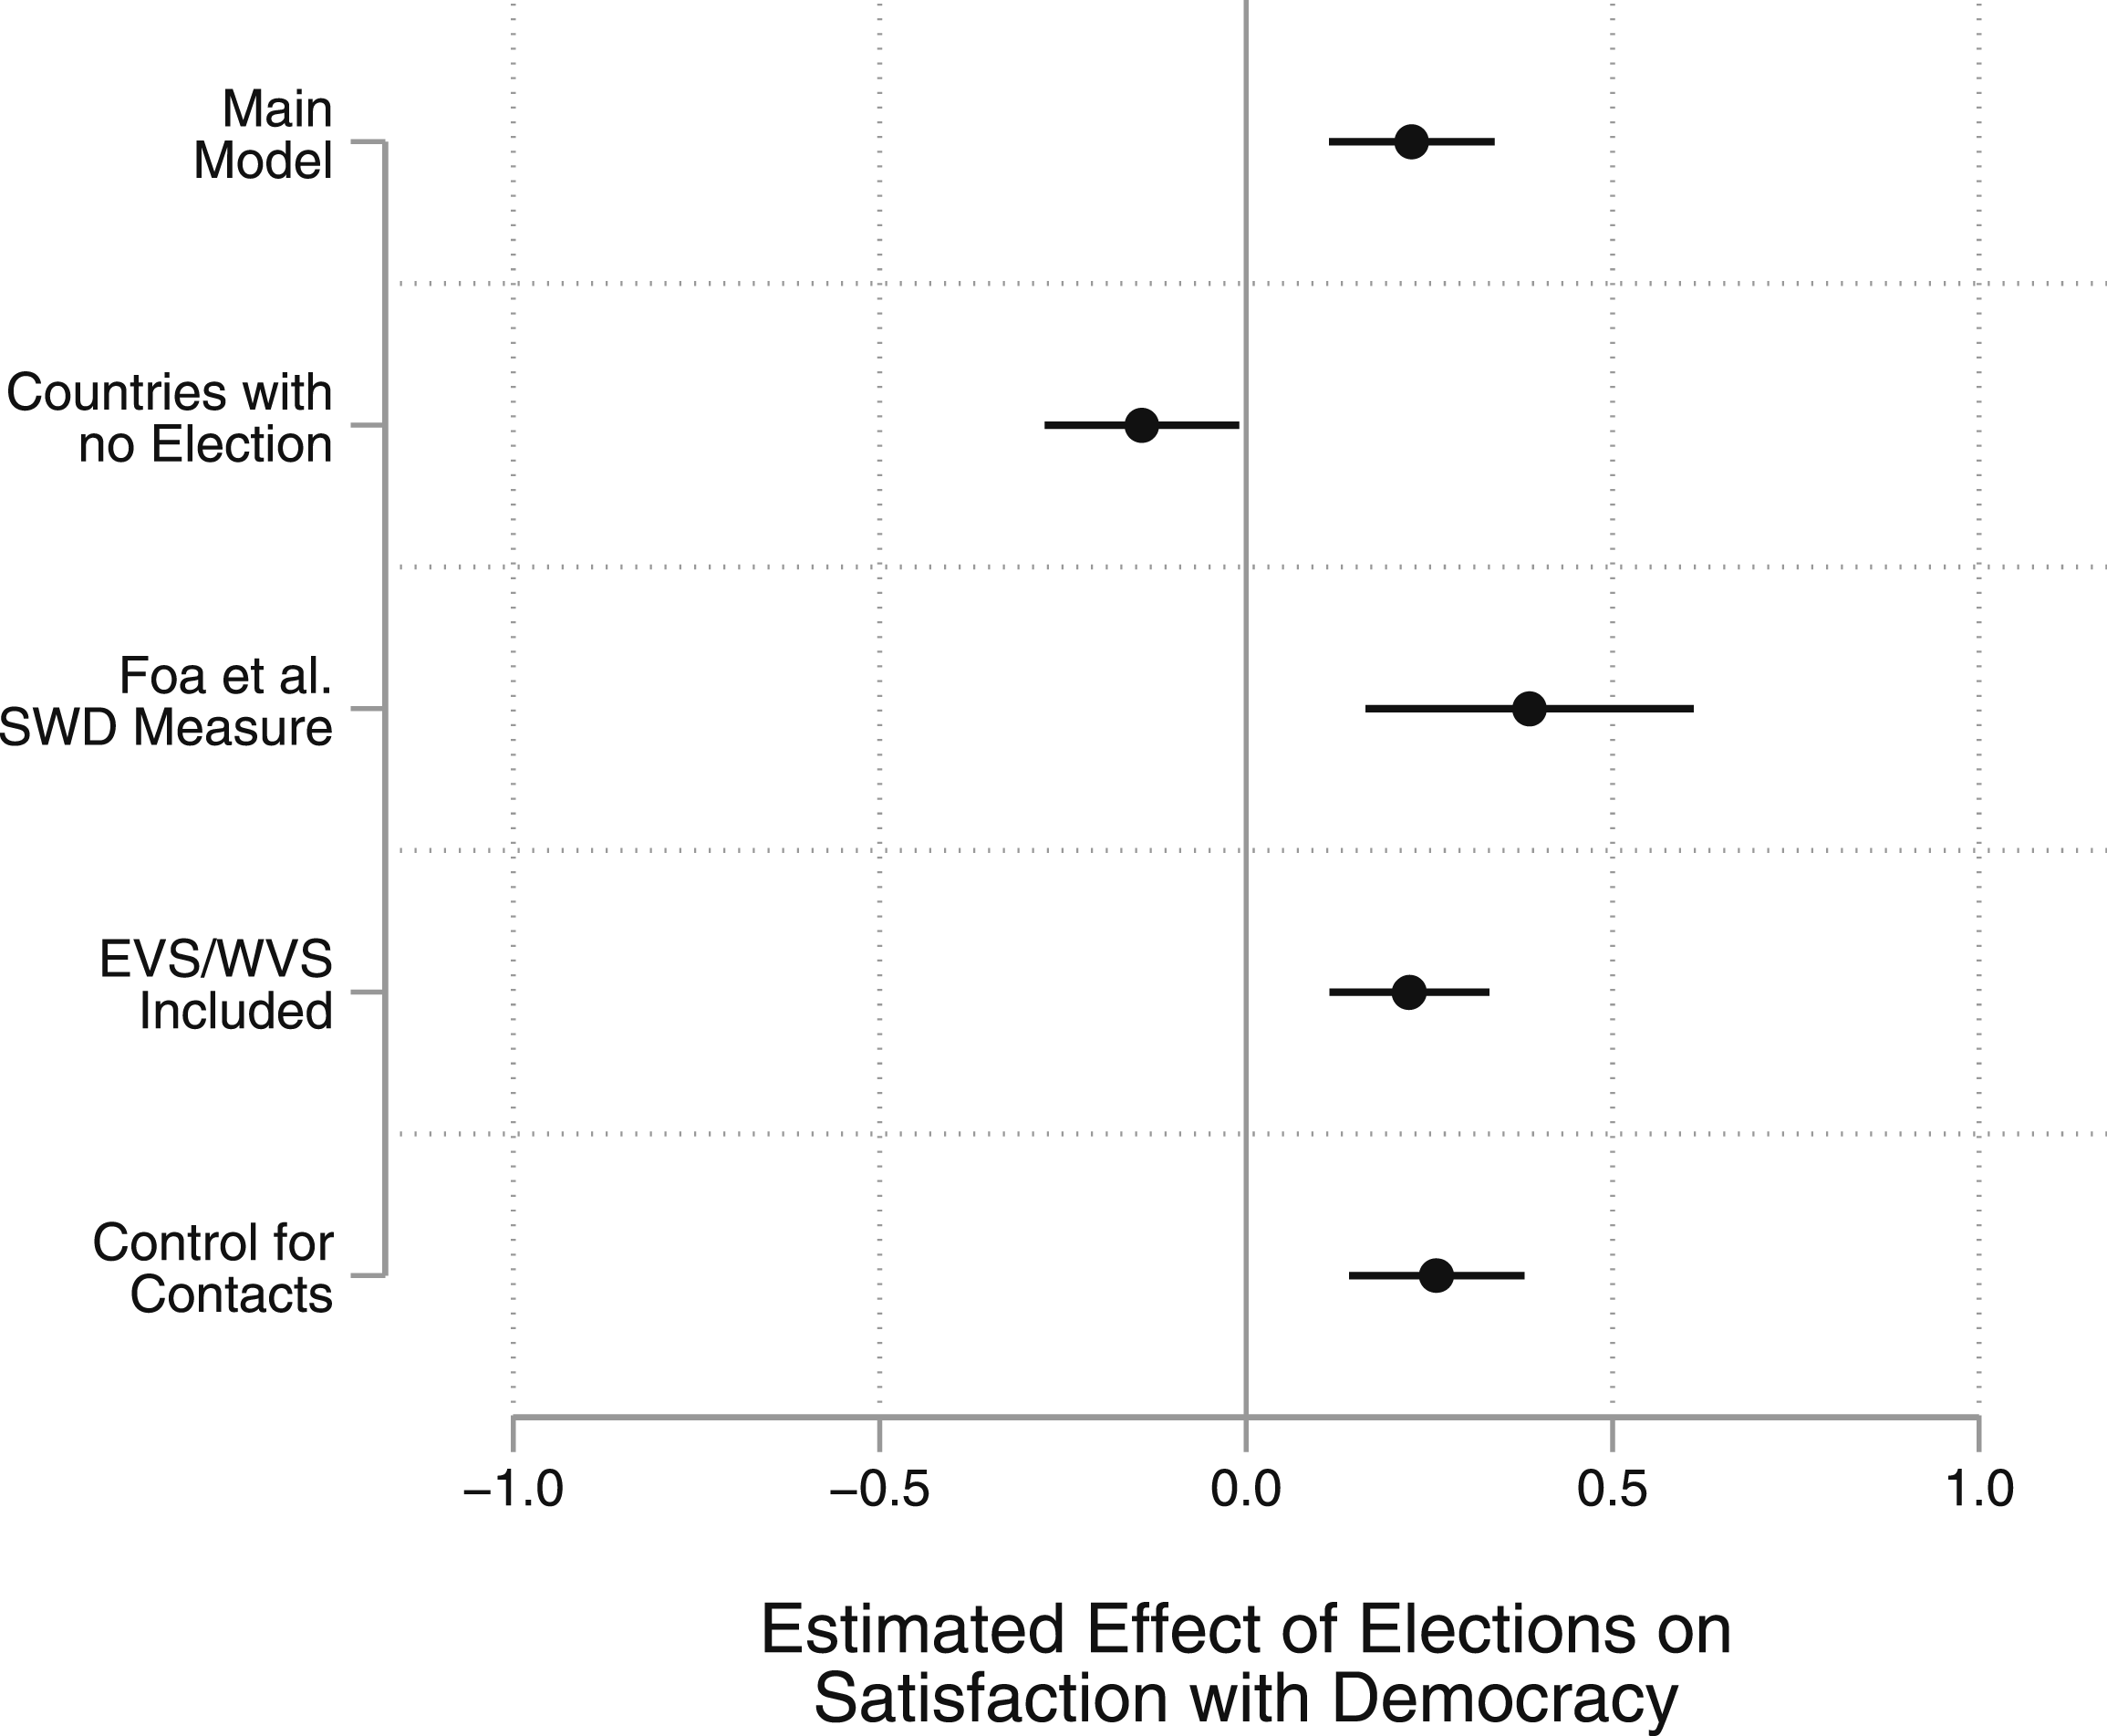
The excludability assumption requires that elections themselves, and not coterminous events, are responsible for differences in SWD. The continuity assumption requires the trend in mean SWD would not display an upward discontinuity at the time of an election were it not to have taken place. Salient events that are coincidental with elections could render both assumptions unrealistic.
To investigate the excludability and continuity assumptions’ veracity, I estimate the impact of intervening elections on SWD in countries in which surveys were not actually interrupted. I gather as reference cases all surveys included in a wave with a single election-interrupted survey. I then pretend that each reference survey was interrupted by an election that took place on the same day as the true intervening election. I estimate the effect of these imagined elections on SWD using the same RD approach employed in my main model. If something of international relevance other than the election were responsible for boosting SWD, this should be detectable in the reference countries. As shown in the second row of Figure 2, there is no evidence for this. The estimated impact of elections in one country on SWD in others is negative, 5 which provides strong evidence against the claim that something concurrent with elections caused SWD to jump.
I also check whether my method of measuring satisfaction across surveys might drive results. Foa et al. (2020) create a harmonization scheme through which they dichotomize responses to SWD questions to foster equivalence across countries and survey programs. Their resulting measure codes dissatisfied and satisfied respondents as 0 and 1, respectively. I employ Foa et al.’s scheme and multiply the resulting binary variable by ten to put it on the same 0 to 10 scale as my main measure. As shown in the third row of Figure 2, the estimate of elections on SWD is substantively similar with the use of the Foa et al. measure.
The estimated effects may appear numerically small. However, they herald a politically important change. The binary Foa et al. (2020) measure, which classifies respondents as satisfied or not, helps illustrate this. When it is used as the dependent variable, the estimated impact of elections on the probability of being satisfied with democracy is just under 0.04. This implies, for example, a net increase of about two million satisfied people in a country of 50 million.
In measuring SWD, I only consider survey items that ask directly about the way democracy works. As discussed above, this led me to drop the surveys of the EVS and WVS, which ask about satisfaction with the “political system.” In the fourth row of Figure 2, I show the estimated impact of elections when I forgo this exclusion. The estimate is very similar to that of the main model.
Next, I account for bias that might arise from respondents’ influence over the dates on which their survey interviews were conducted. All respondents in my sample were interviewed face-to-face or by telephone, and the modal interview took place at first contact. However, many respondents took the opportunity to schedule their interview dates, either in response to a preliminary communication or following an attempted interview. Further, as Muñoz et al. (2020, pp. 192–193) note, in general harder-to-reach respondents are more likely to be interviewed in later stages of fieldwork. Individuals who choose to schedule interviews further from their initial contact date, as well as those who are generally harder to reach, are also more likely to be interviewed after elections.
If the number of efforts it took for a respondent to be interviewed correlates with their propensity to be satisfied with democracy in a way that is not captured with the demographic controls, this could introduce a violation of the continuity assumption and thus bias the estimate of the impact of elections on SWD. To investigate this possibility, I take advantage of the “contact forms” data provided by the ESS. With this, I create a measure of the number of contacts made by ESS enumerators before an interview was successfully conducted. There is no relationship between SWD and the number of contacts. 6 Further, as shown at the bottom of Figure 2, the inclusion of the number of contacts as a control variable has little impact on the estimated effect of elections on SWD. Moreover, in Section 1 of the Supplemental Material, I show that there is little difference in the demographic profile of individuals interviewed before and after elections.
Frese (forthcoming) highlights the importance of investigating the unique effects of distinct interrupting events. In Section 3 of the Supplemental Material, I examine whether effects vary over elections. The estimated effect of intervening elections on SWD is always positive, and it is routinely statistically different from zero.
In Section 4 of the Supplemental Material, I examine the consequences of using smaller windows of observations around election day rather than the full dataset. Results show that my conclusions are not driven by the range of included survey dates. In Section 5, I examine whether “placebo” survey interruptions that took place at various dates nearby the true election alter SWD. None of the placebo interruptions have a detectable positive effect on satisfaction.
Hypotheses 2, 3, and 4 make predictions about the pathways through which elections increase SWD. Per Hypothesis 2, they generate positive emotions and attitudes stemming from the opportunity to make one’s voice heard and the interpersonal communication that comes along with turning out. Per Hypothesis 3, they validate and enhance the representational function of electoral democracy, which is further highlighted as politicians ramp up programmatic vote seeking. And, per Hypothesis 4, they correspond with economic upswings and the provision of particularistic benefits.
Survey items available in the Eurobarometer and ESS allow me to test each of these hypotheses within this study. To probe the psychosocial mechanism of Hypothesis 2, I rely on items asking about happiness and trust in others. Expressed happiness should reveal any positive emotions driven by elections and voting. And, as interpersonal contact promotes interpersonal trust (e.g., Tanis & Postmes, 2005; Yao et al., 2017), connections made at the polling place should increase trust in others. To investigate the representational mechanism of Hypothesis 3, I use a pair of items on trust in parties and politicians. Political representation has a robust upward impact on political trust (e.g., Dunn, 2012, 2015; Goubin, 2020; Torcal, 2014). As such, any representational benefits of elections and electoral participation should be reflected by post-election increases in perceived trustworthiness of these key political actors. Finally, to test Hypothesis 4’s mechanism of economic benefits, I use an item that asks directly about satisfaction with the economy and an item on satisfaction with the governing executive, itself a function of economic conditions (e.g., Healy et al., 2017; Singer, 2011) and any particularistic benefits that may improve one’s personal economic situation (Bueno, 2017; Tilley et al., 2018). See Section 14.1 of the Supplemental Material for more information on these items and their coding.
I assess the impact of elections on each of these items using the same RD approach as above. Results are shown in Figure 3. First, both happiness and interpersonal trust are unmoved by elections. Thus, contra Hypothesis 2, evidence suggests that the psychosocial mechanism is not at play. Second, elections increase trust in parties and politicians. In line with Hypothesis 3, it seems that democratic representation—a forerunner of political trust—indeed helps drive the link between elections and SWD. Lastly, elections cause an increase in satisfaction with the economy. Moreover, satisfaction with government—a known result of strong economic performance and particularistic benefits—is boosted by elections. These patterns are consistent with the mechanism of bolstered economic conditions put forth in Hypothesis 4. Estimated effects of elections on potential mechanisms, interrupted surveys. Note. Estimates are from regression discontinuity models in which the dependent variable is that identified on the vertical axis. Each model includes a linear trend of the number of days from the election on either side of election day and survey-level fixed effects. All estimates are adjusted for gender, age, education, and income. Horizontal lines indicate 95% confidence intervals. The dependent variable is scaled to range from 0 to 10 in all models. The number of observations is: Expressed Happiness, 12,712; Interpersonal Trust, 12,711; Trust in Parties, 13,659; Trust in Politicians, 12,623; Satisfaction with Economy, 12,554; Satisfaction with Government, 12,392. Data are from the ESS and the Eurobarometer.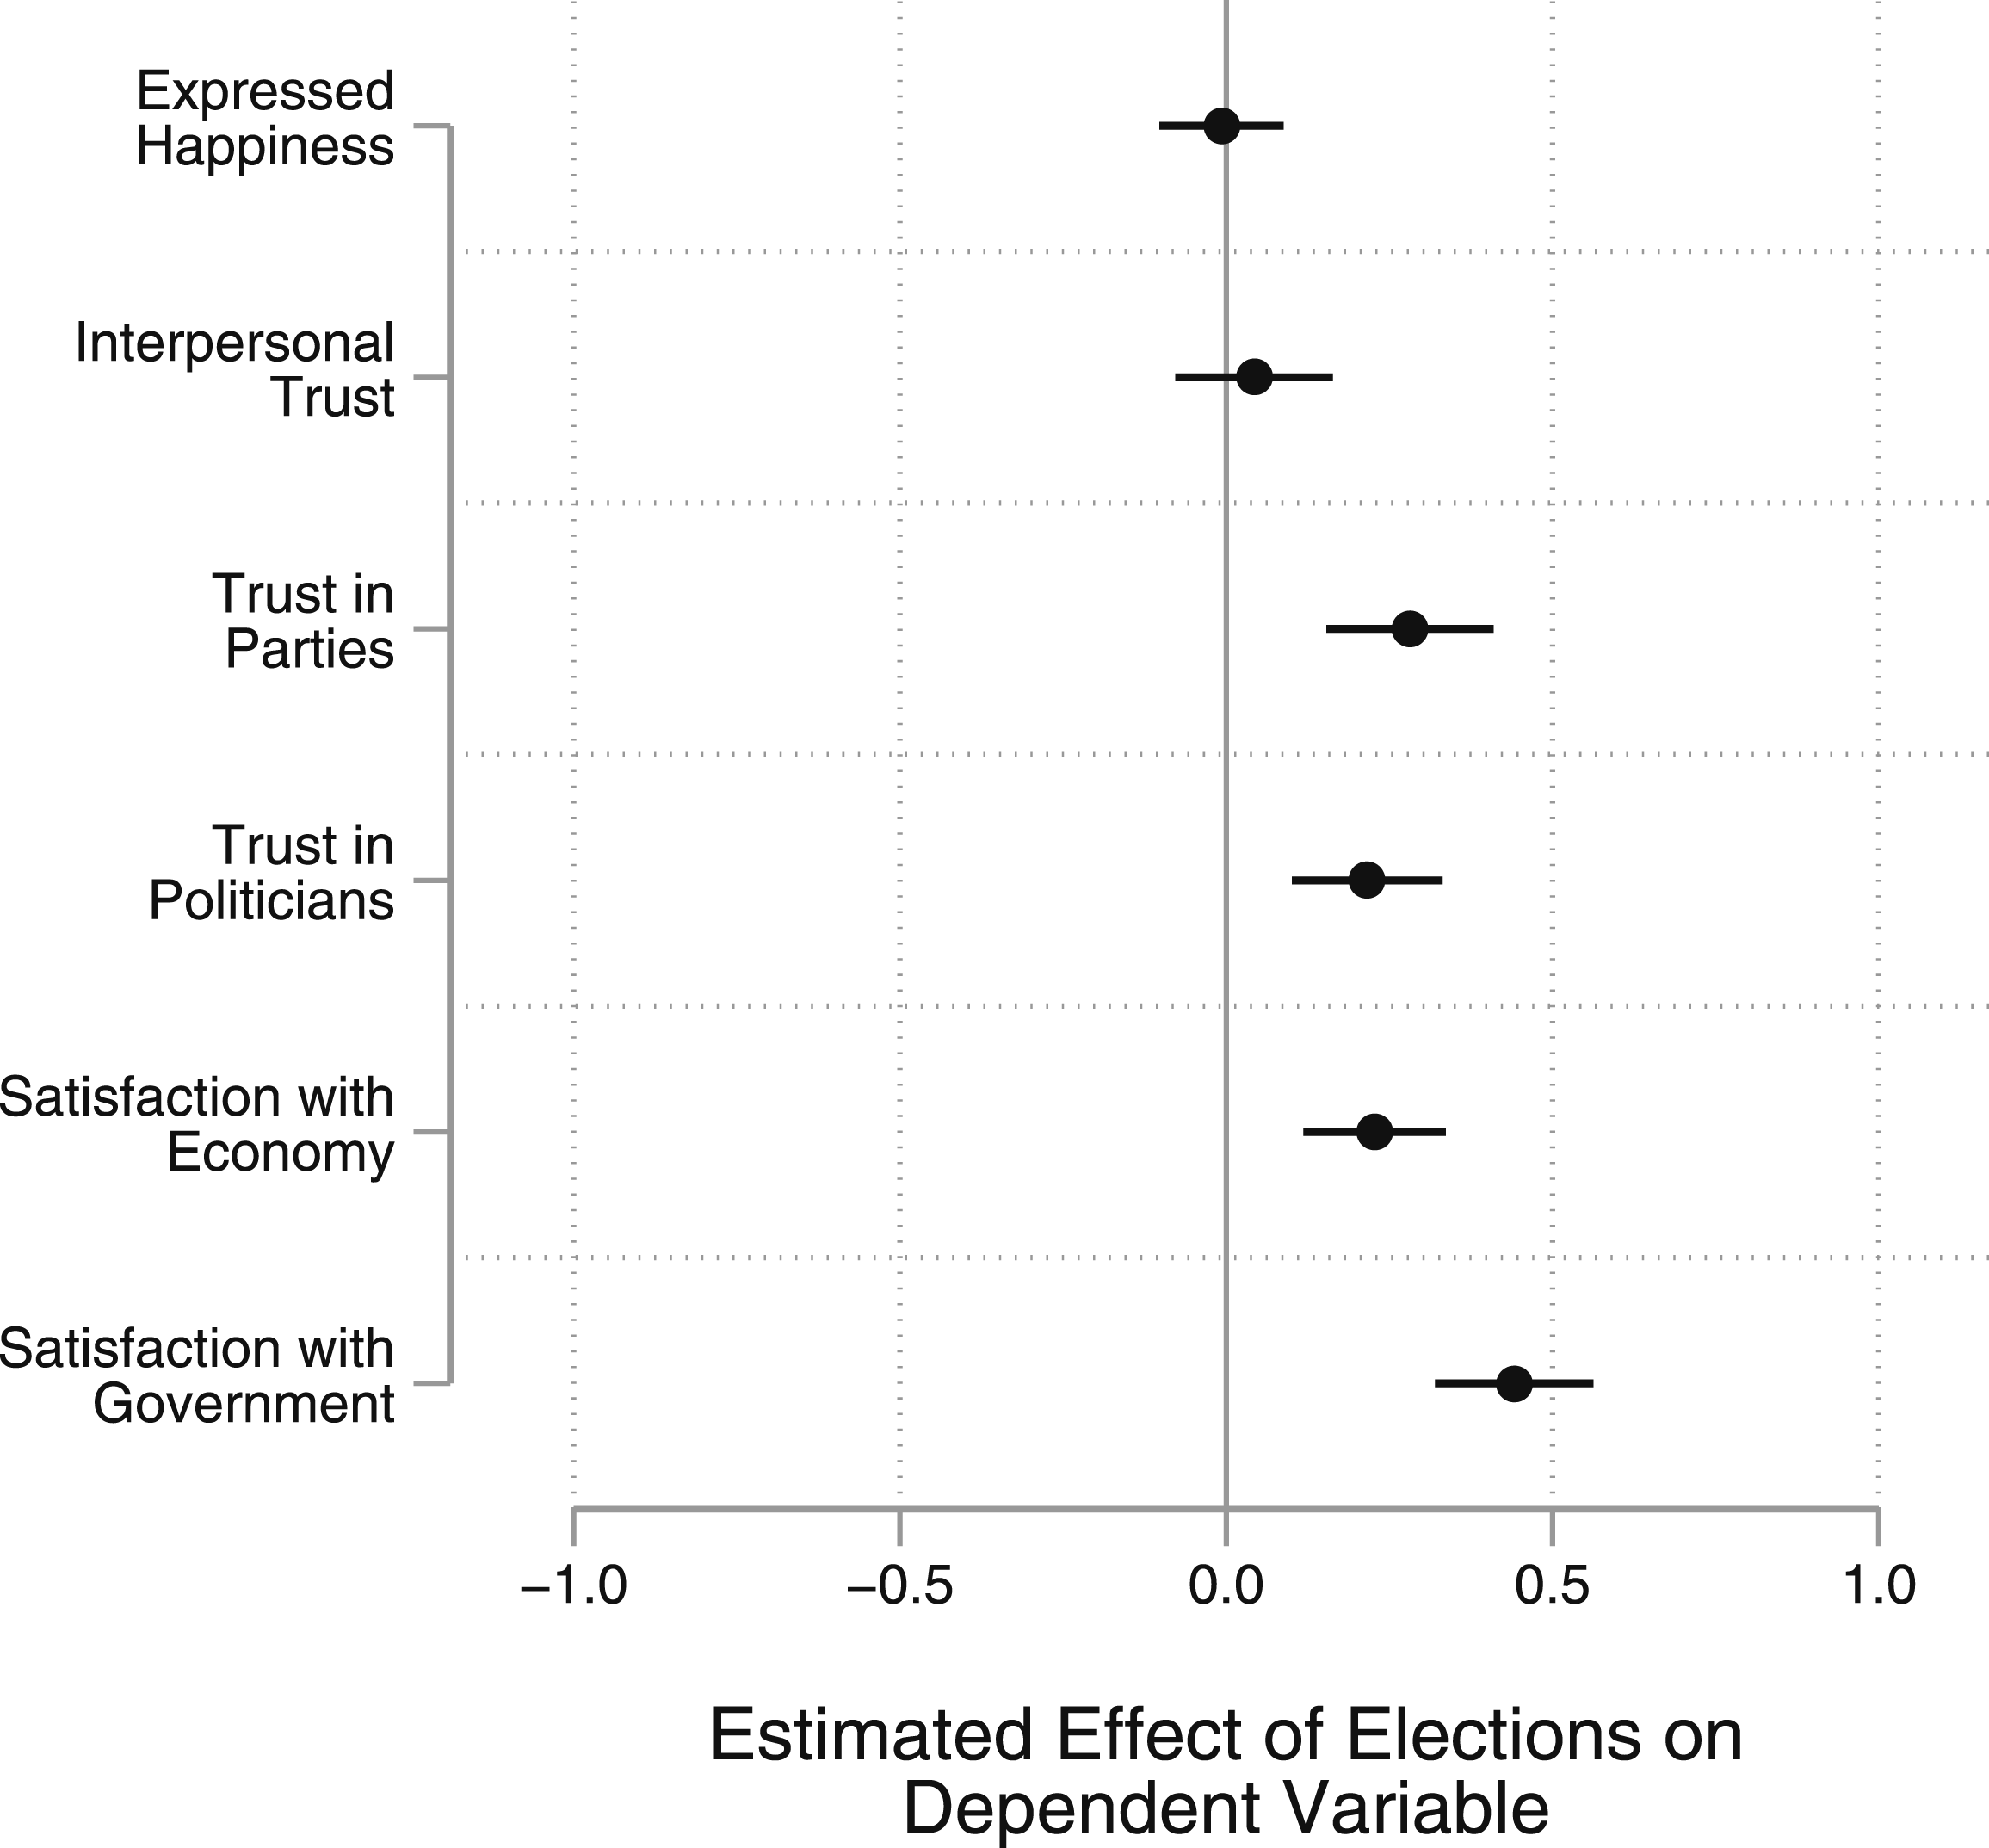
Study 2: Pre- and Post-Election Panel Surveys
In this study, I estimate election-induced changes in SWD within individuals. To facilitate this, I gather panel survey data from the Making Electoral Democracy Work (MEDW) project, a cross-national survey program with a focus on Canada and European democracies. 7 MEDW survey respondents are interviewed via internet twice, once before and once after elections. 8
I include every national election survey for which necessary data are available in the aggregate MEDW dataset. This includes eight separate surveys conducted between 2011 and 2015 in Canada, Germany, Spain, and Switzerland, which cover the following regions and national elections: British Columbia, Ontario, and Quebec (2015 Canadian federal election); Lower Saxony (2013 German federal election); Catalonia and Madrid (2011 Spanish general election); and Lucerne and Zurich (2011 Swiss federal election). 9 Each country is rated at or above 0.90 on the Varieties of Democracy Project’s (V-Dem) Clean Elections Index (Coppedge et al., 2021), which ranges from 0 to 1, at the time of the included election.
Canada, Germany, and Spain are parliamentary democracies, while in Switzerland the executive (the Federal Council) is selected by the legislature after national elections. As such, there are often delays between the date of the election and government formation in each country. Following each election in my sample, it took several weeks for the executive to be formed, 10 and the MEDW’s wave 2 fieldwork was completed before that stage. 11 Fieldwork dates are summarized in Section 12 of the Supplemental Material.
As in Study 1, the delays in government formation help me test whether elections increase SWD independent of victory and loss per the common conceptualization of winning, which requires that a voter chose a party that entered government. While it remains possible that post-election SWD is influenced by predictions about coalition makeup 12 or the relative performance of parties, gauging attitudes before governments are formed helps lessen the extent to which estimated effects are confounded by outcomes. To further assess the influence of winning and losing, below I leverage an opportune feature of the MEDW data to condition the effect of elections on a pre-election—and thus pre-treatment—measure of vote choice.
It remains possible that events that happen around the same time as elections could drive changes in SWD from wave 1 to wave 2. The relatively short periods between MEDW waves, which are outlined in Section 12 of the Supplemental Material, help to alleviate this concern. Further, in Section 13 of the Supplemental Material, I summarize trending Google searches in the MEDW regions in the run-up to the national elections. At least one election-related term makes the top five trending searches in each case, and there is no evidence of increasing public attention toward SWD-relevant events that are coincidental with the elections.
A question about satisfaction with democracy is asked in both MEDW waves and is worded: “On a scale from 0 to 10, where 0 means not satisfied at all and 10 means very satisfied, how satisfied are you with the way democracy works in [name of country]?” 13 I use a panel regression approach to estimate the average change in SWD from wave 1 to wave 2. 14 Estimates are derived solely on the basis of within-respondent variation and cannot be confounded by time invariant respondent-, region-, or country-level characteristics. To improve precision, I adjust for gender, age, education, and income. See Section 14.2 of the Supplemental Material for more information on the survey items and their coding.
Most closely related to this study, Kostelka and Blais (2018) use MEDW data to disentangle the perhaps reciprocal relationship between SWD and voting, finding evidence that turning out boosts satisfaction. This study differs from Kostelka and Blais’s project in two important ways. First, I also test whether elections increase SWD independent of voting. And, second, to do so, I hold constant voter turnout with a pre-treatment measure of participation, thus avoiding potential bias from the inclusion of a post-treatment variable.
Results
Results of the test of Hypothesis 1, that elections increase SWD, are shown at the top of Figure 4. In support of the hypothesis, respondents’ satisfaction increases by 0.40 units after an election is held. This effect is estimated with a high level of precision (two-sided p-value = .002). In Section 9.2 of the Supplemental Material, I explore whether this effect varies with demographic characteristics. I find some evidence for conditional effects, but the positive effect of elections on SWD is not limited to any particular demographic subgroup. Estimated effects of elections on satisfaction with democracy, panel surveys. Note. Estimates are from first difference regressions adjusted for gender, age, education, and income. Standard errors clustered by election. Horizontal lines indicate 95% confidence intervals. Satisfaction with democracy ranges from 0 to 10. The number of observations is 7,104. Data are from the making electoral democracy work project.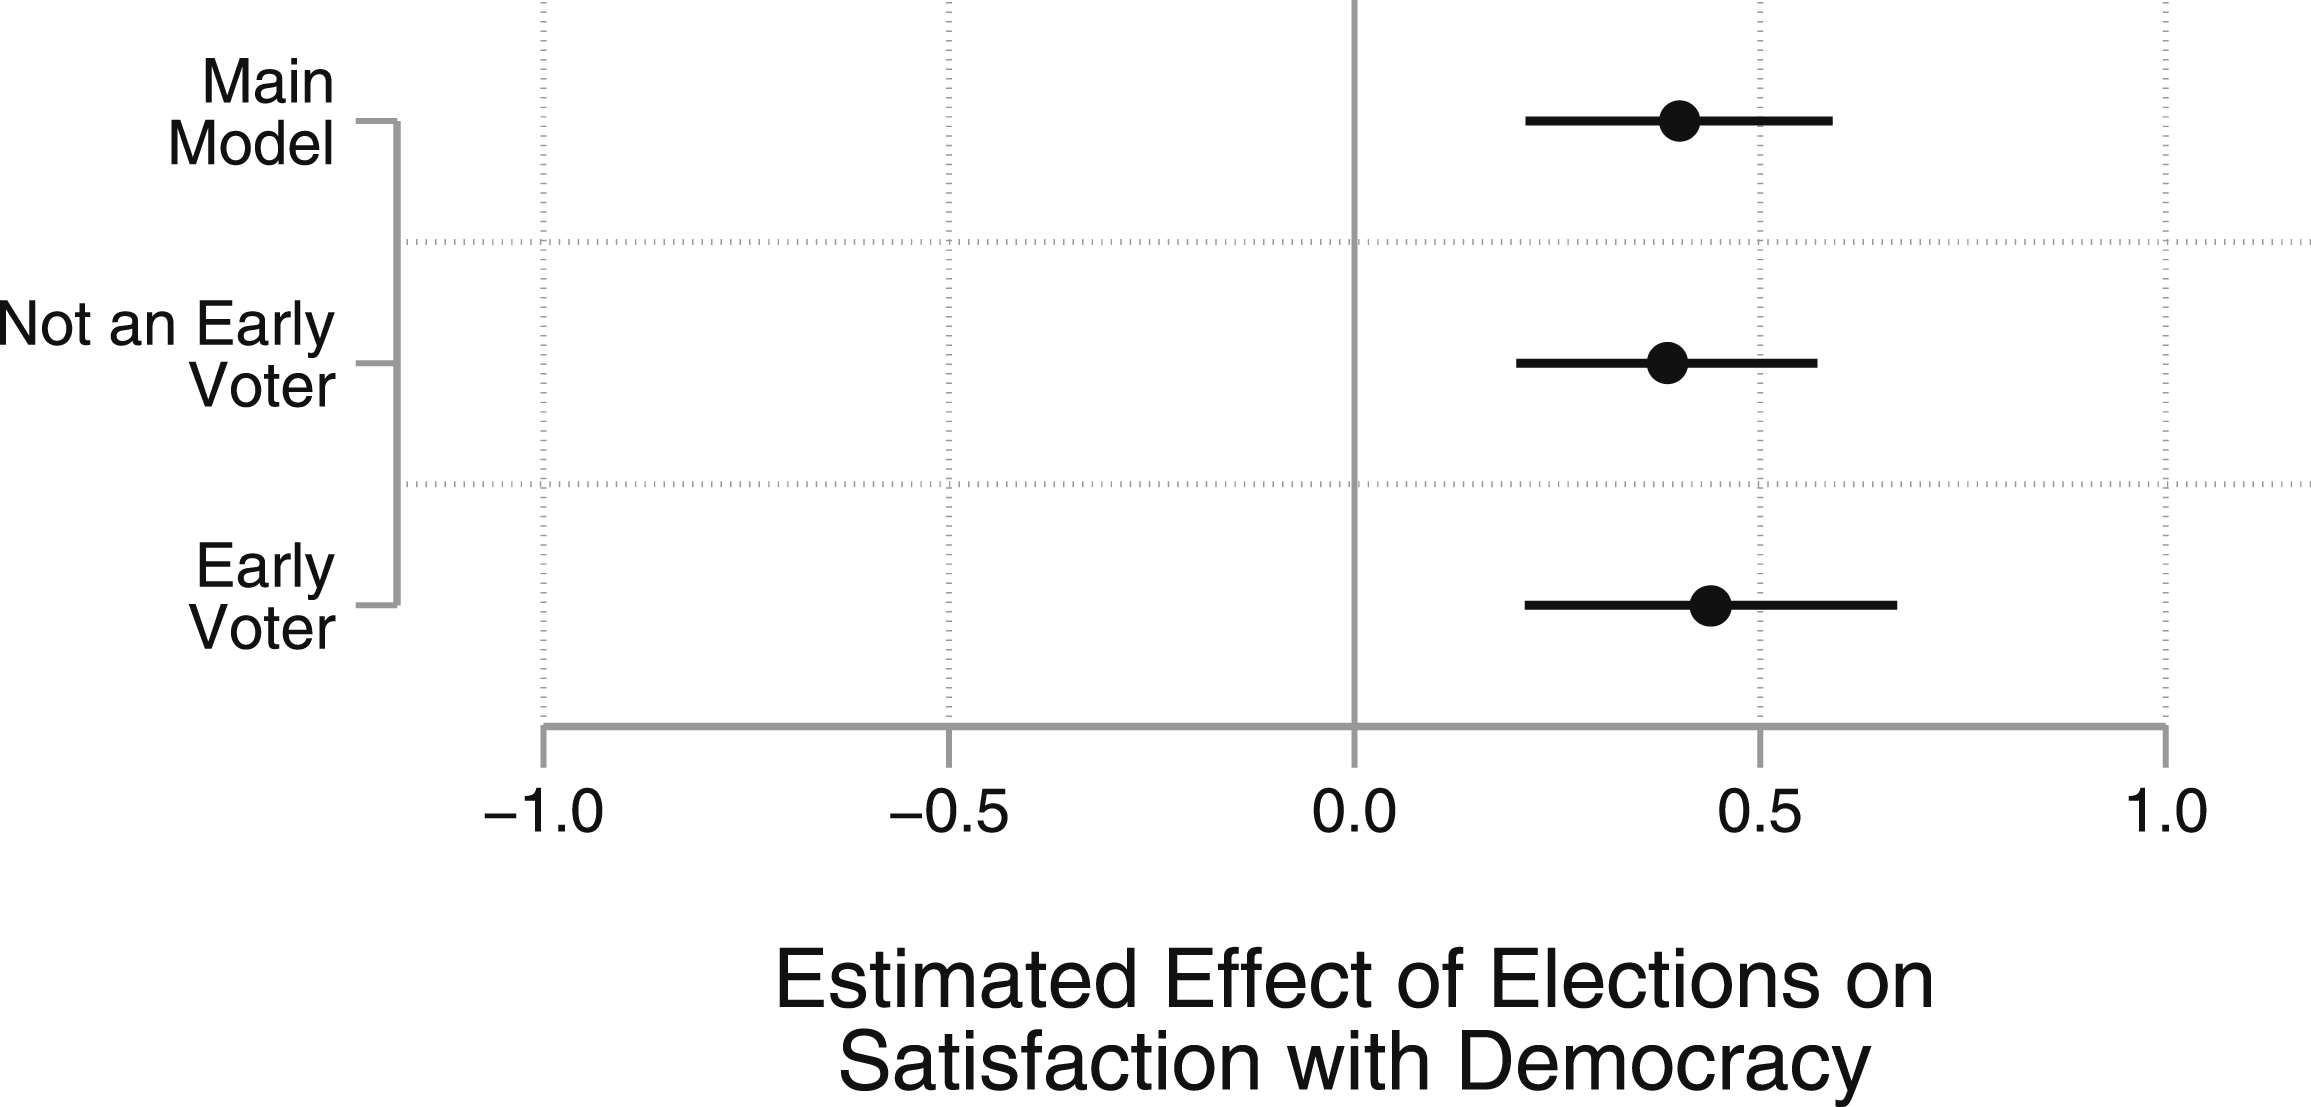
The MEDW surveys provide an opportunity to investigate Hypothesis 2’s contention that elections increase SWD due to the positive psychosocial effects of the act of voting. 15 Wave 1 includes an item identifying respondents who voted prior to their survey interview. For these early voters, any bump in satisfaction that comes from the act of voting is already captured in their pre-election survey responses, and changes in satisfaction between wave 1 and wave 2 can thus be attributed to the election alone. Thus, any effect among early voters would suggest that the psychosocial benefits of turning out to vote do not mechanize the effect of elections on SWD.
The effects of elections on SWD conditional on early voting are shown in the bottom two rows of Figure 4. The effects for those who did not vote early and those who did are similar, at 0.39 and 0.44 units, respectively (the two-sided p-values are 0.002 and 0.003). Elections increase satisfaction even for those who vote ahead of time, indicating that the existence of an election enhances SWD independent from the act of voting. This runs counter to Hypothesis 2. It is more plausible that elections enhance democratic satisfaction through the representational and economic mechanisms outlined in Hypotheses 3 and 4, which are also supported by evidence reported in Study 1.
I also consider whether effects vary by country, estimating wave 1 to wave 2 changes separately for each survey in my MEDW sample. Results, shown in Section 6 of the Supplemental Material, indicate that the positive effect of elections on SWD is broadly detectable across countries. Further, as pre-election campaigns may affect satisfaction with democracy (Higashijima & Kerr, 2023), I also re-estimate the models with a control for the timing of wave 1 survey interviews. Results, provided in Section 8 of the Supplemental Material, show that findings are unchanged with the introduction of this control.
What About Winning and Losing?
As interviews took place before government formation, the timing of the MEDW surveys helps me isolate the impact of elections from that of winning and losing in the sense of the participation of one’s party in the executive. Yet, observed electoral performance of one’s favored party or predictions about government composition could shape reactions to an election (e.g., Plescia, 2019; Stiers et al., 2018). As such, winner-loser dynamics could still be at play. Indeed, in the Canadian, German, and Spanish elections in my sample, the biggest gainers in terms of vote and seat shares went on to form the government, meaning those who were winners in the sense of their party eventually entering the executive were also winners in the sense of their party improving its electoral and legislative status. 16 In Switzerland, those who selected an incumbent governing party were almost guaranteed to be winners in the sense of their party participating in government after the election. There, an informal power-sharing agreement (the “Magic Formula”) has largely kept the same parties in the executive since 1959.
The pre-election MEDW surveys ask respondents who voted before election day which party or candidate they selected, thus providing a pre-treatment measure of vote choice that can be used to assess whether the positive impact of elections on SWD is concentrated among those most likely to feel a sense of victory. I construct a variable that separates those who voted early for a party that ultimately entered government and those that voted early for a party that did not. 17 I then estimate the effect of elections on SWD conditional on early vote choice.
Results are shown in Figure 5. The effects of elections on SWD for winners and losers are 0.54 and 0.29 units, respectively (the two-sided p-values are 0.016 and 0.059), and these estimates are not statistically different (two-sided p-value = .317). This lack of statistical significance is unlikely driven by an inability to detect differences.
18
Thus, in line with my theory, at least among those who vote ahead of time, the upward impact of elections on SWD is not alone driven by support for parties that would enter government—even where these parties had obviously strong performances in the election (Canada, Germany, and Spain) or where it was essentially predetermined which parties would form the executive (Switzerland).
19
Estimated effects of elections on satisfaction with democracy by winning and losing, panel surveys. Note. Estimates are from first difference regressions adjusted for gender, age, education, and income. Standard errors clustered by election. Horizontal lines indicate 95% confidence intervals. Satisfaction with democracy ranges from 0 to 10. The number of observations is 1,868. Data are from the making electoral democracy work project.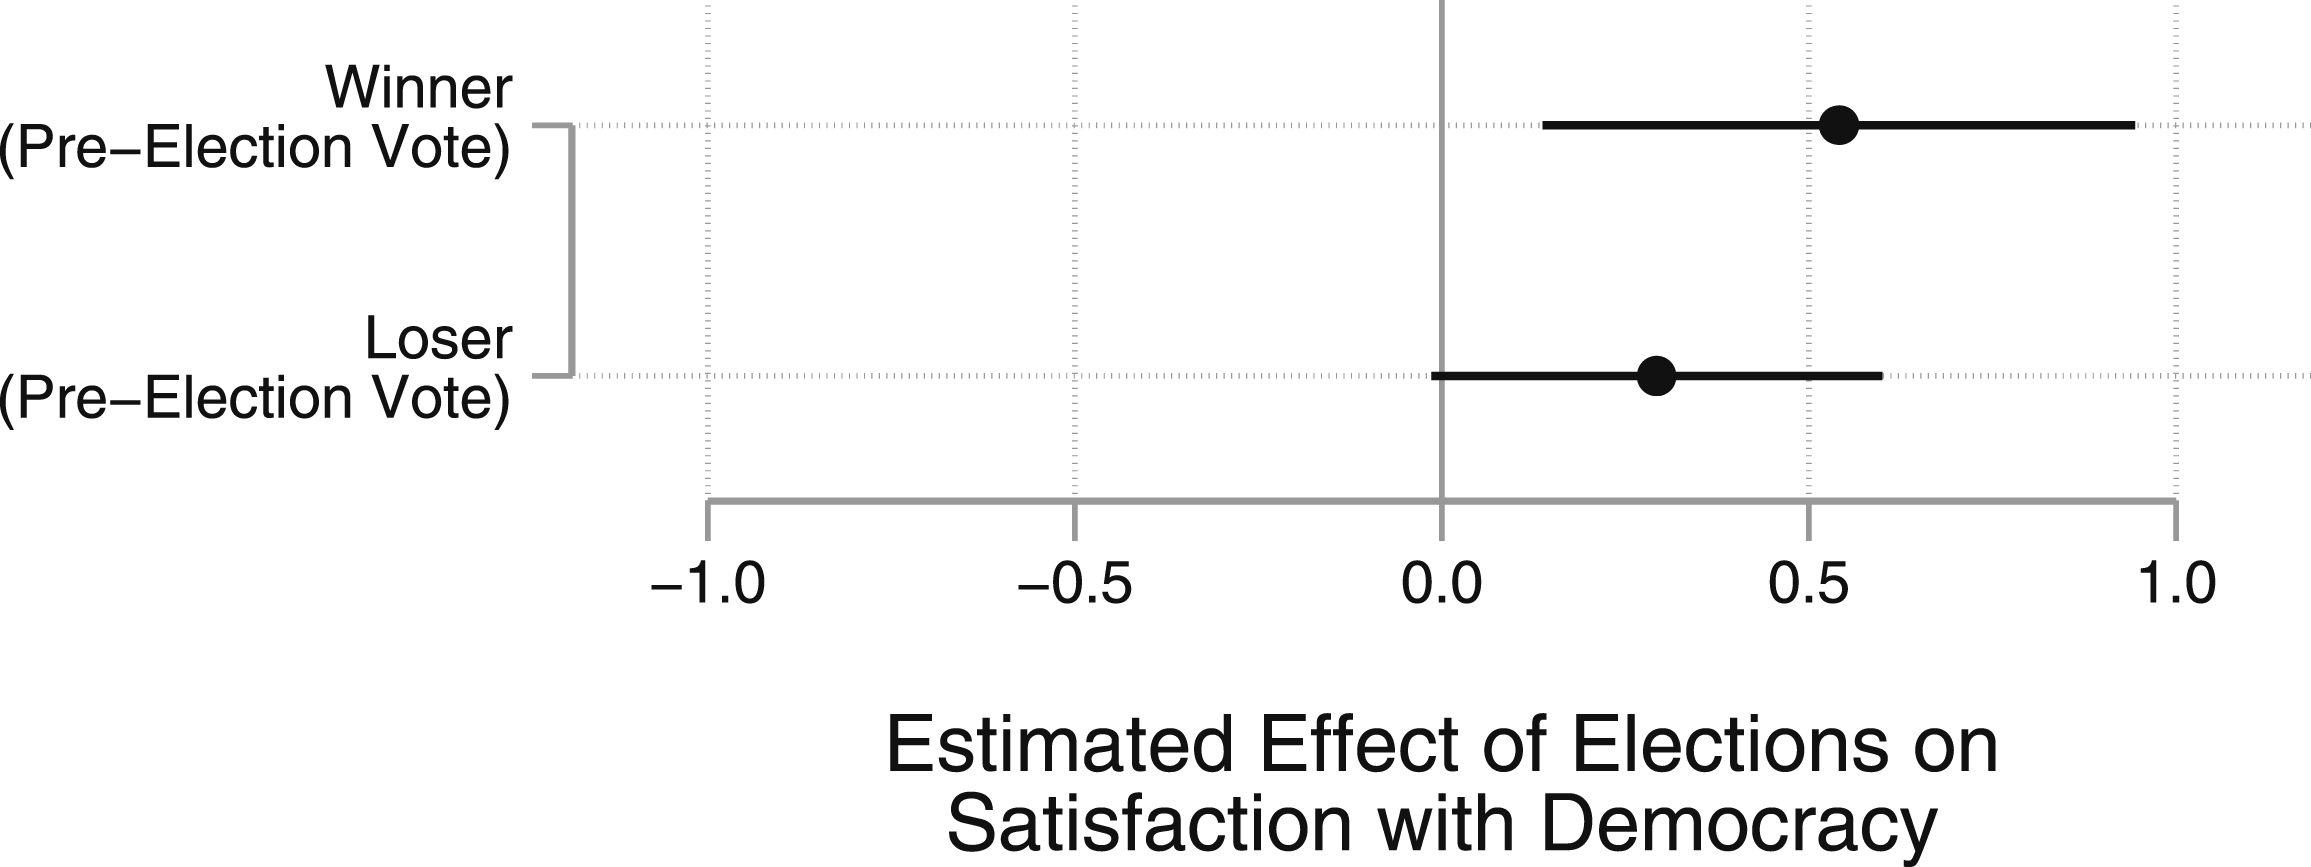
Study 3: A Survey Experiment in Finland
In this study, I conduct a survey experiment following Finland’s 2023 parliamentary election, in which I randomly expose people to a vignette about the election or a control condition. This is a good setting for my purposes. First, the election produced a hung parliament: while it was held on April 2nd, a government was not formed until June 15th. I conducted my fieldwork on April 3rd and 4th. Although post-election SWD may still be shaped by the performance of one’s party or expectations about coalition formation, measuring attitudes before the government formed helps lessen the extent to which estimated effects are confounded by winning and losing in terms of one’s party gaining executive power. The immediate post-election implementation of my experiment also sets up a “hard case,” in that any attitudinal effects of the election likely remained, making it difficult to further manipulate SWD. The election was decidedly clean and went off without any accusations of fraud.
To recruit participants to my pre-registered, 20 survey experiment, I hired Cint, an international market research firm. Cint collected a national online sample of Finlanders, with population-based quotas for gender and age. 21 Toward the beginning of the survey, I presented participants with an instructional manipulation check, and, consistent with the pre-registration, I drop those who failed it. See Section 14.3 of the Supplemental Material for more information on the survey items and their coding.
My experiment adheres to APSA’s Principles and Guidance for Human Subjects Research. I made concerted efforts to respect the autonomy of participants and to protect their well-being. I have also carefully reflected on the ethics of my research beyond the review I outsourced to the Institutional Review Board. I received informed consent from participants, who were made aware that they were taking part in a research study and were given an explicit opportunity to have their responses expunged at the end of the survey.
After answering a slate of demographic and political questions, respondents were randomly assigned to a treatment or control condition, both of which consisted of two screens. The treatment was constructed to provoke memories of the recent election and related experiences and emotions. The control condition, which discusses types of grass, was designed to have no connection to elections or SWD. Respondents could not advance from the first to the second screen for at least 60 seconds. In the treatment condition, respondents were initially asked to read the following text: As you surely know, elections were held in Finland on April 2, 2023, in which 200 members were elected to the Finnish Parliament. An arrow that you can click to continue will appear shortly. While you wait for that, take a moment to reflect on your experience on Election Day earlier this month. In the following sections, we may ask you questions about the 2023 parliamentary elections.
This was followed up with: As a reminder, you just read about the Finnish parliamentary elections of April 2, 2023. Spend another 20–30 seconds thinking about your experiences on that day before clicking the arrow to continue.
In the control group, the corresponding text on the first screen read as follows: There are several different types of grass in Finland. The most common are Agrostis stolonifera, Alopecurus geniculatus, Deschampsia cespitosa, and Lolium multiflorum. The color of the grasses varies from green to golden yellow and light brown. An arrow that you can click to continue will appear shortly. While you wait for that, take a moment to think about Finnish grass varieties. In the following sections, we may ask you questions about Finnish grasses.
This was followed up with: As a reminder, you just read about different types of grass in Finland. Spend another 20–30 seconds thinking about Finnish grasses before clicking the arrow to continue.
I cautiously assume a small effect size (Cohen’s d = 0.2). To detect this at the ten percent 22 significance level with 80% power, 310 observations per experimental group are needed. As stated in the pre-registration, I thus targeted a slightly larger sample size of 325 per group to account for missing data. I was able to collect 334 usable observations in the treatment group and 316 in the control condition. A factual manipulation check (see Kane & Barabas, 2019) indicates that the treatment was successful: 92.8% of treated respondents correctly answered an inquiry about its content. 23
Following treatment, I presented to respondents an SWD item meant to mimic that of the MEDW dataset used in Study 2. The question asked respondents to rate their level of satisfaction on a 0–10 scale, with 0 corresponding to extreme dissatisfaction and 10 to extreme satisfaction. As pre-registered, and consistent with Studies 1 and 2, I control for gender, age, education, and income in all models. These controls improve precision while also helping to adjust for covariate imbalances that come about due to “unlucky draws.” 24
Results
To test Hypothesis 1, which puts forth that elections increase satisfaction with democracy, I regress the post-treatment SWD measure on a dummy differentiating the treatment and control groups and the covariates. Results are shown in the top row of Figure 6. Mean SWD among those in the election treatment is 0.26 units greater than among those in the control condition. This difference slightly misses the pre-registered ten percent level of statistical significance (two-sided p-value = .130). Still, it is notable that individuals in the treatment group, who were exposed to a mere reminder of an election that happened just a day or two prior and thus likely had lingering attitudinal effects, report a higher level of satisfaction with democracy than those in the control condition. Further, the treatment effect is similar in size to that detected in Studies 1 and 2 using wholly different research designs. In Section 9.3 of the Supplemental Material, I show that the effect does not vary with demographic characteristics. Estimated effects of a reminder about Finland’s 2023 parliamentary election on satisfaction with democracy. Note. Treatment effects estimated with linear regression. Bottom two estimates from a model including an interaction between the treatment variable and prior turnout. Horizontal lines indicate 90% confidence intervals. Satisfaction with democracy ranges from 0 to 10. The number of observations is 650. Data are from an original survey experiment.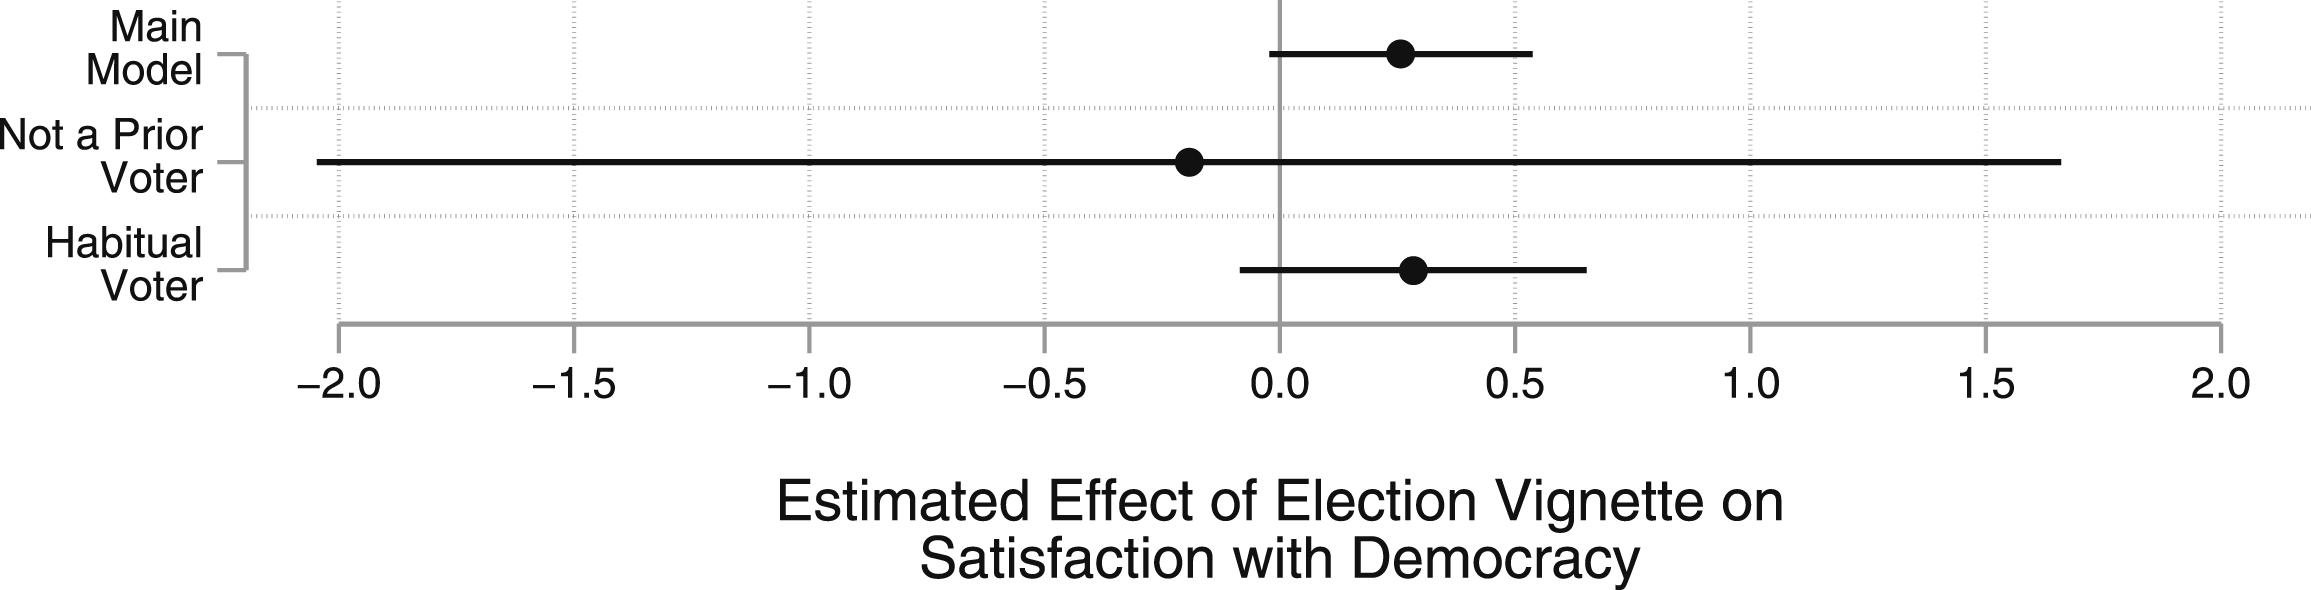
The survey includes a pre-treatment item inquiring about respondents’ turnout history. I ask about respondents’ general participation habits rather than specific turnout in the 2023 election to avoid priming those in the control group with the content of the treatment condition. Because voting in past elections is a strong predictor of subsequent participation (e.g., Denny & Doyle, 2009; Gerber et al., 2003), it is likely that prior voters are also current voters. Thus, the prior turnout item facilitates a test of Hypothesis 2, which implies that psychosocial effects of voting will be concentrated among those who actually participate. 25 If the election reminder in the treatment condition rekindles the psychosocial effects of voting among those who participated, its effect should be largest for habitual voters. At the same time, any detected effect among those who are unlikely to have participated would be consistent with the representational and economic mechanisms suggested in Hypotheses 3 and 4, which work independent of turnout.
The four-category prior turnout measure ranges from never voting in Finnish elections to always turning out, and 90.2% of respondents reported usually or always voting in recent elections. Results conditional on responses to this item are shown in the bottom two rows of Figure 6. The treatment effect is not statistically different from zero for nonvoters (two-sided p-value = .864) or routine voters (two-sided p-value = .206), and the two conditional treatment effects are not statistically different from one another (two-sided p-value = .678). There is no evidence that the effect of the election reminder is conditional on turnout habits. 26 Results do not help to clarify the validity of the mechanisms proposed in Hypotheses 2–4.
What About Winning and Losing?
My survey experiment was executed immediately after the election in Finland, several weeks before the governing coalition was formed. Moreover, a fragmented election result, in which ten parties entered parliament and none won more than a quarter of seats, created uncertainty over which parties would form a governing coalition. As such, none of the participants in my survey experiment were winners or losers in the sense that their preferred party joined or was excluded from government. To be sure, it remains possible that respondents felt victorious or defeated immediately following the election, as the performance of one’s party or expectations about government composition can shape electoral reactions (e.g., Plescia, 2019; Stiers et al., 2018).
To test whether winner-loser dynamics are at play, I rely on a pre-treatment measure of partisan identification. As partisanship is an important facet of political orientations and a robust predictor of vote choice in Finland (cf. Bengtsson et al., 2013; Kekkonen & Ylä-Anttila, 2021), it can plausibly be used to separate respondents into electoral winners and losers. I did not ask about vote choice in the pre-treatment question battery to avoid cuing thoughts of the election among those in the control group.
In Figure 7, I plot separate treatment effects for: those attached to a party that would join the eventual government; those attached to the Social Democratic Party (SDP), which lost the premiership in the election; those attached to another party; and nonpartisans. First, there is no evidence that treatment had a positive effect on SWD among eventual winners—those attached to a party that would go on to enter government. This group includes partisans of the National Coalition Party, which received the most votes and seats owing to a positive swing larger than that of any other party (in both absolute and percentage terms). Second, the largest positive effect is seen among those attached to the SDP, which was the clearest loser of the election. While the SDP increased its vote and seat share, it was immediately apparent that it would not be part of the coalition formation process. The incumbent SDP prime minister conceded defeat promptly after the election and announced her intention to resign as party leader shortly thereafter. In sum, there is no evidence that the positive impact of the election treatment on SWD is driven by supporters of winning parties. Estimated effects of a reminder about Finland’s 2023 parliamentary election on satisfaction with democracy by partisanship. Note. Treatment effects estimated with linear regression models that include an interaction between the treatment variable and dummies for each type of party attachment identified on the vertical axis. Horizontal lines indicate 90% confidence intervals. Satisfaction with democracy ranges from 0 to 10. The number of observations is 634. Data are from an original survey experiment.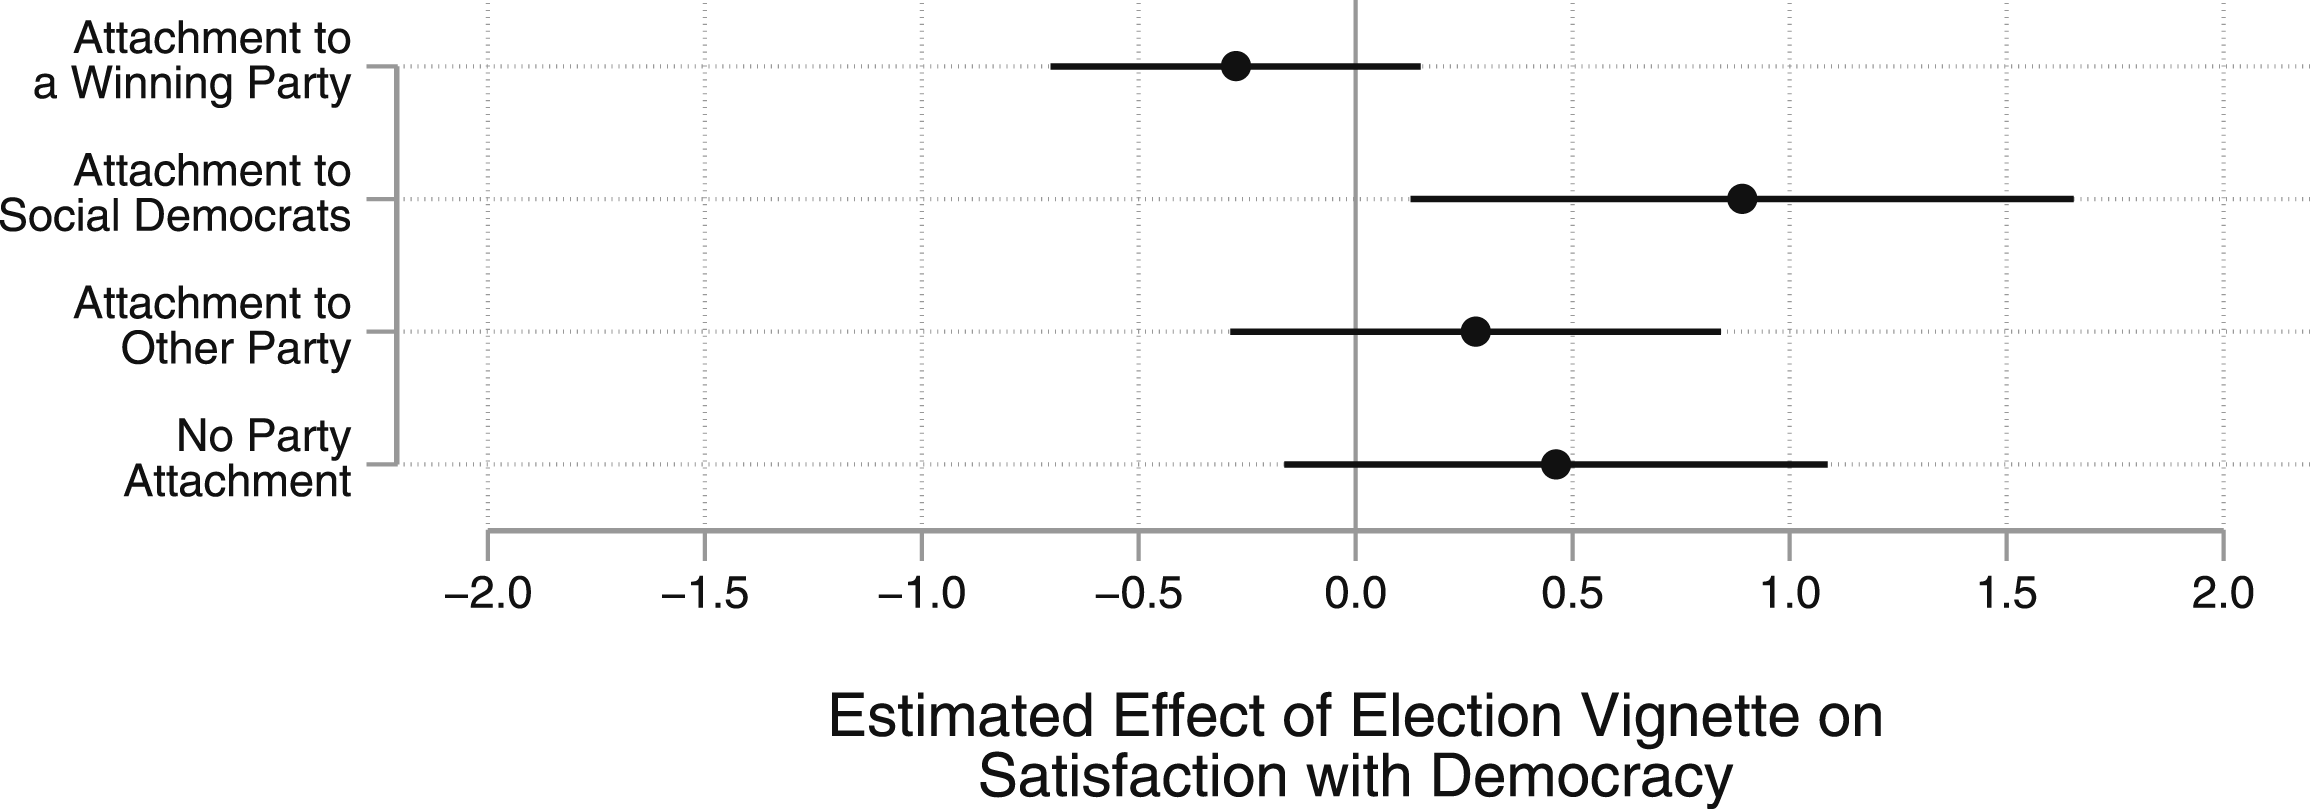
Conclusion
As Anderson et al. (2005, chp. 1) recognize, “winning isn’t everything.” In line with this contention, I theorize that elections increase satisfaction with democracy regardless of electoral outcome due to the psychosocial, representational, and economic benefits they provide to citizens. I test my expectations across three studies. In the first, I leverage a collection of interrupted surveys to harness as-if random assignment of elections. In the second, I use a panel analysis to isolate the effect of elections from time-invariant confounders. In the third, I randomly assign survey respondents to a control condition or a treatment that fosters memories of an election. Results show a positive effect of elections on SWD, and follow-up analyses leveraging pre-treatment measures of vote choice and partisanship support the contention that SWD gains are not exclusive to winners.
An investigation of the theoretical mechanisms behind this relationship suggests that elections’ representational and economic benefits drive their positive effect on SWD. There is little evidence of a psychosocial foundation for this effect. This may be because the psychosocial payoffs associated with elections largely run through the voting act, and, as Coleman (2013, p. 2) notes, “Few subjects arouse more radically conflicting associations than voting.” For some, voting may stand as a symbol of freedom and a way to hold the powerful to account; for others, it may feel like a futile ritual after which the government always prevails. At the same time, the attitudes of those engaging with the electoral process—voters—may be harmed by negativity surrounding elections, including from attack ads, uncivil debates, and widespread mis- and disinformation in traditional and social media. To this end, Goldberg and Plescia (2024) find that beliefs about the influence of fake news on elections can strengthen the relationship between populist attitudes and perceptions of election fairness, while Mauk and Grömping (2023) find that online disinformation breeds distorted views of electoral fairness.
Regardless of the mechanisms that drive the relationship, the robust effect of elections on SWD implies that policymakers could engender a more satisfied public by holding national contests more often. However, there is likely a saturation point. This can be considered in light of the tendency of turnout rates to be lower when less time has elapsed since a prior election (Franklin, 2004; Rallings et al., 2003). Still, satisfaction with democracy fades after elections (Han & Chang, 2016, pp. 95–96; Higashijima & Kerr, 2023; Loveless, 2021), meaning national contests should be held frequently enough to prevent secular declines. Answering the question of what election timetable might maximize satisfaction with democracy will require rich intertemporal data across countries, and I leave this to future research.
All of the elections in the analyses of Studies 1, 2, and 3 come from countries in the Global North, and all are relatively high-integrity affairs. In examinations reported in Section 10 of the Supplemental Material, I find no evidence of a positive effect of elections on SWD in my analyses of a pair contests with impugned integrity held in Brazil and Venezuela. This suggests that the theoretical mechanisms connecting elections to democratic satisfaction do not come to the fore when electoral integrity is in doubt. It does not, however, imply that my findings do not apply in the Global South. Indeed, Higashijima and Kerr (2023) demonstrate a positive relationship between election proximity and SWD in Africa. Evidence from a broader selection of developing countries may show that elections around the world have the potential to shore up citizens’ democratic attitudes.
Supplemental Material
Supplemental Material - Elections Increase Satisfaction With Democracy
Supplemental Material for From Elections Increase Satisfaction With Democracy by Shane P. Singh in Comparative Political Studies
Footnotes
Acknowledgments
I thank Linan Jia, Chun-Young Park, Matthew Rains, and Jackson Tilley for assistance with identifying the election-interrupted surveys and for help assembling the related dataset used in Study 1. I thank Mollie Cohen and Ryan Powers for feedback on the design of the experiments used in Study 3 and the ![]() . I thank Dieter Stiers and Judd Thornton for general comments on the paper.
. I thank Dieter Stiers and Judd Thornton for general comments on the paper.
Declaration of Conflicting Interests
The author declares no potential conflicts of interest with respect to the research, authorship, and/or publication of this article.
Funding
The author received no financial support for the research, authorship, and/or publication of this article.
Ethical Considerations
The University of Georgia Institutional Review Board approved the experiments included in the paper in Study ID: 00006551.
Consent to Participate
I received informed consent from participants in the experiments included in the paper. Participants were made aware that they were taking part in a research study and were given an explicit opportunity to have their responses expunged at the end of the survey.
Data Availability Statement
Supplemental Material
Supplemental material for this article is available online.
Notes
Author Biography
References
Supplementary Material
Please find the following supplemental material available below.
For Open Access articles published under a Creative Commons License, all supplemental material carries the same license as the article it is associated with.
For non-Open Access articles published, all supplemental material carries a non-exclusive license, and permission requests for re-use of supplemental material or any part of supplemental material shall be sent directly to the copyright owner as specified in the copyright notice associated with the article.