






Abstract
The defining characteristic of the modern state is its monopoly on violence. Yet, despite broad scholarly agreement on the definition, there are no empirical measures of the monopolization of violence. We introduce the first such measure: the share of castles controlled by the Crown. Taking the canonical definition as its point of departure, the measure allows us to trace the origins of the modern state in the power struggle between monarchs and societal actors when, where, and as it actually happened. The Castles Data are based on random samples from 17 modern European countries and record the ownership of more than 5,400 unique castles across most of Europe from 1000 to 1700. To validate the measure, we show that it tracks historiographical accounts of state formation and correlates strongly with independent coding by historians. We illustrate its use in applications at both the polity and micro levels.
Introduction
The modern state is the dominant form of social organization. It is recognized as a necessary condition for democracy (e.g., Fukuyama, 2005) and for economic development (e.g., Acemoglu & Robinson, 2012; Besley & Persson, 2009). Where well-functioning states are absent, instability prevails (e.g., Bates, 2008). The state, in short, is one of the most important concepts in the social sciences and in the social world. Scholars agree that the defining characteristic of the modern state is its monopoly on violence within a territory (e.g., Hall, 1994, p. xv). Yet despite the centrality of the modern state and broad agreement that the monopoly on violence defines it, we lack empirical measures of this defining attribute.
In this article, we introduce a novel dataset on castle ownership and show that it can be used to trace the gradual monopolization of the means of violence in medieval and early modern Europe. Castles are fortified residences, physical structures with coercive potential. The modern state grew out of medieval kingdoms and principalities, but the monarchs were not “states”, nor did they rule “states”. To solidify their rule, monarchs prohibited private castle construction, seized, or razed them. It is only in hindsight we know that these efforts to monopolize power were, in fact, “state making”. Yet history tells us that they were. The modern state arose from this power struggle between monarchs, nobles, and ecclesiastics.
The dataset contains 5,434 unique medieval castles, randomly sampled across Western and Central Europe. It spans seven centuries, 17 modern countries, and many more contemporary polities. For every castle, we detail the years of construction and destruction, and whether in a given year it was owned by the Crown, the nobility, the Church, or a foreign monarch. We measure the monopolization of violence as the proportion of Crown-controlled castles within polities over time.
We demonstrate the validity of our castle-based measure by comparing it to historiographical accounts of select cases as well as to statistics on castle ownership from historical sources. We focus on the case of England (but similar validation exercises from Sweden and Denmark can be found in the online appendix). We explore the association between the monopolization of violence and tax revenue, a standard proxy for the related concept of state capacity. In two empirical applications, we show how the Castles Data, as a measure of the relative strength of the Crown as against societal actors, can help to inform the fundamental question of institutional endogeneity; we also explore the relationship between coercive power and economic activity.
The paper adds to a burgeoning literature in historical political economy. Ambitious efforts to collect data on representative institutions (Stasavage, 2010), revenue collection (e.g., Dincecco & Wang, 2018), and ruler tenure (Kokkonen & Sundell, 2014) have contributed to our knowledge of European political and economic history. More recent studies have added to these, e.g., by expanding existing data on tax revenue or executive constraints (Henriques et al., 2025). The literature on state formation has focused on other dimensions of the state than the monopoly on violence, including the ability to tax (e.g., Dincecco, 2015; Dincecco et al., 2011) or fiscal centralization (Cox et al., 2025), bureaucratization (Figueroa, 2023), border stability (e.g., Abramson et al., 2022), territorial consolidation or fragmentation (e.g., Albers & Pfister, 2023; Cederman et al., 2023; Grzymala-Busse, 2024; Wishman & Butcher, 2022), the size of political units (e.g., Abramson, 2017), and the depth of historical statehood defined as government above the tribal level (Borcan et al., 2018; Hariri, 2012).
Yet, while existing work has provided useful data on and analyses of other dimensions of state formation, the monopolization of violence has never before been measured or studied quantitatively. Arguably, the monopoly on violence is the only characteristic that is truly unique to the modern state, and its creation and consequences should therefore figure prominently in studies of state formation. The Castles Data make this possible. The data allow scholars to explore how the relative coercive power of the Crown as against Church and nobility shaped the political trajectories of Europe’s early states.
The Castles Data can be used in a wide variety of applications. While we focus mostly on the macro-level in this paper (the share of castles in a territory controlled by the Crown), the data also allow for detailed micro-level studies of state formation, either at the level of the individual castle, at the grid level, around cities, or at some appropriate regional level.
We proceed to discuss the concept of the state and demonstrate the centrality of its monopoly on violence within a territory. Next, we draw on the historiography to explain the role of castles in the power struggle between Crown, Church, and nobility in medieval and early modern Europe. We then detail the data collection and coding process followed by a discussion of the operationalization of “monopoly” and the procedure for aggregating data. Following this, we present a number of validation exercises. First, we show that the Crown’s share of castles reflects historical accounts of state formation in England and that our coding of castle ownership is similar to one done by a medieval historian and castle expert. Finally, we provide three applications of the Castles Data. First, we compare our measure to data on tax revenue, which is a common measure of the related concept of state capacity. Preliminary evidence suggests that, for the case of England, the monopoly of violence preceded the build-up of tax capacity. In a second application, we show that as a measure of the power of the Crown relative to societal actors, the Castles Data can help to shed light on institutional endogeneity. A third application explores the role of coercive capital in urban growth. The last section concludes and suggests avenues for future research.
What Is the State?
Max Weber offered the canonical definition of the modern state: “a human community that (successfully) claims the monopoly of the legitimate use of physical force within a given territory” (Weber, 1991, p. 78). Scholars have since been in broad agreement that the monopoly of violence is, indeed, the distinctive attribute of modern statehood. Tilly refers to the state as simply a “coercion-wielding organization” (Tilly, 1990, pp. 1–2), and Mann speaks of a state which exercises “authoritative rule-making backed up by a monopoly on the means of physical violence” (Mann, 1984, p. 188). Giddens characterizes states as “able to mobilize the means of violence to sustain their rule” (Giddens, 1985, p. 20), while Levi defines it as a “complex apparatus of centralized and institutionalized power that concentrates violence” (Levi, 2002, p. 40). These definitions differ slightly, e.g., in terms of whether the state is perceived as a set of differentiated institutions (Levi, 2002; Mann, 1984), or as a political organization (Giddens, 1985; Tilly, 1990), and in whether they include the requirement that the monopoly of violence be legitimate (Herbst, 2000; Weber, 1991) or not (Giddens, 1985; Levi, 2002; Tilly, 1990). Yet, across almost all definitions, the one common attribute – the “signal characteristic of a state” (Herbst, 2000, p. 21) – is the claim to a monopoly on the means or use of physical force within a given territory.
Weber considered the monopoly of violence to be a necessary condition for modern statehood. 1 As a defining characteristic, the monopoly on violence has discriminatory power. Forms of macro-political organization which lack a monopoly on violence – such as tribes, chiefdoms, and empires – are not states: In tribes, political unity is ensured through the kinship structure without the need for coercion (Crone, 1994). Chiefdoms are also partly based on extended kinship structures and, typically, chiefs cannot convert their rank prestige into permanent, coercive power (e.g., Mann, 1986, p. 63). Empires also do not hold a monopoly on violence within their territories; imperial rule is typically exercised indirectly through local, relatively autonomous elites (Hall, 2011).
Weber did not consider the monopoly of violence to be a sufficient condition for statehood, and the modern state is obviously something more than simply a coercion-wielding organization. 2 Yet other attributes of modern statehood are not as distinctive as the monopoly of violence: the modern state is characterized by “permanent and impersonal bureaucratic institutions” (e.g., Strayer, 1970), but these characteristics can also be found in economic and social organizations, such as firms and the Church, and are therefore not sufficient to distinguish states from non-state actors (Giddens, 1985, p. 10; Mann, 1984, p. 199). It is also true that the modern state is characterized by the right and, to varying degrees, the capacity to tax. Yet this characteristic is also not unique to the state, but shared with, e.g., the Church.
Weber’s definition includes the requirement that the monopoly on violence be legitimate. We exclude this since the Castles Data focus on the formation of the modern state, the process of monopolizing violence, not the modern state after it arose. Legitimacy is the belief by the relevant actors in the rightfulness of a given authority relation. Yet, in the period under consideration, the modern state was “forged with iron and blood” (Herbst, 2000, p. 14) by European monarchs who successfully eliminated or disarmed competing centers of power within a territory. Monarchs’ attempts at disarming the nobility and monopolizing the use of violence were met with resistance. This was the case when monarchs prohibited or razed private castles (as discussed below), and it was the case when monarchs prohibited feuds and duels and the carrying of arms. That monarchs’ attempts to disarm their subjects were met with resistance suggests that the process of monopolizing violence was not perceived as legitimate by non-state actors.
The Castles Data should therefore not be read as a complete measure of statehood. They isolate the feature that makes the modern state distinctive: the concentration of coercive means within a territory. Other attributes (e.g., fiscal capacity, bureaucratic administration, and legal rationalization) may be part of modern statehood. But they are not unique to states, and they often develop after rulers have weakened rival holders of coercive power. The measure is therefore designed to capture one constitutive and distinctive dimension of state formation, not to classify all political organizations as states or non-states. 3
The monopoly on violence is the signal characteristic and, arguably, the only attribute that is truly unique to the modern state. It resulted from a power struggle between rulers, the Church, and the nobility (see also, Blaydes & Grzymala-Busse, 2025; Møller & Doucette, 2022). To trace the creation of this constitutive and distinctive attribute of modern statehood, we use the ownership of medieval castles—fortified buildings that represent investments in coercive capacity. By prohibiting, seizing, or razing the castles of the Church and the nobility, monarchs monopolized the means of coercion. These were the microdynamics that created the modern state.
Castles
In his monumental archaeological gazetteer, Castellarium Anglicanum, David J. C. King, one of the leading authorities on the medieval castle, defined it as “a private fortified residence of king or noble” (King, 1983). Professor R. Allen Brown, medieval military historian, wrote that “castles were not just fortresses but also residences. It is this unique combination of the military and the residential functions which makes a castle, and makes it different from other types of fortification” (Brown, 1980, p. 98). To Somerset Fry, “the castle was a properly fortified military residence, which is as exact a definition as can be given” (Fry, 1980, p. 9). Castles, in short, are fortified residences. 4
Because they were private rather than communal, castles were generally “small, and high” (Bartlett, 1993, p. 65). The medieval castle was built to shelter only the lord or the bishop, his followers, clerks, and knights. As we discuss in the next section, rulers generally tried to limit and control the construction of private fortification; to that end it was necessary to identify when a manor was fortified and when it was not. The criteria often included the depth of ditches, the height of banks and ramparts, the design of walls or the existence of crenellation or battlement (Brown, 2004, p. 3).
The earliest castles were wooden, referred to as motte-and-bailey castles. The motte is a mound, usually with a tower on top. The bailey is an enclosure defended by palisades, which housed the residence of the lord and his entourage. At the beginning of the 11th century, stone castles began to replace the motte-and-bailey castles. 5 The earliest form of stone castle was the donjon or keep, a stone tower of two or three stories with thick walls and minuscule windows. Later keeps were massive towers, and the 12th century was the great century of keep-construction (Painter, 1953, p. 462). In the 13th century, keeps were generally not included in new castles; instead there would be an enclosure with high and thick walls and great towers. Petty nobles would have to limit themselves to a single tower and a small enclosure, but greater nobles often had pleasant stone houses within the enclosure to serve the castle’s residential function (Painter, 1953, p. 462).
The origin of the medieval castle is usually traced to the disorder following the collapse of the Carolingian Empire in the ninth century. This was a period of weak central authority, and Europe was also beset by raiding Vikings, Moors, and Magyars. The lack of public order motivated the construction of private castles by princes and nobles. Particularly in remote and turbulent frontier regions, further from local centers of authority, where “no knight felt comfortable without some sort of fortress” (Painter, 1953, p. 179).
From northern France, the medieval castle quickly spread across Europe – sometimes by conquest, sometimes by imitation (Bartlett, 1993, p. 70). The Norman conquest of England is the canonical example of how the military technology of castle building spread on the back of conquerors. The Normans consolidated their hold of the English territory by appointing sheriffs among themselves and constructing castles from which to exercise their authority (Ertman, 1997, p. 164). In the words of the historian J. G. Pounds: “It is impossible to exaggerate the role of castles in the Norman conquest of this country. The castle became the instrument whereby the Conqueror fastened his grip on England” (Pounds, 1990, p. 7).
German expansion east of the Elbe diffused the new military technology into Eastern Europe (Bartlett, 1993, p. 72). Further east, from the Teutonic and Livonian lands, castles spread to Poland in the middle of the 13th century (Marciniak-Kajzer, 2017, p. 15). Stone castles arrived in Iberia in the 1000s (Ertman, 1997, p. 58), similar to England. Further from its Norman origins, castles arrived later. In Denmark, for example, before the first half of the 12th century “there is no positive proof, written or archaeological, of the existence of castles, either royal or private” (Olsen, 2014, p. 27). In Sweden, the medieval castle was unknown until around 1250 (e.g., Line, 2007, p. 308).
High walls, towers, and moats are defensive structures. Yet castles also served important offensive functions. As mentioned, the castles of the Norman Conquest “were largely offensive weapons used to solidify control over areas seized from the Saxons and the Welsh, and later from the Irish as well” (Hull, 2006, p. 2). More generally, Bartlett writes that “castles were instruments of conquest and it is possible, by mapping castles, to map the effective military expansion of a lordship” (Bartlett, 1989, pp. 33–34). Castles had a commanding presence in the landscape, “dominated the countryside in every way” (Brown, 1980, p. 16), and were an “in-your-face, ever-present enforcer of subjugation and an obvious reminder of feudal obligation” (Hull, 2006, p. xxiii). Inside a castle, a garrison was well-protected, while commanding everything in sight. Castles acted as “offensive staging points”, allowing mounted and armed knights to “conduct sorties and (…) swiftly quell a rebellion” (Hull, 2006, p. 6). They were the strongpoints from which the castle lord controlled the surrounding countryside.
Castles and the Crown
Castles functioned as headquarters for local government whether they were royal or seigneurial. Noble castles could perform this role when the lord had been granted the right by the Crown. Formally, the Crown retained the right to reclaim the grant of feudal authority if the lord did not properly govern the territory in the king’s name, but most of Europe was controlled by lords, who wielded military power, collected rent and taxes, and administered justice as they saw it (Hull, 2006, p. 25).
Royal delegation of authority was not without risk. Allegiances changed, and private castles were a latent threat to the ruler’s power. Thus, rulers tried to strengthen their power by prohibiting private castle construction, conquering private castles, or demolishing them.
An early example is the Edict of Pitres from 846. King Charles the Bald, king of Francia, the Western third of the late Carolingian Empire, issued the edict to destroy all castles built without royal permission. Private castles were an obstacle to royal control and “the villagers suffer many depredations and impositions from them” (Edictum Pistense 864, quoted in Williams, 2003, p. 40). The edict was inconsequential, however; the French king was too weak to enforce a halt on castle construction (Olsen, 2014, p. 16). In England, the Anglo-Saxon Chronicle from 1051 also complained about the encroachment of private castles on royal power: “[castellans] inflict every possible injury and insult on the king’s men in those parts [where nobles have castles]” (Anglo-Saxon Chronicle sub anno 1051, quoted in ibid.). In 1396, the Danish queen, Margrethe I, issued an edict, which also forbade the construction of private castles: “Since little justice has come from the fortifications built up to now, We forbid the building of new castles, in order to restore peace, law and order in the country” (Netterstrøm, 2007, p. 91, own translation). A century later, Edward Coke, the English Chief Justice, maintained that unlicensed castle-building would endanger society. 6 And as late as 1668, the French lawyer and historian, Denis de Salvaing found that the nobles’ castles were “gall-stones in the bowels of the state” (Coulson, 2003, p. 32).
The royal licensing, the bans, and the orders to destroy castles were rarely respected. That is why the noble castles were considered “gall-stones”. To concentrate power, state-making monarchs often had to conquer or raze the castles of the nobility. In France, Henri IV and Richelieu demolished castles “to teach arrogant nobles a lesson” (Tilly, 1990, p. 69). In England, there was a similar slighting of castles and town walls after 1642 – the historian Coulson (2003, p. 32) counts as many as 150 castles and 38 town walls. In Tilly’s words: “In England, the Tudors (…) contained aristocratic violence, and eliminated the fortresses that once announced the power and autonomy of the great English Magnates. [In France], Louis XIII probably tore down more fortresses than he constructed. In subduing magnates, he demolished their fortifications (…) and thereby decreased the odds of any serious future rebellion” (ibid.).
The general pattern was this: Royal castles were the administrative and military strongholds of the realm. Private castles were a threat to the monarch’s effort to centralize power. State-makers therefore generally prohibited private castle construction, conquered or demolished them. It is these historical dynamics that we use to gauge the process of state formation in medieval and early modern Europe. To measure the monopolization of violence, we track the proportion of castles controlled by the Crown over time. 7
The scope of this measure is temporally limited to the period when castles served a coercive function. The medieval castle originated and became militarily relevant around the turn of the first millennium in the disorder that followed the fall of the Carolingian empire. With the spread of heavy artillery around the late 16th or 17th century, the vertical castle wall slowly lost its defensive function. Around this time, which varies by geography, more elaborate and extensive defensive structures, such as the trace italienne, replaced the medieval castle.
The Castles Data
The data are based on geocoded samples of castles across most of Western and Central Europe. We detail the process of data collection and coding, and discuss missingness. In the next section, we provide two operationalizations of the “monopolization of violence”.
Data Collection and Sampling
In many European countries, castles are part of the cultural and architectural heritage and are recorded and listed by public agencies. For about half of the countries included, we identified official registries with online access and geocoded information (see Appendix F for the sources used). For the remaining, we identified privately collected databases, typically run by historians or historical/archaeological societies. In a few cases, the best available data were national lists of castles published on Wikipedia. In total, we identified 28,643 castles across national registries in 17 countries. 8 From each national registry, we drew a random sample of castles. 9
The modern state arose through a process of territorial consolidation, and the countries, whose registries we sampled, were usually composed of a number of historical territories. A strategy of simple random sampling within modern countries is therefore not always optimal. In Spain, for instance, it would leave us with too few castles in the historical territories of, e.g., Aragon and Castile. To “read history forward”, we need to trace the development of the historical polities of medieval and early modern Europe and thus purposefully oversample castles in some areas to ensure a sufficiently large sample. 10
We sampled a total of 7,529 castles across Europe, corresponding to an average sampling probability of 26%. Figure 1 (Panel A) shows the geographical distribution of the sampled castles. Due to oversampling in some regions, the sampling probabilities vary across historical territories. We provide sampling weights to correct for this.
11
Castles data visualized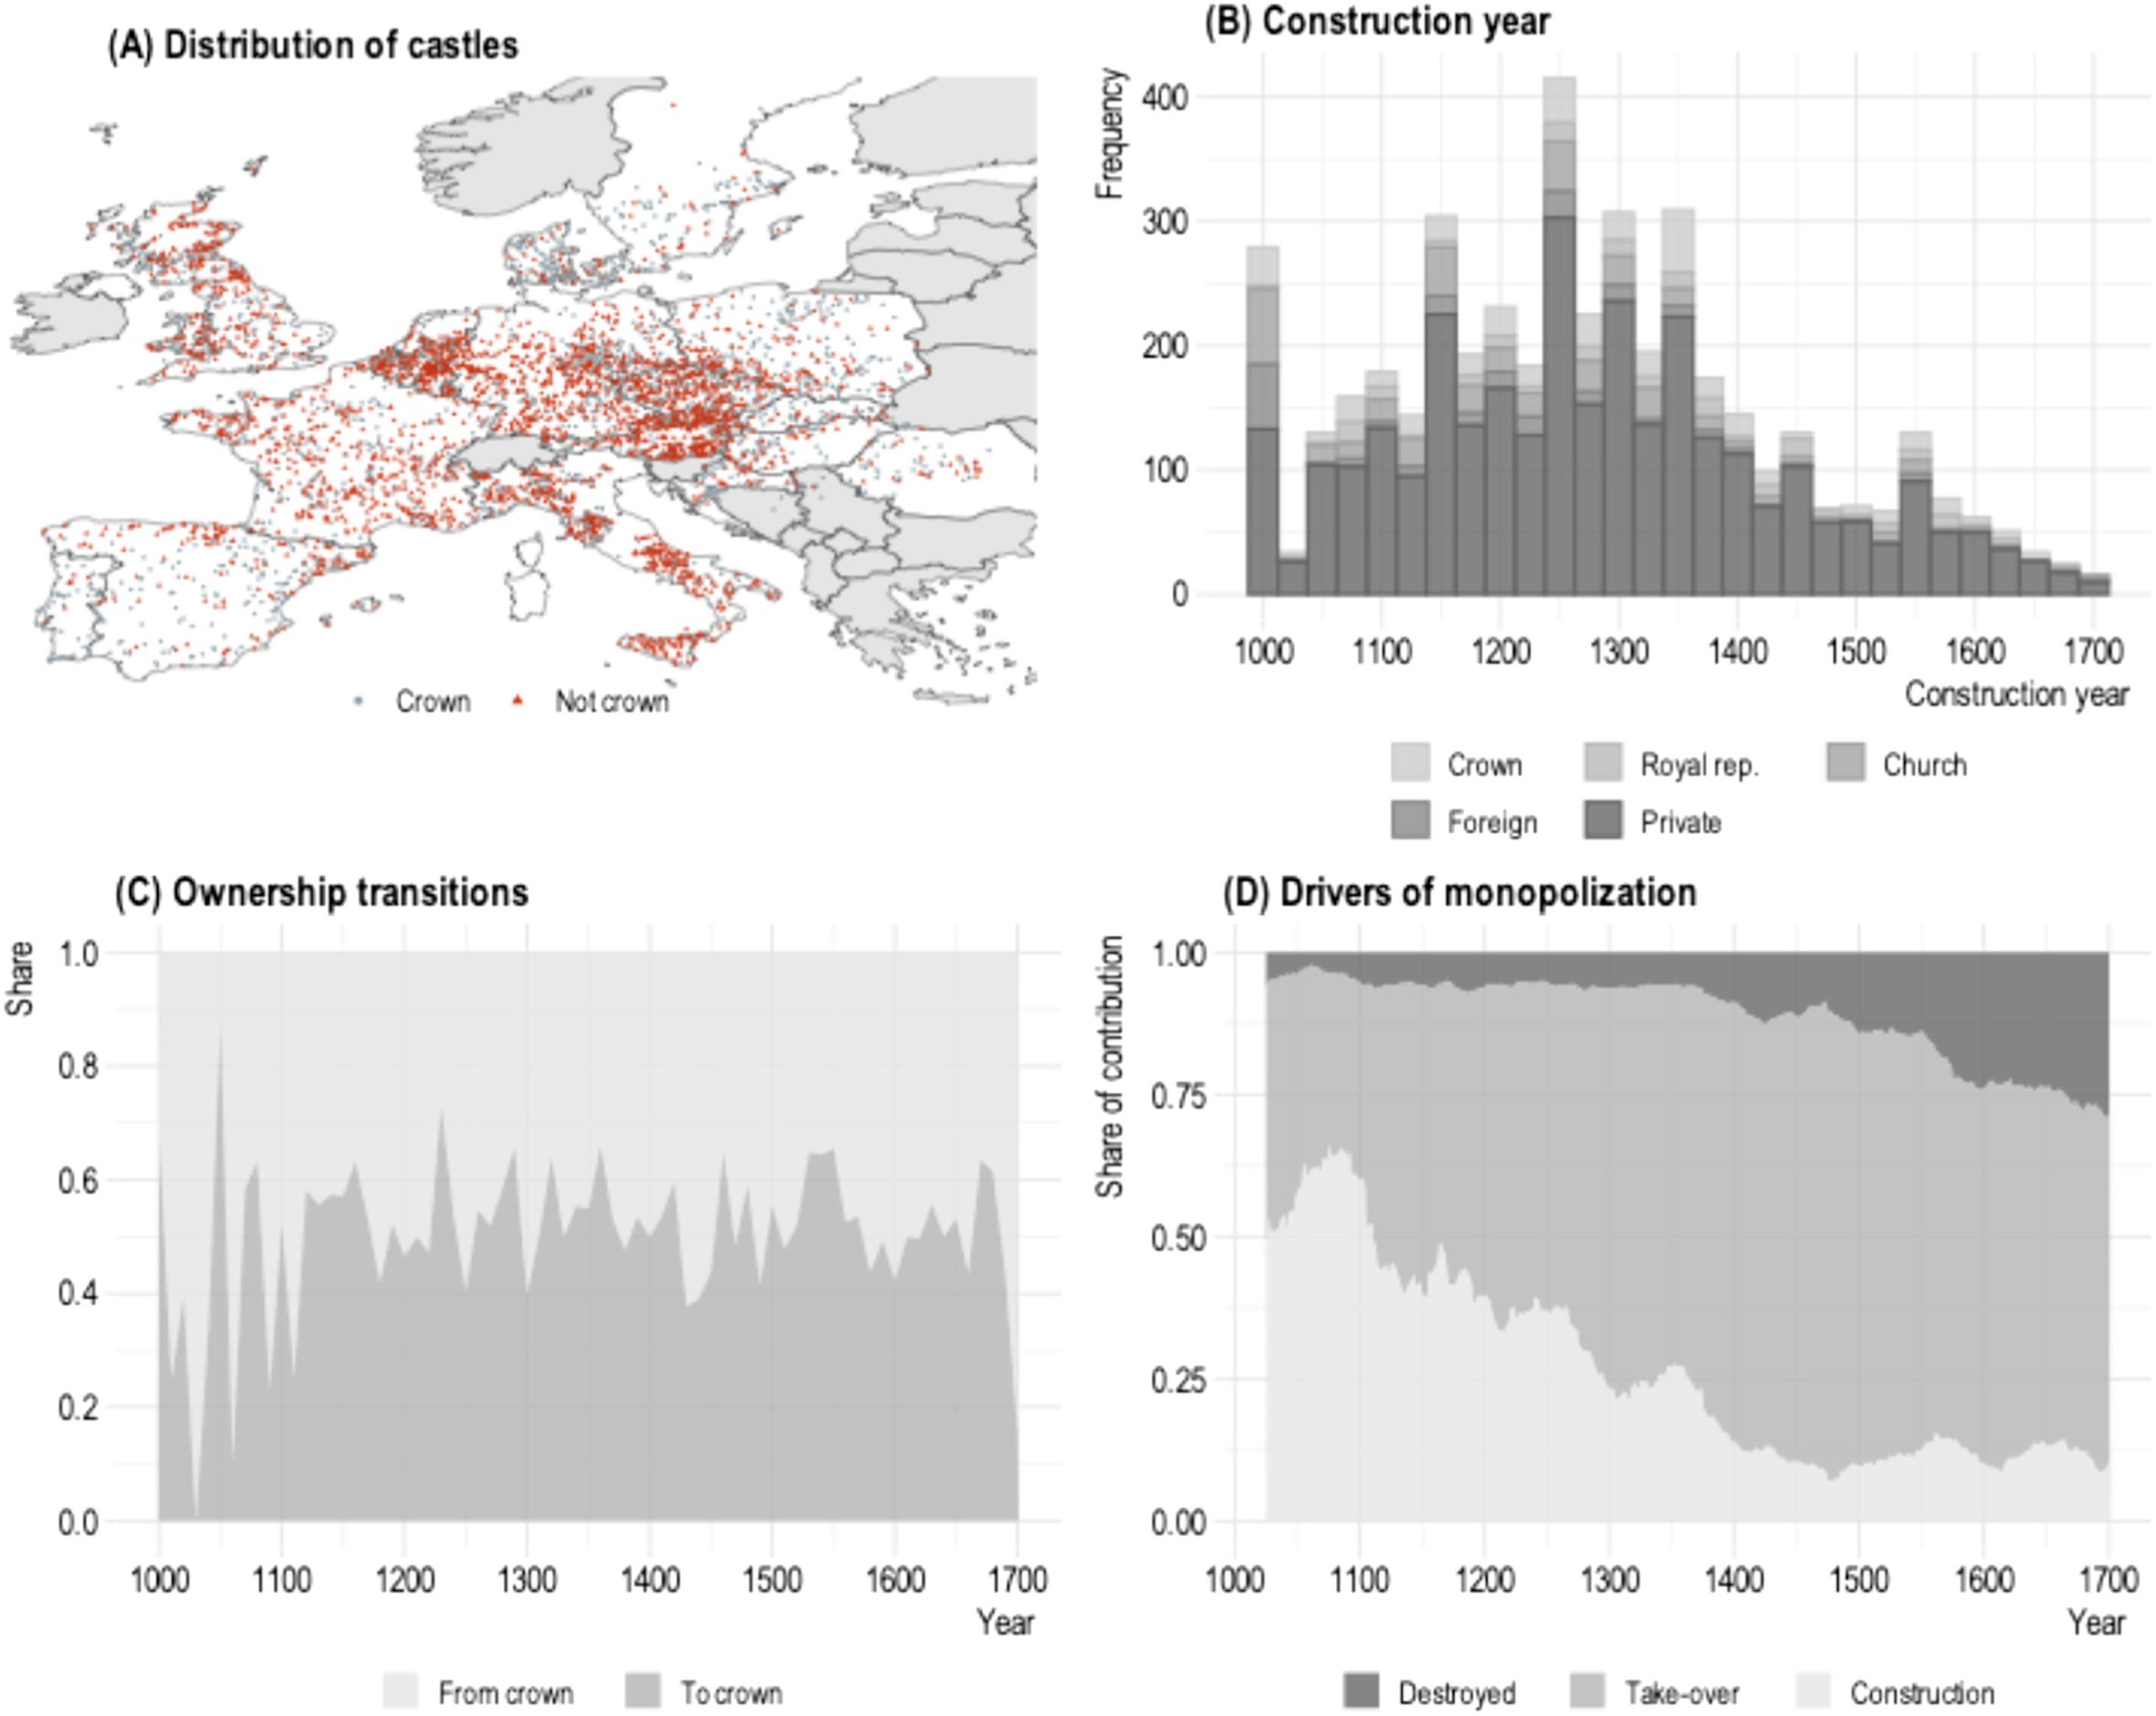
The appropriate use of sampling weights depends on both the unit of analysis and the estimand of interest. For polity-level analyses (e.g., estimating the Crown’s castle share within a polity), random sampling yields unbiased estimates in expectation, and sampling weights are not required. These quantities are ratios, and random sampling preserves ownership proportions within territories regardless of sampling intensity.
For cross-territory analyses, the use of weights depends on whether the estimand is defined over polities or castles. If the goal is to characterize the average monopolization of violence, where all polities weigh equally, sampling weights should not be used; doing so would increase the weight of territories with larger numbers of castles and change the estimand. However, if researchers wish to characterize the Crown share across castles in multiple territories, inverse-probability sampling weights should be used to correct for unequal sampling fractions and deliberate oversampling of particular polities.
When the unit of analysis is castles, a spatial grid cell, or a city’s surrounding area, researchers should generally use the inverse-probability sampling weights provided with the data. In these applications, weighting reconstructs registry-frame castle populations across polities and yields unbiased estimates in expectation of castle-level and grid-level averages and relationships. In settings where spatial density is central, researchers may additionally wish to use the density-based weights to weigh down areas with unusually high sampling intensity. 12
Coding
Following a detailed coding manual (online appendix G), a team of research assistants recorded the history of every castle sampled. The history of castles is generally relatively well-documented by historians and archaeologists. The coding is based on such secondary sources. The RA’s recorded the years of construction and destruction, which define the period of inclusion in the data. If there was no information on construction and destruction, the castle was dropped from the data. The same holds if a structure is not really a castle according to the definition above (we discuss missingness further below).
For each year, we then recorded the ownership history of the castles sampled. We considered five ownership categories: (1) Crown — castles owned directly by the Crown or controlled by caretakers accountable to the Crown; (2) Representatives — castles owned by members of the nobility, who are part of the Crown’s administrative or military apparatus; (3) Private — castles owned by members of the nobility, who are not representatives of the Crown; (4) Church — castles owned by bishops, monasteries, or other ecclesiastical authorities; (5) Foreign — castles owned by foreign monarchs. 13
Castles are coded as Crown if sources state that they are owned by a monarch or administered by caretakers on behalf of the monarch (e.g., by a sheriff, castellan, vogt, or similar). These caretakers were agents of the monarch, unlike feudal lords in general. In England, they held titles such as ‘sheriff’ or ‘castellan’, in Denmark they were called ombudsmand, for instance. The historian Jeppe Netterstrøm uses the term “royal official” to refer specifically to the feudal lords, who administered a royal castle and its territory on behalf of the king (Netterstrøm, 2017, p. 472). 14
Monarchs always relied on a network of allied nobles who took part in the administration of the realm. These nobles typically held positions in the royal court or military, and their castles would generally be of service to the Crown. 15 These are coded as the intermediate category of Representative: castles owned by feudal lords who are members of the Crown’s administrative and military apparatus. These are usually identified by official titles indicating a close connection to the Crown. 16 Our preferred measure of Crown control includes both direct control by the Crown and indirect control through representatives of the Crown.
Castles owned by members of the nobility, who are not otherwise connected to the Crown, are coded as Private. Feudal lords (and bishops) sometimes held castles in fief from the Crown (in return for, e.g., military service), but formal vassalage did not imply royal control, and feudal lords cannot automatically be considered as part of the Crown’s coercive and administrative apparatus. 17 Most fiefs were hereditary and could not simply be reclaimed by the Crown (e.g., Reynolds, 2012). Whether formally held in fief or not, castles of the nobility are therefore coded as private.
Castles owned by bishops, monasteries, or other ecclesiastical authorities are coded as Church. Castles owned by a monarch in some other polity, j, are coded as Foreign Crown if the castle in question is located in territory i. About six percent of the castles sampled are located in cities (operationalized as being within 3 km of a city coordinate). These are coded in accordance with the general rules (e.g., as private when controlled by magnates or by a city council) and identified in the data by a city castle-indicator.
The final data set consists of 5,434 unique castles between 1000 and 1700. Some castles appear only in later centuries, others are destroyed or abandoned (and some are also rebuilt). Hence, the number of active castles varies over time, as evidenced in Figure A1 in the online appendix. The minimum number of castles (415) is in the year 1000 (at which point castles were only beginning to make their entry across Europe), while the maximum (3,789) occurs in 1450. The median castle is constructed in 1250 and disappears in 1680.
The number of castles in our data (5,434) is smaller than the number sampled (7,529). Some observations were dropped because they were not castles, and some castles were dropped when information on construction year or ownership was not available. Section C in the online appendix discusses missingness and survivorship bias.
Figure 1 illustrates the data and some descriptive patterns. Panel A shows the geographical distribution of the 5,434 castles across the 17 countries sampled. The grey dots are castles that were at some point controlled by the Crown, the triangles are those that never were. Across all countries, 43% of the sampled castles were at some point owned by the Crown (including representatives of the Crown). Panel B shows a histogram of construction years by the five ownership categories coded. It shows that the 13th and 14th centuries were the peaks of castle construction. Across all years, the majority of castles built were private. Panel C shows the share of castles taken over or lost by the Crown across all polities from 1000 to 1700. It generally fluctuates around 0.5; about as many castles are taken over as lost by the Crown. Panel D, finally, decomposes the Crown’s monopolization of the means of coercion into castle construction, takeovers, and destruction of castles owned by other actors. The panel reveals that the Crown was strengthened mainly by investments in coercive capacity in the early period, but that conquest of noble and Church castles became the modal way of strengthening the Crown from c. 1200. From around 1500, the Crown began to tear down the castles of the nobility and the Church.
Figure 2 shows the share of Crown castles over time across all of the historical polities included in the data. The data also include 25-year moving averages of all aggregate variables, such as the Crown share shown in Figure 2, to iron out annual fluctuations and allow researchers to focus on long-term trends. Share of Crown castles across Europe. Note. The thin grey line shows the annual share of Crown castles. The thicker dark line shows the 25-year moving average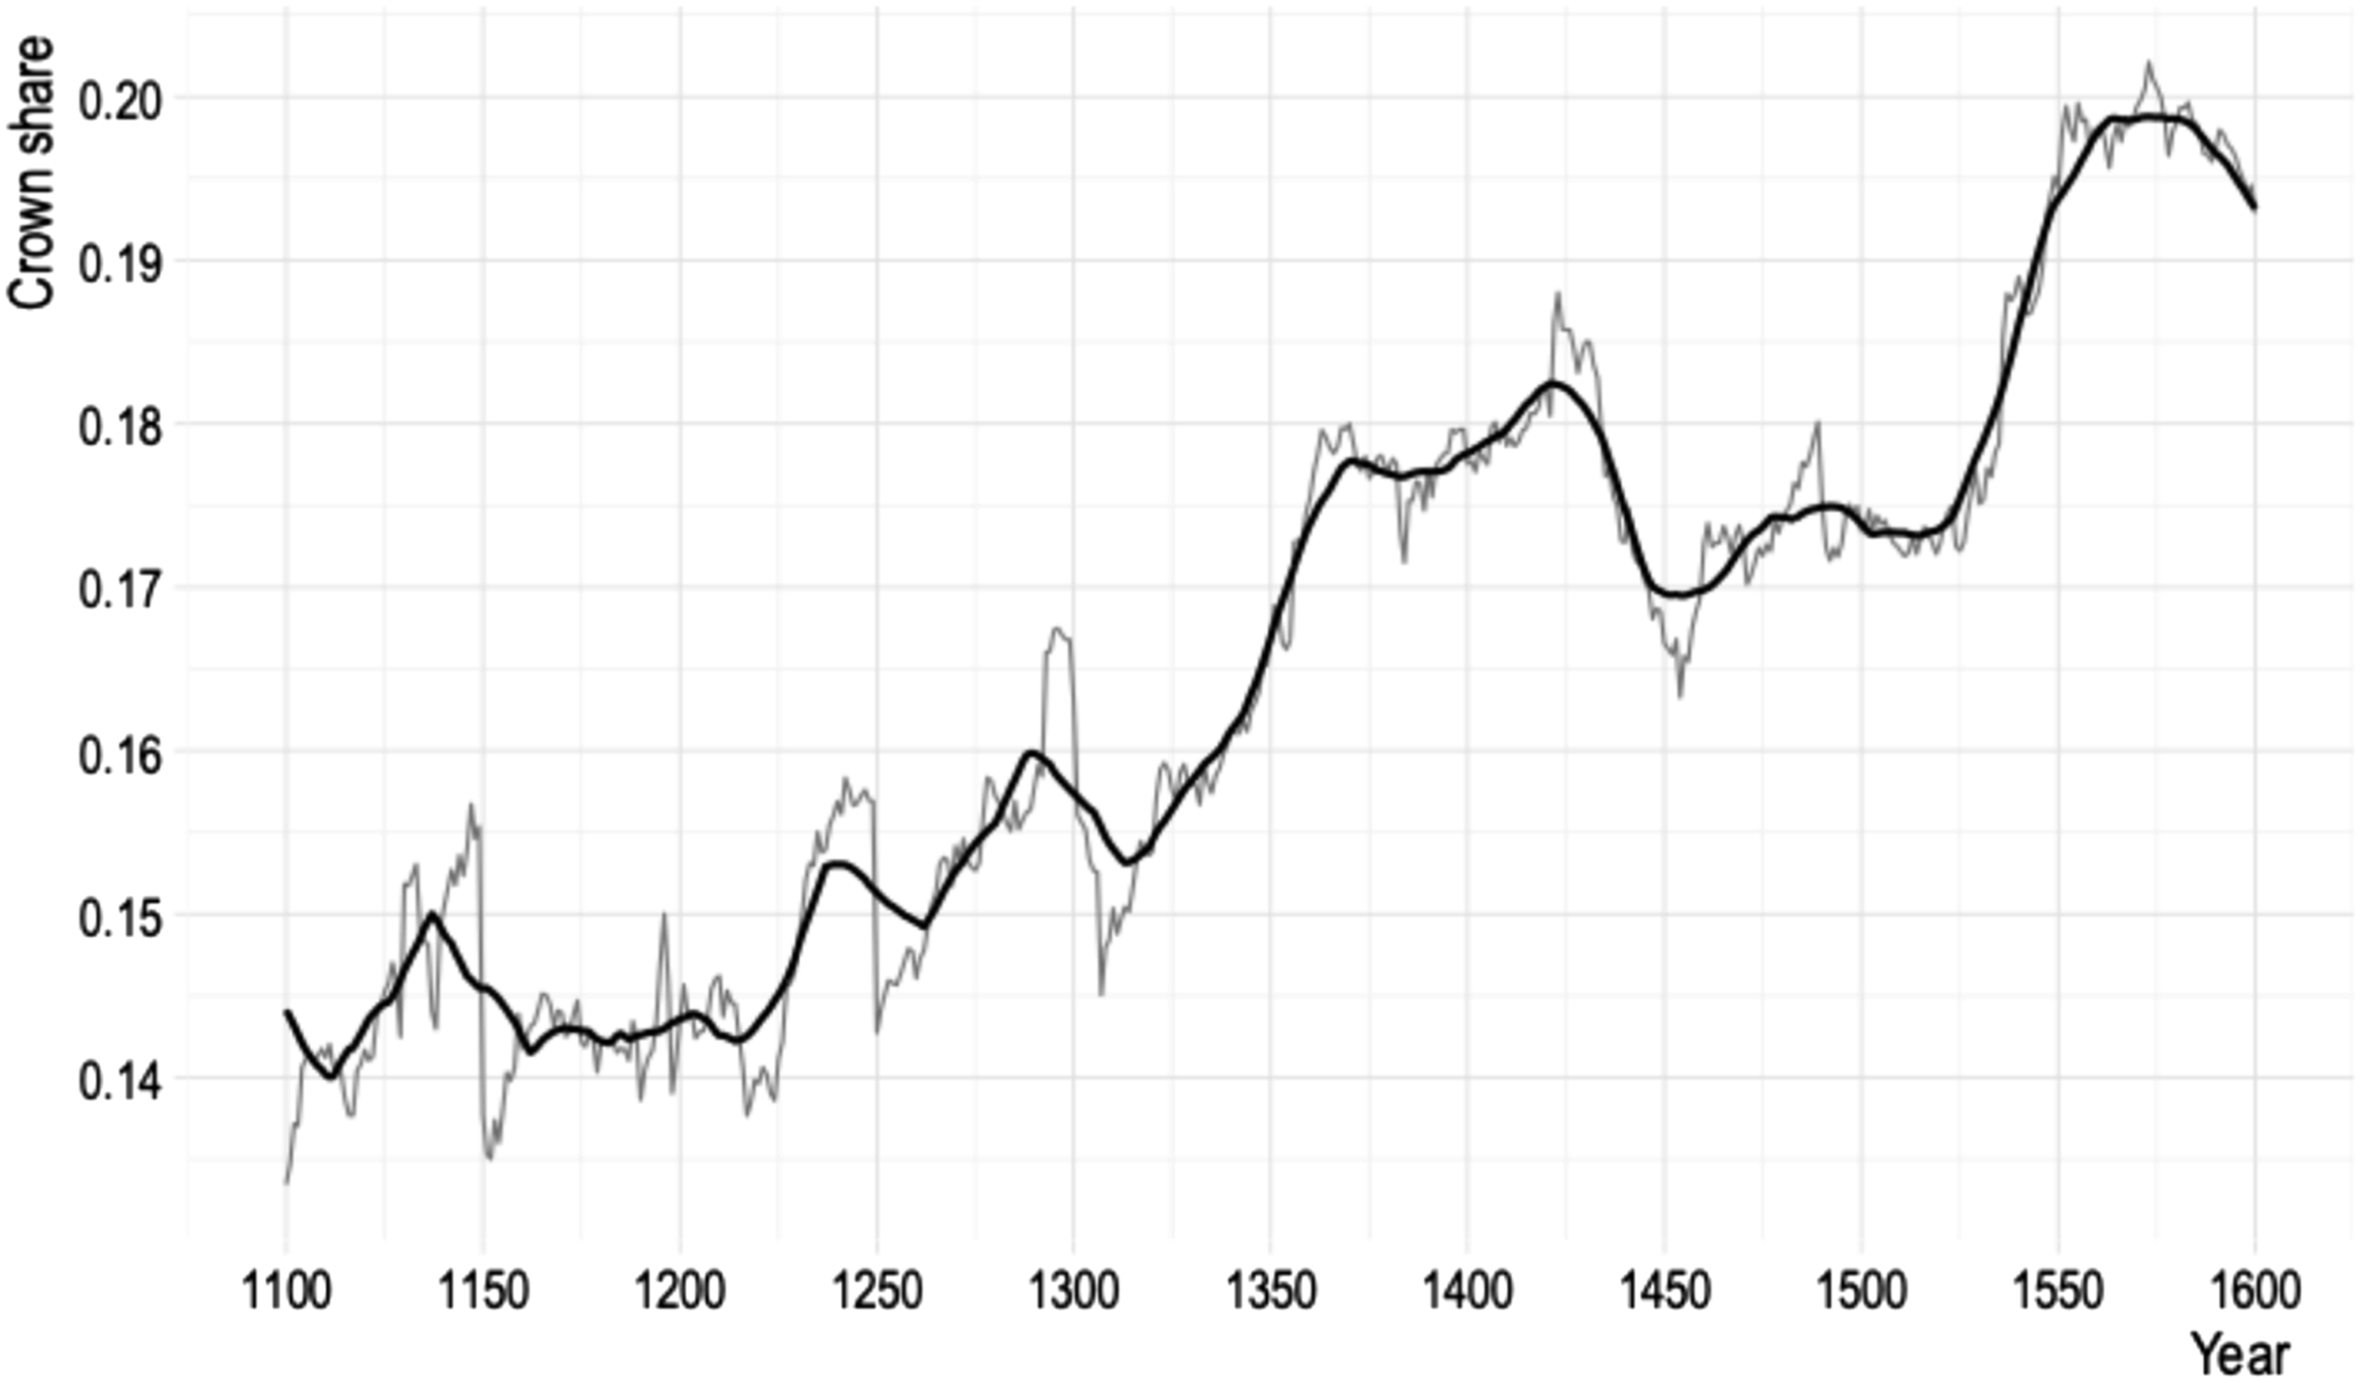
Measuring the Monopolization of Violence
The Castles Data offer unique opportunities to explore dynamics of state formation at the micro-level: when and where non-state actors invest in coercive capacity by constructing castles; when and where state-makers centralize control of this capacity. At its core, however, state formation is a macro-level phenomenon — the monopolization of the means of coercion in the hands of the Crown.
Monopoly is about dominance in a market, and the monopoly on violence can be thought of as dominance in the “market for protection” (Lane, 1958). Medieval Europe did not constitute a single market for protection (Acharya & Lee, 2022). Rather, each polity constitutes its own market, and we assess the Crown’s monopoly power within historical polities over time. To this end, we rely on the Centennia Historical Atlas (Reed, 2016), which covers European state borders for every year since the year 1000. We use a slightly modified version, where we treat territories in dynastic unions as separate rather than as part of the same composite polity. 18
We match each castle to decennial borders of historical political units. Then, for each year, we calculate the share of castles within a given territory that is controlled by the Crown:
It captures the relative concentration of the means of coercion conditional on their existence – not their absolute stock or territorial density. A polity with few castles, but in which almost all are Crown-controlled, exhibits the same monopoly of violence (relative control over the means of coercion) as a polity with many castles and a similar Crown share. The measure, therefore, captures the Crown’s coercive means relative to other societal actors, rather than overall coercive capacity or territorial penetration.
For some years, it is not possible to identify the owner of a given castle. 19 However, since castles owned by monarchs are generally better documented (see section C in the online appendix), we assume that castle-years of unknown ownership are not controlled by the Crown. 20 In section C in the online appendix we also discuss the implicit assumption that castles weigh equally (but may differ in size and strategic importance).
An Alternative Index of Monopoly Power
While simple and intuitive, P ct does not account for the number of other coercion-wielding actors in the market for protection, or the distribution of market shares among them. But the “monopoly power” of the Crown is in practice also a function of the distribution of castles among other groups. A Crown controlling 30% of the castles in a territory, while the remaining castles are distributed among many small competing actors, each of negligible strength, holds considerably more “market power” than when those castles are concentrated in the hands of a single rival. In the former case, 30% may constitute a de facto monopoly on violence. In the latter, it is far from one.
As an alternative measure of monopoly power, we therefore weight the Crown share of castles in a territory by the distribution of castles among other actors. The basic idea is to discount the Crown’s share of castles when ownership of the remaining castles is highly concentrated, i.e., when a single actor controls a large share of the remaining castles. The construction of the alternative monopoly power index is discussed in section D in the online appendix.
Validating the Measure of Coercive Concentration
To demonstrate the validity of the Castles Data and the Crown’s share of castles as a measure of state formation, we first examine whether it accords with historical accounts of the same. We focus on the case of England in the text; similar case studies from Denmark and Sweden are in the online appendix E. For each country we plot the share of castles owned by the Crown and representatives of the Crown, corresponding to categories (1) and (2) detailed in the section Coding above. We assess the extent to which this measure conforms to the description of state formation in the historical (and social science) literature. If the Crown’s share of castles in the cases below increases (decreases) in periods where the historical literature agrees that the state was strengthened (weakened), we treat this as convergent validation of the proposed indicator. For comparison, we show the Crown share (without representatives), the Crown share including representatives, as well as the Crown share including representatives and immediate family in Figure A3 in the online appendix.
Castle Control and State Formation in England
Before the Conquest, the English territory was dominated by a “heptarchy”: the seven kingdoms of East Anglia, Essex, Kent, Mercia, Northumbria (Angles), Sussex, and Wessex (Saxons). During the ninth and 10th centuries, the island was unified under the Wessex kings and the existence of the English kingdom as a single polity is usually dated to this period (e.g., Ertman, 1997, p. 160).
It was this Anglo-Saxon polity that William the Conqueror took over in 1066. The Normans consolidated their hold of the English territory by appointing sheriffs among themselves and constructing castles from which to exercise their authority (Ertman, 1997, p. 164). As argued above, castles came to Britain with the Conqueror. 21
The Norman conquest, according to Downing (1992, p. 157), “made England a more centralized state.” Figure 3 shows that castles were introduced in England with the Norman conquest, and the increased centralization of the English polity is reflected in the abrupt spike in 1066, after which the Crown share of castles rose within only two decades to more than 30%.
22
Following the death of the Conqueror in 1087, war broke out between his sons, Robert and William, over the control of England and Normandy. In the figure, the disorder is marked by the falling Crown share starting in 1087. A second period of decline can be seen during the period known in English history as “the Anarchy” (1135–1153). This period was marked by large numbers of unlicensed, “adulterine”, castles built without royal permission. These were “instruments and durable symptoms of the violence” (Coulson, 1994, pp. 67–8). During the Anarchy the Crown’s share fell from c. 0.25 to c. 0.17. Monopolization of violence in England. Note. The Figure shows the (unweighted) share of castles in England controlled by the Crown (or representatives of the Crown)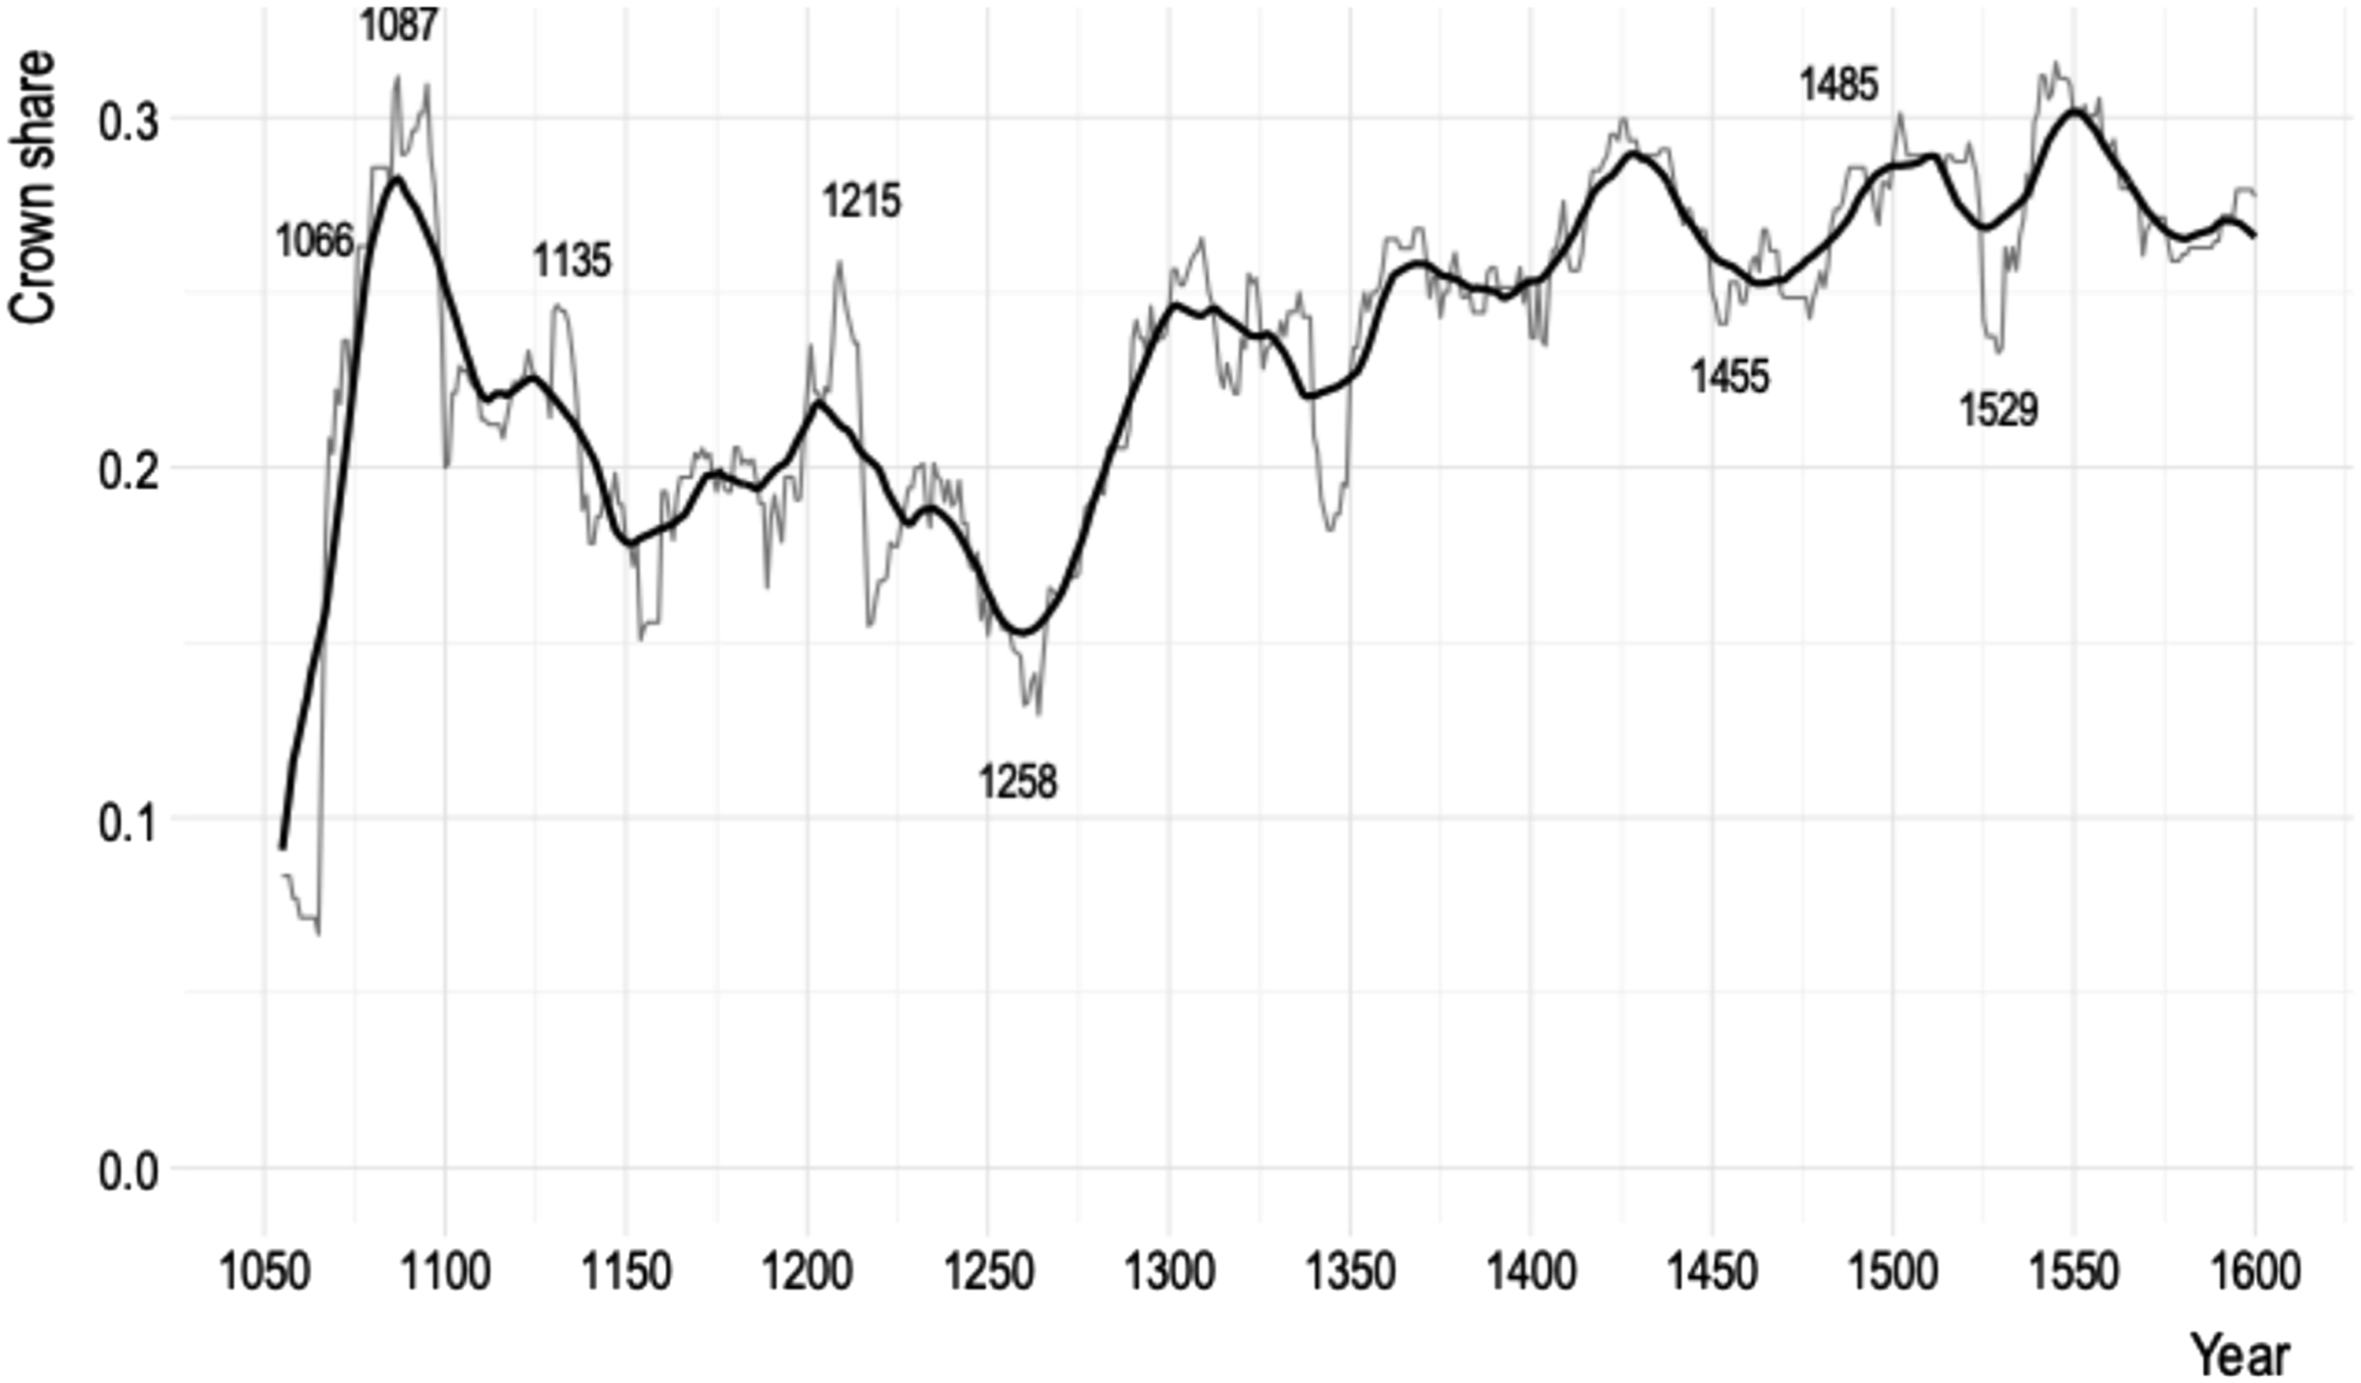
King John Lackland’s reign from 1199 to 1216 culminated spectacularly when the Crown was forced to sign the Magna Carta and recognize the rights of the baronage and lesser nobles at Runnymede in 1215. Before the opposition had coalesced, according to a contemporary writer, John’s rule had been “brimful of evil qualities” (cited in Carpenter, 2018, p. 20), and he took over barons’ land and castles at will (p. 19). His reign is reflected in a gradual increase in the share of castles controlled by the Crown, followed by a substantial decline in 1215—the year the baronage succeeded in placing the Crown beneath the law. The upward trend in our data following the Anarchy and until the Crown was forced to sign the Magna Carta in 1215 is also confirmed by the list and coding of castles done by historian Robert Allen Brown (1959) (see Figure 4 below). Castle control in England 1154–1216, original data vs. Brown (1959). Note. Left panel shows the time series of Crown control 1154–1216 based on (1) our original data and (2) data from Brown (1959). Right panel shows the scatterplot of the two measures (Pearson’s R = 0.81)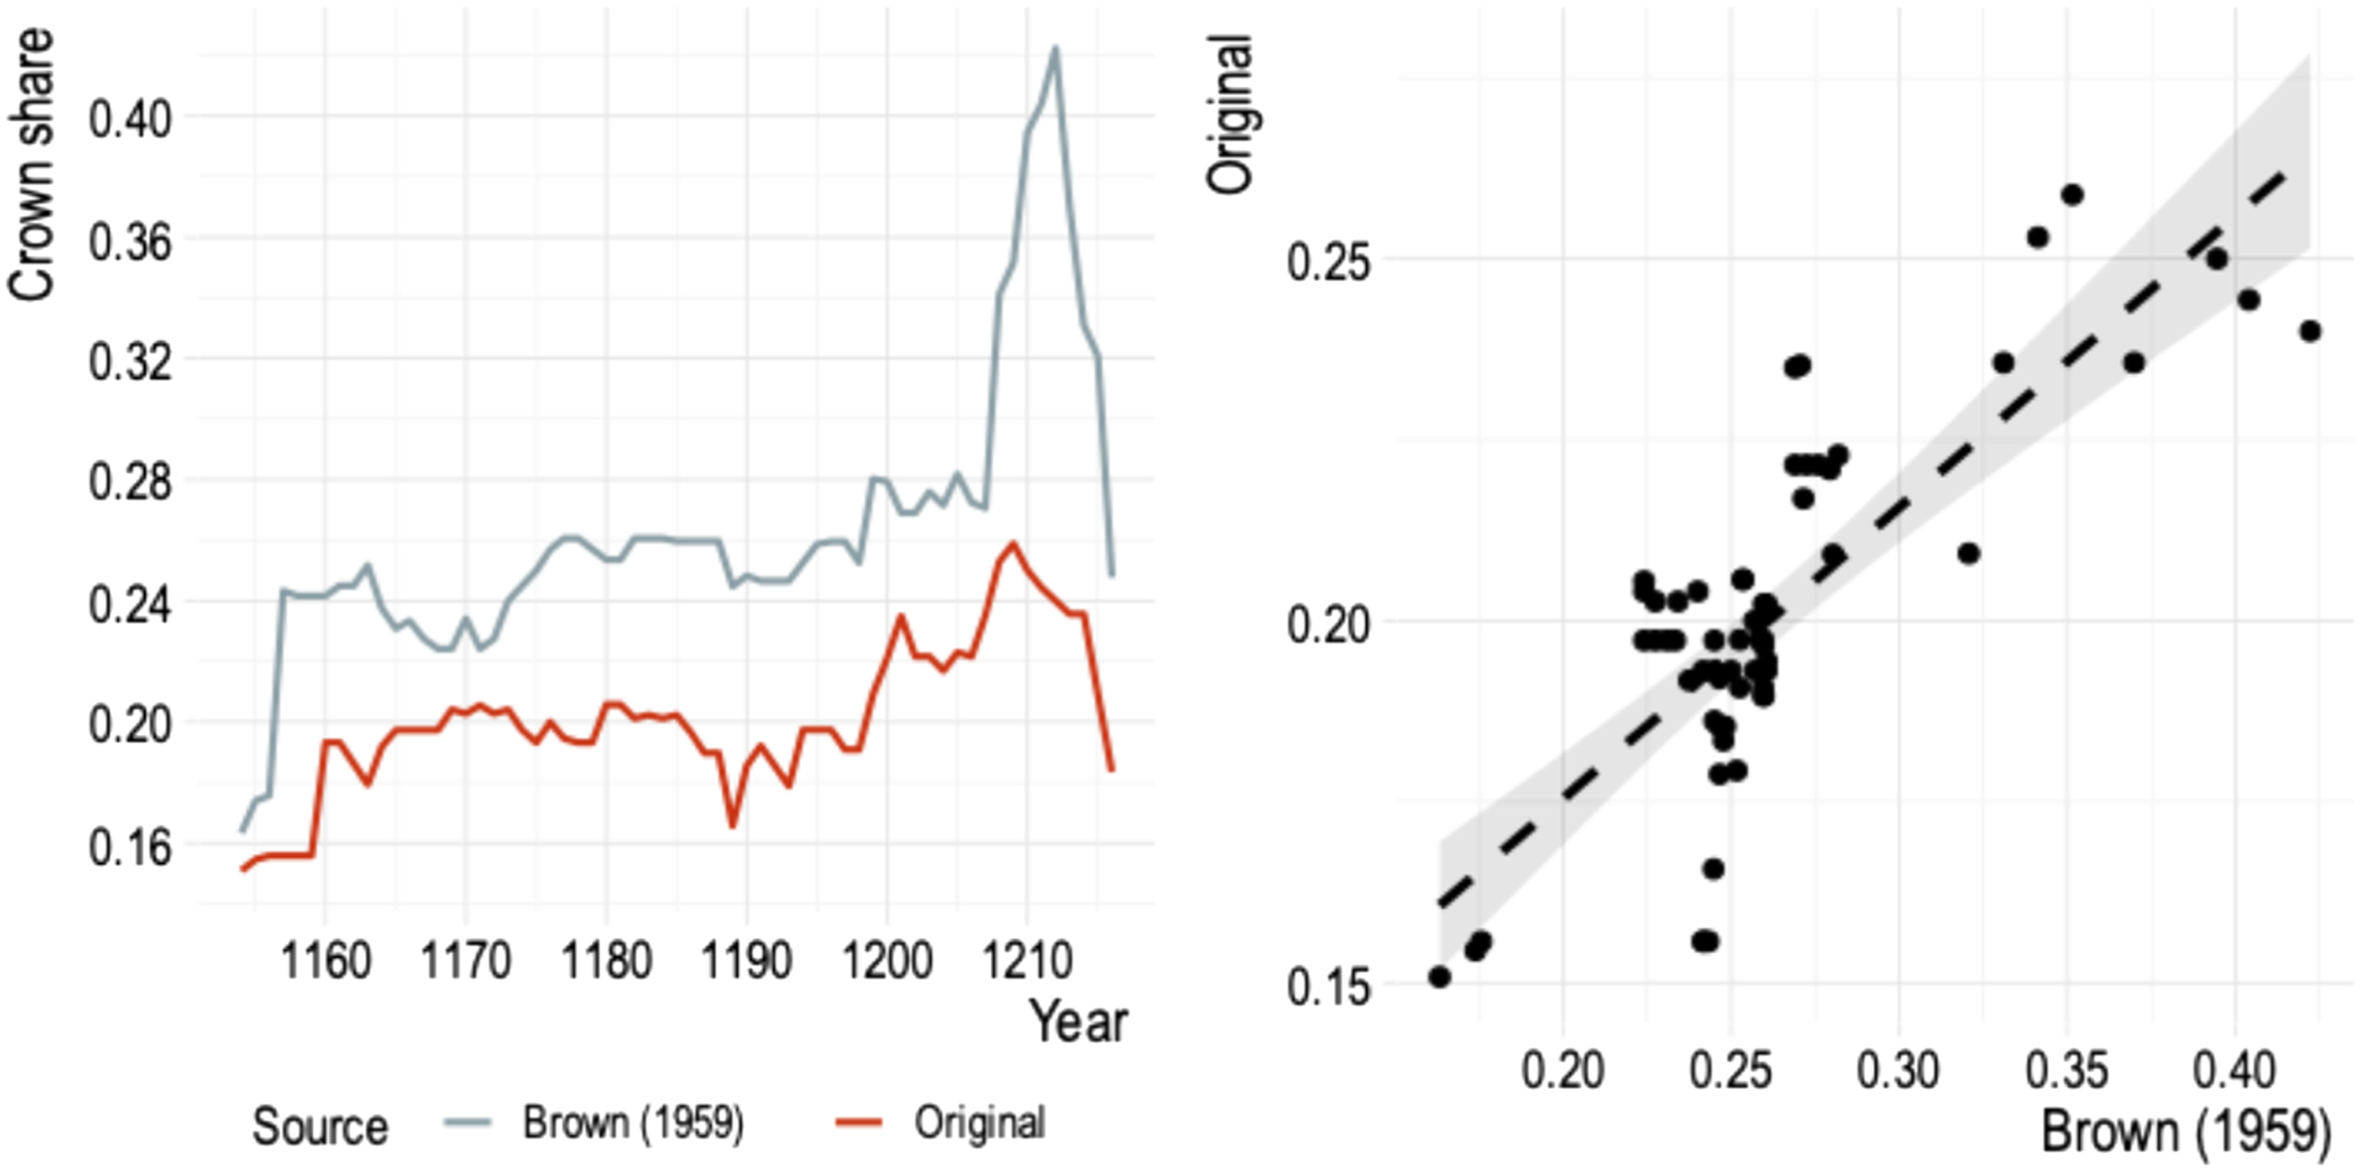
Figure 3 shows a trough in the years from 1258 to 1264. This was the turbulent period of baronial reform and rebellion, which historian Adrian Jobson has termed “The First English Revolution.” It was revolutionary in being a revolt against the Crown, not just King Henry III. The reformers, led by Simon de Montfort, hoped to ground authority in an elected council and achieved as much until king Henry overthrew the baronial regime in 1261. The country descended into civil war, until the Crown won a crushing victory in 1265. King Edward I’s reign (1272–1307), which rebuilt the monarchy and restored castles, is visible in the figure as an increasing share of Crown castles.
The Wars of the Roses can be seen in the figure as the low point in the 15th century. The wars lasted from 1455 to 1486 and were a string of civil wars during the reign of Henry VI, Edward IV, and Richard III.
In 1529, Henry VIII set the English Reformation in motion when he accused his previous chancellor, Cardinal Wolsey, of praemunire – setting the authority of the Papacy above the Crown. The year after, he accused the whole clerical estate of the same, but allowed them to purchase their pardon for a sum “comparable to the annual income of the English Crown” (Shagan, 2002, p. 141). In 1532, Henry obtained a veto over Church law, and in 1534, the King became “the Supreme Head of the Church of England”. He soon used this authority to dissolve monasteries and expropriate their property and lands. Finer (1997, p. 1273) concludes: “[t]hat all this enormously aggrandized the power and authority of the Crown is too obvious to need demonstration.” The state-strengthening effects of the English Reformation are clearly visible in the figure as the steep increase starting in 1529. The upward trend was reversed in 1547, when the brief minority of Edward VI began, and continued downwards with the even shorter, turbulent reign of Mary Tudor (1553–58). Towards the end of the century, the Crown was strengthened under the rule of Elizabeth I.
The Reliability of Coding Practices
To document the reliability of our coding (that different researchers arrive at similar results), we use the list of castles compiled in 1959 by the medieval historian and castle expert, Robert Allen Brown. In an exercise similar to ours, he coded royal and baronial ownership of 325 castles in England for the period 1154–1216. His list is a non-random sample of English castles from written sources and, thus, reflects mostly the more well-preserved and well-documented ones. Still, if our coding practices and sampling strategy are valid, we expect our measure to correlate with that of Brown’s.
We digitized the list from Brown (1959) and compared it to our measure over the same period. Figure 4 plots the two measures. The left panel shows that the share of Crown castles estimated from Brown’s coding is consistently higher than ours. This is expected given Brown’s non-random sampling that likely resulted in a higher prevalence of Crown castles (see also the discussion in online appendix B). Importantly, the two measures show remarkably similar trends over the period. Increases and decreases tend to follow each other closely. The right panel plots the share of Crown castles in individual years from the two castle lists against each other. The correlation between the two is 0.81. This further adds to the reliability of our measure. While the comparison with historical narratives above indicates that the measure captures the process of state formation, the comparison with Brown (1959) lends credibility to the coding practices.
The Monopoly on Violence and State Capacity
Taxation is one of the key tasks of the state apparatus and a central component in the state-making process—higher tax revenues reflect and facilitate greater penetration of society. According to Herbst, “there is no better measure of a state’s reach than its ability to collect taxes” (Herbst, 2000, p. 113). It is natural, therefore, that many scholars have used tax revenue as a proxy for the fiscal capacity of a polity and often also for its overall “state capacity” (e.g., Dincecco, 2009, 2015; Dincecco & Wang, 2018; Harbers, 2014; Thies, 2010). 23
State capacity is conceptually distinct from the monopoly on violence. Capacity, in the sense of Brambor et al. (2019), is the ability to achieve desired ends, and state capacity is then the state’s ability to do so. In some formulations, state capacity presupposes an administrative apparatus with the ability to implement state policies (e.g., Bunce, 2000). Understood abstractly as the capacity to realize ends or in specific operationalizations as either tax revenue or an administrative apparatus, state capacity is not unique to modern statehood. It is certainly important, but not as distinctive an attribute as the monopoly on violence. Empirically, however, the two are likely to be mutually reinforcing: Fiscal extraction is easier when the ruler is relatively strong vis-à-vis societal actors (e.g., Levi, 1988). Similarly, tax revenue makes it easier to uphold the monopoly on violence.
To explore the association between the monopoly on violence and state capacity, Figure 5 shows the Crown’s share of castles (black line) along with total tax revenue in constant English pounds (grey dashed) from Mann (1986) and tax to GDP from the Bank of England (2010). The two tax series have been indexed at 100 in 1172 (Mann) and 1274 (Bank of England), the first year for which data are available. Monopoly on violence and tax revenue. Note. The black line is the Crown’s share of castles, grey lines show tax revenue. The dashed grey is total tax revenue in constant pounds from Mann (1986), the solid grey is tax revenue to GDP from the Bank of England (2010). Series are indexed in 1172 and 1274, first years for which the tax series are available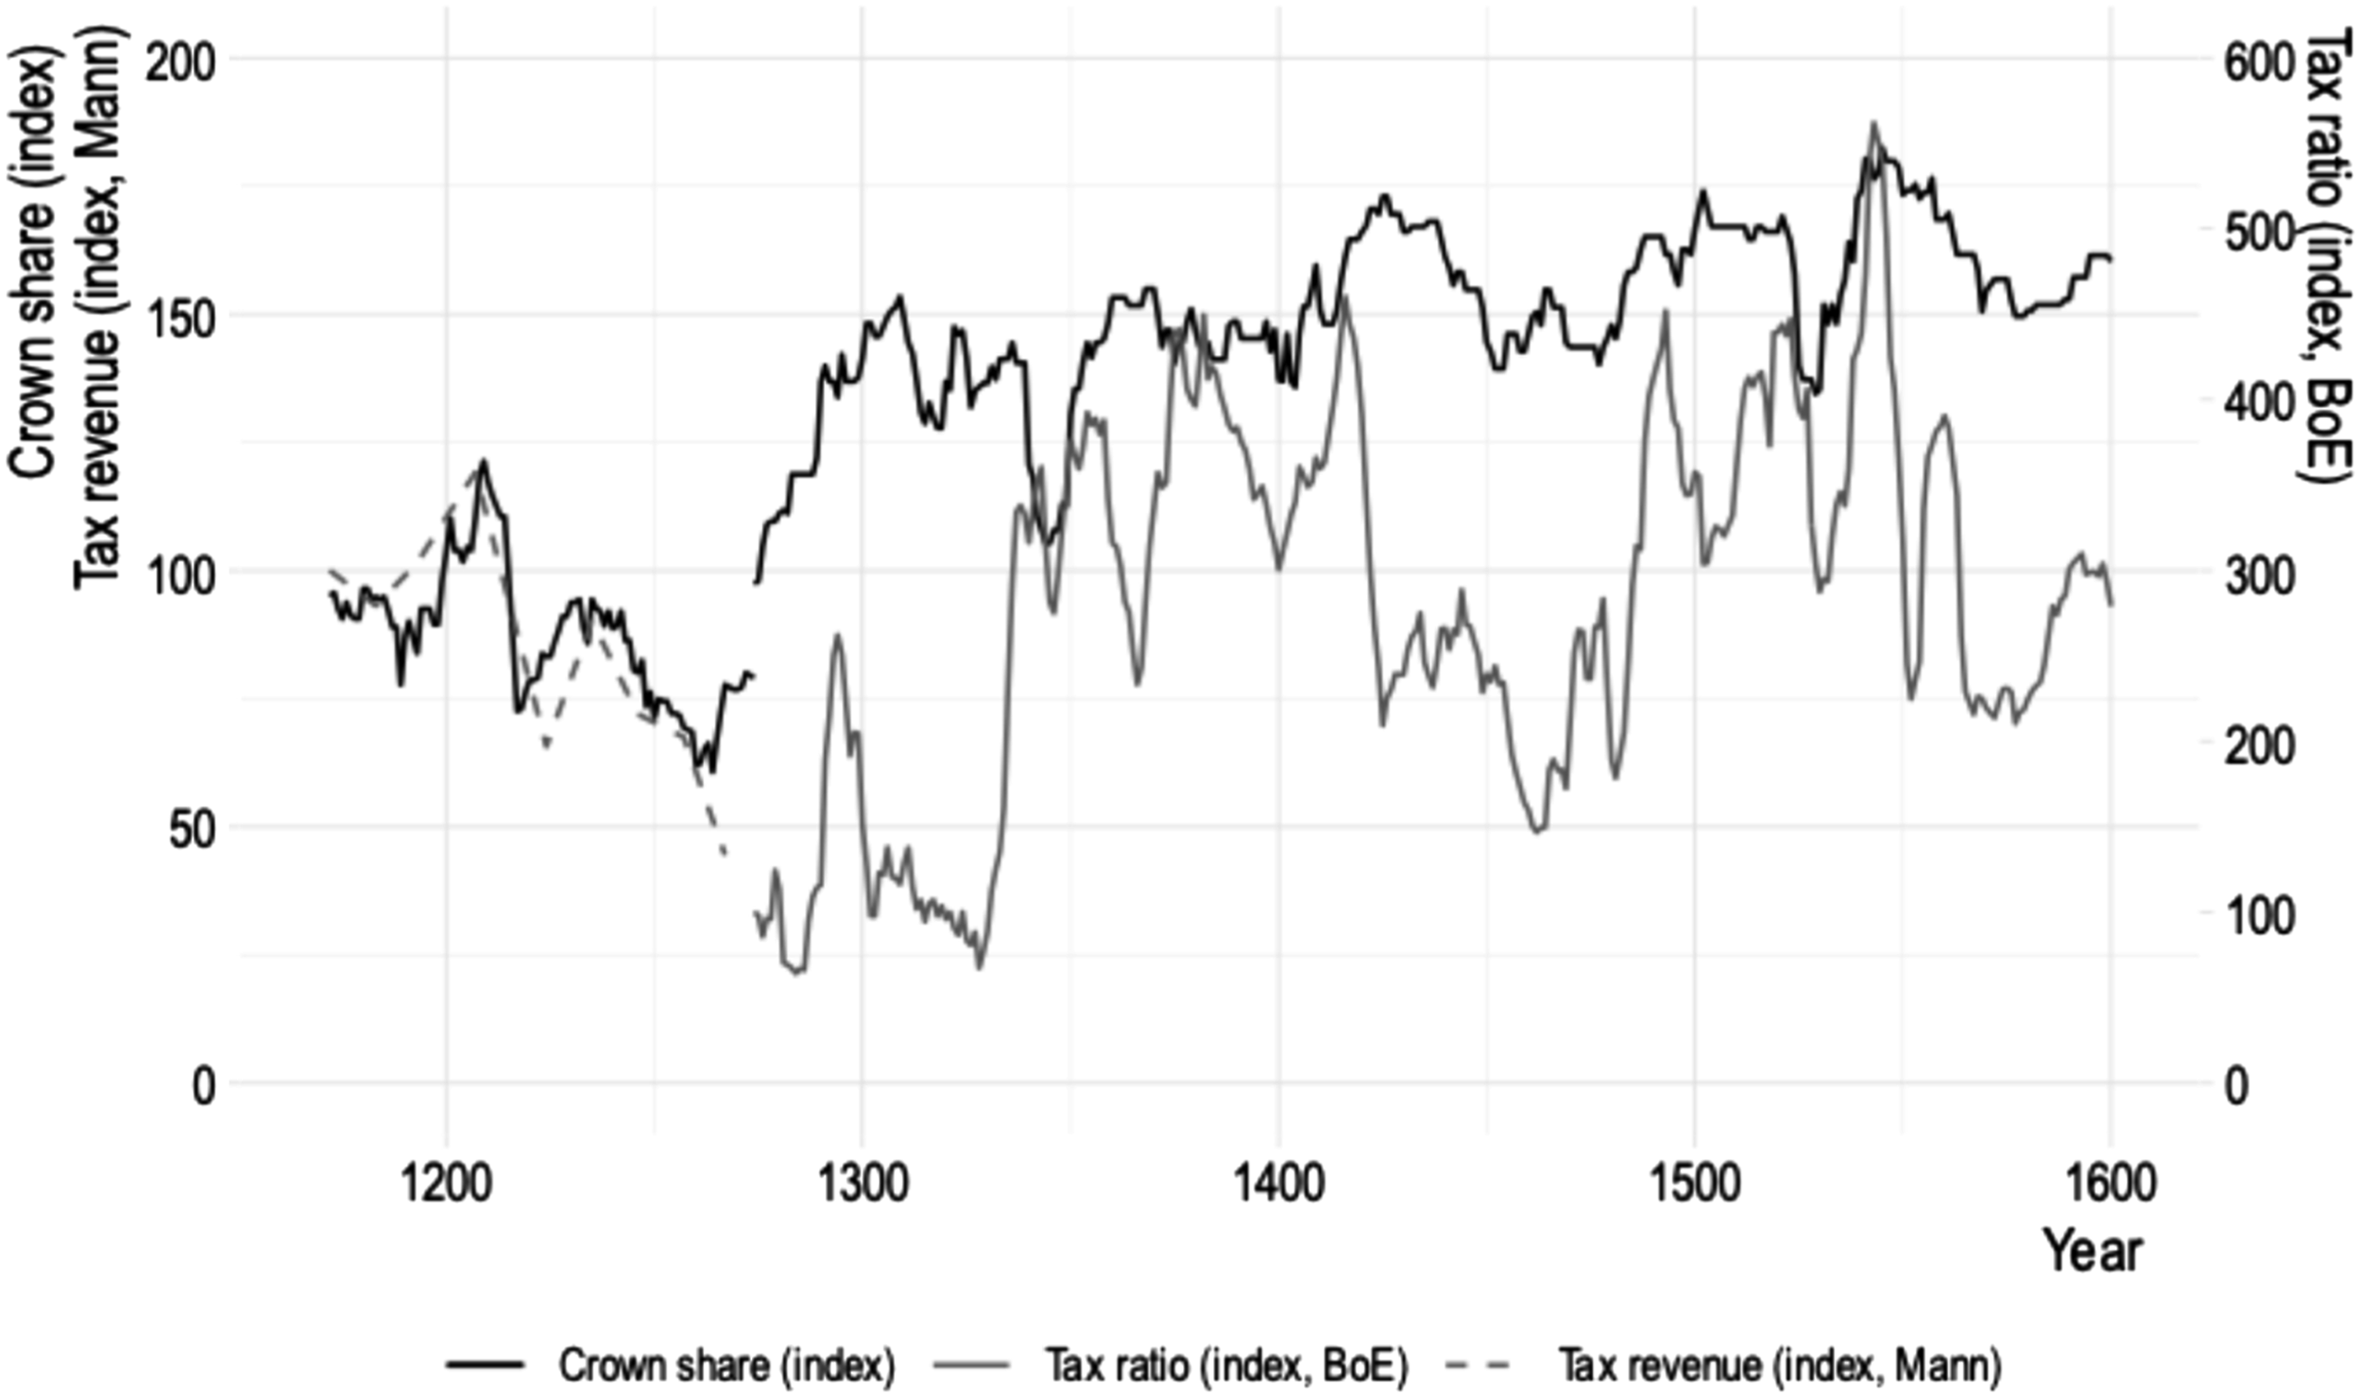
Until the end of the 13th century, the co-movement between the two tax series and the Crown’s castle share is remarkable. Thus, Figure 5 documents that King John (reign 1199–1216) not only took over the nobles’ castles, he also increased taxation, as described in the legend of Robin Hood (e.g., Mann, 1986, p. 426). 24 Following the Magna Carta—whose Clause 41 granted exemptions for merchants for ’all evil tolls, except in times of war’—tax revenue fell. It rose from around 1290 when the tax on movables, which “was paid by more people and brought in more money than any previous tax”, was used more frequently (Barzel & Kiser, 2002, p. 493). In general, there are periods of obvious co-movement (1340–1350, 1400–1415, 1480–1495, 1521–1543) – but also periods of divergence.
Did the monopolization of violence facilitate tax extraction or vice versa? Historical observation suggests the former. Early in the 13th century, king John attempted to transform the scutage tax from a customary one to an arbitrary one under his discretion. Yet, the barons opposed this and “proved that the king did not have the power to enforce this change” (Barzel & Kiser, 2002, p. 487). Similarly, a tax on movables was first imposed in 1188 in England and generated more revenue than any other tax previously imposed. Still, when the Crown was weak, from 1215 to 1290, it was used only seven times. When the power of the Crown had recuperated after the First English Revolution, the lucrative tax was used six times from 1290 to 1304, more than a fivefold increase in frequency (Barzel & Kiser, 2002, p. 493). Also, in the period from 1237 to 1272, when the Crown was weakened, the nobles in parliament refused all (nine) royal requests for new taxes to finance wars (Mitchell, 1951, p. 151). Only in 1285, after the Crown’s power had bounced back, did Parliament consent to new taxation.
Monopoly on Violence and State Capacity
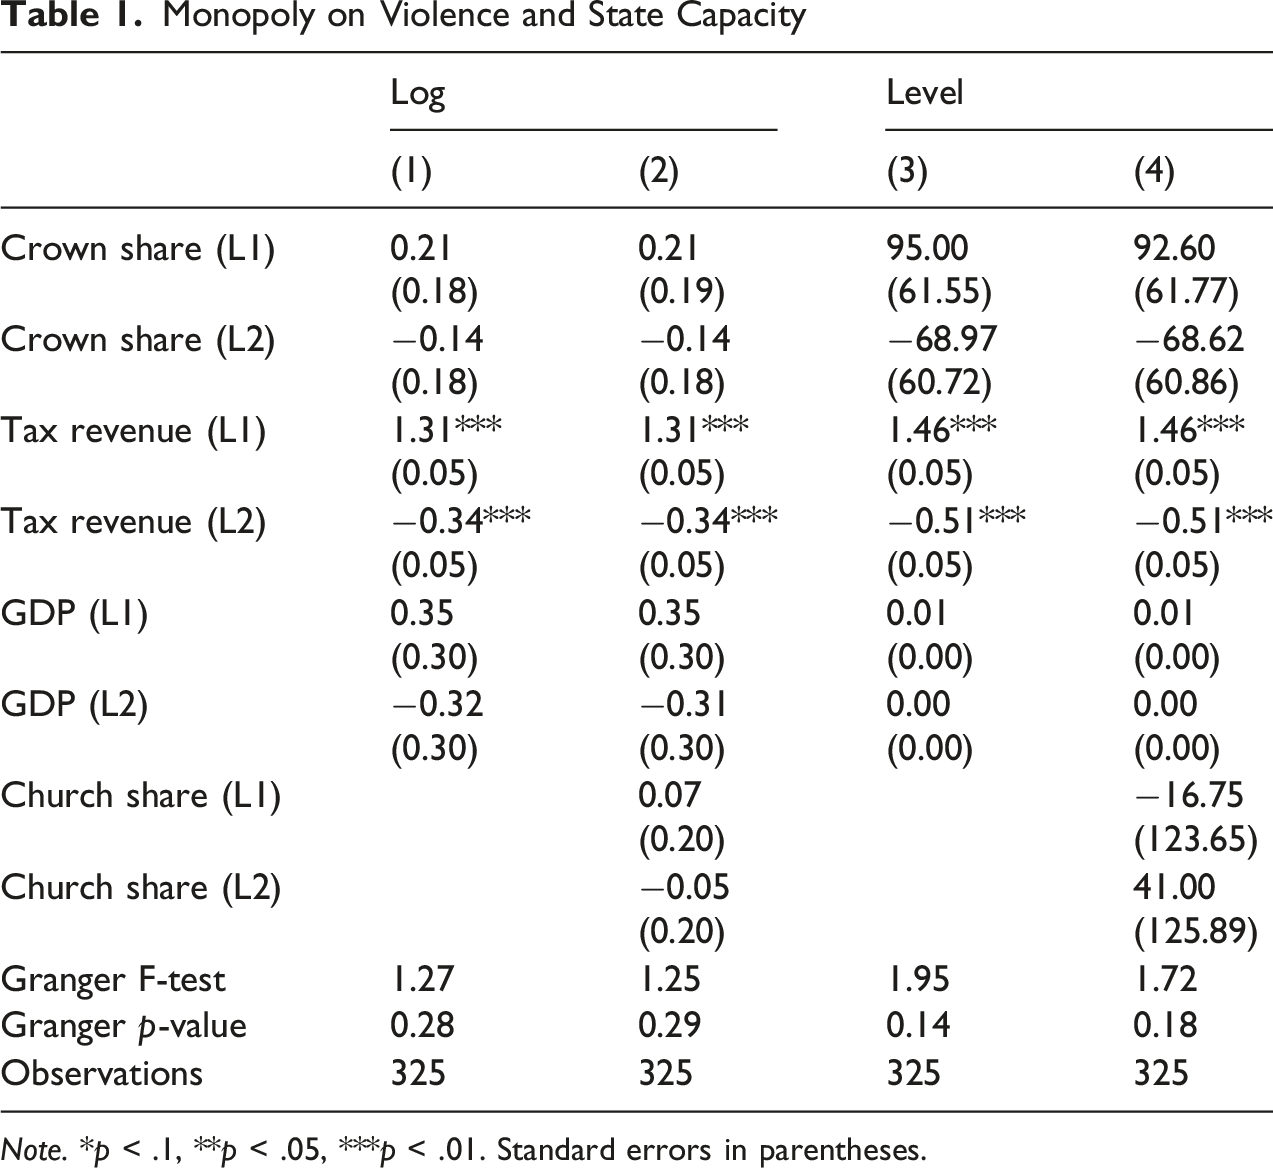
Note. *p < .1, **p < .05, ***p < .01. Standard errors in parentheses.
Crown’s share of castles and GDP (and past values of these). 25 The first row in Table 1 shows that the Crown’s share of castles is positively (though insignificantly at conventional levels) associated with tax revenue in England in the period from 1000 to 1600. The coefficient is almost as large as, and closer to significance, than that of GDP. There is some indication, though again not significant, that the monopolization of violence might Granger cause state capacity, as measured by tax revenue. Granger causality means that past realizations of the monopoly of violence help to predict tax revenue in year t after controlling for past realizations of tax revenue. It does not imply causation as understood ordinarily.
Two Applications of the Castles Data
As a final illustration of the utility of the Castles Data at both the polity- and the micro-level, we revisit two fundamental questions in the social sciences: whether political institutions “matter” or simply transmit underlying conditions (at the polity level), and how coercive power shapes economic activity (at the micro level).
Ruler Strength and Endogenous Political Institutions
Political institutions that constrain rulers and allow for power sharing or political participation, usually emerge when rulers are relatively weak vis-à-vis societal actors. 26 In that sense, institutions reflect an underlying power distribution in society (e.g., Przeworski, 2004, p. 529), and some scholars even see them as “frozen power relations” (Bentzen et al., 2017, p. 679). Political institutions are often created to force rulers to respect property rights, constrain them from unilaterally altering tax levels or securing loans under threat (e.g., North & Weingast, 1989). But if these institutions are created when rulers are relatively weak, perhaps rulers respect property rights not because of the institutions, but because they were too weak to begin with?
Endogenous Institutions and Economic Growth
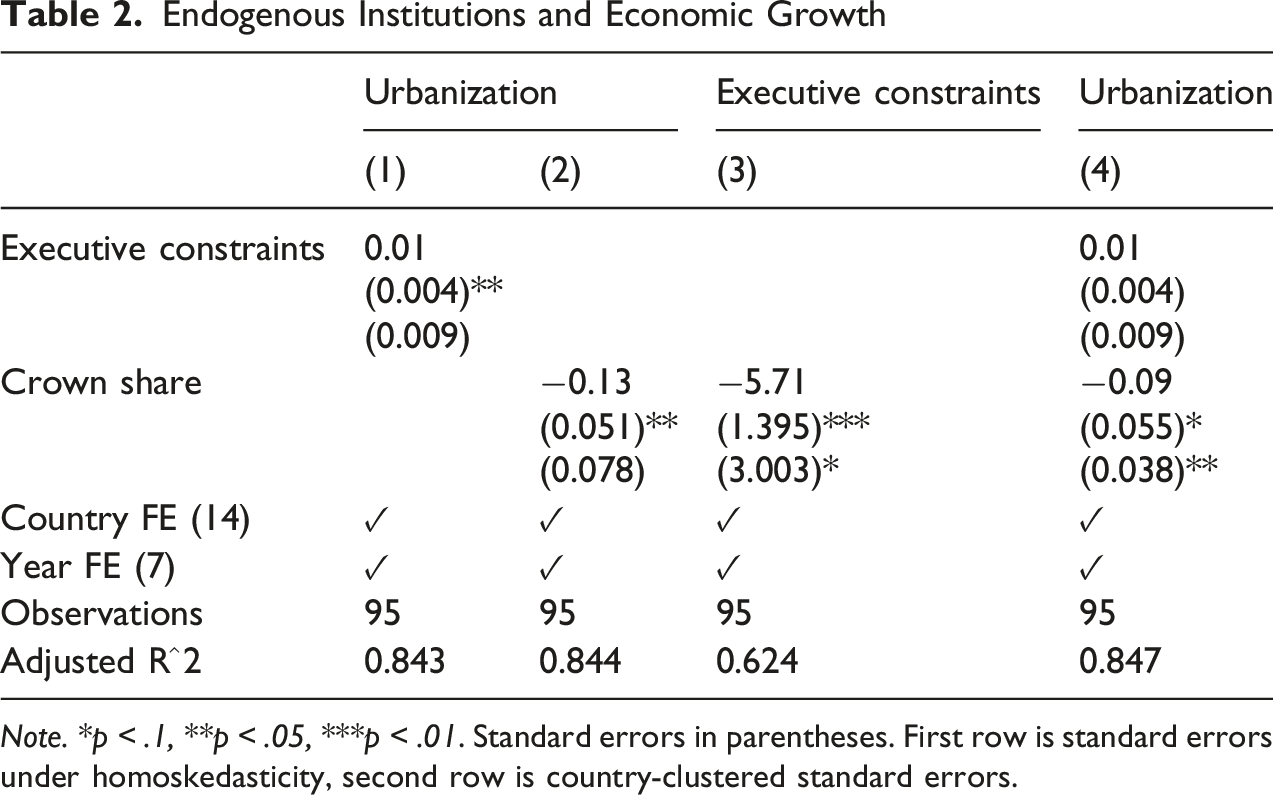
Note. *p < .1, **p < .05, ***p < .01. Standard errors in parentheses. First row is standard errors under homoskedasticity, second row is country-clustered standard errors.
Column (1) shows the positive association between economic development and institutions of constraint: when rulers can credibly commit not to expropriating, economies grow. Column (2) shows a negative association between economic development and the relative strength of the Crown, proxied by its share of castles. When rulers are strong, they are less likely to respect property rights, and growth stalls. Column (3) shows the negative association between the strength of the Crown and institutions of constraint, consistent with the idea that strong rulers do not grant political rights to societal representatives, whereas weak rulers are forced to. Finally, column (4) shows that the positive association between executive constraints and economic development drops and turns insignificant when we control for the Crown castle share.
One interpretation is that institutions, in the words of Adam Przeworski, are “epiphenomenal […], conditions shape institutions and institutions only transmit the causal effect of these conditions” (e.g., Przeworski, 2004, pp. 527–8): When rulers are strong, as measured by the share of castles controlled in a territory, they do not need to respect property rights or allow institutions of constraint. When rulers are weak, they have to accept institutions of constraint and must refrain from expropriation. Institutions and growth, however, are both ultimately caused by the rough balance of power between rulers and societal actors. In and of themselves, institutions are epiphenomenal.
Castles and City Growth
Castles were local seats of authority; cities were engines of growth. How authority affects economic development is a fundamental question in the social sciences, and one that the Castles Data can help inform. On the one hand, the local castle lord could provide order and enforce contracts. On the other, there was a risk of expropriation or even plunder. To explore this question, we identified the castles sampled within a 50 km radius of each of the cities in Buringh (2021) and calculated the average proximity by owner category. This measure increases with the density of castles (by owner) and their proximity to the city. Figure 6 shows the results from models with time-varying controls, city and year fixed effects, and standard errors clustered by city (A), adding territory linearly interacted with time (B), and standard errors clustered at the level of both city and territory (C). The controls included are dummies for whether the city is a capital, has a university, a bishop seat, is self-governed, and a measure of local conflict intensity in the preceding century (see also Table A1 in the appendix, which shows the corresponding regression table with all coefficients, and also includes models without controls). Castles and city growth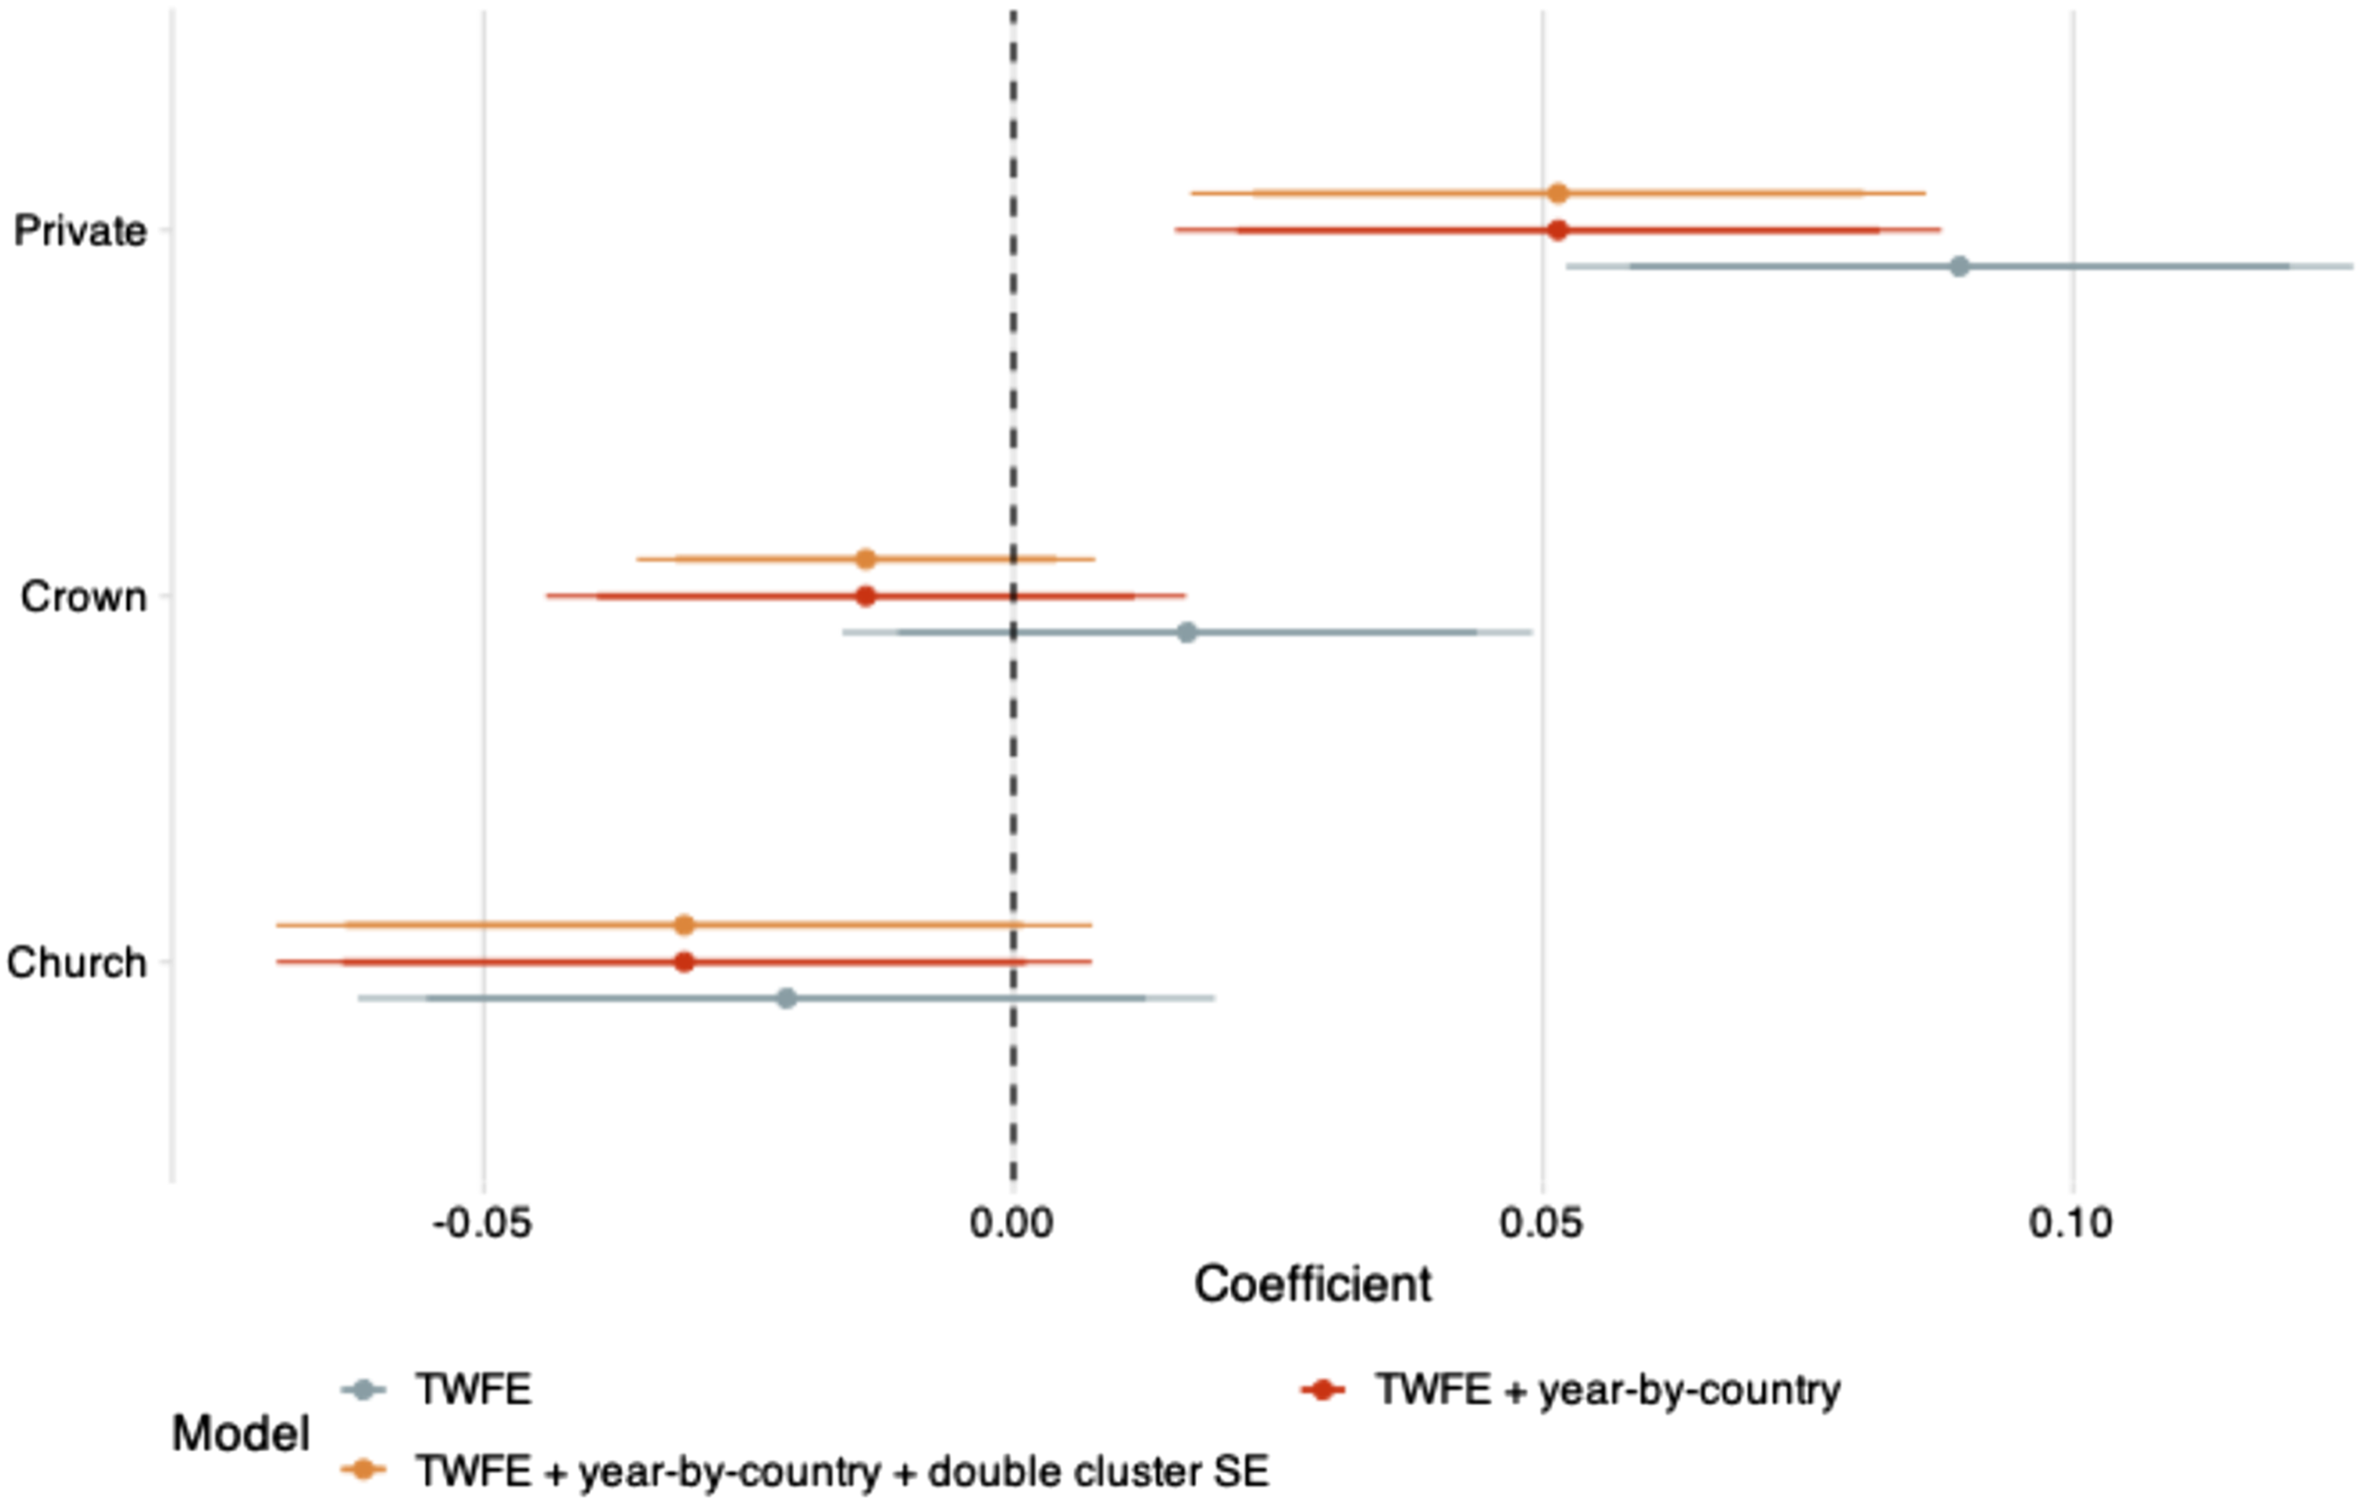
Across specifications, proximity to privately owned castles is positively associated with urban population, while proximity to castles controlled by the Crown or Church is generally unrelated to city size. This pattern is consistent with the idea that the economic effects of local coercive authority depend on how that authority is exercised. Privately owned castles may have contributed to urban growth by providing security and dispute resolution while posing relatively limited risks of systematic taxation or expropriation. In contrast, castles controlled by monarchs or ecclesiastical authorities were often embedded in broader fiscal and administrative systems and thus more directly associated with taxation, tolls, or extraction, which dampened local economic activity.
Conclusion
The modern state emerged in medieval and early modern Europe, in part through a power struggle between the Crown, the Church, and the nobility. To centralize power, the Crown prohibited, seized, or razed the castles of other actors and usurped their means of coercion more broadly. In hindsight we know that the outcome of this power struggle was state formation. It was this process that created “the signal characteristic of the modern state” (Herbst, 2000, p. 21) – its monopoly on the means and use of violence.
The process of state formation has been studied extensively in qualitative scholarship over the past half century, but quantitative scholarship has only recently begun to catch up, probably for want of data. This paper has introduced a data set on the ownership of medieval castles, which allows scholars to trace the defining characteristic of the modern state, the monopolization of the means of coercion, where, when, and as it actually happened – in the power struggle between Crown and societal actors.
We traced the monopolization of violence in the share of castles in a territory controlled by the Crown over time. This measure reflects historiographical accounts of state formation in England, Sweden, and Denmark. For a subset of our English castles, we identified a strong correlation between our coding of ownership and that performed independently by a medieval historian and castle expert in 1959 (Brown, 1959). We also identified periods of visible co-movement between the monopolization of violence and tax revenue in England in the medieval period. Preliminary analyses suggested that changes in the monopolization of violence preceded changes in tax revenue. We illustrated the utility of the data by using the Crown’s share of castles as a measure of the relative power of the ruler as against societal actors. Because this is an important theoretical determinant of countries’ political institutions, we used the data to explore institutional endogeneity. We also explored the fundamental association between coercive power and economic activity, using cities as the unit of analysis.
The Castles Data can be used for polity-level and micro-level analyses, using, e.g., grids, castles, cities, or some appropriate regional level as the unit of analysis. Here, we focused on the polity-level since this allowed for natural validation exercises by comparing aggregate measures to historiographical sources. However, there is obvious potential for applications at the micro-level as well by, e.g., exploring the spatial dynamics of how the Crown was strengthened locally in medieval Europe, how the Crown fortified territorial borders, or how monarchs responded locally to urban developments and demands for urban autonomy. These are interesting avenues for future research, and the Castles Data allow scholars in historical political economy to revisit canonical theories of European state formation and trace the process whereby monarchs eventually succeeded in monopolizing the means of coercion within their territories.
Supplemental Material
Supplemental Material - The Political Legacies of Exile: How Inclusive Reception Policies Shape Refugee Protest Engagement upon Return
Supplemental Material for The State and the Monopolization of Violence: Castles in Europe, 1000–1700 by Christoffer Cappelen and Jacob Gerner Hariri in Comparative Political Studies
Footnotes
Acknowledgements
We are grateful to Frederik Hjorth, Johannes Lindvall, Svend-Erik Skaaning, and Jørgen Møller for valuable comments on earlier versions of this paper. For research assistance, we thank Anders Wieland, Mikko Sørensen, Christian Larsen, Samer Shaker, Astrid Liljegren, Laura Larsen, Søren Bøgh Sørensen, Julie Storm Jørgensen, Kasper Hansen, Eskild Jacobsen, and Maria Lok. This work was supported by the Danish Council for Independent Research under its Sapere Aude Program (Grant 6109-00285A to Hariri). The authors also thank Rasmus Fonnesbæk Andersen with whom the idea for the Castles Data was originally conceived. Replication materials and code can be found on Harvard Dataverse (Cappelen & Hariri, 2026).

Funding
The authors disclosed receipt of the following financial support for the research, authorship, and/or publication of this article: This work was supported by the Danmarks Frie Forskningsfond under its Sapere Aude-program (Grant no 6109-00285A to Hariri).
Declaration of Conflicting Interests
The authors declared no potential conflicts of interest with respect to the research, authorship, and/or publication of this article.
Data Availability Statement
Replication materials and code can be found on Harvard Dataverse (Cappelen & Hariri, 2026).
Supplemental Material
Supplemental material for this article is available online.
Notes
Author Biographies
References
Supplementary Material
Please find the following supplemental material available below.
For Open Access articles published under a Creative Commons License, all supplemental material carries the same license as the article it is associated with.
For non-Open Access articles published, all supplemental material carries a non-exclusive license, and permission requests for re-use of supplemental material or any part of supplemental material shall be sent directly to the copyright owner as specified in the copyright notice associated with the article.
