
Abstract
In a global community with increased immigration and rising sociocultural tensions, there is a need for psychometrically strong instruments that assess adjustment to increasingly culturally heterogeneous environments. The Multicultural Personality Inventory (MPI) is one such instrument, but previous studies have not reported the instrument’s invariance or item-level responses. The present study examined the psychometric properties of the MPI using item response theory, invariance analysis, and structural equation modeling with a sample of 1,194 participants. We found evidence for a 34-item instrument with a bifactor internal structure that demonstrated partial invariance across gender, race, and generational status. Evidence of concurrent and incremental validity of the MPI was established through predicted associations with acculturation, satisfaction with life, social dominance orientation, mental health, color-blind racial attitudes, and self-reported high school grade-point average, beyond any variance accounted for by Big Five variables.
Keywords
Multicultural personality is defined as how well an individual adjusts to a culturally different or evolving environment. We present results on a revision to the Multicultural Personality Inventory, now the shortest instrument that examines multicultural personality in the literature. Multicultural personality is useful to practitioners, instructors, and the general public in helping understand and measure why individuals are able to navigate different cultural milieus at different rates.Significance of the Scholarship to the Public
In 2018, 44.8 million (13.7%) people lived in the United States who were born in other countries, a four-fold increase from the 9.6 million (4.7%) who lived in the United States in 1970 (Budiman et al., 2020). As immigration and migration continue at a rapid pace in the United States, and as racism continues to be an endemic problem, understanding multicultural tolerance and openness remains a pressing theoretical and empirical issue for psychologists. As a result, concepts that examine multicultural tolerance and openness have proliferated in recent years, including cultural intelligence (Ang et al., 2007), cultural humility (Tervalon & Murry-García, 1998), and intercultural development (Hammer et al., 2003). One promising construct, theoretically and empirically, is the multicultural personality (MP), with roughly 80 articles published to date (68 of which are empirical) utilizing samples from the United States, Switzerland, China, the Netherlands, and Italy (see Matsumoto & Hwang, 2013; Ponterotto & Fietzer, 2014 reviews).
MP presumes that one’s ability to adapt to new cultural environments is embedded in one’s personality structure (Ponterotto, 2010; van der Zee & van Oudenhovem, 2000). Personality scholars conceptualize an individual’s personality structure as comprised of several so-called “broad” and “narrow” personality traits. Broad traits (i.e., the Big Five: extraversion, neuroticism, agreeableness, conscientiousness, openness) are stable over time and have small but significant contributions on nearly all of a person’s behavior, from attending a party to starting an art project (Costa & McCrae, 2017). In contrast, narrow traits (such as MP) are embedded within broad traits and are more plastic over time, exerting more influence in specific situations. For instance, MP explains more variance in an individual’s predilection toward seeking out diversity than the Big Five (Ponterotto et al., 2014).
Knowing how well an individual adapts to a new or changing cultural environment is useful to counseling psychologists for a number of reasons. From a clinical practice perspective, knowing a person’s MP could help practitioners understand how a client might cope with gentrification to their neighborhood, how an immigrant copes with living in a different country, or how a first-generation college student might adapt to collegiate life. From a teaching perspective, assessment of MP would assist in courses that examine students’ understanding of the intersection of diversity issues and counseling. For researchers, MP offers a broad theoretical framework that integrates mental health, racial and ethnic identity, social justice activism, and spirituality—constructs inherently of interest to counseling psychologists.
At present, two empirically tested conceptualizations of MP exist. The Multicultural Personality Questionnaire (MPQ; van der Zee & van Oudenhoven, 2000; van der Zee et al., 2013), anchored in personnel and industrial-organizational psychology, was designed with a focus on individuals adapting to markedly new cultural environments (i.e., workers moving to a new country for employment). The second conceptualization of MP—the hygiology model (Fietzer et al., 2019; Ponterotto, 2010; Ponterotto et al., 2014)—focuses on persons adapting to culturally different or culturally heterogenous environments, whether abroad or in one’s home country. Based on an overall wellness perspective and anchored in counseling and positive psychology, the hygiology model posits that those who find the most success in adapting to new cultural environments are those who are highly aware of their racial and/or ethnic identity and socialization, and embrace multicultural encounters and experiences (Ponterotto, 2010).
The hygiology model is based on an integration of theory and research common to counseling psychology, including models of racial and ethnic identity development, the tolerant personality, the universal-diverse orientation, gay and lesbian identity models, and indigenous psychology and spirituality (see Ponterotto, 2010 for details). This theoretical model has been operationalized by the Multicultural Personality Inventory (MPI, 70 items; Ponterotto et al., 2014) and its short form (MPI-SF, 42 items; Fietzer et al., 2019), which have identified seven factors that can be used as subscales: Racial and Ethnic Identity Development (RID), Social Justice Activism (SJA), Psychological Health (PH), Connectedness and Spirituality (CS), Humor (HUM), Opposite Gender and Sexual Orientation Connection (OGC), and Culturally Diverse Friendships (CDF). The MPI is associated with cultural adaptation and altruistic behavior (Fietzer et al., 2016; Fietzer et al., 2019; Ponterotto et al., 2014), authentic living (Reynolds et al., 2019), counselor cultural competence (Fietzer et al., 2018), and pro-social attitudes (Korol et al., 2018) beyond broad measures of personality such as the Big Five. Further, there is evidence of discriminant validity of the MPI (with the exception of the Psychological Health subscale) with social desirability (Ponterotto et al., 2014).
Yet, some questions remain regarding the psychometric properties of the MPI. One is that although there is support for the psychometric robustness of the MPI overall, there is little evidence for the properties of its items using item response theory (IRT), a psychometric approach infrequently used in counseling psychology (Mallinckrodt et al., 2016). The MPI and MPI-SF were developed using classical test theory procedures (see Furr & Bacharach, 2014 for a review). These procedures examine the overall score validity of the test, but the functioning of items is secondary and frequently overlooked. Thus, a major reason to examine the MPI using IRT is that IRT maximizes the information that each item provides at the trait level. Another issue with classical test theory is that it results in two unknown quantities: the latent score on a variable and the error associated with that score, limiting data-model fit estimation. In contrast, IRT models permit data-model fit estimation and therefore provide more precision about how theoretical models measure a given construct (de Ayala, 2009). A third reason to use IRT is that it measures individuals independent of the sample from which they were drawn (de Ayala, 2009), whereas instruments developed using classical test theory are sample dependent. Given that the MPI and MPI-SF were developed using only collegiate samples, re-examination of the original pool of MPI items using IRT would refine the MPI independent of the characteristics of the sample used in the validation process. IRT comprises a family of models that are employed depending on the scoring of the instrument (e.g., dichotomous, ordinal, nominal) and the dimensionality of its subscales (e.g., unidimensional, multidimensional). Because the MPI and MPI-SF utilize Likert-type scales and each of its seven factors are believed to be unidimensional, the graded response model of IRT is most likely to describe the data.
Another validation issue is whether the MPI is invariant across different groups. Given that MP is theorized to be a personality construct universal to all people, the MPI should be invariant across diverse groups, including race, gender, and immigration status. Ponterotto et al. (2014) assessed invariance by examining differences between manifest variables (i.e., means and standard deviations) for the seven factors of the MPI across different racial and/or ethnic groups in the United States. However, manifest variables presume no item error in the measurement of a latent trait—a clearly unrealistic assumption—and so differences between manifest variables do not provide strong evidence of measurement invariance across groups (Byrne, 2012). In contrast, latent variable modeling permits the measurement of each item’s error in addition to the error of the latent trait. Thus, a stronger test of measurement invariance would occur through latent variable analysis (i.e., structural equation modeling [SEM]).
A third issue is that the MPI was developed at a time when variations in gender identity were ignored or minimized in society. As a result, the MPI subscale Opposite Gender and Sexual Orientation Connection is biased in name and in the items it contains by conceptualizing gender as a binary variable, thereby excluding how some individuals conceptualize their gender identity. Such items risk further marginalization of those who identify as outside of the gender binary and may impact their responding (Salomaa & Matsick, 2019). Consequently, this subscale requires inspection of its items and name to be inclusive of all gender identities.
The hygiology model predicts individual differences in how people adjust to culturally heterogeneous or evolving environments. The United States, with a substantial foreign-born population (Budiman et al., 2020), provides an opportunity to evaluate this aspect of the hygiology model with immigrant populations. Immigrant populations are categorized by when a person or their ancestors arrived to the host (United States) culture. First-generation immigrants are individuals born outside of the host country who then move to it later in life. Second-generation immigrants are born in the host country to first-generation parents. Third-generation immigrants are born in the host country to second-generation immigrants, and so on. In the present study, we use the third-generation as the cut-off for determining when individuals are considered as “U.S. native-born” or “U.S. originating.” The population of first- and second-generation immigrants offers a way to examine how well the MPI is able to predict individuals’ acclimation to new cultural environments, since these individuals either directly experienced a change to their cultural environment when immigrating (first-generation) or grew up with parents who immigrated (second-generation). One construct that clearly assesses such adaptation would be acculturation.
To assess acculturation, we used Celenk & van de Vijver’s (2014) model whereby acculturation is comprised of three interacting domains: (a) contextual conditions, (b) individual acculturation orientations, and (c) acculturation outcomes. Contextual conditions include factors of the host society, such as openness toward the immigrant group to which one belongs and tolerance of immigration in general, as well as stable individual differences such as the personality of the individual who is immigrating. Individual acculturation orientations follow the two-dimensional model set out by Berry (1997): a preference to adapt to the host culture, or a preference to maintain one’s culture of origin. Interaction between these two dimensions yields four “types” of acculturation style: integration (adopting the host culture and maintaining one’s culture of origin); assimilation (rejecting one’s culture of origin and adopting the host culture); separation (maintaining one’s culture of origin while minimizing adoption of the host culture); and marginalization (neither adopting the host culture nor maintaining one’s culture of origin). Acculturation outcomes are divided into either internal or external adjustment. Internal adjustment outcomes involve constructs such as psychological health and satisfaction with life. External adjustment outcomes involve life skills necessary to navigate the host culture successfully, such as academic achievement.
Third-generation (and higher) immigrants offer a different opportunity to examine the association between the MPI and adjustment to a changing cultural milieu. Given the increased cultural heterogeneity of the United States over the past decade (Fry & Parker, 2018) and the politicization around this increasing heterogeneity (e.g., anti-immigrant rhetoric; Flores & Schachter, 2018), it follows that third-generation and higher individuals living in the United States perceive a cultural shift in their environment, regardless of whether they embrace such changes. Thus, another test of the hygiology model would examine how individuals who are third-generation or higher react to such changes, with a prediction that those lower on MP are more likely to reject such changes. Two constructs that assess such a reaction are social dominance orientation (Ho et al., 2015; Pratto et al., 1994) and color-blind racial attitudes (Neville et al., 2000).
Social dominance orientation is broadly a measure of an individual’s support for the maintenance of inequality between groups within a society (Pratto et al., 1994). Recent research has found it has two dimensions: support for intergroup dominance (i.e., blatant oppression of other groups) and support for intergroup anti-egalitarianism (i.e., more indirect oppression of other groups; Ho et al., 2015). Researchers found that individuals high in social dominance demonstrate more aggression toward immigrants (Caricati et al., 2017). Further, survey research found that multicultural perspectives moderated the relationship between social dominance orientation and racist attitudes toward immigrants in Canada (Sidanius et al., 2017). Thus, the hygiology model would predict that social dominance orientation—especially the dominant dimension—is inversely related to MP.
Color-blind racial attitudes—the idea that an individual’s race should not matter and is inconsequential to societal outcomes (Neville et al., 2000)—are related yet conceptually distinct from social dominance orientation (Worthington et al., 2008). Because children in the United States are taught that the United States was founded on egalitarian principles, many individuals in the United States have likely internalized that outright racism is undesirable. However, some individuals may acknowledge this egalitarianism not by welcoming the diversity that other cultures bring, but by minimizing cultural differences between peoples. Such “color-blind” individuals would have more difficulty adjusting to any increased racial heterogeneity in their community as it would highlight race and its relationship with the opportunities afforded people within society. Therefore, we would also expect color-blind racial attitudes to be inversely related to the hygiology model of MP.
Finally, the hygiology model predicts that mental health is a core component of MP, operationalized by the subscale Psychological Health. As a result, another test of the hygiology model would be to examine whether the mental health of both target populations is associated with the MPI, with higher psychological health being associated with higher scores on the MPI (in particular the Psychological Health subscale). To date, no studies have examined this aspect of the hygiology model, so such information would provide evidence for the validity of the construct.
The Present Study
The purposes of the present study are to examine: (a) the properties of the MPI items using IRT; (b) whether the MPI is invariant between multiple demographic pairings, including gender, race, and immigration status; and (c) evidence for the construct validity of the MPI across samples of first- and second-generation immigrants (the U.S. acculturating sample) and third-generation or higher individuals (the U.S. originating sample). Study hypotheses are as follows: (H1) in IRT analyses, a graded-response model will best fit the data for the MPI-SF. (H2) The MPI will not vary in factor structure across populations. For the U.S. originating sample: (H3) social desirability will not be related to multicultural personality with the exception of the Psychological Health subscale, consistent with findings from Ponterotto et al. (2014). We predict that (H4) social dominance orientation and (H5) color-blind racial attitudes will be inversely related to MP. (H6) We predict that the Psychological Health subscale of the MPI will explain the most variance in mental health. For the U.S. acculturating sample, we hypothesize that MP will be positively associated with (H8) acculturation, (H9) life satisfaction, (H10) and achievement in high school, and negatively associated with (H11) mental distress. Finally, we hypothesize that (H12) MP will explain variance in these variables beyond the variance explained by broad personality traits (i.e., the Big Five).
Method
Participants
We recruited from two populations, with a total final sample of 1,194 participants. Six-hundred and sixteen (51.6%) participants were recruited from Amazon Mechanical Turk (AMT; an online web service platform that permits users to complete tasks set by requesters), and 578 (48.4%) participants were from a research participant pool (RPP) in a school of graduate education located in the Northeastern United States. Age for the total sample ranged from 18 to 85 years old (Mage = 34.5, SD = 13.0, median = 30.0). The sample was predominantly female (72.1%), White (57.3%), and heterosexual (86.6%). Participants self-described as able in terms of disability status (94.3%). Two-thirds of the sample self-identified as having been born in the United States (66.7%).
The demographics of each subsample largely mirrored those of the overall sample. However, the AMT sample (M = 40.4) was significantly older than the RPP sample (M = 28.1), t(1,165) = 18.38, η = .22. Gender was significantly different by group, χ2(3) = 39.43, with the AMT sample having nearly twice as many males as the RPP sample. Race was also significantly different, χ2(8) = 145.12, with the RPP sample demonstrating more diversity across different racial groups, although White people were still a plurality. Finally, immigration status was statistically different between groups, χ2(2) = 154.15, with most individuals from the AMT group self-reporting as having been born in the United States, whereas the RPP group had slightly more individuals identifying as having been born outside the United States.
Materials
Multicultural Personality Inventory-115
The Multicultural Personality Inventory-115 (MPI-115) is the total item pool developed for the MPI and MPI-SF as described in Ponterotto et al. (2014). Items were designed to assess the hygiology model of multicultural personality (Ponterotto, 2010) and use a 5-point Likert-type scale, with anchors at 1 (disagree strongly) and 5 (agree strongly). Principal components analysis and confirmatory factor analysis (CFA) found evidence of a seven-factor correlated traits model (Reise et al., 2010) comprising 70 items (Ponterotto et al., 2014) that was subsequently made into a short form with 42 items with seven six-item factor-derived subscales (Fietzer et al., 2019). A sample item for each subscale is: (1) RID: “I feel a deep sense of pride in being part of my ethnic group(s)”; (2) SJA: “I have verbally confronted a close family member or friend who has made homophobic comments or who has shared an anti-gay or lesbian joke”; (3) PH: “I am a very emotionally stable person”; (4) CS: “I believe living things are interconnected with non-living earthly matter (e.g., wind, land, sun, and sky) in some spiritual sense”; (5) HUM: “I believe I have a pretty good sense of humor”; (6) OGC: “I have very close friends who are gay or lesbian”; and (7) CDF: “Most of my close friends are from my own racial group” (reverse-scored). Prior studies found coefficient alphas ranged from .68 to .90 (Fietzer et al., 2016, 2018, 2019; Ponterotto et al., 2014); one-month test–retest coefficients ranged from .67 to .91 and two-month test–retest coefficients ranged from .72 to .90 (Fietzer et al., 2019).
Big Five Inventory
The Big Five Inventory (BFI; Benet-Martínez & John, 1998) is a 44-item, 5-point Likert-type scale. Higher scores indicate more characteristics of each trait. The scale contains five-factor-derived subscales (1) Extraversion: “Is talkative”; (2) Agreeableness: “Tends to find fault with others” (reverse-scored); (3) Conscientiousness: “Is a reliable worker”; (4) Neuroticism: “Is relaxed, handles stress well” (reverse-scored); and (5) Openness: “Is curious about many different things.” Support for the construct validity of the BFI’s multidimensionality has been found through multiple factor analytic studies across age groups (Srivastava et al., 2003). Srivastava et al. (2003) found three-month test–retest stability coefficients ranged from .80 to .90, and internal consistency reliability using coefficient alpha ranged from .75 to .90.
Balanced Inventory of Desirable Responding-16
The Balanced Inventory of Desirable Responding-16 (BIDR-16; Hart et al., 2015) is a 16-item scale that assesses socially desirable responding. The authors of the BIDR-16 analyzed data across four studies and 3,678 unique participants to reduce the original BIDR from 40 to 16 items while maintaining the strong psychometric qualities of the scale. Using CFA, they found evidence of a two-factor structure that can be used as subscales: (1) Self-Deceptive Enhancement: “I never regret my decisions” and (2) Impression Management: “I never cover up my mistakes.” Items are assessed using an 8-point Likert-type scale ranging from 1 (totally disagree) to 8 (totally agree). Hart et al. (2015) found that the two BIDR-16 factors correlated with their parent factors from the 40-item scale at .84 for impression management and .87 for self-deceptive enhancement. Hart et al. (2015) reported coefficient alphas ranged from .66 to .73 for impression management and from .64 to .82 for self-deceptive enhancement; test–retest reliability coefficients over a two-week interval were .74 for impression management and .79 for self-deceptive enhancement.
Stephenson Multigroup Acculturation Scale
The Stephenson Multigroup Acculturation Scale (SMAS) is a 32-item scale that assesses acculturation, defined as the “degree of immersion in dominant and ethnic societies” (Stephenson, 2000, p. 79), with degree of immersion comprising the domains of language, interaction, food, and media. The SMAS was designed to assess U.S. cultural or ethnic groups. Statistical evidence supports a two-factor structure of the SMAS that can be used as subscales: Ethnic Society Immersion (ESI; “I think in my native language,”) and Dominant Society Immersion (DSI; “I speak English at home,”). Items are assessed using a 4-point Likert-type scale ranging from 1 (false) to 4 (true). Evidence supporting the construct validity of the SMAS derived from three studies by comprising 744 unique participants (Stephenson, 2000). Stephenson (2000) reported coefficient alphas ranged from .94 to .97 for ESI and from .75 to .90 for DSI.
Perceived Stress Scale
The Perceived Stress Scale (PSS; Cohen & Williamson, 1988) is a 10-item scale that measures the subjective appraisal of events in an individual’s life as stressful. The PSS uses a 5-point Likert-type scale, with anchors at 0 (never) and 4 (very often). Evidence supports a unidimensional scale (sample item: “In the last month, how often have you been upset because of something that happened unexpectedly?”). Previous coefficient alphas reported for the scale ranged from .78 to .91 (Cohen & Janicki-Deverts, 2012).
Kessler Psychological Distress Scale-6
The Kessler Psychological Distress Scale-6 (K6) is a six-item, 5-point Likert-type scale designed to screen mental health for the U.S. National Institute of Health Survey (Kessler, et al., 2002) with anchors at 1 (all of the time) and 5 (none of the time). The scale asks respondents how they felt over the past 30 days (sample item: “During the past 30 days, about how often did you feel nervous”). The scale was developed using national U.S. samples totaling 2,975 participants. All items were reverse scored so that higher scores reflect more psychological distress. Reported coefficient alpha for the scale ranged from .89 to .92 (Kessler et al., 2002).
Satisfaction with Life Scale
The Satisfaction with Life Scale (SWLS; Diener et al., 1985) is a five-item, 7-point Likert-type measure that assesses general life satisfaction (sample item: “In most ways my life is close to my ideal”), with anchors at 1 (strongly disagree) and 7 (strongly agree). Construct validity studies of SWLS scores support its unidimensional nature and criterion-related validity. Specifically, SWLS scores correlated in expected directions with positive and negative affective states (Diener et al., 1985; Vassar, 2008). Coefficient alpha across 62 studies had a mean of .78, and two-month test–retest coefficients were in the .80 range (Vassar, 2008).
Social Dominance Orientation-7
The Social Dominance Orientation-7 (SDO-7) is a 16-item, 7-point Likert-type measure of social dominance orientation that assesses an individual’s “support for inequality between social groups” (Ho et al., 2015, p. 1004), with anchors at 1 (strongly oppose) and 7 (strongly favor). There is strong evidence of the hypothesized four-factor structure across seven separate samples totaling 3,107 unique participants. There are two sets of two factors, one set being substantive in nature (i.e., dominance and anti-egalitarianism factors) and the other being methodological (i.e., pro-trait worded items vs. con-trait worded items). Dominance items predicted preference for more overt, violent means of maintaining hierarchical order (e.g., old-fashioned racism, support for immigration persecution), whereas anti-egalitarianism items predicted more subtle forms of enforcing societal hierarchies (e.g., opposition to welfare and affirmative action). Items are grouped by substantive and method factors: pro-trait dominance: “some groups of people must be kept in their place”; con-trait dominance: “no one group should dominate in society”; pro-trait anti-egalitarianism: “we should not push for group equality”; and con-trait anti-egalitarianism: “we should not work to give all groups an equal chance to succeed.” Con-trait items are reverse scored and averaged with the pro-trait items from the same substantive category to calculate the two SDO-7 subscales: Dominance (SDO-D) and Anti-egalitarianism (SDO-A). Ho et al. (2015) reported coefficient alpha for the SDO-D ranging from .82 to .90 and for the SDO-A from .82 to .93.
Color-Blind Racial Attitudes Scale
The Color-Blind Racial Attitudes Scale
Self-Reported Grade Point Average
Participants reported their grade point average (GPA) for high school, college, and graduate school. For all three self-reported GPAs, participants responded on an ordinal level scale. For high school GPA, the scale anchors were “below 2.0,” “2.00–2.49,” “2.50–2.99,” “3.00–3.24,” “3.25–3.49,” “3.50–3.74,” and “3.75 or greater.” Because so few participants responded with their college or graduate school GPA, we only used high school GPA in the current study.
Demographic Questionnaire
The questionnaire asked respondents to complete items on their age, gender, race, ethnic background, native language, fluency in English, sexual orientation, ability status, religion, whether they were born in the United States, and whether their parents or grandparents were born in the United States.
Procedure
After receiving approval from the institutional review board, participants were recruited from two target populations: AMT and the RPP. Participants completed the survey on the Qualtrics.com platform. All participants completed the demographic survey, MPI, K6, and the BFI. Participants answered different scales depending on whether they met criteria as either U.S. acculturating or U.S. originating. U.S. acculturating participants completed the SWLS, SMAS, K6, and the PSS. U.S. originating participants completed the SDO, CoBRAS, and the BIDR. We did not counterbalance the order of the surveys because the algorithm that determined who met criteria for each sample required a static order of instruments. The survey collection period occurred in three rounds for the AMT sample and each semester for the RPP sample from March 2017 until September 2019.
To protect against invalid responding, three attention check questions were embedded within the survey for all participants. Specifics on the validity checks are available from the first author. Initially, 1,287 participants provided usable data. We deleted 91 respondents for failing one of the three validity checks embedded within the survey and two participants who responded with the same score for all items. The final total number of individuals included in the study after data deletions was 1,194.
Results
We planned three major analyses of the data. First, we examined the MPI-SF using IRT, which entailed examination of the internal factor structure and items of the MPI-SF. This laid the foundation for the subsequent analyses, as any changes at this stage could potentially change the factor structure and items included on the instrument. Second, we examined the invariance of the MPI across different groups, including gender, race, and immigrant status. This demonstrated whether the internal structure and items selected by IRT generalized across different populations. Third, we examined the concurrent validity of the MPI in the United States. Third, we examined the concurrent validity of the MPI in the U.S. acculturating and U.S. originating samples across a number of variables, including mental health, acculturation, academic achievement, satisfaction with life, social dominance orientation, and color-blind racial attitudes. Item response analyses were performed using the mirt package in the R suite of programs R 3.6.2 (R Core Team, 2019). Invariance and concurrent validity were analyzed using Mplus 7.31 (Muthén & Muthén, 1998). Descriptive statistics and internal reliability data for all subscales in the study are reported in Table 1.
Item Response Analysis
Use of item response analysis requires that datasets meet the criteria for three statistical assumptions: (a) appropriate dimensionality of the scale, (b) local independence of items, and (c) functional form (de Ayala, 2009; Toland, 2014). Each assumption is discussed next.
Dimensionality
IRT assumes that the items from an instrument solely reflect the latent construct (or constructs) in question (de Ayala, 2009). Typically, IRT presumes the latent construct is unidimensional and that all items load perfectly onto it; significant violations of this assumption necessitate the use of multidimensional IRT models or respecification of the scale. We began by inspecting the appropriate dimensionality of the MPI-42 using CFA. CFA models were evaluated using a combination of various fit indexes. Incremental fit indexes include the confirmatory fit index (CFI) and the Tucker-Lewis Index (TLI); both range from 0 to 1.0, with values of .95 or greater indicative of good fit (Hu & Bentler, 1999). Absolute fit indexes include the root mean square error of approximation (RMSEA) and range from 0 to 1.0, with values of .06 or lower considered indicative of good fit.
Studies of the factor structure of the MPI (i.e., Fietzer et al., 2019; Ponterotto et al., 2014) suggested that a seven-factor, correlated traits model (Reise, et al., 2010) best fit the data. However, Korol et al. (2018) found evidence that the MPI is better described using a bifactor model. We assessed the possibility of both models in the present data. The seven correlated traits model demonstrated acceptable fit in RMSEA, but had inadequate incremental fit indexes: CFI = .719, TLI = .697, RMSEA = .079. A bifactor model of the 42-item scale did not converge. Based on the absolute fit indexes it was clear that the instrument showed promise but the incremental fit indexes indicated the MPI-SF was misspecified in some manner.
To determine where misspecification might be occurring in the MPI-SF, we examined each of the seven subscales of the MPI-SF separately as a unidimensional scale. This consisted of an iterative process of cross-examining confirmatory factor analyses (CFA) of the scale, the inter-item correlation matrix of scale, and a graded-response model of the data. For each of the seven subscales, one of six items in each scale provided low item information relative to other items of the subscale. Deletion of the item improved fit of the CFA for all seven scales. However, although overall fit of this new 35-item scale improved compared to the 42-item scale, the incremental fit indexes remained inadequate: CFI = .785, TLI = .763, RMSEA = .077. A CFA of five of the seven subscales (RID, SJA, PH, CS, HUM) revealed adequate fit: CFI = .945, TLI = .936, RMSEA = .048. This suggested that the two remaining subscales (OGC, CDF) were the source of misspecification.
Examination of the item information functions for the remaining five CDF items using a graded response model found that items 110 and 78 accounted for nearly all of the total information in the subscale. Thus, we examined the MPI-115 for other items that might align with CDF, both conceptually (i.e., by examining item wording) and empirically (by examining correlations between CDF scale items and MPI-115 items not included on the scale). Two items were conceptually related: Item 58 (“My friends of different races and ethnicities consider me a helpful person to talk with when they are upset or under stress”), and Item 66 (“My friends who are of different religions consider me a helpful person to talk with when they are upset or under stress”), and two items were empirically related: Items 69 (“I feel very connected to certain members of other racial groups”) and 80 (“I feel very connected to certain members of other ethnic groups”). Item 69 and Item 80 correlated with CDF items (.43 to .48). All nine items had a coefficient alpha of .78. We then deleted four items resulting in an increased overall coefficient alpha in a stepwise procedure, ending with a final coefficient alpha of .83 for the five-item scale. A CFA of these items with the other five scales of the MPI found adequate fit for the six-factor structure: CFI = .935, TLI = 926, RMSEA = .048.
For OGC, a graded-response model of the five OGC items revealed that three items (24, 59, and 86) accounted for nearly all of the total information of the subscale and that Item 73 had the lowest discrimination. Dropping this item, however, did not improve coefficient alpha, which remained at .69. We then searched the MPI-115 for empirical relationships (i.e., correlations) with items from this scale and for any conceptual linkages with these three items. Item 90 (“I am accepting and understanding of those who live a gay or lesbian lifestyle”), Item 79 (“I am accepting and understanding of those who live a bisexual lifestyle”), and 99 (“I think it is important to understand and value both similarities and differences among people of different sexual orientations”) met the criteria. Coefficient alpha for this eight-item scale improved to .78. Examining the scale using the same procedures as for the CDF subscale analysis resulted in only items that assessed acceptance of members of the LGB community; the three items that assessed relationships with other genders were deleted. This subscale was renamed Diverse Sexual Orientation Affinity (DSOA). The resulting alpha of the new five-item scale was .84. A CFA of these five items with the other six revised subscales of the MPI (that included ten modifications of correlated errors between items) found a marginally adequate fit: CFI = .907, TLI = .896, RMSEA = .055. However, inspection of modification indices revealed that Items 98 and 106 from the SJA factor cross-loaded onto OGC. When these modifications were made, the fit of the scale was much improved: CFI = .930, TLI = .921, and RMSEA = .048. and we thus accepted this 35-item version of the scale as demonstrating sufficient evidence of dimensionality.
Local Independence of Items and Functional-Form
IRT models assume local independence, meaning that each item from an instrument is answered independent from how other items are answered (de Ayala, 2009). We assessed the local independence of items using the cutoff of |.20| for residual correlations between items as suggested by Morizot et al. (2007) and Toland (2014). This resulted in 20 of the 561 (3.5%) residual correlations between items exceeded the cutoff suggested by Morizot et al. (2007). Thus, we concluded that the assumption of local independence was tenable.
IRT models also assume that data adhere to a prescribed functional form of a given model (de Ayala, 2009), such as an “S”-shaped sigmoidal curve in dichotomous data. This assumption becomes more complex with multi-dimensional data, such that one must examine two (or more) dimensions simultaneously. Item-data fit (i.e., functional form) was evaluated using Zh scores (with values greater than 0 indicating a better fit than expected, and values less than 0 indicating worse fit; Chalmers, 2015) and the S-χ2 item-fit statistic (Orlando & Thissen, 2003), where statistically significant items are indicative of poor fit. Item-data fit for each item of the 35-item scale was acceptable for all items based on Zh score (all were positive). Ten of the 35 items were flagged as statistically significant according to the S-χ2 item-fit statistic.
Model-data fit is evaluated using the M2 family of fit statistics, which use CFI, TLI, and RMSEA, with interpretations similar to those for CFA. Because the MPI uses a 5-point Likert-type scale, we initially used a graded response model. However, we found that item-data fit for the 35-item seven correlated factors model was poor, with CFI = .867, TLI = 859, RMSEA = .091. As a result, while items demonstrated adequate fit to the data, the correlated seven-factor structure of the scale did not. We therefore examined alternative structures of the scale.
We found that four subscales of the MPI-SF (RID, SJA, PH, CS) best fit a bifactor model: M2(150) = 765.45, CFI = .959, TLI = .948, RMSEA = .060. We labeled the general factor as a general Multicultural Personality (MPG) factor. The five-item HUM subscale fit best as a graded response model independent from the other factors: M2 (5) = 23.83, CFI = .991, TLI = .982, RMSEA = .057. The remaining two factors, DSOA and CDF, demonstrated strongest fit to the data when modeled as a separate bifactor from the remaining factors: M2 (25) = 275.01, CFI = .970, TLI = .946, RMSEA = .094. However, the RMSEA was high, indicating a problem with the items. Inspection of the items revealed that item 93 of the DSOA subscale had a statistically significant S-χ2 item-fit, although its Zh was positive (Zh = 3.01). Removal of this item created exceptional fit to the data: M2 (18) = 40.14, CFI = .997, TLI = .993, RMSEA = .033. We labeled the general factor of this model Interpersonal Cultural Openness (IPCO).
Descriptive Statistics and Coefficient Alpha, of MPI, BIDR, PSS, K-6, SDO, SWL, SMAS, BFI, and CoBRAS Subscales
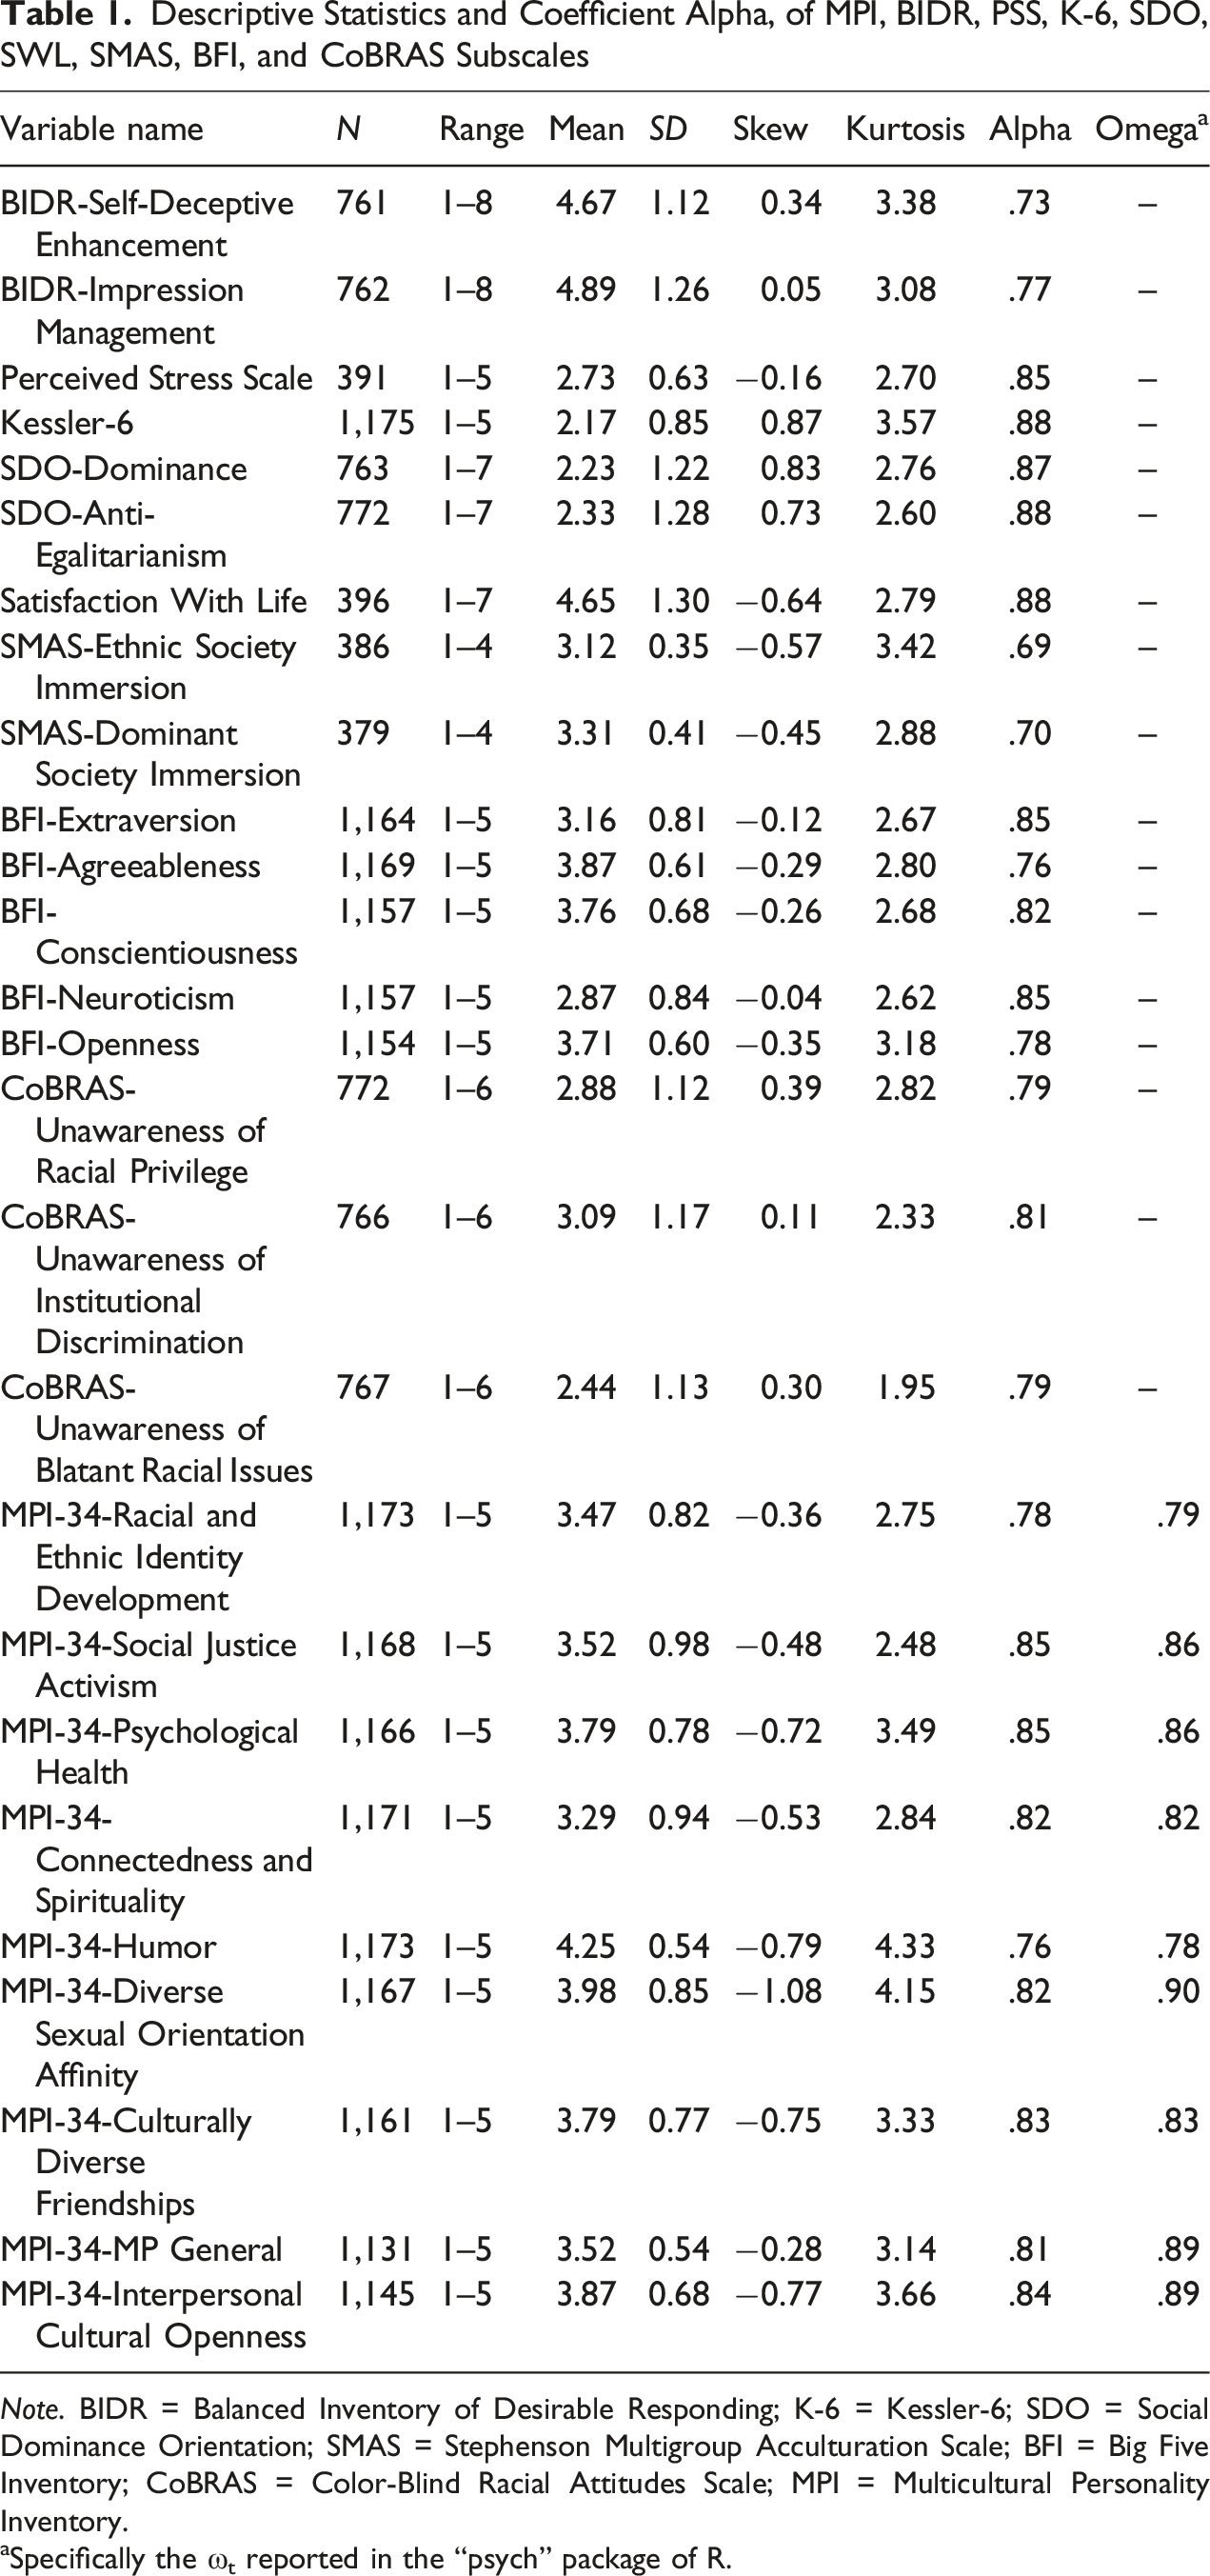
Note. BIDR = Balanced Inventory of Desirable Responding; K-6 = Kessler-6; SDO = Social Dominance Orientation; SMAS = Stephenson Multigroup Acculturation Scale; BFI = Big Five Inventory; CoBRAS = Color-Blind Racial Attitudes Scale; MPI = Multicultural Personality Inventory.
aSpecifically the ωt reported in the “psych” package of R.
Estimated Item Parameters
Item Response Theory Parameter Estimates for the MPI-34 Dual Bifactor Model
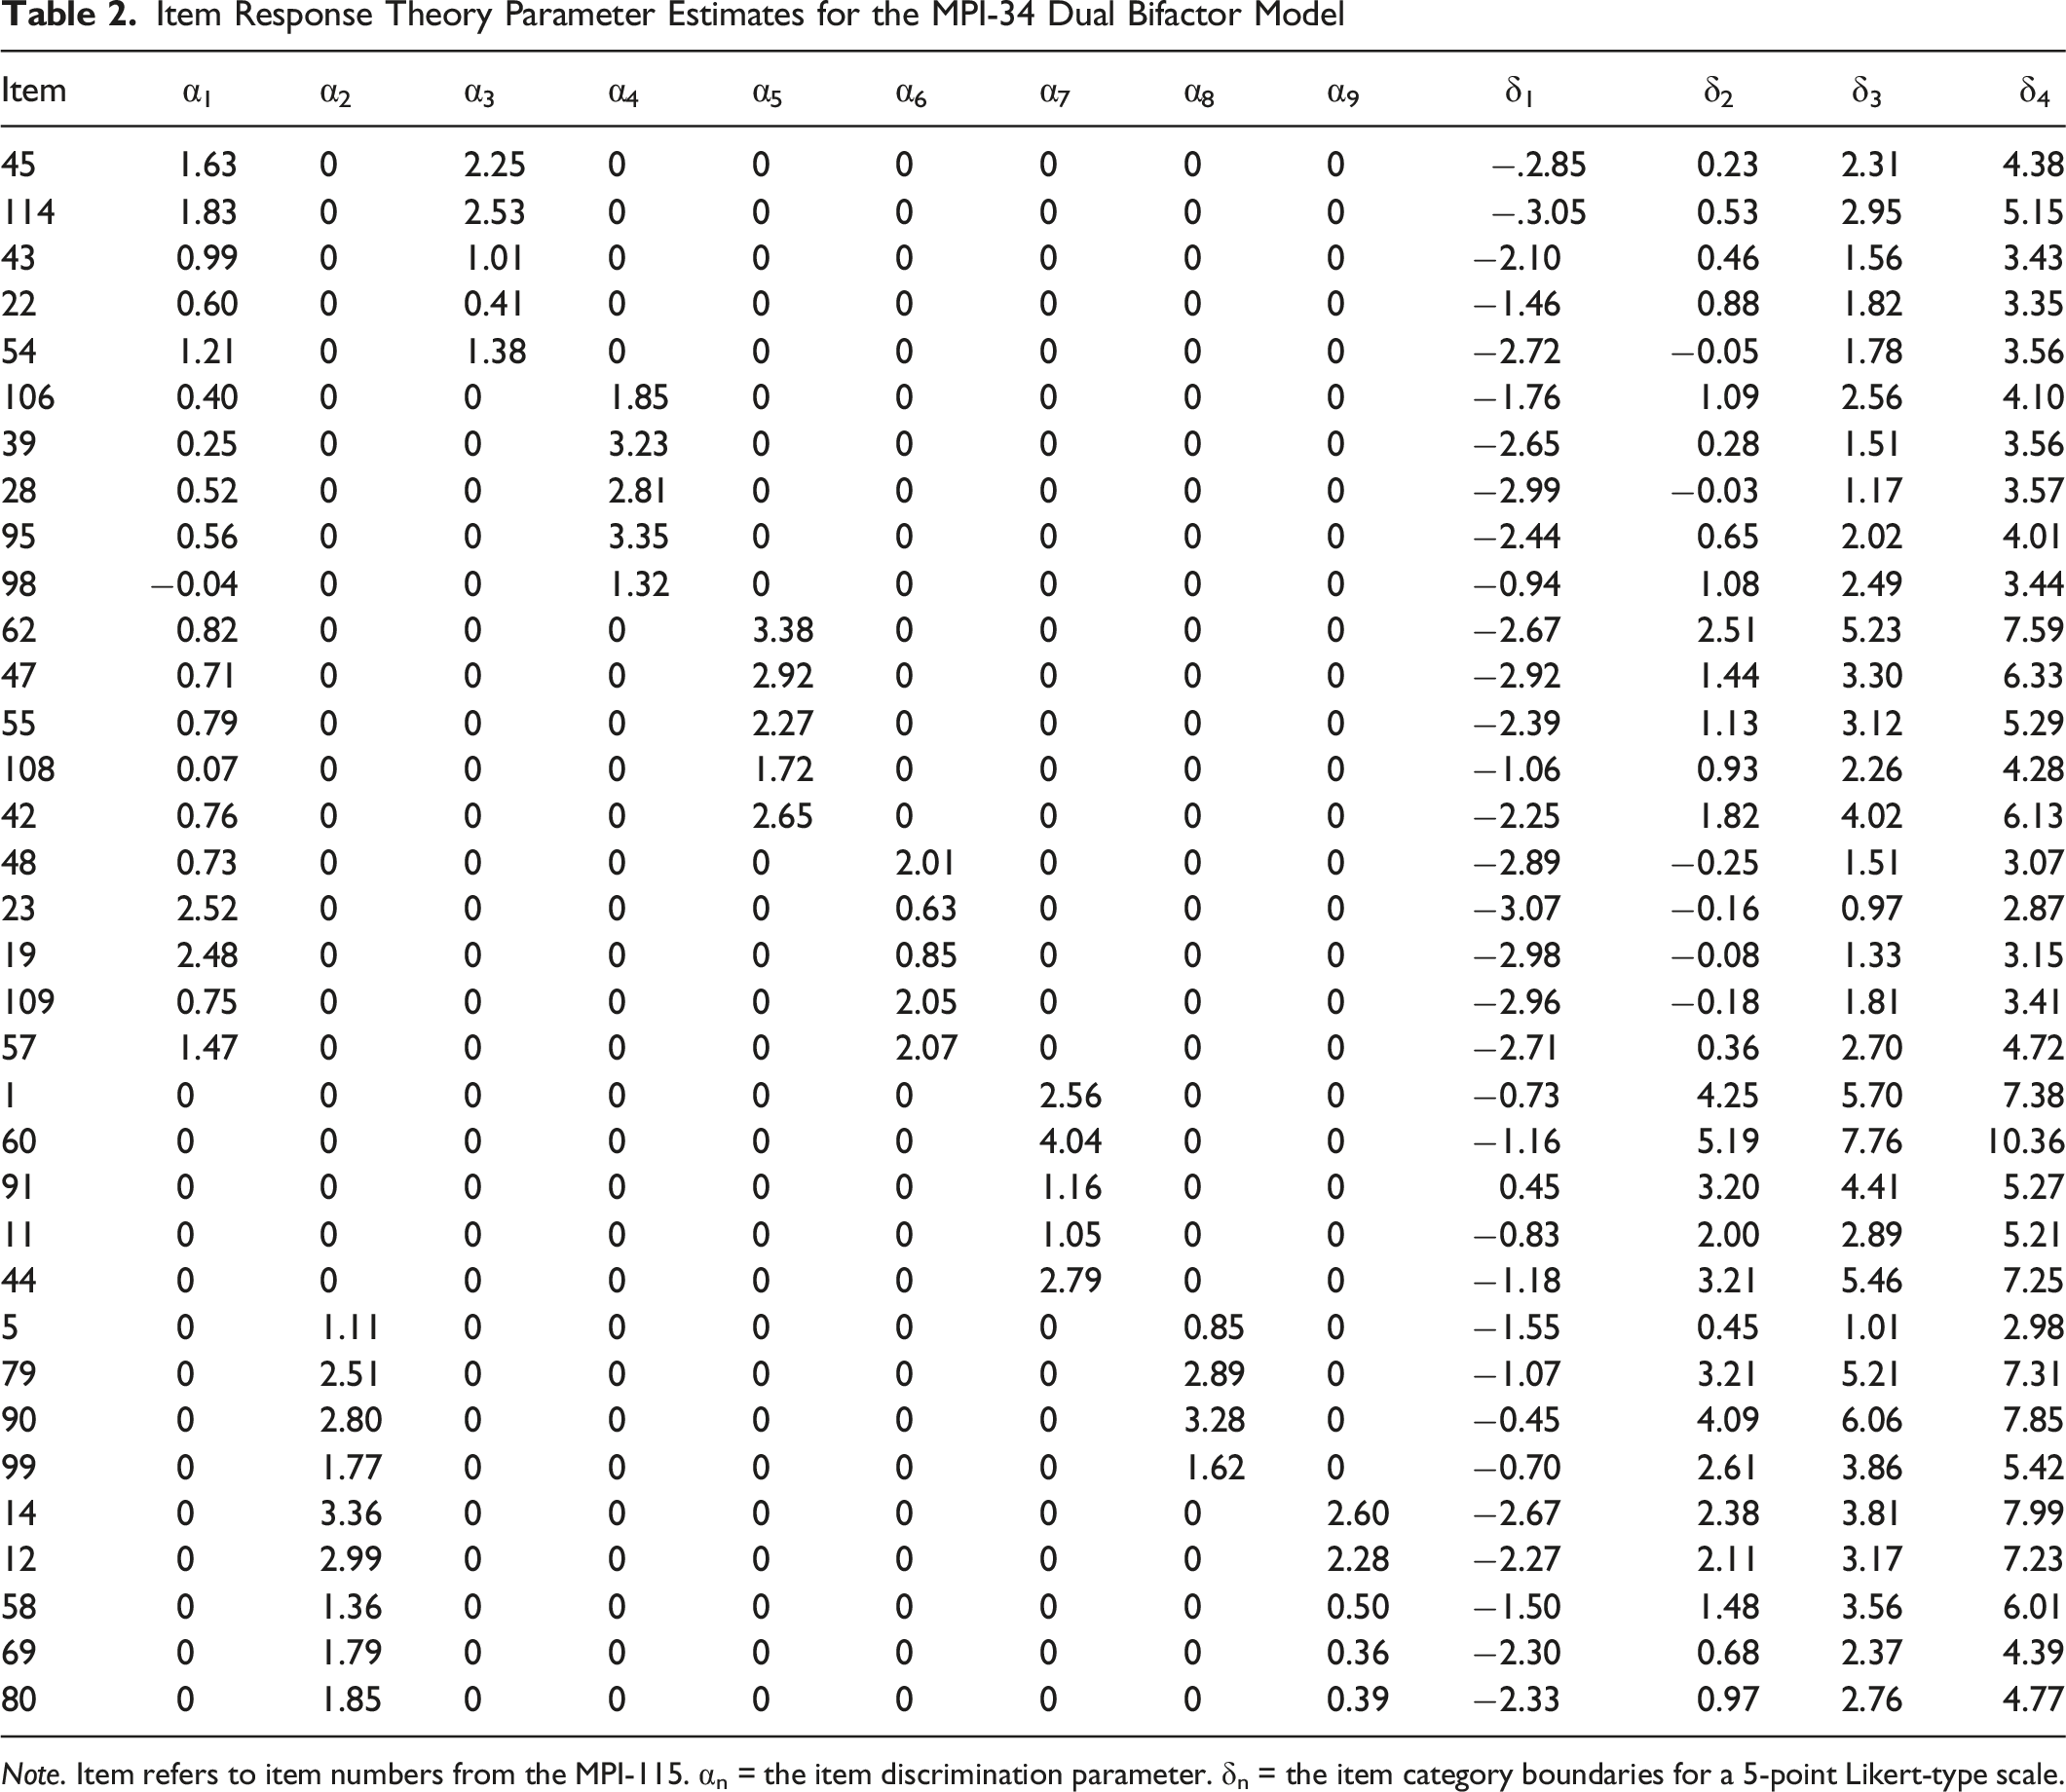
Note. Item refers to item numbers from the MPI-115. αn = the item discrimination parameter. δn = the item category boundaries for a 5-point Likert-type scale.
The δn parameters can be thought of as the category boundaries that determine when an individual is more likely to select one response over another (e.g., “strongly agree” vs. “agree”) for each item across the two dimensions. Thus, respondents encountering Item 45 (“I feel a deep sense of pride in being part of my racial group”) with levels of RID and general MP below −2.85 are most likely to choose “disagree strongly” on the item. Those between −2.85 and 0.23 are most likely to choose “disagree.”
The set of items with the highest discrimination on the first general MP factor are from the CS subscale, followed by the items from the RID subscale. Items from the SJA subscale provide the lowest discrimination on the first general MP factor, ranging from −0.04 to 0.56. For the second general MP factor, all nine items demonstrate excellent discrimination, ranging from 1.36 to 3.36. Subscale discrimination parameters are generally high, with the exception of Item 22 (α3 = .41), Item 69 (α9 = .36), and Item 80 (α9 = .39). The Humor items demonstrate strong discrimination parameters for their unidimensional scale, ranging from 1.05 to 4.04.
Invariance Analysis
We analyzed invariance across race, gender, and generational status. In spite of what appeared to be sufficient sample size, the subsample statistical models had difficulty converging at times or contained negative variances. Thus, to provide at least some evidence of invariance of the model, we chose to assess a partial model of the MPI-SF. Given that the general MP and HUM models converged without issue, and that the general MP factor is also the factor of most interest, we assessed this part of the model.
Fit statistics for each model can be obtained by emailing the first author. All data were assessed using the Satorra-Bentler χ2 statistic due to significant kurtotic data. Given the issues of the χ2 statistic being sensitive to large samples sizes, we used the change (Delta, Δ) in the CFI index as the metric to determine whether more restrictive models were invariant, with changes greater than .01 considered evidence against invariance (Cheung & Rensvold, 2002). Simulation studies demonstrated the superiority of using changes in CFI compared to χ2 tests in detecting problems with invariance in CFA (Cheung & Rensvold, 2002; Meade et al., 2008), regardless of sample size. Evidence for invariance was determined by the difference of fit of increasingly restrictive models (Byrne, 2012). We began by examining baseline models for each group. Next, we examined the configural model, whereby groups are compared and all parameters of interest are allowed to vary freely (i.e., factor loadings, variances and covariances, residual variances). “Metric” evidence for invariance is achieved if factor loadings are then held equivalent across groups without loss of CFI. “Scalar” evidence for invariance is achieved if variances and covariances are held equivalent across groups without loss of CFI. Finally, “residual” evidence of invariance is achieved if the residual variances between variables are held equivalent across groups without loss of CFI. However, experts consider evidence of residual invariance as too stringent given the idiosyncrasies that occur in samples; thus, scalar evidence of invariance is typically considered adequate (Byrne, 2012).
For race, we calculated baseline models for White people (n = 639) and People of Color (n = 477), with each demonstrating similarly acceptable levels of fit. A configural model produced acceptable fit. We found evidence for metric invariance across models with a change in CFI of .002, and evidence for scalar invariance across models with a change in CFI = .008. The model did not converge when we restricted residual variances across groups.
For gender, we examined cisgender males (n = 306) and females (n = 808). The baseline model for females demonstrated adequate fit. However, the baseline model for males demonstrated unacceptable fit in the incremental fit indexes. Modification indices suggested we correlate the residual variances between items 19 and 23; doing so produced adequate fit of the model. A configural model demonstrated evidence of acceptable fit to the data. We found evidence of metric invariance with a change in CFI = .007. However, the model would not converge when factor variances and covariances were held constant. Examination of the data revealed that the CS factor was likely the cause. Relaxing this constraint allowed the model to achieve fit and provided evidence of partial scalar invariance. The variance of CS for females was .789; for males the variance of CS = 1.091. Thus, males demonstrated more variance in the CS factor. We did not find evidence for residual invariance (Δ CFI = .016).
We assessed invariance across generational status by comparing the U.S. acculturating group with the U.S. originating group. The baseline model for the U.S. originating group produced adequate fit indexes. The baseline model for U.S. acculturating group would not converge until we changed the metric of the measurement model. Rather than set all of the first factor loadings to 1.0, we freed all factor loadings and instead set the factor variances for RID, SJA, PH, CS, and HUM to 1.0. This allowed the model to converge. The configural model of the combined groups demonstrated adequate fit. We found evidence for metric invariance across models with a change in CFI = .004, and evidence for scalar invariance with a change in CFI = .005. However, we did not find evidence of residual invariance, as change in CFI = .020.
Evidence of Concurrent Validity
We assessed evidence of the concurrent validity of the MPI-34 following the suggestions made by Clark and Watson (2019) in test design: (a) by examining Pearson correlations between the MPI-34 and relevant criterion variables in each target sample (i.e., convergent and discriminant validity); and (b) by examining evidence of incremental validity of the MPI-34 in each target sample. To assess evidence of incremental validity, we used regressions in structural equation models (SEM), since SEM allows for a more accurate assessment of latent variable structures than other analyses (e.g., hierarchical multiple regression) by modeling the error inherent in the measurement of latent constructs and it permits use of complex latent structures that otherwise would produce problems of multicollinearity if used in multiple regression.
Correlations for Convergent and Discriminant Validity
Pearson Correlation Coefficients between MPI-34 Subscales, BFI Subscales, Social Desirability, and Criterion Variables for U.S. Originating and U.S. Acculturating Samples
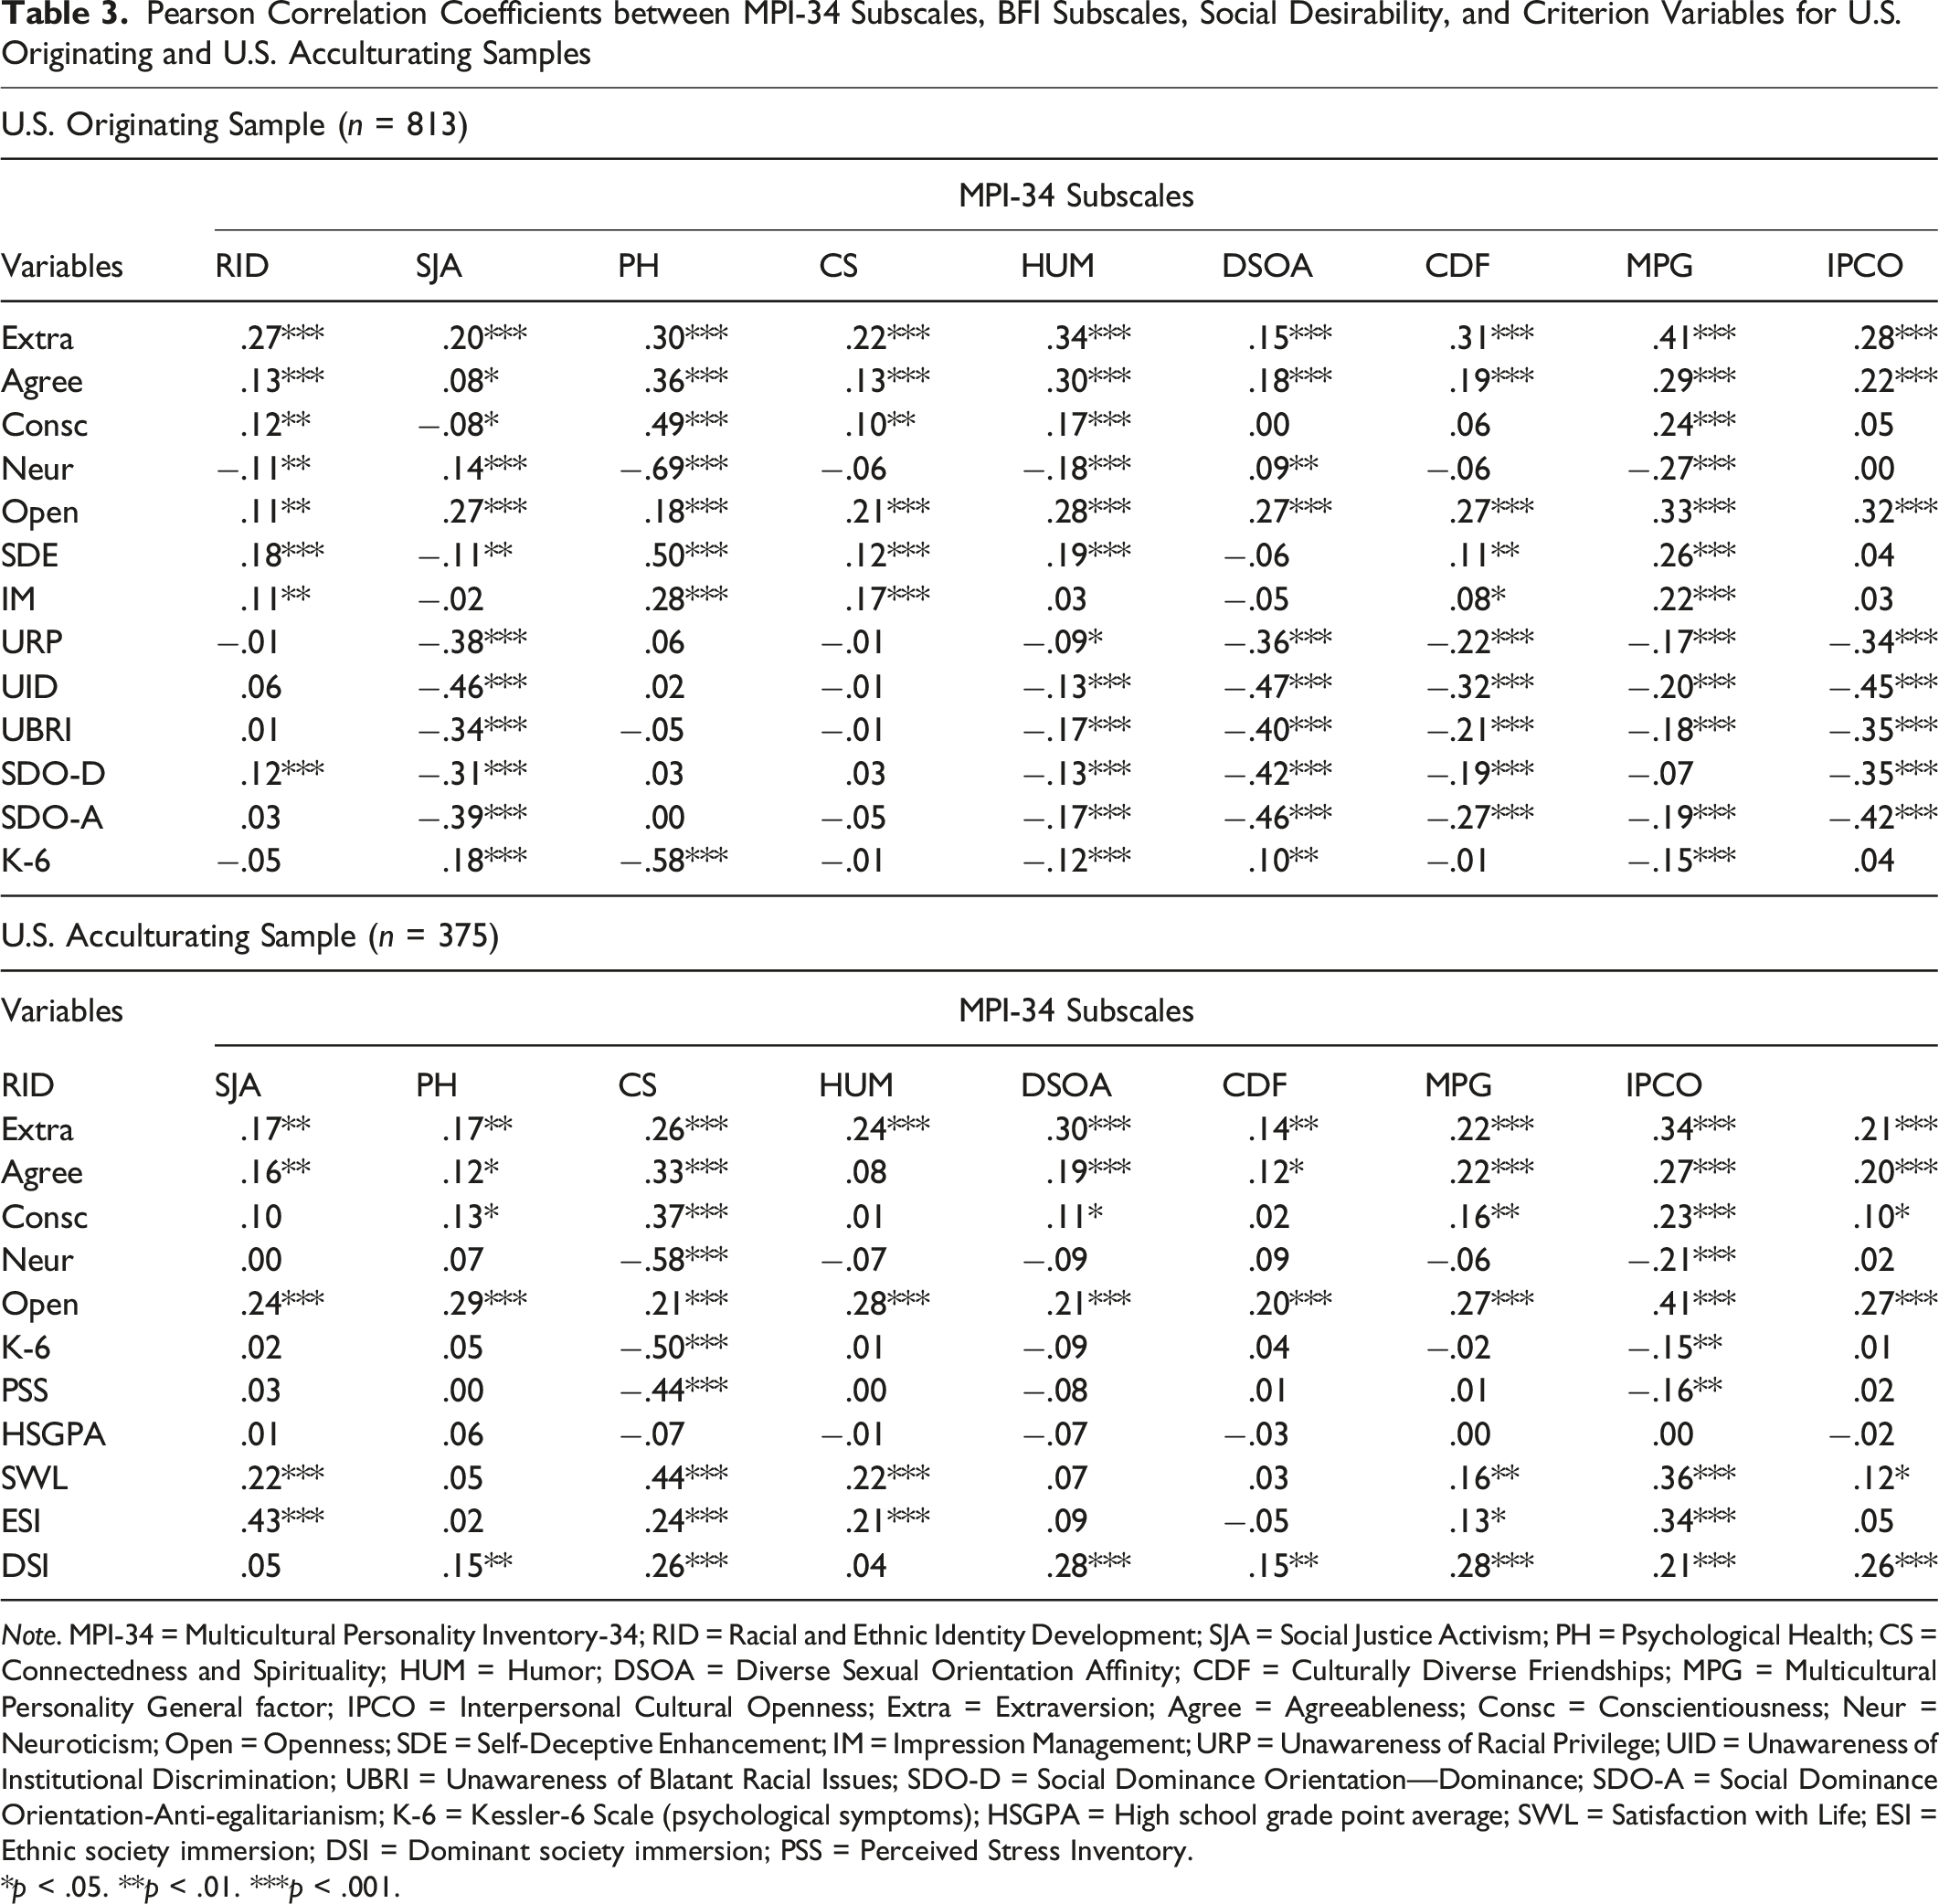
Note. MPI-34 = Multicultural Personality Inventory-34; RID = Racial and Ethnic Identity Development; SJA = Social Justice Activism; PH = Psychological Health; CS = Connectedness and Spirituality; HUM = Humor; DSOA = Diverse Sexual Orientation Affinity; CDF = Culturally Diverse Friendships; MPG = Multicultural Personality General factor; IPCO = Interpersonal Cultural Openness; Extra = Extraversion; Agree = Agreeableness; Consc = Conscientiousness; Neur = Neuroticism; Open = Openness; SDE = Self-Deceptive Enhancement; IM = Impression Management; URP = Unawareness of Racial Privilege; UID = Unawareness of Institutional Discrimination; UBRI = Unawareness of Blatant Racial Issues; SDO-D = Social Dominance Orientation—Dominance; SDO-A = Social Dominance Orientation-Anti-egalitarianism; K-6 = Kessler-6 Scale (psychological symptoms); HSGPA = High school grade point average; SWL = Satisfaction with Life; ESI = Ethnic society immersion; DSI = Dominant society immersion; PSS = Perceived Stress Inventory.
*p < .05. **p < .01. ***p < .001.
Social desirability subscales modestly correlated with the MPI-34 subscales, ranging from −.11 to .26 for Self-Deceptive Enhancement and −.05 to .22 for Impression Management. The exception was PH, which correlated .50 with Self-Deceptive Enhancement and .28 with Impression Management. For the remaining criterion variables, the MPI-34 scales correlated in the expected directions, with the exception of RID, which modestly but significantly correlated with Social Dominance Orientation—Dominance at .12. SJA, HUM, DSOA, and CDF significantly (negatively) correlated with the U.S. originating sample variables; whereas RID, PH, and CS significantly correlated with the U.S. acculturating sample variables. MPG significantly correlated with all variables except high school GPA and Social Dominance Orientation—Dominance. IPCO significantly correlated with fewer variables but had higher magnitudes than MPG for its correlations. No MPI-34 factor correlated with high school GPA.
Structural Equation Modeling for Incremental Validity
SEM requires assessment of the measurement model of each instrument before the structural model can be assessed (Byrne, 2012). Given the significant univariate skew and kurtosis of many of the items, we used the Satorra-Bentler χ2 (S-Bχ2) estimator for all models with the exception of the CoBRAS. Since the CoBRAS required an exploratory structural equation model (ESEM) that cannot be used with the S-Bχ2 estimator, we used the Yuan-Bentler T2* (Y-BT2*) instead. For all models we set the metric of the MPI-34 by setting the variance to 1.0 for each variable and freeing all item parameters. To evaluate whether models adequately described the data, we used Hu & Bentler’s (1999) finding that for complex models, values of the CFI of .93 or greater correctly reject mis-specified models 99% of the time when N = 500. Thus, we treated CFI values of .93 as evidence of strong fit, values from .900 to .929 as evidence of adequate fit, and values less than .90 as evidence of mis-specification of the model. For RMSEA, Hu & Bentler (1999) found that for complex models, values of .050 resulted in rejection of mis-specified models 99.9 to 100% of the time when N = 500. Therefore, we treated RMSEA values of .050 or lower as evidence of excellent fit, values from .051 to .069 as evidence of good fit, and values greater than .070 as evidence of mis-specification.
Standardized Regression Coefficients Between Latent Variables of the MPI-34, BIDR, Openness, CoBRAS, SDO, and K-6 Scales for U.S. Originating Sample and U.S. Acculturating Sample
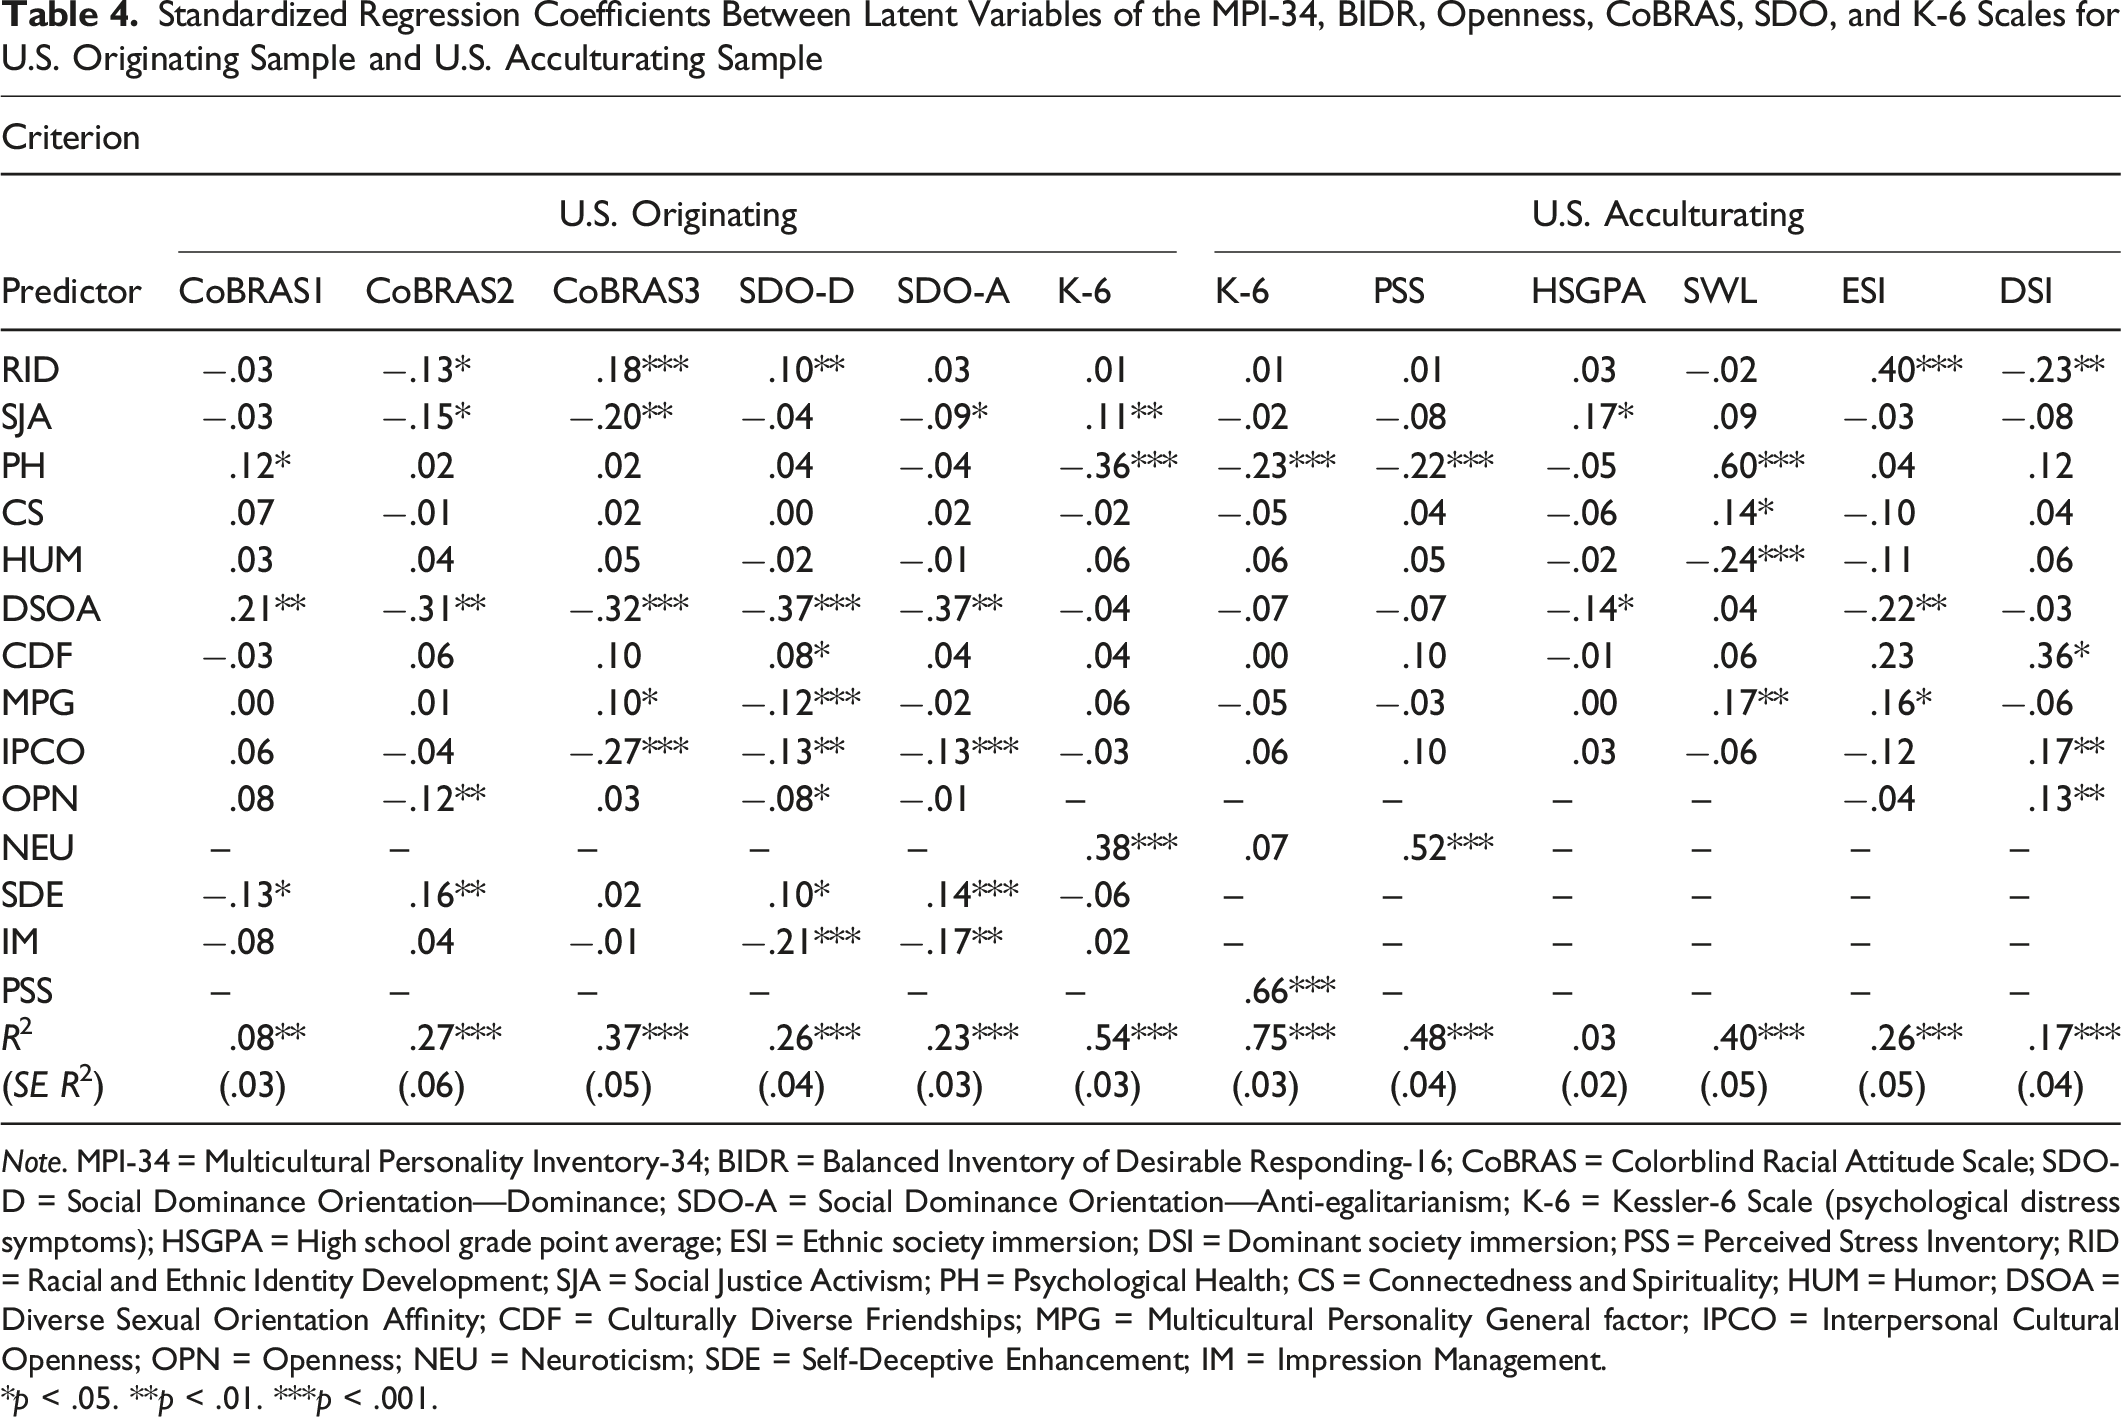
Note. MPI-34 = Multicultural Personality Inventory-34; BIDR = Balanced Inventory of Desirable Responding-16; CoBRAS = Colorblind Racial Attitude Scale; SDO-D = Social Dominance Orientation—Dominance; SDO-A = Social Dominance Orientation—Anti-egalitarianism; K-6 = Kessler-6 Scale (psychological distress symptoms); HSGPA = High school grade point average; ESI = Ethnic society immersion; DSI = Dominant society immersion; PSS = Perceived Stress Inventory; RID = Racial and Ethnic Identity Development; SJA = Social Justice Activism; PH = Psychological Health; CS = Connectedness and Spirituality; HUM = Humor; DSOA = Diverse Sexual Orientation Affinity; CDF = Culturally Diverse Friendships; MPG = Multicultural Personality General factor; IPCO = Interpersonal Cultural Openness; OPN = Openness; NEU = Neuroticism; SDE = Self-Deceptive Enhancement; IM = Impression Management.
*p < .05. **p < .01. ***p < .001.
U.S. Originating Sample
The measurement model for the MPI-34 demonstrated acceptable fit for RMSEA (.054) but low CFI (.906). Modification indices revealed three necessary modifications to the model. The first was a cross loading from DSOA to Item 98. The second was to correlate the residual errors between Items 45 and 114 on the RID group factor. The third was to correlate the residual errors between the MPG factor and CDF. These changes improved fit of the model to acceptable levels: CFI = .933, RMSEA = .045.
The measurement model for SDO consisted of a four latent factor model as found by Ho et al. (2015): dominance (SDO-D), anti-egalitarianism (SDO-A), a latent variable for the eight positively worded items, and a latent variable for the eight negatively worded items. This model demonstrated excellent fit (CFI = .984, RMSEA = .036).
For the CoBRAS measurement model, the three-factor solution reported in Neville et al. (2000) demonstrated poor fit to the data: CFI = .554, RMSEA = .149. We found that a three-factor ESEM of the CoBRAS improved fit of the model: CFI = .915, RMSEA = .082. Four modification indices (between Item 18 and 19, Items 20 and 15, Items 16 and 9, and Items 6 and 2) improved fit to acceptable levels (CFI = .943, RMSEA = .068). The three ESEM factors corresponded closely with those reported in Neville et al. (2000). 3
The measurement model for K6 was a single latent factor with six items as reported in Kessler et al. (2002). This model demonstrated mixed fit to the data: CFI = .920 and RMSEA = .158. Correlating residuals between three pairs of items (Items 6 and 4, Items 3 and 1, and Items 5 and 2) improved fit substantially: CFI = .990, RMSEA = .068.
For the structural model of social dominance orientation, we regressed SDO-D and SDO-A onto the MPI-34, trait Openness, and the social desirability subscales; we then regressed the MPI-34 onto Openness and the social desirability subscales. This resulted in good fit of the model in terms of RMSEA (.044) but a low CFI (.907). Modification indices suggested five changes, improving fit of the model: CFI = .925, RMSEA = .040. The model explained 26% of the variance in SDO-D and 23% of the variance in SDO-A. Three MPI-34 factors (DSOA, MPG, and IPCO) were negatively associated with either one or both SDO factors. Interestingly, RID was modestly but positively associated with SDO-D (β = .10).
For the CoBRAS structural model, we regressed the CoBRAS three-factor ESEM model onto the MPI-34, trait Openness (because it had the highest correlations with the CoBRAS subscales), and social desirability subscales; we then regressed the MPI-34 onto Openness and social desirability. This produced acceptable fit in RMSEA (.044) but unacceptable fit in CFI = .899. The addition of five modifications based on indices 4 improved the CFI to .917 and the RMSEA to .040. The model explained 8% to 37% of the variance of the three CoBRAS ESEM factors. The MPI-34 was most associated with the ESEM CoBRAS factor comparable to Unawareness of Blatant Racial Issues. Three MPI-34 subscales were inversely associated with it: SJA (β = −.20), DSOA (β = −.32), and IPCO (β = −.27), indicating that higher MPI scores were associated with greater awareness of racial issues. Contrary to theory, RID and MPG were positively associated with the factor (β = .18 and .10, respectively). For the ESEM CoBRAS factor comparable to Unawareness of Institutional Discrimination, three MPI-34 group factors were inversely associated (RID, SJA, and OSC). For the CoBRAS factor comparable to Unawareness of Racial Privilege, PH was positively associated with it (β = .12) as was DSOA (β = .21). This was surprising; perhaps participants scoring high on this CoBRAS scale are naïve to their privilege and so it does not affect their reported psychological health.
For the mental distress structural model, we regressed mental distress (i.e., the K6) onto the MPI-34, trait Neuroticism, and the social desirability subscales. We then regressed the MPI-34 onto Neuroticism and the BIDR subscales. The RMSEA (.052) was acceptable but the CFI (.898) indicated mis-specification of the model. Five modification indices improved fit: CFI = .921, RMSEA = .045. The model explained 54% of the variance in K6 scores. Trait Neuroticism was associated with mental distress (β =.38). PH was inversely associated with mental distress (β = −.36) as well as trait Neuroticism. Finally, contrary to theory, SJA was positively associated with mental distress (β = .11). One interpretation for this finding is that those with higher levels of social justice activism are more sensitive to current sociopolitical conditions and so more distressed by transgressions of social justice.
U.S. Acculturating Sample
The measurement model of the MPI-34 demonstrated mixed evidence of fit: RMSEA = .050, CFI = .904. Modification indices suggested three changes. The first was a cross loading of Item 98 onto the DSOA factor. The second was to correlate the residuals between Items 45 and 114. The third was to correlate the residuals between Item 12 and Item 14. These changes improved fit to adequate levels: CFI = .932 and RMSEA = .042.
The measurement model for SWL included all five items on a single latent factor (Diener et al., 1985). This resulted in mixed fit of the model with CFI = .988, but RMSEA = .072. Modification indices suggested correlating the residual errors of Items 1 and 2. This resulted in an excellent fit: CFI = .998, RMSEA = .031.
The measurement model for the K6 included all six items on a single latent factor as hypothesized (Kessler et al., 2002). This resulted in an adequate CFI = .944 but an unacceptable RMSEA = .124. Modification indices suggested correlating the residual errors between three pairs of items (Items 6 and 4, Items 3 and 1, and Items 3 and 5), resulting in an excellent fitting model: CFI = .994, RMSEA = .047.
The measurement model for PSS included all 10 items onto a single latent factor, as hypothesized by Cohen & Williamson (1988). However, this resulted in a poor fit: CFI = .794, RMSEA = .133. Correlating residual errors between six pairs of items improved model fit: CFI = .969, RMSEA = .057. Examination of the item pairs suggested a pattern in that only negatively loaded items appeared in modification indexes. As a result, we conducted a bifactor model of the PSS, with all 10 items loaded onto the general factor, the six positively worded items loaded onto a latent group factor, and the four negatively worded items loaded onto another latent group factor. This resulted in a superior fit compared to the univariate model with modification indices: CFI = .992, RMSEA = .031, and we accepted this as the final model for SEM analysis.
The measurement model for the SMAS divided the 32 items onto a two-factor structure as found by Stephenson (2000). This resulted in a poor fit to the data: CFI = 682, RMSEA = .081. No other latent variable options that we explored produced adequate fit. Instead, we calculated the two subscales of the SMAS (ESI and DSI) as manifest variables.
For the SWL structural model we regressed SWL onto the MPI-34, trait Neuroticism, and trait Extraversion. This resulted in low CFI (.862) but acceptable RMSEA (.060). Modification indices indicated three changes, these did not improve the CFI to acceptable levels (.883), but did improve the RMSEA (.055). Further modifications were either theoretically untenable or resulted in uninterpretable results (i.e., Heywood cases). Neuroticism was not statistically significant in these models, so we ran the same model without it. However, this model suffered from the same issues, with low CFI (.870) and adequate RMSEA (.058). Running the model without trait Extraversion or trait Neuroticism resulted in CFI of .932 and RMSEA of .040. The model explained 40% of SWL, with MPG associated with SWL at β = .17. Three MPI factors were significant, with PH at β = .60, CS at β = .14, and HUM at β = −.24.
For the SMAS structural model, we regressed the manifest factors of the SMAS (i.e., ESI and DSI) onto the MPI-34 and trait Openness. This resulted in CFI = .899 but RMSEA = .049. Implementation of one modification index improved fit on CFI to .904 and on RMSEA to .048. 5 The model explained 26% of the variance in ESI and 17% of the variance in DSI. RID was associated with ESI β = .40 as predicted by theory. However, RID was inversely associated with DSI at β = −.23. DSOA was inversely associated with ESI β = −.22, whereas MPG was positively associated with ESI at β = .16. For DSI, CDF (β = .36), and IPCO (β = .17) were positively associated.
To model mental distress, we regressed K6 onto the PSS bifactor model. This resulted in a strong fit: CFI =.945, RMSEA = .061. We then regressed this model onto the MPI-34 and trait Neuroticism. This resulted in mixed fit: CFI = .885, RMSEA = .045. Modification indices revealed five modifications that improved fit to CFI = .913, RMSEA = .040. The model explained 75% of the variance in the K6 and 48% of the variance in PSS. The only significant predictor was PH, which was inversely associated with K6 at β = .23. PH was negatively associated with PSS at β = −.22 and Neuroticism was positively associated with PSS at β = .52.
Discussion
The present study examined three psychometric aspects of the MPI-42: item structure via IRT, measurement invariance, and concurrent validity across two separate populations. H1 predicted that the best IRT model for the MPI would be a graded response model. This hypothesis was not supported, as the factors of the MPI did not meet the unidimensional assumption of the graded response model. Instead, we found evidence of a more complex, multidimensional factor structure than had previously been reported in the initial psychometric development studies of the MPI-70 (Ponterotto et al., 2014) and MPI-42 (Fietzer et al., 2019), or in Korol et al. (2018). Rather than a correlated traits factor model or bifactor model (Reise et al. 2010), it appears that the factor structure of the MPI is what might best be described as a dual bifactor model. There are two overarching general factors: a general multicultural personality factor and an interpersonal cultural openness factor. There are then seven group factors that are the same as found in prior studies (e.g., Fietzer et al., 2019; Ponterotto et al., 2014), with four (Racial and Ethnic Identity Development, Social Justice Activism, Psychological Health, Connectedness and Spirituality) acting as group-level factors for the general multicultural personality factor and two (Diverse Sexual Orientation Affinity, Culturally Diverse Friendships) acting as group-level factors for the Interpersonal Cultural Openness factor. Humor items only loaded onto the Humor factor. This model provides more evidence for a general MP factor, supporting the general MP factor uncovered by Korol et al. (2018) in the MPI, and by Rushton & Irwing (2009) in their analysis of the MPQ. This evidence, along with the discriminatory validity provided in research on the MPI and the Big Five (Fietzer et al., 2016, 2019; Ponterotto et al., 2014), implies that MP is more than a variation or rebranding of one of the Big Five and is a distinct construct unto itself.
The emergence of the Interpersonal Cultural Openness general factor was a surprise. It appears to be a general factor of affinity around sociocultural issues, including sexual orientation and racial diversity. It is inversely associated with color-blind racial attitudes and social dominance orientation. Further, it is predictive of acculturation with the dominant society. More replication is required, but the appearance of the factor in two separate datasets is promising. Recent empirical studies from Europe support the pattern of prediction demonstrated by the Interpersonal Cultural Openness factor and further substantiate that it might be an important part of personality. For instance, German adolescents who developed a friendship with an immigrant during their secondary education reported less discriminatory attitudes toward that group (Titzmann et al., 2015) and higher intercultural competence (Schwarzenthal et al., 2019). Yet little research has occurred in the United States to date on this important topic.
The remaining factor, Humor, explained the variance of only one variable—satisfaction with life—and this was negative, contrary to predictions. This is a surprise given that previous studies have found that Humor positively associates with cognitive flexibility (Ponterotto et al., 2014), prosocial giving behavior (Fietzer et al., 2016), and college self-efficacy (Fietzer et al., 2019). However, these studies involved undergraduate college samples from the United States, whereas the present study involved individuals who identified as first- or second-generation immigrants. Thus, Humor may play a different role for immigrants and their children in the United States than it does for collegiate populations that are U.S. originating. It may be that Humor is more of a defense mechanism for immigrants in the United States to protect themselves from the constant flow of xenophobia they experience in the United States (Zilberg, 1995). Although more research is required to better understand this phenomenon, it may be that increased levels of humor in first- and second-generation immigrants are more likely to reflect a survival strategy.
The resulting MPI-34 is now the shortest instrument in the literature that measures MP. Further, items that used outdated and discriminatory language on the Diverse Sexual Orientation Affinity group-level factor were removed and replaced with items that give the factor more cohesiveness and evidence of its psychometric utility. There is adequate, although partial, evidence of its invariance across race, gender, and immigration status, thus supporting H2 for the MPG portion of the MPI. The MPI-34 factors, with the exception of Psychological Health, demonstrated modest or no relationships with social desirability, thus supporting H3. The results supported H4 and H5, as color-blind racial attitudes and social dominance orientation were inversely related to the MPI-34 factors. Psychological Health was most predictive of mental health and distress, supporting H6. We found evidence of the MPI-34 subscales being positively associated with acculturation (H7), and life satisfaction (H8). In contrast with the findings from Fietzer et al. (2019), the MPI-34 subscales were not associated with high school achievement, so H9 was not supported. Perhaps this difference is due to the current sample reporting high school GPA, whereas Fietzer et al. (2019) reported current college GPA. We found partial support for H10, as Humor, Psychological Health, and the general MP factor were negatively associated with mental distress, and Social Justice Activism and Diverse Sexual Orientation Affinity were positively associated with mental distress. We found partial support for H11, since we could not include all Big Five factors in the SEM models. The use of a community sample and a graduate student sample provide two additional populations that further the evidence of the generalizability of the hygiology theory of MP along with those in prior studies of undergraduate students (Fietzer et al., 2016, 2019; Ponterotto et al., 2014). Given the results of the present study, we currently recommend that researchers prioritize the predictive validity of the MP and interpersonal cultural openness general factors along with the Humor factor. Depending on study purposes and hypotheses the seven individual factors can also be examined.
Limitations
The present study was limited in that it used an adult sample of convenience and a targeted adult sample. Thus, the present results require further validation with other populations, preferably with community samples from outside the Northeastern United States, which as a region is over-represented in the MPI literature. It would also be of value to test the MP model with adolescent populations, given that stable personality traits begin formation in earlier developmental stages (Ponterotto et al., 2008).
Another limitation is that the full factor structure of the MPI-34 was not tested for invariance, so invariance of the Interpersonal Cultural Openness factor or its group level factors remains unknown. Further, there is a possibility that issues with convergence in the invariance analyses were due to item or factor misspecification, although the replication of MPI-34 in a separate sample mitigates this somewhat. There is a need to examine the MPI longitudinally to determine whether it truly reflects personality traits that influence behavior. Another limitation is that we were not able to effectively examine the incremental validity of the MPI-34 beyond all five broad personality traits. One solution may be to use measures of the Big Five with stronger psychometric properties, such as the recently published BFI-2 (Soto & John, 2017).
Implications for Practice, Advocacy, Education, Training, and Research
The MPI-34 can be used across multiple groups when assessing general MP—important for an instrument that purports to assess an aspect of personality that is thought to be relatively stable across the lifespan (although not as stable as broad personality traits; Ponterotto, 2010). This is a timely instrument for researchers, and with further validation, testing, and language translations, can be quite useful for practitioners and educators. For example, the MPI-34 can assess how likely an individual is to embrace diversity and sociocultural change. This could enhance self-awareness for students in a multicultural counseling course or identify how individuals adapt to institutional cultural changes (e.g., law enforcement officers adapting to changes to police department culture in the wake of the activism spurred by the deaths of George Floyd & Breonna Taylor).
Clinically, practitioners in vocational settings could use the MPI-34 to assess how an individual adapts to a change in work environment, such as a worker having to relocate to another geographical location (i.e., a different region of the country or a new country) for a job. For mental health settings, the MPI-34 can assist individuals working with immigrants and refugees, identifying which individuals might be most at risk of major psychological struggles due to cultural issues not captured in traditional mental health assessments. The subscales can further assist practitioners in disentangling which issues contribute to such difficulties and suggest appropriate interventions. For instance, low scores on the Psychological Health subscale would indicate an anxious personality structure and might spur exploration around attachment issues, whereas low scores on racial and ethnic identity development would indicate an individual feels disconnected with their cultural identity and that exploration in this area could help transform cultural identity into more of a protective factor for them.
Footnotes
Author Note
We have no known conflicts of interest to discuss. The following report is based on data presented at the annual conference of the American Psychological Association in 2018 in Fietzer & Sauda (2018).
Notes
Author Biographies
References
Supplementary Material
Please find the following supplemental material available below.
For Open Access articles published under a Creative Commons License, all supplemental material carries the same license as the article it is associated with.
For non-Open Access articles published, all supplemental material carries a non-exclusive license, and permission requests for re-use of supplemental material or any part of supplemental material shall be sent directly to the copyright owner as specified in the copyright notice associated with the article.