
Abstract
This study assesses the relationship between racial and ethnic change and change in crime in a different type of community—schools. Like neighborhoods, some schools are perpetually more dangerous than others despite turnover. This study investigates how change in the racial and ethnic composition of school enrollment plays a role in school-level crime. In addition, because schools are located within a community context, this study incorporates spatial context and includes information on crime and residential change in the neighborhood surrounding the school. Using a series of negative binomial regression models assessing the influence of changes in school-specific and local community factors on serious school offending (assaults, batteries, robberies, and property offenses that occurred on campus) over time, the findings reveal that that the relationship between school-level racial and ethnic change is moderated by the community-level changes, but that the relationship is specific to school type and contrary to theoretical expectation.
School violence is often the “headline” news. But when most people think of school violence, images of mass school shootings such as the Columbine tragedy in 1999 and the recent massacre in Newtown, Connecticut, often come to mind. Or, bullying and students who have been “bullied to death” 1 have garnered national attention. The media focus on these two types of school violence, however, overlooks the day-to-day violence that students in some schools face. Evidence suggests that despite a decline in crime in Los Angeles overall, the rate of offenses in and at schools is rising (Limbos & Casteel, 2008). The media, and some former Louisiana school employees, are quick to conclude that Los Angeles schools are “battled-scarred,” and “violent and unpredictable.” 2 Disorder in schools disrupts the ability of school faculty and administrators to educate; teachers preoccupied with disruptive students and behavioral issues rather than instruction lead to a lower quality of education and high drop-out rates.
In Los Angeles in particular, student violence is a more routine affair that, in part, emanates from racial and ethnic tensions. Like the city itself, Los Angeles schools have undergone significant change in the racial and ethnic breakdown of enrolled students. In 1993, 66% of the Los Angeles Unified School District (LAUSD) students were Latino, 14% African American, and 12% non-Latino White. By the 2006-2007 school year, Latinos comprised 73% of the students, African Americans 11%, and non-Latino Whites were only 8% of the enrolled population. In some areas of the city (i.e., South Los Angeles), 75% of the students are Latino, 20.5% African American, and less than 5% Other (including non-Latino Whites). This tension, often between Black and Latino students, has recently manifested as violence in some LA high schools. In 2005, months-long racially motivated fights at Jefferson High School, where the student body shifted from 31% Latino 25 years ago to 92% Latino in 2005, made front-page news (Shields, 2005). The Jefferson High School principal considered the riots, in part, caused by racial tensions that “were coming out of the community and into the schools” (as quoted in Ofari-Hutchinson, 2005). The following year, a campuswide brawl at Locke High School involved an estimated 600 students, required police in riot gear to suppress, and resulted in the arrests of three students. According to students, this fight too originated from conflict between Latino and Black students (Associated Press, 2008). 3
School violence varies depending, in part, on school structure. Just as crime tends to cluster in only certain neighborhoods or parts of neighborhoods, some schools are perpetually more dangerous than others even within the same school district. For these schools, safety remains a perpetual concern despite turnover in the student population, suggesting that school structure is related to student safety. Indeed, school context has been linked to other behavioral and academic outcomes such as graduation rates (Swanson, 2004), self-reported student delinquency (Gottfredson, Gottfredson, Payne, & Gottfredson, 2005), academic achievement (Lee & Bryk, 1989; Rosenholtz, 1985), and to a lesser extent, illicit drug use (Eitle & Eitle, 2004). School context is also an important predictor of youth victimization. A substantial proportion of youth violence takes place at school (National Center for Education Statistics [NCES], 2007), and Snyder and Sickmund (1995) determined that 56% of all juvenile victimizations (violent and otherwise) occur on school grounds. Little research, however, has examined how school context changes over time and how these shifts in context are—or are not—associated with student victimization and offense rates. Given this, I examine how change in school context affects levels of serious student offending in schools. In particular, I am interested in how changes in the racial and ethnic composition of the student body influences crime on school grounds, and whether school-specific factors such as increasing the proportion of qualified teachers, decreasing the student-to-teacher ratio, and raising test scores can account for the change in student offenses.
Schools, however, are not isolated entities but rather an extension of the local environment. Local crime and violence “intrudes into schools” leading some researchers to argue that the community in which the school is located is vital to understanding the school level of crime and violence (Menacker, Weldon, & Hurwitz, 1990, p. 68). Indeed, problems of school crime vary by neighborhood type, with fewer reported cases of violence in middle- or high-income neighborhoods than in low-income areas (George & Thomas, 2000; Gottfredson & Gottfredson, 1985), or schools in nonurban areas (Nofziger, 2009). Therefore, I also examine the effect of changes in the local community characteristics on crime within schools. I look specifically at how change in the racial/ethnic composition of the local community outside the school is related to racial and ethnic change within school, how it affects levels of offending inside the school, and examine whether the relationship between local community factors and school factors operates through school-level racial/ethnic change, or, if in fact, the effect of school racial and ethnic change is conditional on the community setting.
School-Based Explanations of Student Offending
The majority of school-based delinquency or crime studies focus on the individual students, but as Graham (2006) argued in her research on school victimization (primarily bullying), the larger context in which the abuse occurs is an important predictive factor. She finds that students in schools with a more racially/ethnically diverse enrollment feel less vulnerable to bullying and are less likely to be victimized. Other studies suggest that school diversity inhibits social connections. For example, people in racially heterogeneous environments are less likely to interact with members of another racial/ethnic group (Duster, 1993). Other factors within schools can foster delinquent activity and inhibit the prosocial student interaction necessary to form a communal environment. Indeed, the ability of students to form networks in school is largely based on physical proximity to and opportunities to interact with other classmates: Students cannot form relationships if they do not have contact with others. In schools with low attendance rates and a changing population through student transfers or suspensions, students will have infrequent contact with other students, be less likely to recognize their classmates, and unable to form meaningful social connections. School factors such as class size and the student-to-teacher ratio are also associated with student offending (Hellman & Beaton, 1986; Welsh, Stokes, & Greene, 2000) and teacher assault (Casteel, Peek-Asa, & Limbos, 2007) through the impact on student interaction and the ability of teachers to interact with students and monitor and control student behavior.
Studies have shown that schools with a larger the proportion of minority students, more male students, and greater poverty rates have higher victimization rates (Gottfredson & Gottfredson, 1985; Payne, Gottfredson, & Gottfredson, 2003). Likewise, a NCES 1993 phone survey of approximately 6,500 sixth- to twelfth-grade students and their parents found that students and teachers in schools with larger enrollments and greater than 41% of the students receiving lunch subsidies (an indicator of poverty) were more likely to be victimized. Payne et al. (2003) assessed the relationship between communal school organization—which they equate to Sampson, Raudenbush, and Earls’s (1997) collective efficacy—and teacher victimization, student victimization, and student delinquency. Although they relied on only faculty perceptions of “supportive and collaborative” environments with “common goals and norms” (as opposed to student opinions), they found that schools that are more communally organized have fewer incidents of student victimization and delinquency (Payne et al., 2003, pp. 757-758). The authors also determined that high schools in general have lower levels of delinquency than middle schools, and schools with more male students and African American teachers and students had higher levels of student delinquency. In contrast, Limbos and Casteel (2008) determined that high schools have higher levels of crime than middle schools in Los Angeles.
As previously mentioned, racial and ethnic composition of the student body is also associated with crime and delinquency in schools; though the relationship is more difficult to ascertain. On the neighborhood level, heterogeneous populations are associated with higher crime rates because the diversity interferes with residents’ ability to communicate with other groups and develop social bonds. But some work suggests that heterogeneity within schools actually reduces victimization by evening the balance of power (Graham, 2006) or facilitating cross-group friendships (Chang, 1999). One of the premises of group threat theory (Green, Strolovitch, & Wong, 1998) is that as a formerly minority group increases in size relative to another group, the likelihood of between group violence increases. Turnover within the student body then not only decreases social connections between students by reducing the frequency and duration of student contact, but racial and ethnic transition specifically can shift the balance of power if a school becomes more homogeneous and one group is increasing in size relative to the others.
Although few other studies have looked specifically at why some schools have continuously higher crime rates than others, the few that do often rely on elements of the school’s physical structure (Galloway, Martin, & Wilcox, 1985; Plank, Bradshaw, & Young, 2009). That is, the physical condition of the school building, including literal broken windows, graffiti, litter, and dilapidated classrooms, encourages deviant behavior in the classroom by signaling to the students that no one cares. Plank et al. (2009) found a direct association between physical disorder and social disorder in schools, though Galloway et al. (1985) found no relationship between the condition of the school building and suspension rates. Furthermore, Sampson and Raudenbush (1999) argued that signs of physical decay do not directly cause crime in neighborhoods, but that physical and social disorder are symptoms of the same underlying issues (i.e., lack of collective efficacy and community organization). Indeed, other research suggests that poor structural conditions of school buildings affect students’ perceived fear (Mijanovich & Weitzman, 2003) that leads to decreased social interaction and decreased collective efficacy (Plank et al., 2009).
School climate theory argues that school culture, organizational structure, social milieu, and the physical condition of the school building all influence disorder on school campuses rather than the community outside the school. School culture and the organizational structure define acceptable behavior within the school, and refer to indicators such as students’ perceived threat or fear of danger, arbitrariness of rule enforcement, student and administrator knowledge of rules, student attendance rates, and school financial resources. School size, average student attendance, and high student–teacher ratios in particular are often linked to higher rates of school disobedience (Gottfredson & Gottfredson, 1985; Hellman & Beaton, 1986). In larger schools, administrators and teachers have a reduced ability to monitor student behavior (Toby, 1983), and the anonymity increases the likelihood of victimization of socially isolated or new students (McDermott, 1980). School structural features that are predictive of higher levels of school disorder are large size, high student-to-teacher ratios, and limited resources for educational supplies (Gottfredson & Gottfredson, 1985). Welsh (2000) concluded that school climate is a better predictor of minor student misconduct than more serious forms of student offending.
The sociodemographic background of students and teachers, including information on the racial/ethnic composition, gender, income, and teachers’ experience, are often considered measures of school social milieu and are significantly related to school disorder. For example, Casteel et al. (2007) found that schools with more male teachers, more male students, and higher proportions of students on the free-lunch program were associated with greater rates of reported teacher assault, and Nofziger (2009) showed that males, older students, and students enrolled in schools located in cities have higher victimization rates. The physical condition and layout of the school building also contribute to levels of school disorder, often by obstructing or reducing supervision in the hallways, lavatories, near entrances and exits, and in stairwells (Crowe, 2000). School infrastructure, especially the use of temporary classrooms and inadequate custodial services, is associated with decreased student attendance and increased drop-out rates (Branham, 2004).
Community Explanations of Student Offending
School environment often reflects the larger ecological conditions of the local neighborhood (Laub & Lauritsen, 1998) and one would expect that neighborhoods showing elements of social organization would also have socially disorganized schools. That is, neighborhoods characterized by high rates of residential mobility, poverty, and racial/ethnic heterogeneity traditionally have higher crime rates because of a lack of informal social control (e.g., Bursik & Grasmick, 1993; Sampson & Groves, 1989; Shaw & McKay, 1942). Schools can be affected by these negative factors through direct contamination effects in which community attributes exert a negative influence in the school environment, or an indirect importation effect where students bring characteristics of their community into the classroom (Vartanian & Gleason, 1999). For example, the community poverty level can directly contaminate school structure by limiting the financial resources available to the school, and negatively affecting the funding available for hiring quality teachers and implementing effective recreational and educational programs.
One characteristic that may cross from the neighborhood into the school is crime. Several studies find a significant correlation between community crime rates and school offenses (Menacker et al., 1990). Schools located in communities with high crime rates are more likely to have higher rates of violence on school property than schools in safer neighborhoods (Gottfredson & Gottfredson, 1985). Characteristics of socially disorganized communities can also indirectly affect crime and violence in schools when residents import behaviors/factors that were generated in the community into the school. That is, students not only are exposed to more crime or risk in these environments but also may bring the norms of the streets into the schools. If boundaries of acceptable behavior are not clearly established in socially disorganized communities, the local may likewise be impaired accomplishing the same objective, in part because students coming from those areas may be less likely to obey rules or abide by established social norms. In addition, the tough neighborhood and potentially dangerous walk to and from school may encourage students to bring weapons to campus (Halliday-Boykins & Graham, 2001). Prior research has concluded that children who are exposed to violence at home or in their neighborhood have an increased likelihood to develop emotional problems (Martinez & Richters, 1993), including depression, suicidal thoughts, and posttraumatic stress disorder (Mazza & Reynolds, 1999); be truant from school or use drugs (Knapp, 1998); and an increased likelihood to use violence within their own lives (DuRant, Cadenhead, Pendergrast, Slavens, & Linder, 1994; Nofziger & Kurtz, 2005).
Welsh and colleagues have completed a number of studies assessing the relationship between student, institutional, and community factors predicting school disorder. In one article, they found that the social disorganization of both the local community immediately surrounding the school and the “imported communities”—aggregated measures of the census characteristics of where students are from—exert a significant influence on the level of school disorder through the effect on school stability 4 (Welsh et al., 2000). Another study found that community characteristics predicted violence only in high schools (measured as suspension rates), but school-specific factors were better predictors of misconduct in middle schools (Hellman & Beaton, 1986). It is worthwhile to note, however, that research has also found that community-level crime is not significantly related to school crime (Baker, Mednick, & Carothers, 1989; Limbos & Casteel, 2008).
Data and Method
The current study investigates the relationship between rates of serious student offending in schools and racial/ethnic change in the school and the community. In particular, I am interested in determining whether changes in racial/ethnic diversity impact rates of student-perpetrated offenses on school grounds in the same way that racial/ethnic diversity in communities has been linked to higher crime rates under a social disorganization framework. I utilize data from Los Angeles middle and senior high schools. Los Angeles is racially and ethnically diverse and employs an independent police force—the Los Angeles Unified School District Police Department (LASPD). The LASPD is a specialized force that monitors LASPD’s campuses and is a distinctly different entity than the Los Angeles Police Department (LAPD) that patrols the city. The LASPD is the largest school police force in the country, employing almost 500 police and safety officers. Unlike many prior studies of student offending and victimization that use self-report data, I use official crime report data from the LASPD. By using official crime data, I reduce the known limitations of self-report data (particularly respondent underreporting because of fear or embarrassment or in reference to the student’s own participation in illegal activities). LASPD crime data are also more equitable and comparable with the definitions of crime used in larger community-based crime analysis (such as the Part I crime data provided by the LAPD).
Los Angeles is the second largest school district in the United States and enrolls approximately 700,000 students a year. To focus on students more likely to be engaged in criminal or deviant activities, the analysis is limited to Los Angeles middle (or junior high) and senior high schools that have remained open between 2000 and 2006. The total number of schools included is 93: 55 middle schools and 38 high schools. 5
Dependent Variable
The dependent variable is the total number of serious violations in the 2006-2007 school year. To get a measure of the change between 2001 and 2006, I control for the total offense rate of the 2001-2002 school year, where the rate is calculated as the number of offenses per 1,000 enrolled students. I sum the total number of assaults, batteries, robberies, and property offenses to create an index of serious offenses, also referred to as total crime (to equate to community total crime). Only the most serious offenses are included, which are more likely to be reported to the school police and those most easily compared with the community crimes. LASPD defines assaults as fights involving weapons as opposed to batteries which are fights without a weapon present; robbery is taking something that belongs to someone else while using threat, force, and/or a weapon; and property offenses typically refer to thefts on campus. Prior research on school crime has shown that, in general, theft, vandalism, and property damage are the most prolific nonviolent crimes (Elliott, Hamburg, & Williams, 1998), and assaults account for the majority of violent acts within schools (Kingery et al., 1995). Therefore, it is likely that my chosen dependent variable appropriately captures the majority of the range of crime occurring within schools. On average, there are a total of 42.8 total offenses each year. High schools average a greater average number of offenses (64) than middle schools (28). The majority of crimes are property offenses (33) and batteries (6) followed by an average of fewer than 4 robberies and 2 assaults a year. In general, the number of crimes reported to campus police annually remains relatively stable between 2001 and 2006, 6 with the exception of the number of robberies that increased in high schools.
Explanatory and Control Variables
Demographic and enrollment information for the schools was obtained from the LAUSD. On average, there are 2,178 students in each school, ranging from 733 at the low end to a high of 4,487. High schools have a slightly larger enrollment (2,854) than middle schools (1,698). Students were classified in the following racial/ethnic categories: Hispanic, African American, Asian, Pacific Islander, Filipino, Native American, and Other White. The percentage of each group is calculated by dividing the total group count by the total school enrollment. In 2006, schools averaged 71% Latino or Hispanic, 13% Black, 4% Asian, and just less than 10% non-Latino or Other White. About 2% of the student body are registered Filipino and less than 1% each Native Americans and Pacific Islanders. The racial/ethnic breakdown is consistent between high schools and middle schools.
Given that the majority of students in Los Angeles public schools are minorities, to get a general measure of racial/ethnic change, I include a measure of racial/ethnic heterogeneity using all seven LAUSD racial/ethnic categories. I measure racial/ethnic heterogeneity using a Herfindahl index (see Gibbs & Martin, 1962; for a criminological example see Hipp, Tita, & Boggess, 2009). The calculation of the Herfindahl index is shown below:

where G is the proportion of the population that is racial/ethnic group j out of J racial/ethnic groups. The Herfindahl index ranges from 0 to 1 where larger values indicate more heterogeneity. On average, schools had a heterogeneity score of 0.379 in 2006, ranging from 0.017 to 0.732. In 84 schools (89%), the heterogeneity score between 2001 and 2006 decreased indicating that Los Angeles schools became more homogeneous over time. The average decrease in heterogeneity is 0.05.
Additional data on school characteristics come from the California Department of Education (CDE) or its partner, Education Data Partnership (Ed-Data), including indicators of average class size, percentage of students receiving a free or reduced cost lunch, and the percentage of fully credentialed teachers. In 2006, the average class size is about 30 students with 70% on a free or reduced meal program; schools average 103 teachers with about 71% fully credentialed. I also control for the age of the school building in 2006 as a rudimentary indicator of structural quality (under the assumption that newer schools are in better condition) and whether or not the school operates on a year-round basis. Schools with a year-round calendar may have more reported crimes because the extra months of instructional activity provide more opportunity for offenses to occur; 23 schools in the study are on a year-round calendar, 11 are middle schools, and 12 high schools. All variables are calculated as the difference between 2006 and 2001. Average school characteristics are shown in Table 1.
Average School Characteristics for All Schools, Middle Schools, and High Schools, 2001-2002 School Year and 2006-2007 School Year, Los Angeles, N = 93.
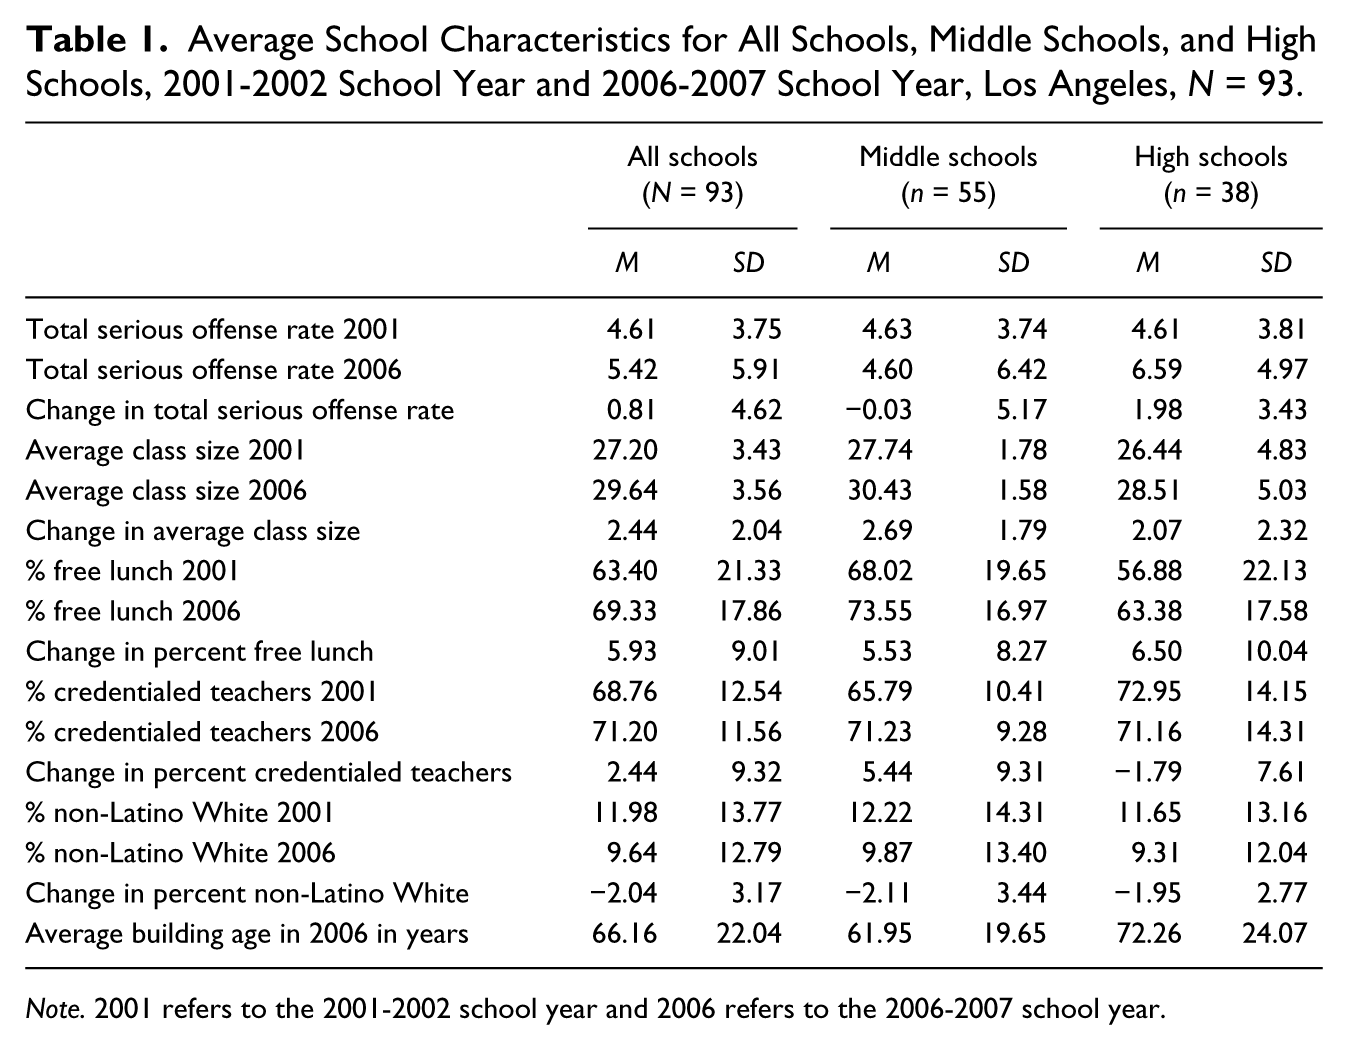
Note. 2001 refers to the 2001-2002 school year and 2006 refers to the 2006-2007 school year.
Community Characteristics
I also examine the effects of the immediate (“local”) community characteristics on racial and ethnic change and crime in schools. I aggregate crime and demographic data from census block groups that are within a quarter mile of the school address. The ¼ mile community contains information from a noncircular boundary: Any block group that intersects the ¼ mile radius from the school is included. 7 Welsh, Greene, and Jenkins (1999) also defined local communities as census tracts within a quarter mile of the school and found that the nearby community characteristics exert more of an effect on school disorder than further neighborhoods. The average local community comprised five census block groups and has a population mean of just less than 8,000 residents. Communities were created in ArcGIS 9. Table 2 shows the mean demographic information for communities.
Average Community Characteristics, Los Angeles, 2000 and 2005, N = 93.
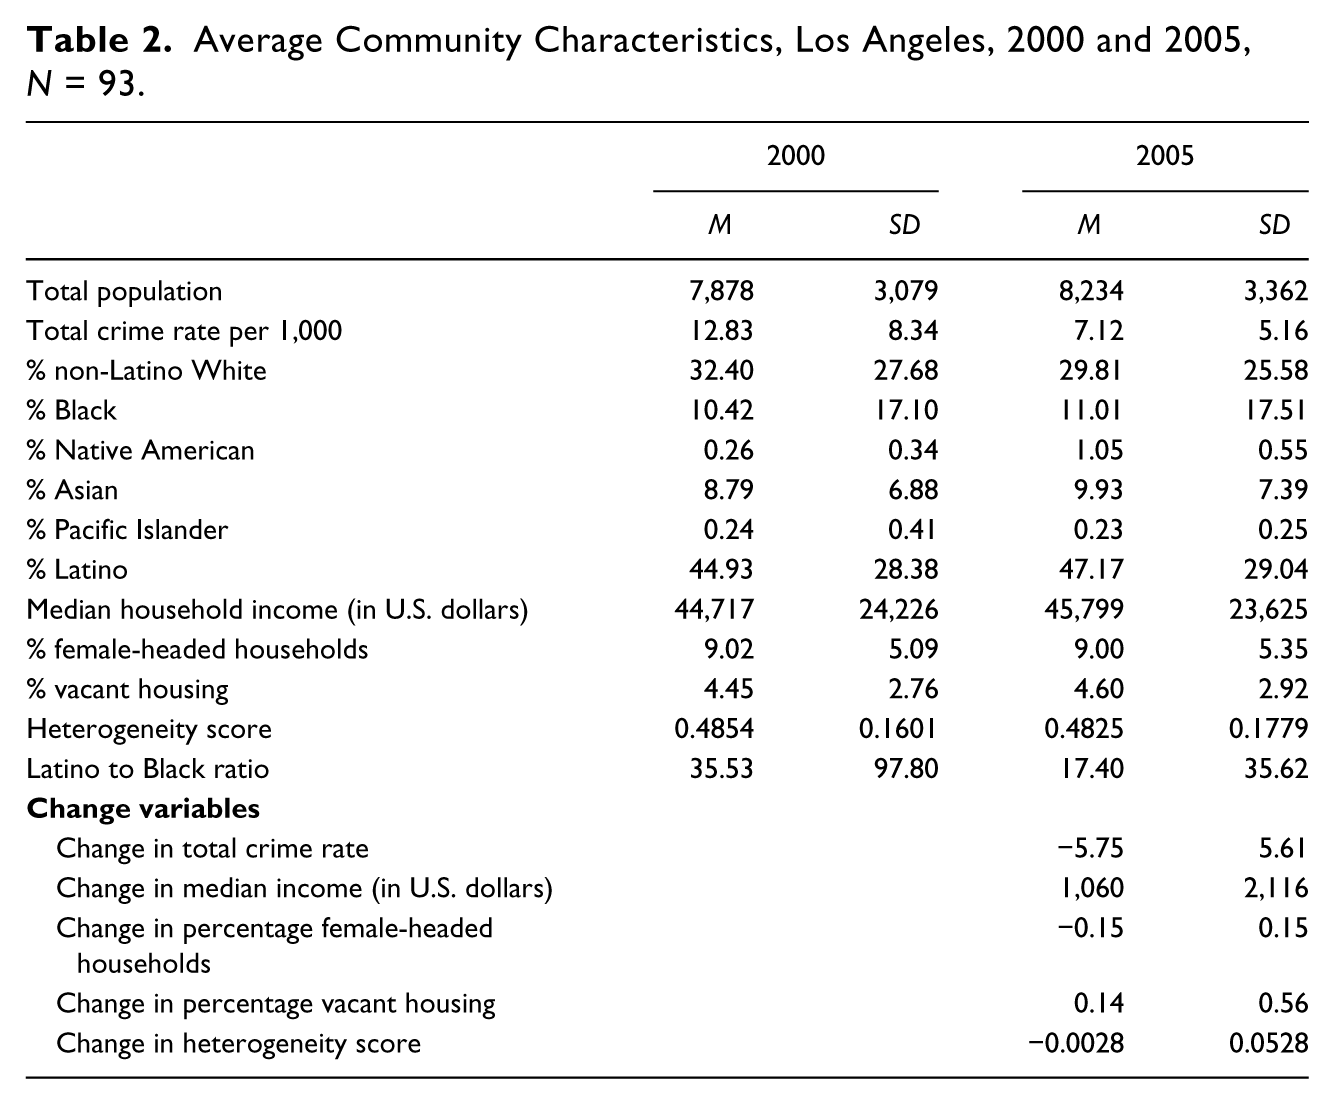
Crime data were obtained from the LAPD for individual reported crimes between 2000 and 2006. The crime points were mapped by census block group and then aggregated to obtain a total number of crimes by type per block group, regardless of age, gender, and race/ethnicity of the offender and victim. These block group values were then aggregated to the local community level surrounding the schools. As in the schools, I summed violent crimes into a total violent crime measure comprised assaults, robberies, and homicides. 8 I converted the total crime counts into rates per 1,000 residents. In 2006, there averaged 7.2 violent crimes per 1,000 residents. These rates represent a decrease from crime rates in 2000.
I relied on 2000 census block group data from the U.S. Census and used demographic and economic characteristics for 2005 from GeoLytics, Inc. 9 Block group information was aggregated to the community level by summing the total counts for most variables and averaging the mean for income or household size variables. Racial/ethnic information for six major racial categories is included. I used the same categories as the school enrollment data with the exception of Filipino because the GeoLytics data does not estimate it. Therefore, I had racial/ethnic data on non-Latino Whites, Native Americans, Pacific Islanders, Asians, African Americans, and Latinos. In 2005, communities averaged 47% Latino, 29% non-Latino White, 11% Black, 10% Asian, and 1% or less each Native Americans and Pacific Islanders. Compared with the school data, the local communities have fewer Latinos and larger non-Latino White and Asian populations. Although communities averaged less than 1% Native Americans and Pacific Islanders, it was an increase of almost 200% since 2000. Change in heterogeneity is computed as the difference in heterogeneity score between 2006 and 2000; negative values indicate that heterogeneity is decreasing. There is little difference in the mean heterogeneity score for 2000 and 2005 (both average approximately 0.48). Community-level heterogeneity decreased in 53 (56%) communities between 2000 and 2005, but the average value of the change is less than 0.01; there were no communities where heterogeneity did not change.
I include explanatory variables that are correlates of neighborhood-level crime. Specifically, I include the percent of female-headed households and median household income. I calculated change over time in these variables by taking the difference between the 2005 estimated value and the 2000 value. Most neighborhood-level studies control for these (or similar) factors.
Table 3 displays the correlation coefficients for the community and school crime and demographic variables.
Correlations Between School and Community Characteristics.
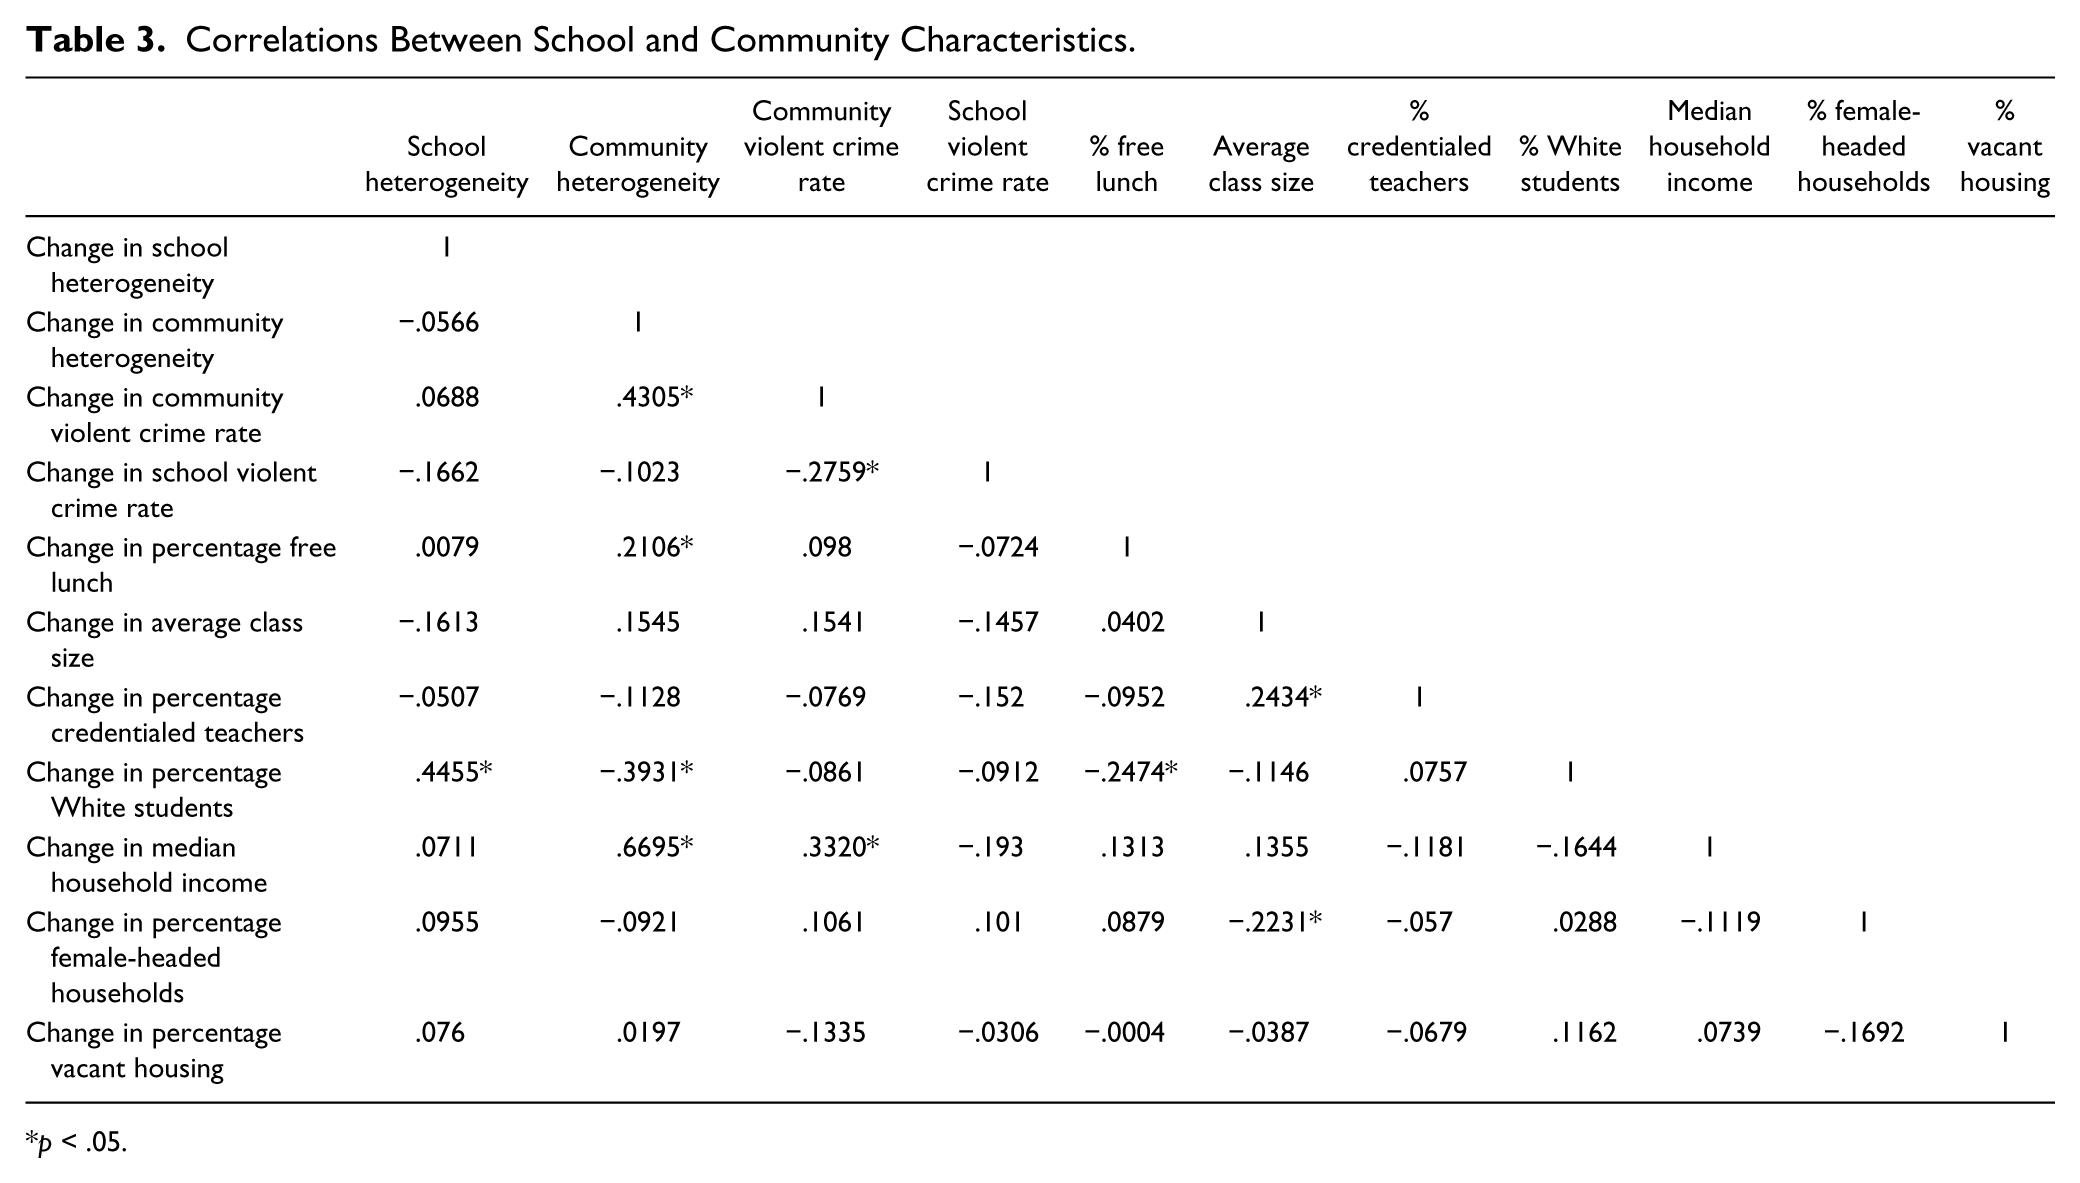
p < .05.
Analytic Strategy
To investigate these relationships, I use negative binomial regression models. 10 Negative binomial models are extensions of Poisson models that are used with count dependent variables where values are equal to or greater than zero (Osgood, 2000). Negative binomial models have been used in criminological research to examine cross-national homicides (Chamlin & Cochran, 2006), hate crimes in Chicago (Lyons, 2008), and the relationship between lynching and homicides in the South (Messner, Baller, & Zevenbergen, 2005). The dependent variable in this case is the number of serious offenses committed within schools (also referred to as total school crimes) reported to the campus police in the 2006-2007 school year. To reduce bias within models due to variation in the size of population at risk, I include an exposure variable that transforms the outcome to a per capita rate. I use 2006 total student enrollment an exposure variable to account for between-school differences in student body size; the exposure option is equivalent to taking the natural log of the school total enrollment and including it in the models with a coefficient constrained to one. I run a series of analyses: first, I test school-level characteristics on the rate of serious student offending; second, I include community factors in the model; third, I include an interaction term between community- and school-level heterogeneity. All analyses are run separately for all schools, middle schools, and senior high schools. I run my analyses in Stata 10.
Findings
The central theme of this research is the relationship between change in racial and ethnic composition and change in school crime. I explore this relationship by looking both at what happens within schools alone and also by examining the effect of changes in the local community characteristics on school offending. I focus on serious offenses (assaults, batteries, robberies, and property crimes), and I analyze high schools separate from middle schools.
In prior research, Graham has argued that schools with more racial and ethnic diversity have lower levels of students victimized by bullies. To test whether this is also applicable to more serious offenses on campus, I first ran a simple cross-sectional negative binomial model of school crime in 2006 on school heterogeneity (controlling for total student enrollment in 2006). In support of Graham’s conclusions, I find that higher levels of school heterogeneity is significantly associated with fewer serious offenses in school (b = −0.9123, incidence rate ratio [IRR] = 0.4016, p < 0.01). The metric coefficient of −0.9123 translates into an IRR of 0.402 by taking the antilog of the coefficient. This means that a one-unit increase in the heterogeneity score in 2006 is associated with 60% fewer serious school offenses. As the heterogeneity score can only range from 0 to 1, this means that a completely heterogeneous institution would have 60% fewer crimes than a completely racially homogeneous school. A more meaningful translation would be that a difference of 0.10 in the heterogeneity score is associated with approximately a 9% reduction in the number of serious offenses (by taking the antilog of 0.10 × −0.9123).
School Models
In this section, I present the results of school-specific analyses without yet accounting for the potential effect of community characteristics. In each model, I used negative binomial regression analysis with school total enrollment in 2006 to 2007 as the exposure variable with the coefficient constrained to one. The included variables measure the change between 2000 and 2006 in school characteristics, including the average class size, the percentage of students receiving free or reduced lunches, the percentage of fully credentialed teachers, and the percentage of non-Latino White students enrolled. 11 In addition, I control for structural age in 2006 as an estimator of the physical condition of the school building, whether the school operates on a year-round calendar, and school status (a binary control for high schools vs. middle schools). 12 The results for all schools are shown in Model 1, Table 4.
Negative Binomial Regression Model of School Serious Offenses on School Change in Racial/Ethnic Heterogeneity by All Schools and School Type.
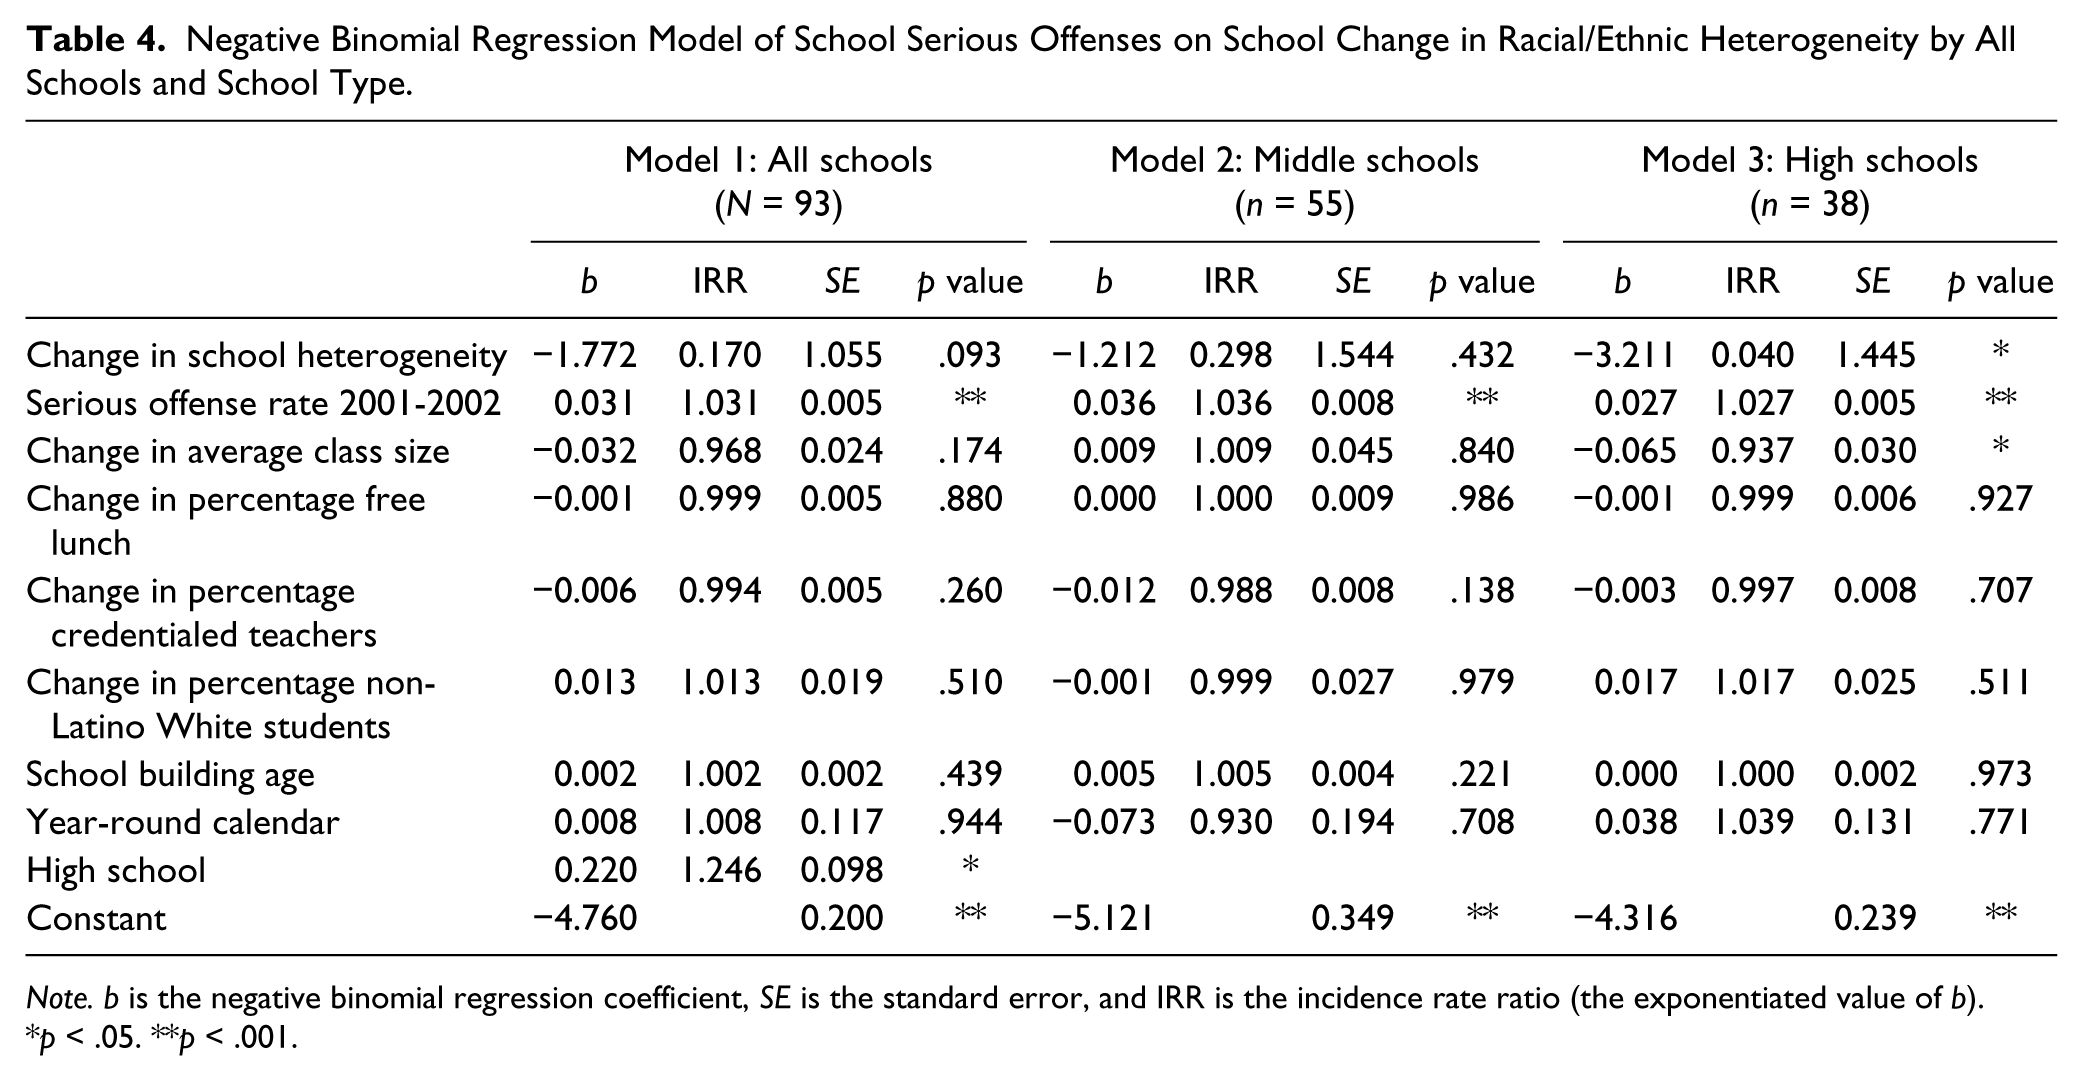
Note. b is the negative binomial regression coefficient, SE is the standard error, and IRR is the incidence rate ratio (the exponentiated value of b).
p < .05. **p < .001.
Two important conclusions from Model 1, Table 4 are (a) change in student body racial/ethnic heterogeneity does not significantly predict change in school crime at an alpha level of 0.05 and (b) the majority of school-level characteristics are nonsignificant. Change in heterogeneity approaches significance at α = 0.10. The negative relationship means that as heterogeneity increases, the rate of serious student offending decreases; this is in line with the bivariate relationship found above and suggests that student diversity may play a protective factor in middle and high schools. This raises the possibility that there may be a meaningful relationship between heterogeneity and school offending that is not picked up due to a small sample size. The exponential of the beta coefficient gives the IRR for a one-unit increase in the independent variable. As 1 is the maximum heterogeneity score and unlikely to observed, I multiply the beta by 0.10 prior to exponentiating. This gives an IRR of 0.837, equivalent to a 16% reduction in serious school offenses for an increase of 0.10 in the heterogeneity score between 2000 and 2005.
The other major finding worth highlighting in Model 1 is that the majority of school factors have no discernible impact on the change in the school serious offense rate. Limbos and Casteel’s (2008) prior work on Louisiana schools found that the proportion certified teachers and the student to staff ratio predict decreased in-school crime, whereas schools with test scores below a basic performance level are predictive of higher crime rates in cross-sectional models. Mansfield, Alexander, and Farris (1991) showed a positive correlation between the percentage of students on free-lunch programs and the percentage of teacher victimizations. However, I find no evidence that changes in these (or similar factors) affect changes in school crime. That is, schools on a year-round calendar are not significantly different from schools on a traditional schedule; and increasing the proportion of credentialed teachers or decreasing the average class size is not associated with a significant reduction in offending as would be theoretically expected. The exceptions are the rate of serious offenses in the 2001-2002 school year and high school status. High schools are associated with an additional 24.6% of serious events relative to middle schools.
Although Limbos and Casteel (2008) determined that high schools and middle schools have significantly differently median values on a set of descriptive variables, the authors did not separate their analysis by school type. Given the significant difference between high schools and middle schools, I present the results for Models 2 and 3 in Table 4. In general, the results of Model 3 specify the relationship between racial and ethnic diversity and change in serious offending for high schools only. The effect of school-level heterogeneity change has a negative impact on school offenses; for each 0.10 increase in heterogeneity, there is a 27% decrease in school serious offenses. This is consistent with prior research (Graham, 2006) and my previously discussed results that indicate heterogeneity has a beneficial impact in schools. In addition, in the split models, the effect of average class size on high school student offending is now significant, but in a direction contrary to expectation. For each additional student in the classroom, the rate of serious offenses is expected to decrease by 5% to 6%.
Community Models
School-specific analyses not only suggest the importance of separating the sample by school type—middle schools and high schools—but also reveal that few school-specific characteristics predict school offending over time. In this section, I examine whether these relationships hold true when controlling for relevant community factors in addition to changes in school characteristics.
As in the school alone analyses, I include variables measuring the difference in community characteristics between 2000 and 2005 to capture the effect of community change on change in serious offenses in schools. Importantly, I include a community version of racial/ethnic change, but to simplify interpretation I separated the change in community heterogeneity factor into a binary variable with a value of 1 indicating communities where heterogeneity increased and 0 if it decreased. 13 I continue to use negative binomial regression models accounting for differences in school size by utilizing school total enrollment in 2006 as the exposure variable. Results for the change in the number of school crimes while controlling for community and school factors for all schools are presented in Model 1, Table 5.
Negative Binomial Regression Model of School Serious Offenses on School Change in Racial/Ethnic Heterogeneity by All Schools and School Type, Controlling for Change in Community Characteristics.
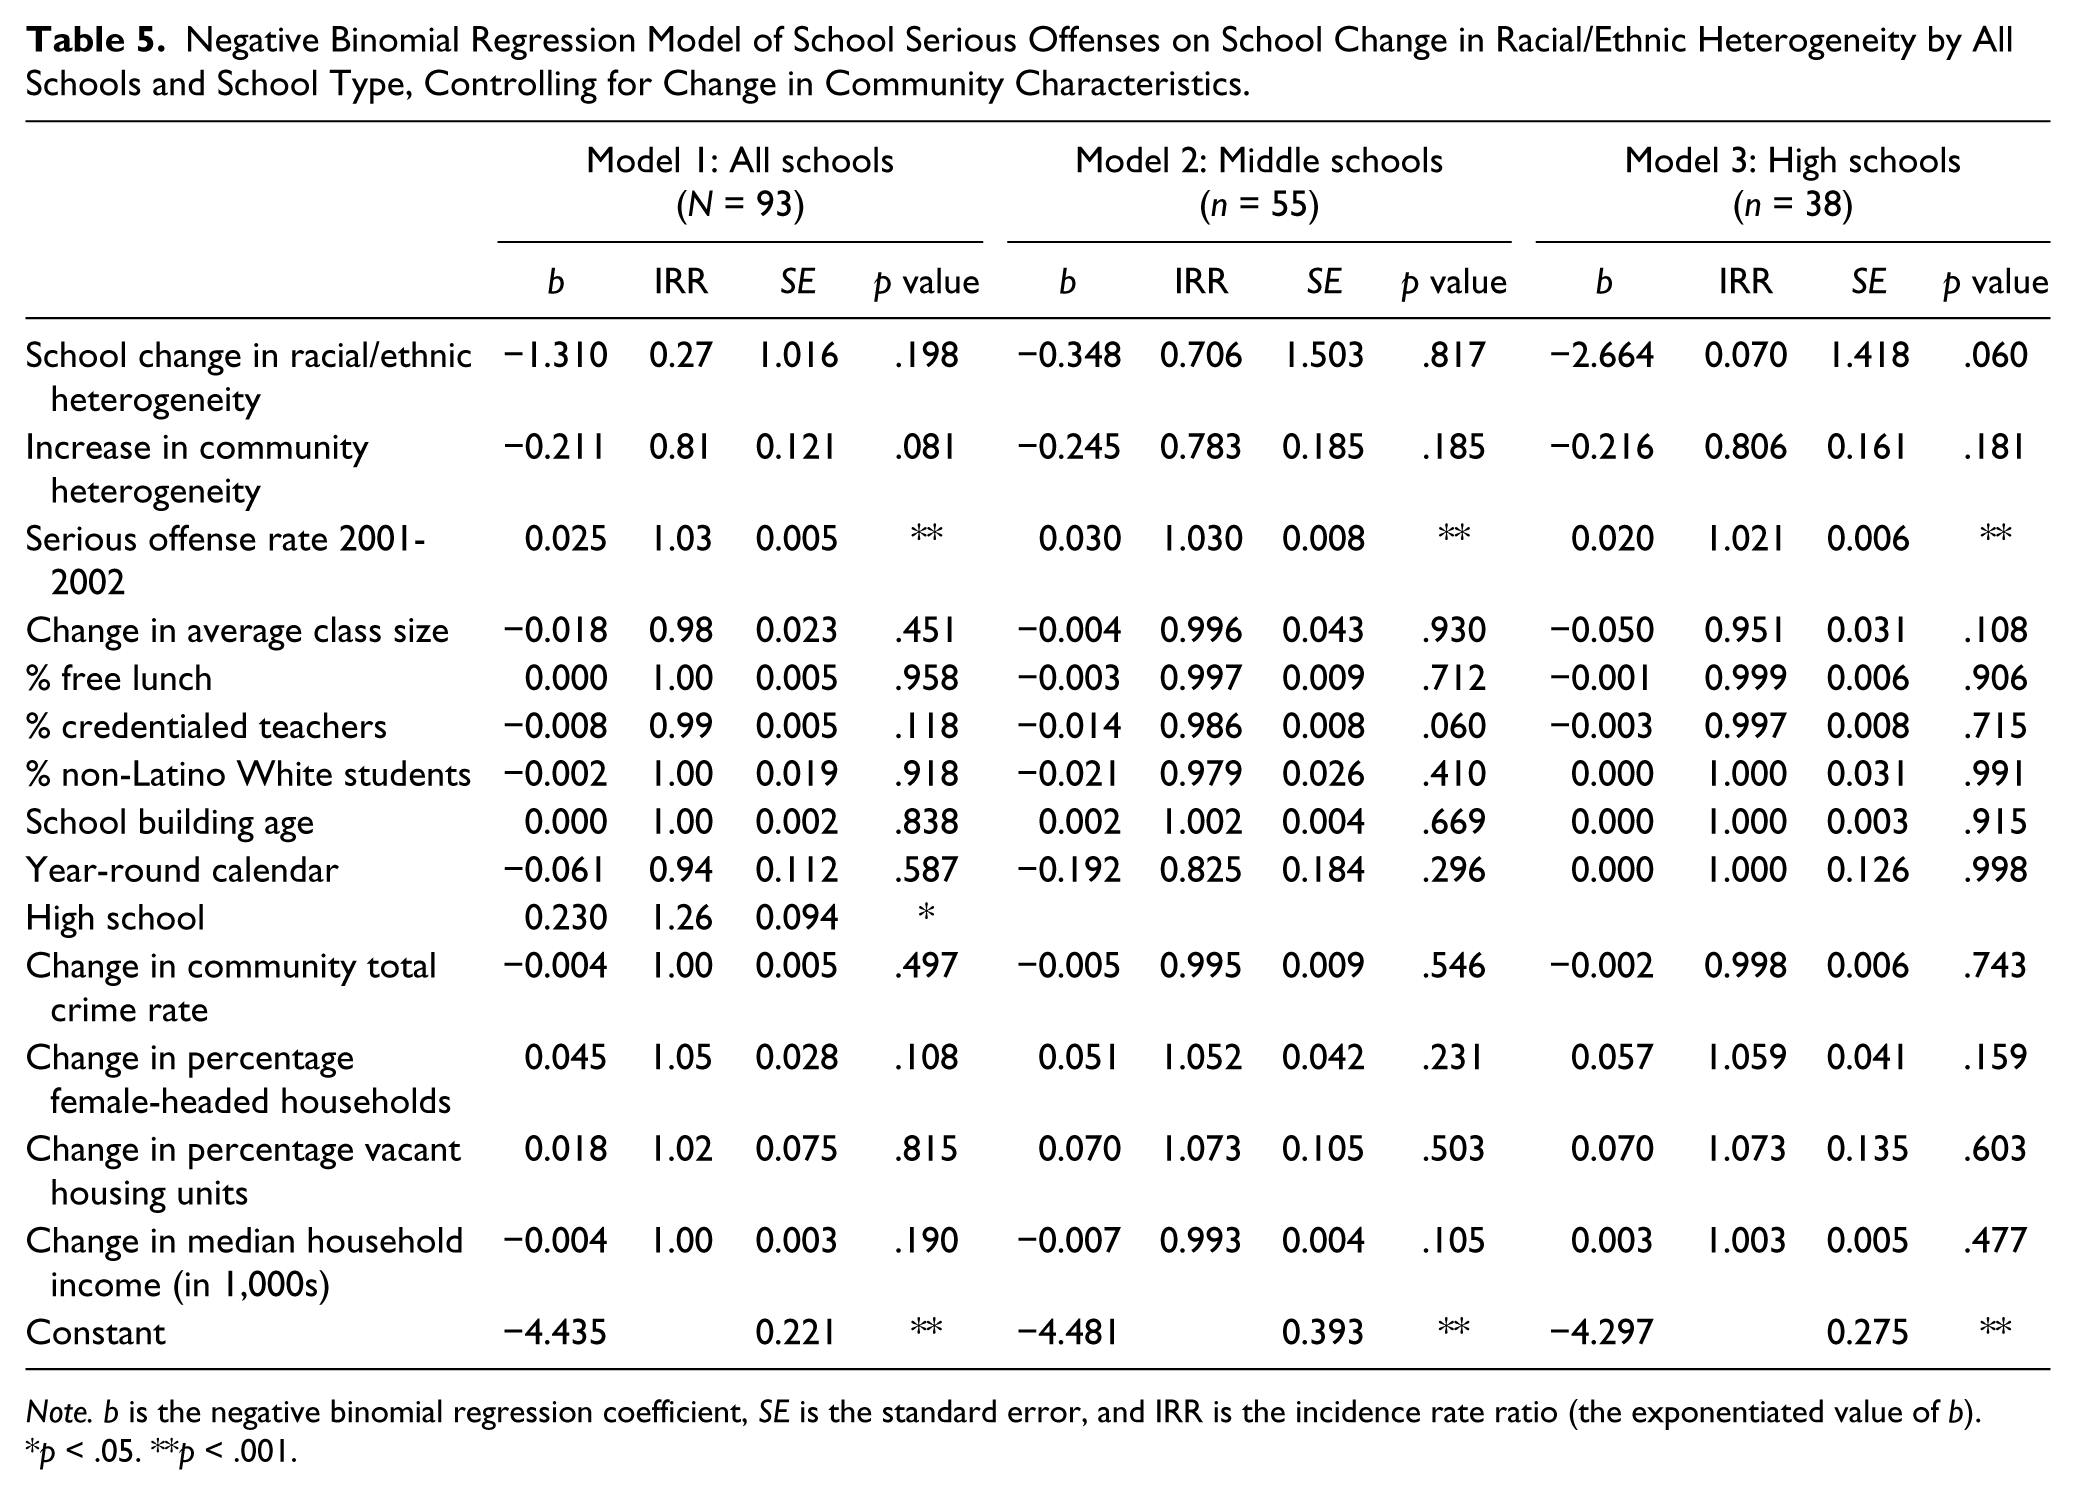
Note. b is the negative binomial regression coefficient, SE is the standard error, and IRR is the incidence rate ratio (the exponentiated value of b).
p < .05. **p < .001.
As revealed in Table 5, the relationship between increased community heterogeneity change and reduced school crime verges on significance (b = −0.211, IRR = 0.809, p = 0.081). This relationship mimics the negative relationship previously shown between school heterogeneity and student offense rates. It indicates that schools situated in communities that are becoming more racially and ethnically diverse have lower offense rates than schools surrounded by neighborhoods that are becoming more homogeneous. Interestingly, when the community heterogeneity increases the role of school heterogeneity in predicting student offense rates is nonsignificant (b = −1.31, IRR = 0.27, p = 0.198), though in the expected direction given earlier findings. Other community-level changes are nonsignificant and contribute little to explain change in school serious offenses. Schools located in communities that exhibit signs of increasing crime, social disorganization, or physical disorder do not have significantly different levels of serious offending than schools located in increasingly low crime or stable environments. As for school-level factors, with the exception of school offending rates in 2001 and high schools, the relationships remain nonsignificant when the community variables are included.
To investigate the differences between school types, I separate middle schools from high schools in Models 2 and 3 in Table 5. As anticipated, once the models are specified by school level, important distinctions between the two types of schools emerge. The pattern of findings remains essentially the same as in the full model in middle schools, but the nature of the relationship between racial and ethnic change and offending in high schools becomes more evident. School change in heterogeneity approaches significance as it did in previous models (b = −2.664, IRR = 0.070, p = 0.06), while the coefficient on community heterogeneity change is no longer significant at α = .10 (b = −0.216, IRR = 0.806, p = 0.181). So despite a smaller sample size (n = 38), the findings suggest that for an increase of 0.10 in the school heterogeneity level in high schools, the number of serious school offenses is predicted to decrease by a magnitude of 23%. Again, this replicates my previous results showing the potential beneficial effect of heterogeneous enrollments and the uniqueness of high schools.
Given that the relationships between community-level racial and ethnic change, school racial and ethnic change, and school offenses fluctuates when the analysis is separated by school type, it is probable that the effects of school racial and ethnic change are conditional upon community racial and ethnic change and school type. Therefore, next I include interaction terms in the regression analyses to investigate for this possibility.
Interaction Effects
Given the inconsistent results in the full model versus the split high school versus middle school models, and the logical likelihood that community change influences school change, I replicate the analyses above while controlling for the interaction between community and school change. The interaction term is the multiplicative value of the dichotomized community racial/ethnic heterogeneity and school racial/ethnic heterogeneity change variable. This captures the combined effect of communities and schools. I report only the results for the analyses by school type because previous results indicate that the full models mask meaningful differences between high schools and middle schools.
At the bivariate level, I have shown that change in school heterogeneity between 2001 and 2006 is significantly related to decreases in serious offenses but that the relationship disappears once changes in school and community characteristics are included. When the sample is separated by school type, however, change in school heterogeneity is a significant predictor of a decreasing rate of offending in high schools only. It is likely that when schools and communities are changing similarly, the effect on school offending is compounded. In the full model, adding the interaction variable has no significant impact (results not shown), thus I present the results for middle schools and high schools in Table 6.
Negative Binomial Regression Models of School Serious Offenses by School Type, Controlling for Change in Heterogeneity, and the Interaction Between Community and School Change in Heterogeneity.
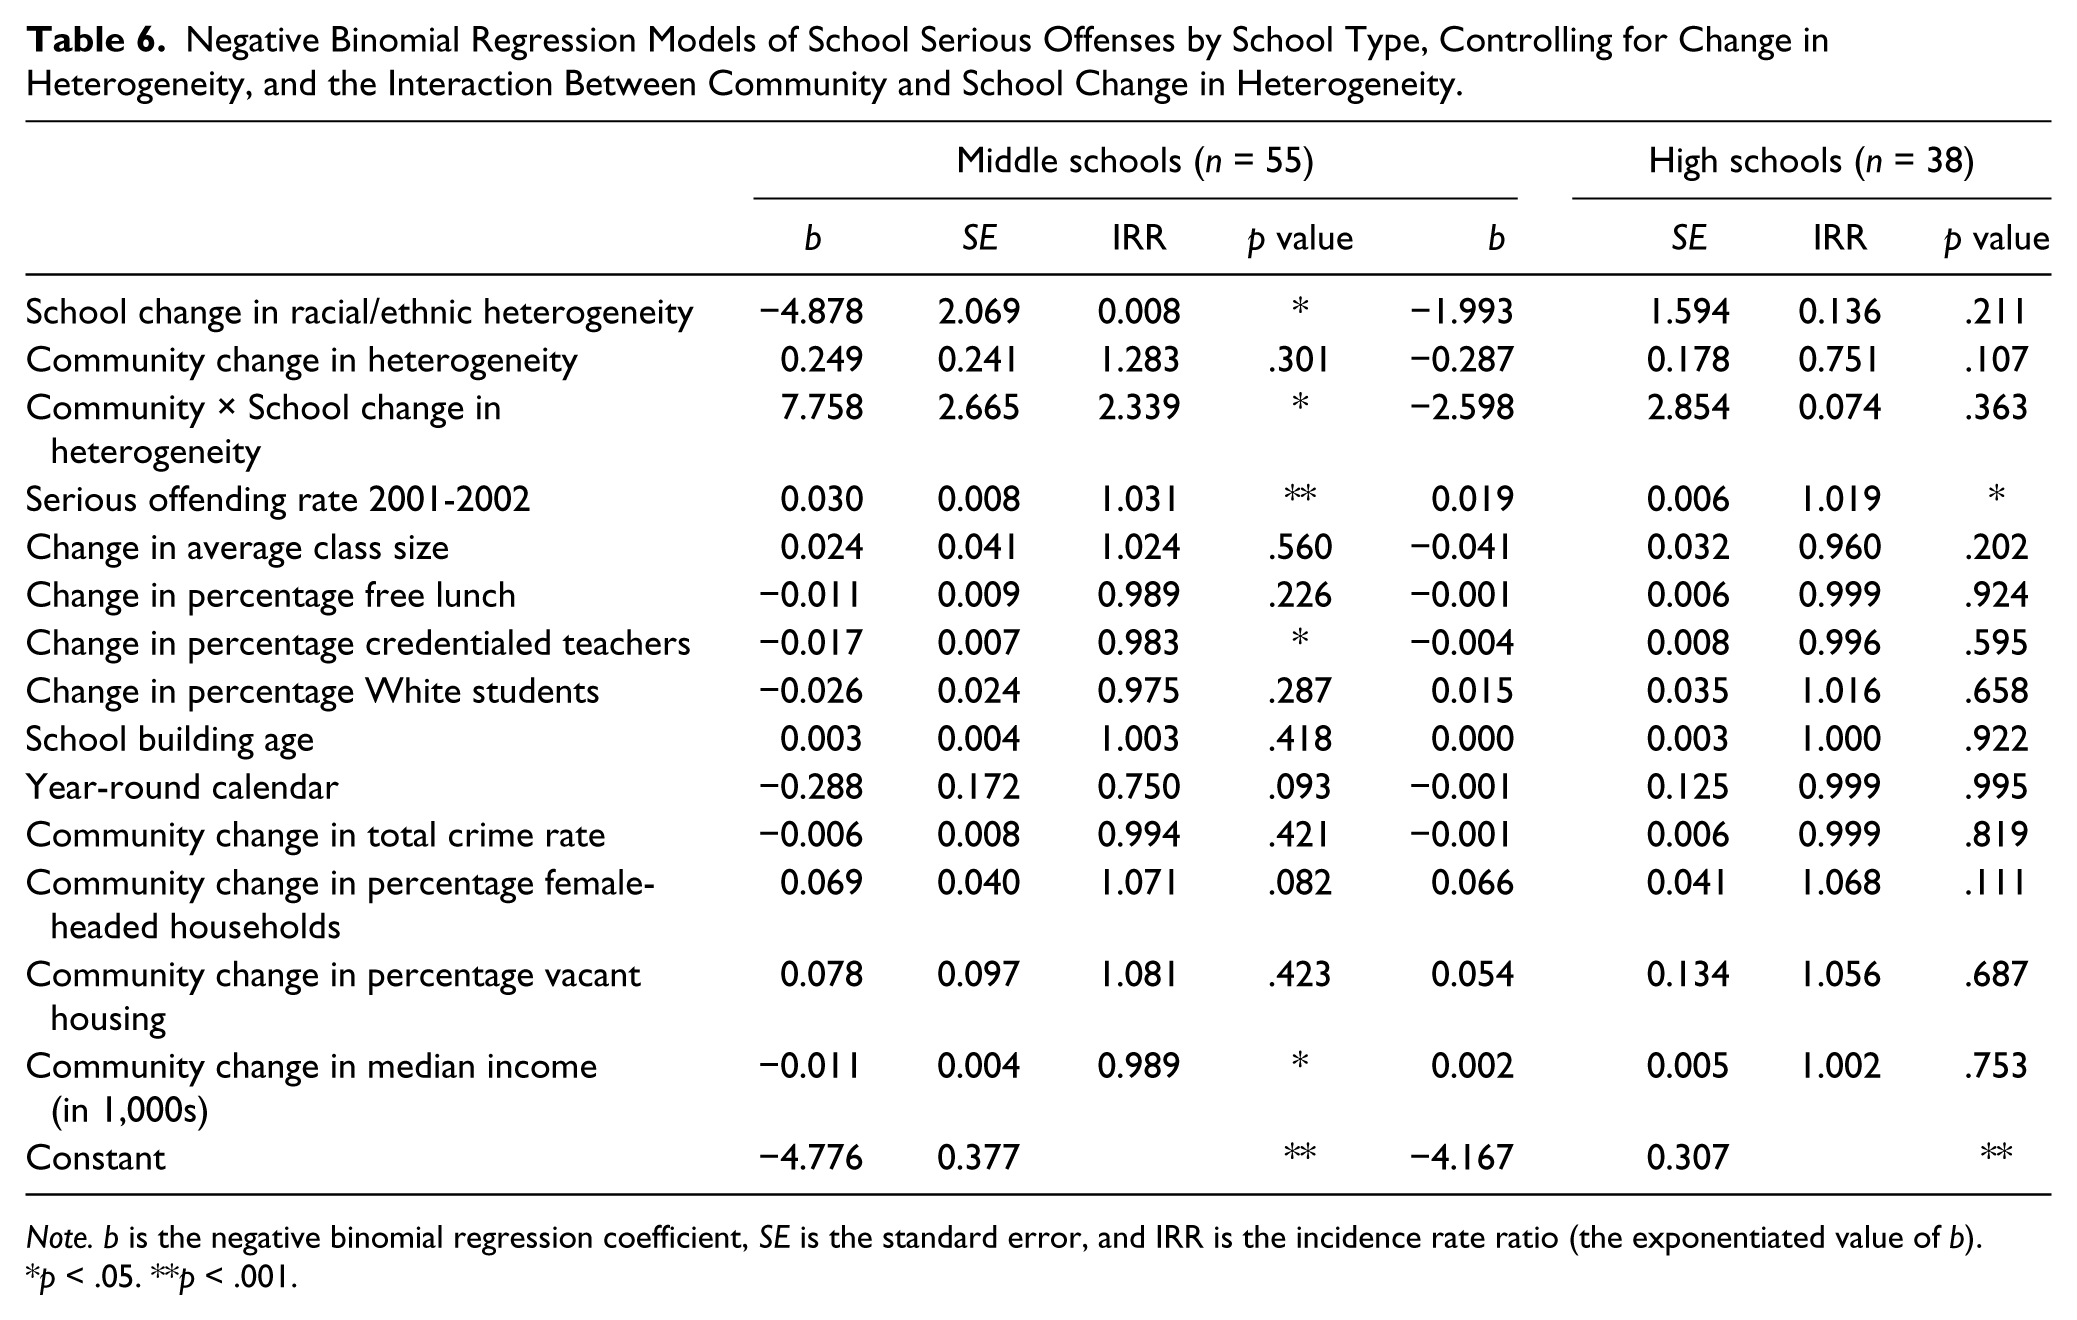
Note. b is the negative binomial regression coefficient, SE is the standard error, and IRR is the incidence rate ratio (the exponentiated value of b).
p < .05. **p < .001.
In the previous models, none of the racial/ethnic predictors had any meaningful impact on serious school offenses, though school heterogeneity change approached significance (p = 0.60). When the interaction term is included, however, the relationship is specified in middle schools only; neither level of racial and ethnic change nor the School × Community interaction is significant in high schools. This is contrary to the findings shown in Model 3, Table 5, which show that the effect of racial and ethnic heterogeneity on school offenses is specific to high schools, but the inclusion of the interaction term modifies the relationship such that the relationship is apparent only within the schools with younger students. That is, the effect of change in school heterogeneity on the rate of serious offenses in middle schools is conditional on whether the community heterogeneity is increasing or decreasing.
The interaction term is significant and positive (b = 7.758, IRR = 2,339, p < 0.05), though the main effect of school change on serious offenses is negative (b = −4.878, IRR = 0.008, p < 0.05). The relationship between community and school heterogeneity change and offense rates is more easily understood when considering the effect of school racial change in communities where heterogeneity decreased because both the effects of community change and the interaction term are 0. Therefore, the effect of school change in heterogeneity is equal to the exponential of the sum of the coefficients (−4.878 + 7.758 × 0), or an IRR of 0.008: An increase of one in school heterogeneity reduces serious offending by nearly 100%. For a more realistic increase of 0.10 in school heterogeneity, school serious offending would be reduced nearly 40% (IRR = 0.619) in communities where heterogeneity decreased.
However, for schools located in communities where heterogeneity increased, the effect of school racial change is equal to an IRR of 17.81 (the exponentiated value of (−4.878 + 7.758 × 1)). A 0.10 increase in school heterogeneity then reduces school offending by a magnitude of −170%. This is displayed in Figure 1, where it is shown that middle schools in communities with increasing heterogeneity have a much greater reduction in serious offending than similar schools situated in more homogeneous areas.
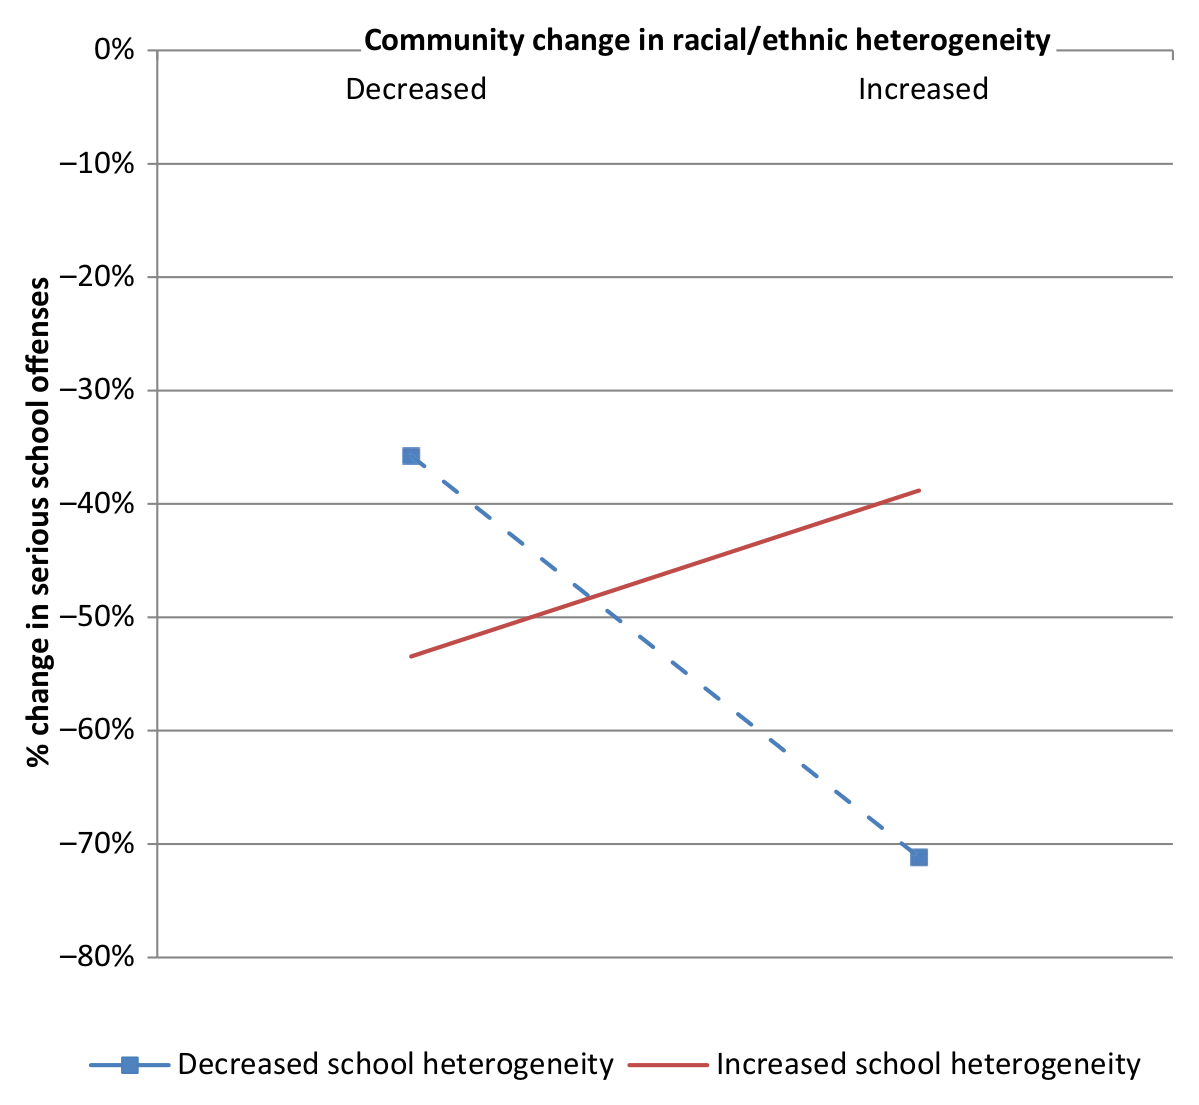
Predicted change in serious school offenses in middle schools based on change in school and community heterogeneity between 2000 and 2006.
Figure 1 shows how the percentage change in middle school serious offenses (y-axis) varies for different combinations of community change in heterogeneity (x-axis) and school change in heterogeneity (lines). To simplify interpretation, school change in heterogeneity has also been divided into decreased heterogeneity (dashed line) and increased school heterogeneity (solid line). From the graph, it is clear that as long as either but not both the school or the community have an increase in heterogeneity, the expected change in serious offending is greater than in schools that have either (a) increased heterogeneity in increasingly heterogeneous communities or (b) decreasing heterogeneity in decreasing heterogeneous communities. This suggests that community and school change do not work in agreement to compound their effect on the outcome, but rather have the most impact when school and the community heterogeneity change move in opposite directions.
In sum, even when controlling for various community- and school-specific changes, increasing heterogeneity has a beneficial effect in middle schools when the community heterogeneity is decreasing. Three other middle school variables that significantly predict school offending when controlling for the interaction between school and community racial/ethnic change are the rate of serious offenses in the 2001-2002 school year (b = 0.030, IRR = 1.031, p < .001), the change in the percentage of credentialed teachers (b = −0.017, IRR = 0.007, p < .05), and change in the community-level median income (b = −0.011, IRR = 0.004, p < .001). All are consistent with theoretical expectation.
Discussion
Social disorganization theory argues that as racial and ethnic heterogeneity increases and residential population turns over, crime will increase because the population diversity and fluctuation prohibit the formation of social bonds that constrain delinquency. Some research within the education literature, however, suggests that heterogeneity may have a protective effect within schools by equalizing the balance of power among students. I find that, by and large, increased heterogeneity in schools is associated with a reduction in serious student offenses. Changes in the racial diversity outside of the school have no direct impact on school-level outcomes, but it moderates the relationship between school racial/ethnic change and offending in middle schools. This is in line with the argument that diversity increases tolerance, but contrary to postulates of social disorganization theory.
Indeed, other social disorganization controls at both the school and community levels were not predictive of change in serious student offending. Within schools, changes in the percentage of credentialed teachers, average class size, and the proportion of low-income students have no meaningful impact on the pattern of student offending over time. Likewise, the sociodemographic characteristics of areas outside the schools have no discernible effect on school crime. Schools located in communities that have higher levels of racial and ethnic change, an increasing percentage of vacant housings, and more female-headed households are not significantly different in terms of rates of serious student offending than schools located in more advantaged areas. Change in the community crime rate surrounding schools is also not predictive of changes in school-level crime (in fact, the change in the two crime rates is not even correlated). 14
It is probable that social disorganization effects that exist in census tracts are not picked up in smaller communities such as schools. That is, the average enrollment in Louisiana schools in 2000 and 2006 is about 2,200 to 2,300 students, whereas the average census tract contains 4,000 plus residents. My operational definitions of social disorganization may not be appropriate for school environments. As did studies before mine (Casteel et al., 2007; Mansfield et al., 1991; Plank et al., 2009), I relied on the proportion of students receiving free or reduced cost meals as an indicator of student-level poverty. The average school, however, had almost 70% (standard deviation of 18) of their students receiving free lunches in 2006; this is much higher than the city as a whole, whose communities (census tracts) average 22.7% in poverty (standard deviation of 14.4). Furthermore, certain social disorganization relationships may not be applicable to the age range of the student population. In schools, enrolled students were generally 10 to 18 years old, but in communities, the population has a much greater age variation. The differences in the expected and actual effects of heterogeneity then could be an artifact of the different age compositions in the different types of communities.
An important finding in my study is that all these relationships are specified by school type, specifically within Los Angeles high schools (in models excluding the school by community interactions). Many prior studies focused on middle schools or the equivalent (Payne et al., 2003; Plank et al., 2009; Reis, Trockel, & Mulhall, 2007; Welsh et al., 1999), combined high schools with middle schools (Limbos & Casteel, 2008), and rarely just high schools. Few studies have specifically compared high schools with middle schools despite evidence that being enrolled in a junior high increases the likelihood of violent victimization. My results indicate that some factor or factors specific to high schools influence the association between changes in racial and ethnic composition and school offending the leads to a reduction in serious student offending as heterogeneity increases. One possibility is the older ages of high school students; older students may be more tolerant of diversity though it is also possible that older students may have increased access to weapons or have a greater amount of time spent away from parental or adult supervision. There are mixed reports on whether younger students (NCES, 2007) or older students (Nofziger, 2009) are more likely to be victimized. Another possibility is older students are official gang members whereas their younger counterparts are still considered “taggers” (graffiti artists) and do not participate in the more serious forms of gang activity that may be driving the association in high schools (personal communication with LAUSD Assistant Dean M. Solorzano on January 16, 2009).
There is evidence of a moderating relationship between school and community effects: The impact of school-level heterogeneity change on school offenses rates is conditional on community-level change and school type. Perplexingly, an association between racial and ethnic change and in school crime only shows up in middle schools in the model controlling for the interaction between school and community changes in racial heterogeneity (Table 6). In this situation, the combined effect is not what one would logically expect. Based on my previous findings, one would expect that schools with increased heterogeneity located in communities also with increased heterogeneity would have the greatest reduction in school offenses. Rather, though the main effect of school change in heterogeneity is negatively associated with school crime (as expected based on previous results), the interaction term is positive and large. This suggests that the beneficial effect of changing heterogeneity is not compounded when controlling for the relationship with community change, but rather only effectively reduces crime in middle schools that are located in communities where the heterogeneity is decreasing. The magnitude of the decrease in student offending in these schools is considerably greater than in any other community–school combinations.
Although the differential findings between high schools and middle schools may be due to the age differences of the students, it may also be impacted by school factors such as the retention or drop-out rates or the effectiveness of teachers. First, the association between increased heterogeneity and lower offense rates in high schools could be due to large numbers of students not finishing (the drop-out rate is 25%-33.6% depending on the measure), a factor that would influence high schools but not middle schools. Students who are nonnative English speakers are more likely to abandon their education, which would impact the diversity of the student body (Landsberg & Blume, 2008). It is also more likely that dropouts are delinquent students, whose absence would contribute to a lower rate of offending (see Sweeten, Bushway, & Paternoster, 2009).
Second, the differential findings may be affected by teacher characteristics. This study included a measure of credentialed teachers—shown to significantly reduce offending in middle but not high schools. Over the study period the percentage of credentialed teachers increased in middle schools but, on average, decreased in high schools. This could explain the disparate finding and reiterates the importance of having more experienced educators who likely have greater classroom management skills. This does not, however, explain the relationship between increased classroom size and decreased rates of student offending in high schools (Table 4). This could indicate that although middle schools tend to have increasing credentialed teachers, high schools may have better quality teachers such that even with fewer credentialed instructors, their skill set allows for better control of the classroom regardless of size. This relationship could also be conditional upon the age of the students; it is likely that high school students may be better behaved in the classroom more generally than younger students who may be more easily distracted. Future studies should delve more deeply into the relationship between teacher quality and student offense rates and account for the potential impact of high drop-out rates.
This study is not without limitations, however. The first is that the sample size is small, especially when the study is separated by school type. Small samples used in analysis with numerous predictor and control variables can run into a power issue where the model consumes too many degrees of freedom to accurately detect statistically significant relationships. But prior negative binomial analyses have been published using a small samples and statistically significant relationships still show up in my high school models (with the smallest n: 38 schools). In addition, models run net of any school or community controls (to increase statistical power) still showed the same patterns of significance and null findings (results not shown). Second, to determine change in community attributes between 2000 and 2005, I relied on population projections and estimates of 2005 block group demographics purchased from a private company (GeoLytics, Inc.). The methodology for computing these estimates is proprietary and therefore unknown. This introduces some possibility of error. However, I found that GeoLytics total (tract level) population estimates and Los Angeles Planning Department (tract level) estimates (used in alternative analyses (not shown) are highly correlated. A third limitation is the data used in the study, including the underreporting of LASPD crimes, missing school crime data, and inability to examine more minor offenses such as drugs or vandalism in schools. There may also be missing or unreported data in the community crime information from the LAPD, but I reduce some potential for error focusing on violent crime specifically, which is more likely to be reported to the police than property offenses.
Many future projects can originate from this study. Modifications to the existing research include the use of a community disadvantage factor or school climate index that will simultaneously reduce the drain on statistical power and degrees of freedom usage while increasing the number of explanatory variables I can incorporate into the project. Alternatively, I can rerun the analysis using the 3-year smoothed averages for the offense rates, specify school year crimes versus calendar year offenses (though there was little difference between the two in some preliminary exploration), or adjust enrollment counts for attendance rates. To investigate how schools and communities are changing compositionally, I can use changes in specific races instead of heterogeneity. Finally, it is important for future studies to continue to assess the role of individual students in school-level crime; for example, Welsh et al. (1999) found that when individual-level variables are included in their models, school and local and imported community factors exerted very little influence on school disorder. The crime data included in this study are unique and invaluable and will hopefully be able to be utilized for numerous investigations on school crime in the future.
Footnotes
Acknowledgements
The author would like to thank George E. Tita, John R. Hipp, Robert Greenbaum, Mike Gottfredson, and Victoria Basolo for guidance on earlier drafts of this manuscript and two anonymous reviewers for helpful comments and suggestions.
Declaration of Conflicting Interests
The author(s) declared no potential conflicts of interest with respect to the research, authorship, and/or publication of this article.
Funding
The author(s) received no financial support for the research, authorship, and/or publication of this article.