
Abstract
We advance discussion of structural inequality by operationalizing “concentrated” disadvantage in terms of highly disadvantaged communities located at the spatial core of contiguous areas of high disadvantage, and by testing the extent to which such location achieves an independent effect on violence. Using exploratory spatial data analysis and count modeling, we show that highly disadvantaged communities located at the center of a contiguous ghetto have significantly higher rates of violence than other highly disadvantaged communities, but that this relationship is moderated by structural disadvantage. In addition to finding a significant interaction between these “deserts” of disadvantage and structural disadvantage, as they relate to violent crime, we also observe that in desert communities, disadvantage has a diminishing effect on violence.
Introduction
Multiple studies have noted the deleterious effects of community structural disadvantage on violence (Anderson, 1999; Friedson & Sharkey, 2015; Jennings et al., 2014; Peterson & Krivo, 2010; Sampson & Morenoff, 2004; Saporu, Patton, Krivo, & Peterson, 2011). From a regulatory standpoint, disadvantaged neighborhoods find it difficult to establish levels of informal social control necessary for preventing and responding to violence, or may not be equipped to enlist support from municipal institutions of formal social control (Slocum, Rengifo, Choi, & Herrmann, 2013). In turn, the strain of living in the disadvantaged context contributes to the adoption of hypermasculine presentations of self that emphasize violence (Majors & Billson, 1993; Martin et al., 2011), even if such an approach is ineffectual at preventing subsequent victimization (Stewart, Schreck, & Brunson, 2008; Stewart & Simons, 2006). Moreover, select underground economies in disadvantaged neighborhoods create conditions favorable for violence, as participants either lack access to criminal justice system resources to settle disputes (Black, 1976; Jacques, 2010) or regard those resources—particularly, the police—as illegitimate (Kane, 2005; Kubrin & Weitzer, 2003).
Equally important, however, is that a neighborhood’s level of violent crime is also influenced by levels of structural disadvantage in nearby neighborhoods (Mears & Bhati, 2006; Morenoff, Sampson, & Raudenbush, 2001; Sampson, 2012). Indeed, the inner-city ghetto isolates multiple adjacent socioeconomically disenfranchised neighborhoods in large swaths of geographic space, such that they are generally unable to benefit from positive spillover conditions of nearby communities (Anderson, 1999; Peterson & Krivo, 2005, 2010). In other words, highly disadvantaged communities of color pay a double penalty, as they must contend with the violence-inducing structural conditions of their own communities and their surrounding communities (Peterson & Krivo, 2010).
We argue that not all communities within the contiguous ghetto are created equal. Those located at the periphery are likely less isolated and can more easily tap into nearby structural influences and services that contribute to viable and safe living environments. Those at the core of the contiguous ghetto are likely comparatively isolated from such influences. With the relationship between disadvantage and violence in mind, our study analyzes demographic and crime incident data from Washington, D.C., to demonstrate that communities located at the core of highly disadvantaged subregions—hereby referred to as deserts of disadvantage—experience violent crime counts significantly different from those not clustered on extreme disadvantage. Furthermore, we show that within such highly disadvantaged subregions, increases in disadvantage are associated with significantly decreased levels of violence.
Literature Review
Social Disorganization, Structural Disadvantage, and Violence
William Julius Wilson’s (1987) conceptualization of concentration effects provided the preamble for modern sociological studies of neighborhood structural disadvantage and violence. In The Truly Disadvantaged: The Inner City, the Underclass, and Public Policy, Wilson (1987) argued that inner-city communities have been subjected to macrostructural shifts that have facilitated the out-migration of working and middle-class residents, and the sociospatial isolation of the poorest African Americans. In turn, this pattern of segregation renders it difficult for residents to have contact with resource networks of mainstream society that may provide opportunities for upward mobility through employment access. Furthermore, many of these communities have managed to endure high rates of disadvantage through multiple generations. As such, residents not only have great difficulty tapping into resource networks, young people tend to acquire life skills from peers and guardians who are equally disenfranchised (Sharkey, 2013; Wilson, 1987). Consequentially, sustained and intergenerational structural disadvantage may solidify subcultural adaptations that are conducive to acts of violence.
Although Wilson’s (1987) explanation of concentration effects focuses on extreme levels of urban, local neighborhood structural disadvantage, subsequent work has considered how disadvantage levels in adjacent communities facilitate conditions conducive to violent crime. For example, Mears and Bhati’s (2006) analysis of Chicago neighborhoods found that local levels of homicide in general tend to be associated with nearby levels of resource deprivation. A more comprehensive study including 9,000 neighborhoods within 91 cities finds that surrounding levels of concentrated disadvantage yield violent consequences for neighborhoods, and that non-White communities share a disproportionate share of the disadvantage burden (Peterson & Krivo, 2008-2009, 2010). Not only do about 50% of predominantly African American and Hispanic neighborhoods have at least four forms of extreme disadvantage compared with 1% of White neighborhoods, communities of color are more likely to be adjacent to highly disadvantaged places (Peterson & Krivo, 2010). Other research has considered the role of spatially lagged explanatory items, such as poverty, on community violent crime. As expected, neighborhoods adjacent to relatively impoverished places are likely to have a high amount of violent crime, and poverty adjacency demonstrates significant linear and cubic effects on focal community violence (Hipp & Yates, 2011).
Deserts of Disadvantage and Violence
A reasonably sized cohort of research has considered, albeit in myriad methodological ways, whether the spatial arrangement of highly disadvantaged neighborhoods is associated with processes which lead to unexpected increases in violence. Initial theorizing on this phenomenon suggested that neighborhood location within broader regions of high disadvantage may serve to influence the effect of social and economic isolation on violence (Jargowsky & Bane, 1991). This likely occurs as the structural conditions of neighboring spaces are so dire that they are unable to provide spillover effects that would contribute to focal neighborhood viability. In this sense, such communities pay a double penalty: Not only are they bereft of favorable structural conditions that suppress violence, they are surrounded by other communities that are similarly bereft.
For example, Stretesky, Schuck, and Hogan (2004) considered the association between city-level clustered poverty and violence using Uniform Crime Report data from 236 cities. Poverty clustering was measured by the proportion of tracts with poverty rates of at least 40% adjacent to similarly situated tracts, to all tracts with poverty rates of at least 40%. Findings on the direct relationship between poverty clustering and violence were inconsistent. Interaction measures, however, indicated that the effect of disadvantage on homicide was more pronounced in cities where poverty was highly clustered.
Similarly, Morenoff et al.’s (2001) piece examining the processes by which volunteer and social organizations, collective efficacy, and concentrated disadvantage relate to violence also sheds some light on our research question. Using data from the Project on Human Development in Chicago Neighborhoods, they found a direct effect of focal community disadvantage on violent crime. And, through the modeling of spatial lag effects, they also found that 1 standard deviation increases in disadvantage in first-order neighborhoods (those directly adjacent to focal communities) were associated with a 9% increase in violence in focal neighborhoods. And, 1 standard deviation increases in disadvantage in second-order neighborhoods were associated with a 2% increase in violence in focal neighborhoods. Collectively, these studies lend support to the idea that there is a detrimental effect of clustered urban disadvantage on violent crime outcomes.
On the contrary, an expanding group of studies have challenged the notion that increasing levels of structural disadvantage consistently translate into increased local violence. Instead, this research generally finds that although extreme levels of disadvantage are associated with elevated levels of violence, the effect of disadvantage eventually stabilizes rather than increasing exponentially (Hannon & DeFina, 2005; Hipp & Yates, 2011; Krivo & Peterson, 1996; Light & Harris, 2012). The exact theoretical process by which this occurs remains unclear, though some evidence suggests that once a community reaches some threshold of sustained disadvantage, it become subjected to cultural attenuation, rendering any increases in disadvantage unimportant to explaining patterns of violence (see Anderson, 1999; Horowitz, 1983; Kane, 2005; Warner, 2003).
Relatedly, population changes due to racialized residential flight patterns from violent neighborhoods can also lead to changes in violent crime (Morenoff & Sampson, 1997). Neighborhoods in the core of Chicago contiguous ghettos characterized by high rates of initial violence experienced losses in Black population over time. Neighborhoods at the periphery, however, where violence levels were increasing, experienced increases in Black population over time. As such, although upwardly mobile Blacks may be able to leave the most disadvantaged communities, prevailing and historic systems of housing discrimination and structural inequality constrain their housing options compared with their White counterparts.
Most recently, Chamberlain and Hipp (2015) explored tract-level, cross-level interactions in modeling the effects of structural disadvantage on violence across a sample of almost 8,000 neighborhoods in 79 cities. Principally, their models indicated that disadvantage and lagged disadvantage consistently and independently predict higher violent crime rates, lending support to social disorganization theory. Yet counterintuitively, in highly disadvantaged tracts, the effect of spatially lagged disadvantage on violence is negative. Although this finding does not fit neatly within a social disorganization framework, it does make sense in light of extant research. As noted above, extant scholars have demonstrated that compounding levels of local disadvantage are associated with increases in violence up to a certain threshold, after which a leveling-off effect occurs (Hipp & Yates, 2011; Light & Harris, 2012). The interaction of local disadvantage with nearby disadvantage, then, is possibly negative because once local disadvantage surpasses the threshold of expected increase, the compounding effect of nearby structural conditions cannot substantively facilitate a direr social context. “In this scenario, social controls that guard against violent crime have already eroded to a minimal or nonexistent point such that they can no longer be reduced by further increases in disadvantage” (Hipp & Yates, 2011, p. 962).
We argue that although structural disadvantage contributes to neighborhood violence through localized macro-level processes described thus far, the location of a disadvantaged neighborhood—vis-à-vis residing at the center of a highly disadvantaged cluster—conditions the effect of focal disadvantage on violent crime. Thus, although local structural disadvantage is associated with higher counts of violent crime, the effect of local disadvantage on violence will demonstrate a negative trend when the focal community is spatially encompassed in broader within-city regions of elevated structural disadvantage. This is related to, yet distinct from, a trend in neighborhood-level research, which accounts for spatial lag effects. Such contemporary work illustrates that a one-unit increase in the average level of disadvantage of neighboring units contributes to an expected increase in focal neighborhood violence. Although this is novel, it does not account for how the spatial clustering of highly disadvantaged neighborhoods may influence local violence. Nor, does it account for the likelihood that communities on the periphery of the contiguous ghetto are relatively more spatially proximate to neighborhoods providing structural spillover effects that suppress violence.
Method
Data and Measures
We derived crime data from the District of Columbia Open Data Catalog, as supplied by the Metropolitan Police Department (MPD) of Washington, D.C., as well as socioeconomic data from the 2010 American Community Survey (using the 5-year estimates) to construct a data set at the block group level of aggregation (n = 450 block groups).
Dependent variable
We constructed a summed index of violent crime that included block group counts of homicide, robbery, and assault with a deadly weapon for the years 2012-2014. 1 To account for random fluctuations common to crime data, we then averaged the measure across all 3 years (Friedson & Sharkey, 2015; Ulmer, Harris, & Steffensmeier, 2012). Figure 1 displays a quantile choropleth map of the spatial distribution of violent crime rates across block groups of the District of Columbia. The cross-hatched portion of the map identifies the National Mall, and nearby areas that are excluded from analysis due to low population (<50 residents).
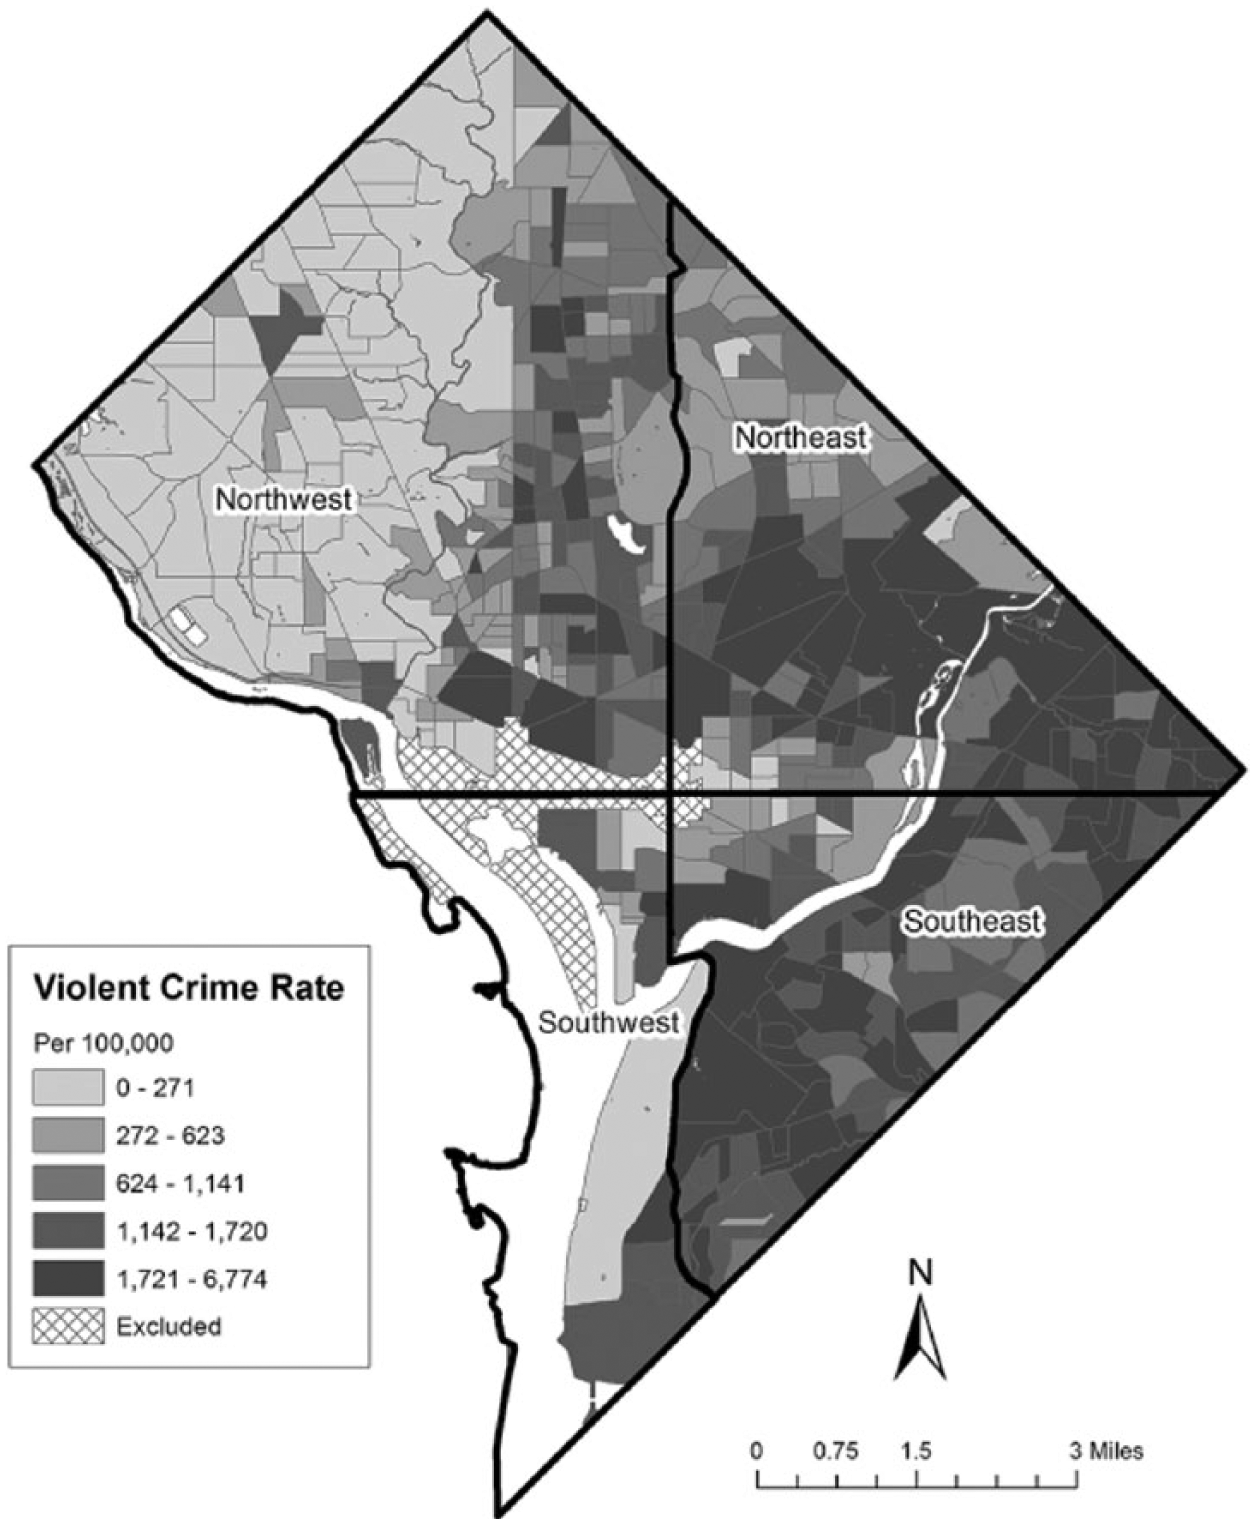
D.C. average violent crime rate, 2012-2014.
As the data in Figure 1 show, violent crime is not normally distributed across D.C. Generally, Rock Creek Park, which runs north–south mostly along 16th Street from the National Mall to D.C.’s boundary with Maryland, represents an ecological barrier that physically separates the wealthy (and mostly White) Northwest Quadrant from the Northeast. It also represents the major line of division for violent crime in the city. Indeed, as Figure 1 demonstrates, most of the violent crime in the District of Columbia occurred in block groups located in the Northeast and Southeast quadrants of the city. In addition, a higher than average amount of violent crime occurred in the center of D.C. On average, block groups in the Southeast quadrant experienced the highest violent crime counts.
Primary independent variables
To remain consistent with prior ecology of crime research (Kane, 2011; Kane, Gustafson, & Bruell, 2013; Parker, Stults, & Rice, 2005; Sampson & Groves, 1989; Sampson, Morenoff, & Gannon-Rowley, 2002; Taylor, 1997), we constructed an unweighted additive index of structural disadvantage for each block group using the z scored form of the following variables: percentage of the residential population and/or households that were African American, unemployed, in poverty, female headed with children, receiving public assistance income, and aged 25+ without a high school diploma. We also included in the index a measure of median household income, multiplied by negative 1. 2 Principal components analysis with varimax rotation confirmed that all indicators measured a single underlying construct (all values ≥.723). Given the high correlations of all items in the construct, it was impossible to distinguish percentage of African American residential population from the other indicators of structural disadvantage. Therefore, the composite index may be regarded as a measure of racially concentrated structural disadvantage (Cronbach’s α = .888).
Constructing deserts of disadvantage
To construct a measure of spatially concentrated structural disadvantage grounded in concentration and isolation, we submitted the structural disadvantage index to a form of exploratory spatial data analysis (ESDA) known as the Local Indicators of Spatial Association (LISA)—that is, the local Moran’s I. As a correlation statistic, the Moran’s I works by comparing each block group’s I value on structural disadvantage to the group average of its queen contiguity neighbors (Anselin, 1995). Results classify each block group according to one of the four conditions: features with high levels of structural disadvantage surrounded by similarly situated features (high–high: n = 83), those with low levels of structural disadvantage surrounded by similarly situated features (low–low: n = 94), those that score high on structural disadvantage but are surrounded by those with low values (high–low: n = 0), and places with low levels of disadvantage adjacent to highly disadvantaged places (low–high: n = 1). Alternatively, block groups can fail to be associated with any of the above cluster types and thus be classified as nonsignificant (n = 272). Figure 2 displays a choropleth map showing significant clusters of structural disadvantage based on the above taxonomy.
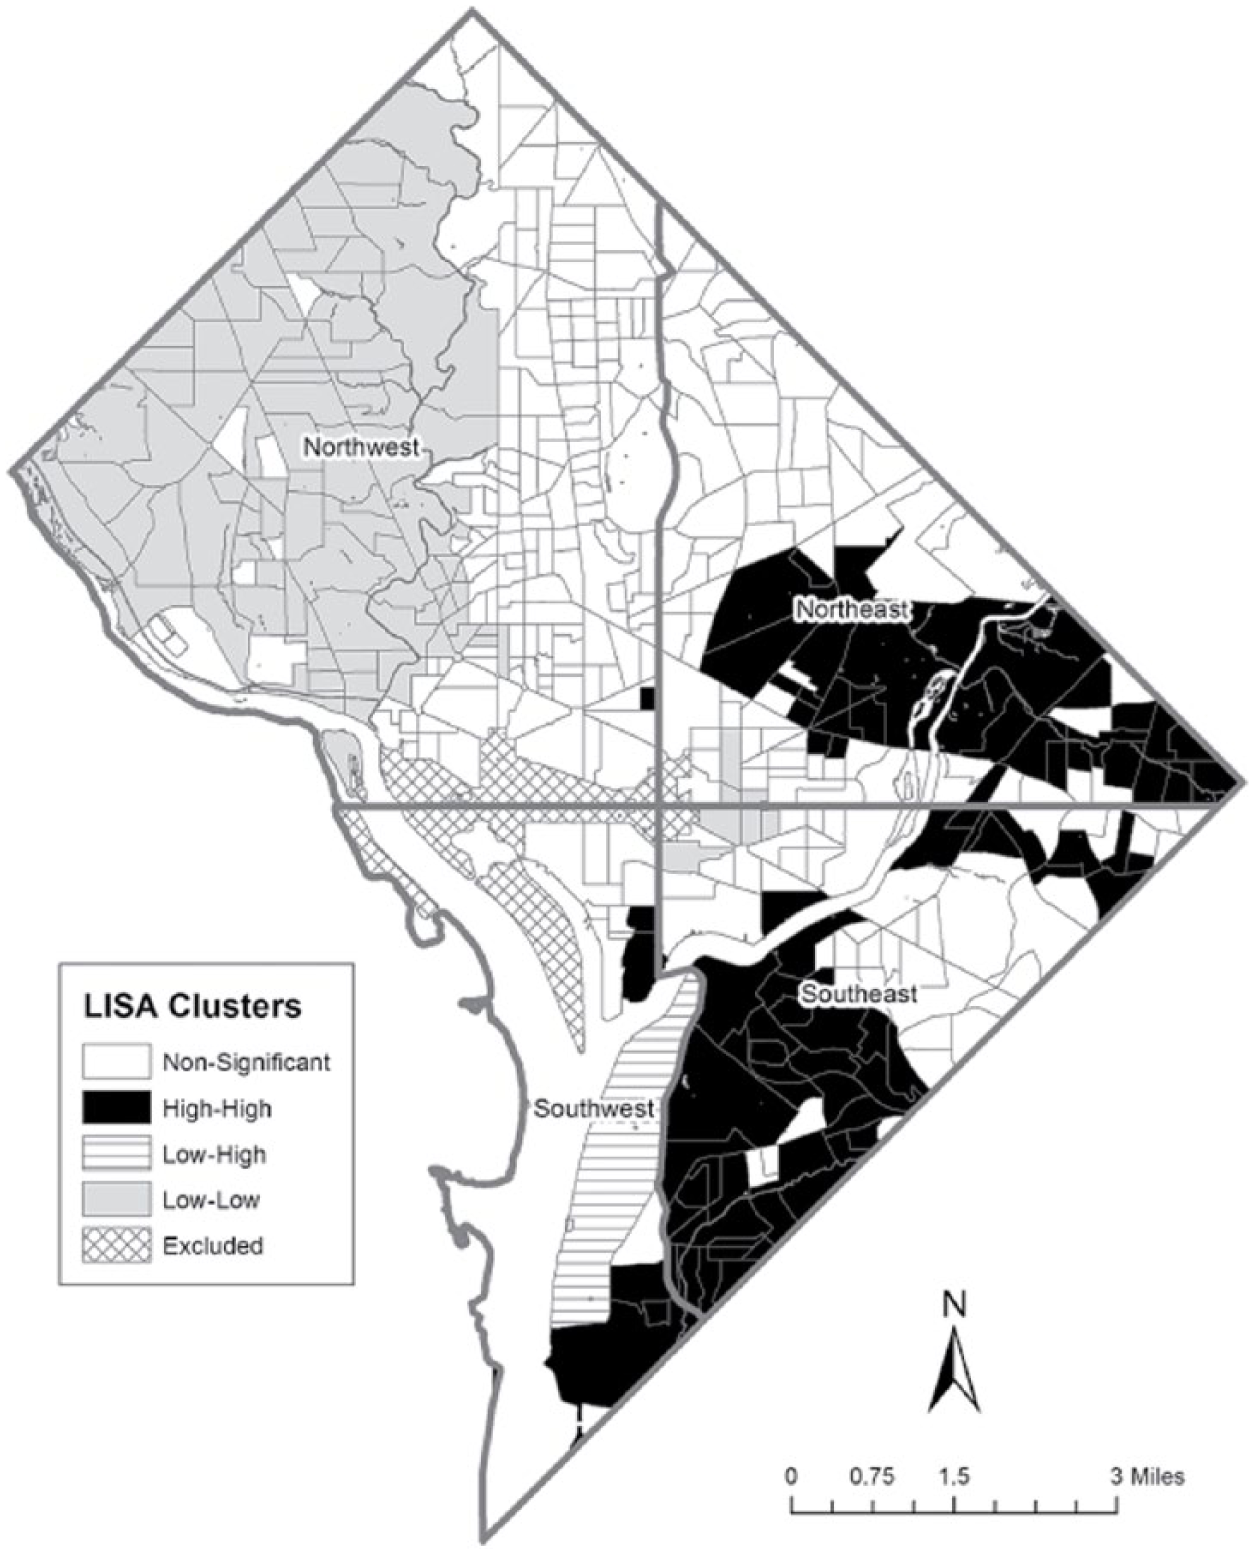
LISA clusters of structural disadvantage.
All clustering classifications are subject to pseudo-significance testing through the use of random permutations of the data. Due to the theoretical interests of this research, we see block groups with high I values surrounded by others with high values (high–high) as deserts of disadvantage. 3 Deserts of disadvantage are block groups that are not only characterized by above average levels of structural disadvantage but are isolated from resource networks by virtue of being spatially surrounded by other block groups that score above average on disadvantage. As the data in Figure 2 show, the clustering of high–high block groups was exclusive to the Northeast and Southeast areas of the city. Eighteen percent of all D.C. block groups resided in a desert of disadvantage. For statistical modeling purposes, a dummy variable was created whereby a coding of 1 identifies deserts and 0 equals all else. We also model the effect of low–low block groups by way of a dummy variable so that the reference category primarily includes block groups that are not significantly clustered on high or low structural disadvantage.
Control variables
In addition to the primary independent variables noted above, we also included a set of controls that may theoretically account for variations in violent crime. These included % Latino population (Martínez, 2002), % vacant housing units, and % renters as indicators of “risky” land use and residential attachment.
Furthermore, we conducted a global Moran’s I analysis of the dependent variable to determine the extent to which violence is spatially clustered across Washington, D.C. Because our results indicated significant spatial autocorrelation (I = 0.072, p < .001), we included a lagged measure of violent crime across all models (Anselin, Cohen, Cook, Gorr, & Tita, 2000; Kane, 2005; Kubrin & Weitzer, 2003; Messner et al., 1999; Morenoff & Sampson, 1997; Taylor & Covington, 1988). This standardized predictor, denoted as Wy, represents the average violent crime rate for each feature’s adjacent block groups. Table 1 presents the summary statistics for variables included in the analyses.
Descriptive Statistics.
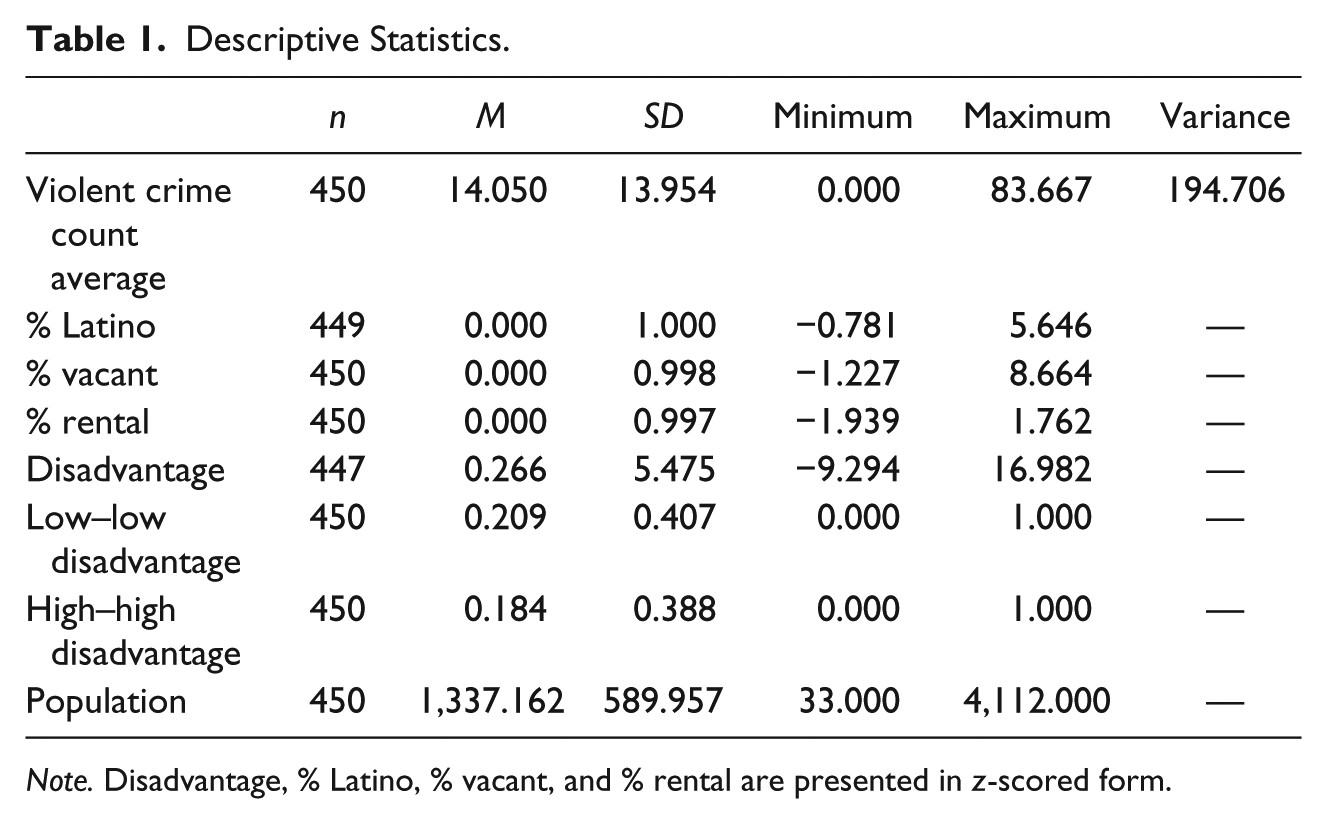
Note. Disadvantage, % Latino, % vacant, and % rental are presented in z-scored form.
Analytic Technique
Because the dependent variable is a nonnegative average of annual violent incident counts in each block group, we estimated a series of count models using Stata. Although we recognize that averages and counts are related but distinct mathematical concepts, we counter that our data resemble an overdispersed Poisson distribution, nonetheless. Moreover, scholars have recognized the appropriateness of count models for noncount data of a Poisson distribution (Cameron & Trivedi, 1998; Johnson, Taylor, & Ratcliffe, 2013). Although it is possible to log-transform the violent crime rate into a normal distribution that is amenable to an ordinary least squares (OLS) model, Osgood (2000) has demonstrated significant problems with this approach. These include the shifting of outliers and the likelihood of zero crime rates in areas with small populations.
The Poisson model assumes that the conditional mean is equal to the conditional variance, a condition called equidispersion (Long, 1997). Overdispersed distributions, which are more frequent in social science data, can be accommodated by using a negative binomial model that includes an error term to account for additional variance. Considering that the outcome measure is characterized by overdispersion (M = 14.05, variance = 194.706), we use a series of negative binomial models to estimate effects.
Our measure is further complicated by the fact that 14 block groups experienced, on average, zero recorded violent crime incidents. This poses a unique issue as an abundance of zero values can undermine the reliability of model estimates. In response, we opted for zero-inflated models which use a two-stage process (Lambert, 1992; Long & Freese, 2006; McCord & Ratcliffe, 2007). The model first determines the likelihood that a block group will not experience any violent crime incidents. It then provides estimates for variables in block groups that have experienced recorded violent crime incidents over the study period. We verified the suitability of the zero-inflated adaptation over the traditional negative binomial model using the Vuong (1989) test of model fit. Across all three inferential models, test statistics indicated that the zero-inflated model is preferable (z = 3.85-3.90, p < .001).
Results
Table 2 summarizes the results of hypothesis testing across three models. 4 Model 1 shows the results of regressing violent crime on structural disadvantage to identify a baseline relationship between those two primary factors, net of all controls. Model 2 adds the high–high disadvantage dummy variable to estimate the potential influence of spatially concentrated disadvantage (i.e., deserts of disadvantage) while still controlling for structural disadvantage and all other factors. Model 2 also includes a low–low disadvantage dummy variable, which indicates block groups characterized by low disadvantage and surrounded by other low disadvantage block groups. Including this low–low control allows the model to purely contrast the potential effects of high–high disadvantage from other forms of significant spatial clustering of structural disadvantage. Model 3 retains all previous variables and adds an interaction term for Structural Disadvantage × High–High Disadvantage to examine how block groups residing in a desert of disadvantage may have conditioned the effects of structural disadvantage on violent crime. Zero-inflated negative binomial models were estimated using block group population as the exposure parameter. Note that the models excluded the block group containing the National Mall, as well as two others because their residential populations were close to zero, reducing the total number of analytical units to 447 block groups.
Zero-Inflated Negative Binomial Regression Models Predicting Violence.
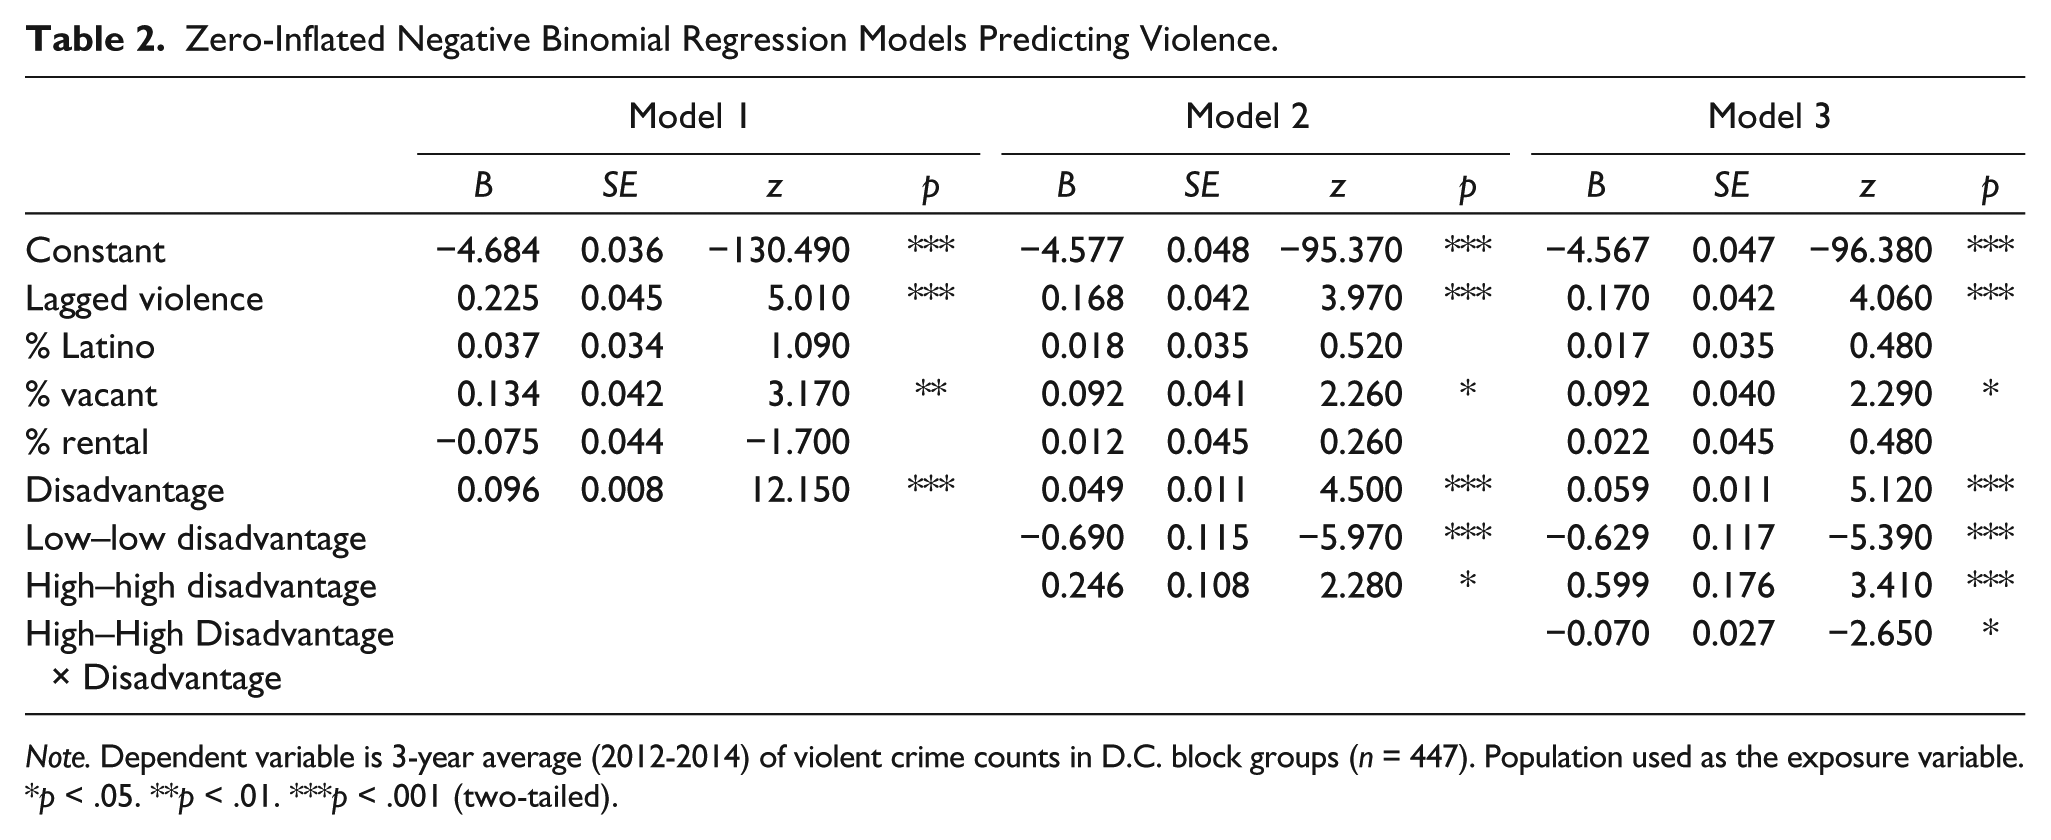
Note. Dependent variable is 3-year average (2012-2014) of violent crime counts in D.C. block groups (n = 447). Population used as the exposure variable.
p < .05. **p < .01. ***p < .001 (two-tailed).
Referring to Model 1 in Table 2, the results show that violence across D.C. block groups is significantly spatially autocorrelated. For every 1 standard deviation increase in violence in surrounding block groups, violence is expected to increase in focal block groups by .225 (z = 5.01, p < .001). In line with prior research (Pratt & Cullen, 2005), structural disadvantage exerted a significant and moderate impact on violence. For every 1 standard deviation increase in disadvantage, violent crime counts increased on average by .096 (z = 12.15, p < .001). In addition, % vacant housing units was also significant and strongly predictive of violent crime counts. For every 1 standard deviation increase in vacant housing units, violent crime counts increased by .134 (z = 3.17, p < .01). Findings for vacant housing units supported J. Cohen, Gorr, and Singh’s (2003) and Kane and Cronin’s (2013) previous findings, indicating the criminogenic effect of “risky” land uses on violent crime. Contrary to expectations, % renters per block group and % Latino residents were not associated with violence. Overall, the results from Model 1 support a range of studies on the ecology of crime, demonstrating that structural disadvantage and risky land use maintain a significant and confident relationship with violence.
In Model 2, which retained all previous variables and added high–high and low–low structural disadvantage, the overall results did not vary much from those of Model 1: Structural disadvantage and % vacant housing units maintained their significant and positive relationships with violent crime. Latino population and the proportion of rental units remained nonsignificant covariates of violent crime. Importantly, the high–high structural disadvantage variable—that is, the measure of deserts of disadvantage—exerted a significant and independent effect on violent crime, controlling for other model correlates. More specifically and in support of our arguments, highly disadvantaged block groups that are surrounded by similarly situated block groups experience crime counts that are significantly higher than those which are not clustered on disadvantage (B = 0.246, z = 2.28, p < .01). In addition, the low–low disadvantage variable exerted a significant and strong negative effect on violent crime, suggesting the considerable protective impact of spatially contiguous areas of economic stability (B = −0.690, z = −5.97, p < .001).
Finally, we turn to Model 3, which examines the issue of greatest salience to this study: the extent to which the relationship between high–high disadvantage and violent crime may be conditioned by structural disadvantage. The results of Model 3 show that all three structural disadvantage variables (i.e., the interaction term and the two component terms) were significant predictors of violent crime. Indeed, as the coefficients show, high–high (i.e., desert) communities experience much higher rates of violence (B = 0.599, z = 3.41) than do nondesert communities, demonstrating the violence-related impact of residing at the core of a spatially contiguous ghetto. The negative (and significant) interaction term (B = −0.070, z = −2.65) shows that in high–high block groups, structural disadvantage had a decelerating effect on violence, indicating that once structural disadvantage reached a certain threshold, its effect on violent crime leveled off (see Brambor, Clark, & Golder, 2006, for the interpretation of negative interaction terms). This finding is at least partially consistent with Hipp and Yates (2011), who similarly found a “diminishing positive effect” of structural disadvantage on violence across the 25 cities they studied.
Overall, the results from the three models show a complex relationship between structural disadvantage and violent crime. In a general way, structural disadvantage—which represents systemic resource deprivation along several social and economic dimensions—exerts a predictable and consistent positive effect on violent crime, and when block groups exist as part of a highly disadvantaged cluster, location at the core of that cluster produces a strong and independent effect on violence.
Supplementary Analyses
Earlier research has demonstrated the importance of modeling violent crime outcomes for communities of various racial and ethnic groups separately (Peterson & Krivo, 2010). Although we recognize that structural disadvantage is differentially concentrated across communities of different races and ethnicities (McNulty, 2001; Peterson & Krivo, 2010; Sampson, 2009; Sampson & Wilson, 1994), our relatively low n renders the use of parallel models difficult and leads to statistical power concerns. We attempted to adjust for this concern by excluding percent Black from the disadvantage index, and including it as a separate predictor in all models. Considering the inextricable link between race and disadvantage, this led to unreliable model predictions that were counter to existing theory and long-standing empirical scholarship. In particular, structural disadvantage demonstrated non-significant effects in Models 2 and 3, high–high structural disadvantage held a significant and positive effect in Model 3, and our interaction measure was non-significant.
We also attempted to include an interaction of low–low disadvantage and structural disadvantage in Model 3. The purpose of this approach was to determine the effect of increasing levels of disadvantage in areas that not only are substantially less disadvantaged but surrounded by similarly disadvantaged communities. Results indicated a slight positive but statistically nonsignificant effect (B = 0.03, z = 0.76). As such, it may be that even when such communities experience increases in disadvantage, positive spillover effects from nearby socioeconomically resource-rich communities reinforce the stability of violent crime through processes of informal and formal social control.
Discussion
In the present study, we intended to explore Wilson’s (1987, 1996) seminal and others’ expanding (Jargowsky, 1997; Massey & Denton, 1993; Sugrue, 2005) arguments about the concentration effects of structural disadvantage on violent crime. We operationalized “concentrated” structural disadvantage so that it referred not just to localized economic resource deprivation but neighborhoods that experience high levels of structural disadvantage and are spatially encompassed by other highly disadvantaged communities. These communities were termed “deserts of disadvantage.” We specifically argued that although localized socioeconomic disenfranchisement may exert an effect on local violent crime through processes of social disorganization and/or cultural attenuation, the desert of disadvantage condition exerts an added effect on violence. Overall, our findings generally supported the research hypotheses that the spatial adjacency of high disadvantage across D.C. block groups was significantly related to violent crime, though the relationship between deserts of disadvantage and violence was conditioned by structural disadvantage.
As Wilson (1987, 1996) suggested, concentrated disadvantage is problematic because of the lack of local social and economic resources, which limits the life chances of community residents and ultimately encourages the development of the drug trade and cultural attenuation (see also Carr, Napolitano, & Keating, 2007; Horowitz, 1983; Johnson, 2016; Kane, 2005; Warner, 2003). More recently, Kane (2011) noted that in communities that exist as part of large spatial clusters of disadvantage, residents and visitors alike have to travel farther to find nutritional food, adequate health care, private amenities, public green space, and access to jobs—all of which are factors related to health and crime outcomes. Amos Hawley (1944, 1950) famously noted that urban neighborhoods were not so much in competition with one another for resources as they were interdependent upon one another for their sustenance and viability. Adjacent communities, he argued, relied on each other to make up for local economic differences as residents crossed neighborhood boundaries for reasons of work, school, and commerce. Thus, deserts of disadvantage communities likely experience more social and economic isolation than disadvantaged communities residing next to economically stable communities, which means they are unable to borrow from, or otherwise tap into, each other’s social or economic systems as their infrastructures would not support it.
Desert conditions seem to amplify the effects of structural disadvantage on violence, leaving neighborhoods less sensitive of incremental increases in disadvantage compared with those that exist on the edge of more stable communities. Our Desert × Disadvantage interaction term shows that, in desert communities, added disadvantage is associated with predicted decreased rather than increased levels of violence—a finding that can be situated within broader research on threshold effects and the invariance thesis (Griffiths, 2013; Hipp & Yates, 2011; Light & Harris, 2012; Taylor, 2015). Our findings here support the assertion that extreme levels of disadvantage may work to dismantle all options of local social control (Hipp & Yates, 2011). If so, once that threshold is reached, additional levels of disadvantage may yield no additional consequences for community violence. And yet, high levels of violence can contribute to increased fear and residential flight from desert communities. This was aptly demonstrated in Morenoff and Sampson’s (1997) study illustrating decreases in population from the core of violent Chicago ghettos, but latter increases in population and violence in surrounding neighborhoods.
Taken together, our findings highlight the pervasive nature of structural inequality and its violent and potentially deadly consequences. Although Wilson’s (1987) seminal work The Truly Disadvantaged: The Inner City, the Underclass, and Public Policy was published almost 30 years prior, our efforts reveal that his call for sweeping macroeconomic policy changes has yet to be fully appreciated. In the absence of proposed changes, the stability of extremely disadvantaged and isolated communities will continue to facilitate the transmission of poverty through successive family generations (Sharkey, 2008). In this sense, disadvantaged (and desert) communities are crucial mechanisms by which stratification and structural inequality are experienced and maintained—determining exposure to (or exclusion from) myriad positive life opportunities (Anderson, 1999; Massey, 2007; Massey & Denton, 1993).
The present research was limited in a few ways. First, as with many studies of the ecology of crime, the use of administratively defined spatial aggregates as proxies for neighborhoods can be problematic, because such aggregates may not accurately represent residents’ cognitive maps of their local communities (Coulton, Korbin, Chan, & Su, 2001). Our study hoped to compensate for this limitation by controlling for spatial autocorrelation, a relatively common approach in community-level research to estimate the potential effects of aggregation bias.
We should also note that our design did not include measures of certain constructs, such as collective efficacy, that are often of interest to ecology of crime scholars. Without survey data, for example, we are forced to rely on presumed theoretical processes (that we cannot directly measure) that we believe explain the relationships between deserts of disadvantage and violent crime; but, we cannot draw strong conclusions about causal mechanisms because the processes that underlie our findings are inferred. Future ethnographic research might attempt to identify substantive distinctions between neighborhoods characterized as deserts of disadvantage and those that are disadvantaged but reside near more economically stable areas.
Conclusion
The present study contributes to discussions of structural inequality by using an alternative measure of the concept of concentrated disadvantage, and by demonstrating that where a disadvantaged community resides within a contiguous ghetto exerts an independent effect on violent crime. It seems evident that when Wilson (1987) identified the concentration effects of poverty and social isolation, he referred specifically to local communities without explicit regard to adjacency. Thus, concentrated disadvantage in the lexicon of Wilson meant that high levels of disadvantage in a particular community affected social outcomes in that same community. Later research, of course, has elaborated how the structural conditions in one community affect crime (or other outcomes) in an adjacent community. Still, this approach to examining spatial ordering has stopped short of redefining concentrated disadvantage in terms of a highly disadvantaged community residing at the core of a larger swath of structural disadvantage. The present study, therefore, adds a piece to the complex puzzle of the spatial distribution of disadvantage and violent crime by demonstrating that structural disadvantage may achieve a different effect on violent crime depending upon where it resides as part of a larger area of high disadvantage. Future research might continue to flesh out this relationship by more carefully examining how the physical distance to community resources affects violence for people who reside at the core of a contiguous ghetto.
Footnotes
Acknowledgements
The authors would like to thank Evelyn J. Patterson, Michael L. Walker, and Sahar Sadeghi for providing helpful comments on earlier drafts of this article.
Declaration of Conflicting Interests
The author(s) declared no potential conflicts of interest with respect to the research, authorship, and/or publication of this article.
Funding
The author(s) received no financial support for the research, authorship, and/or publication of this article.