
Abstract
Does capital punishment exert any deterrent effect on homicide, above and beyond the effects of noncapital punishment? We hypothesized that potential deterrent effects should be strongest within a few days of executions because that was when news coverage peaked. We examined data on newspaper and national television news coverage, and found that it was largely confined to the period within a few days of executions. We analyzed state homicide counts for individual days from 1979 through 1998 (n = 372,555 state-days), following the methods of Grogger and controlling for size of the prison population. We found no significant homicide drops corresponding to temporal patterns of news coverage, with one exception: a small but significant drop on the days executions occurred.
The Research Problem
Do executions have any unique deterrent effect on the commission of homicides, beyond the effects produced by noncapital punishment? Deterrence requires the communication of a threat of punishment to prospective offenders, so there must be some sort of communication of the risk of execution for capital punishment to exert any unique deterrent effect, that is, an effect of its own beyond the effects of lesser punishments that would still be inflicted on murderers in the absence of the death penalty.
For most serious legal punishments of crime, there is no correlation between the actual risks of punishment and prospective offenders’ perceptions of those risks (Kleck, Sever, Li, & Gertz, 2005; Lochner, 2007). Increases in actual punishment risk are not generally likely to increase perceived risk, and thus unlikely to increase whatever deterrent effects are generated by those punishments. One likely reason for this lack of correlation is the negligible amount of publicity surrounding most punishment events such as arrests, convictions, or sentencings. Prospective offenders are less likely to shift their perceptions of punishment risk if they are exposed to little or no information about such punishment events.
The death penalty, however, is an exception to these generalizations. Executions are widely covered by news outlets in the state in which they occur. Large numbers of prospective killers are therefore more likely to learn about the occurrence of executions for murder than would be true of lesser punishments. This publicity could consequently increase their perceived risk of execution (Phillips & Hensley, 1984; Stack, 1995; Stolzenberg & D’Alessio, 2004).
News coverage is, however, very short-lived. Nearly all news stories about executions, either in print media or on television, are confined to the period within a few days of the execution itself (Grogger, 1990). Thus, any elevation of the perceived risk of execution may be correspondingly short-lived. Any reduction in homicides attributable to increased deterrent effects produced by executions may last for only a few days.
This is problematic for execution deterrence studies because most of them analyze counts of homicides aggregated up to yearly time units, a few examine monthly counts (e.g., Bailey & Peterson, 1989; Land, Teske, & Zheng, 2009), but very few analyze weekly or daily homicide counts (see the 10 studies in Table 1). Deterrent effects persisting for only a few days will almost certainly be missed in studies analyzing yearly counts of homicides for nations or states, and are likely to be missed even in studies using monthly data, simply because the number of deterred homicides is likely to be so small a fraction of annual or monthly homicide counts (Hjalmarsson, 2009, 2012). Consider Texas, which carries out an unusually large number of executions, and thus might be expected to experience unusually large aggregate effects of executions on homicide counts. Over the period 1977-2013, Texas had an average of 1,827 homicides per year (Centers for Disease Control and Prevention [CDC], 2016) and carried out 508 executions—14 per year or about one per month. Even if we generously assumed that each execution prevented three homicides, Texas executions in an average year would have prevented just 42 homicides—only about 2% of the state’s annual average number of homicides. Likewise, if each monthly execution prevented three homicides, this would constitute less than 2% of the monthly homicide total. For more typical states, with far fewer executions, this fraction would be even smaller. It is highly unlikely that any yearly or monthly analyses of execution impact have been sensitive enough to reliably detect such tiny effects.
Execution Deterrence Studies Analyzing Time Units of 1 Week or Less.
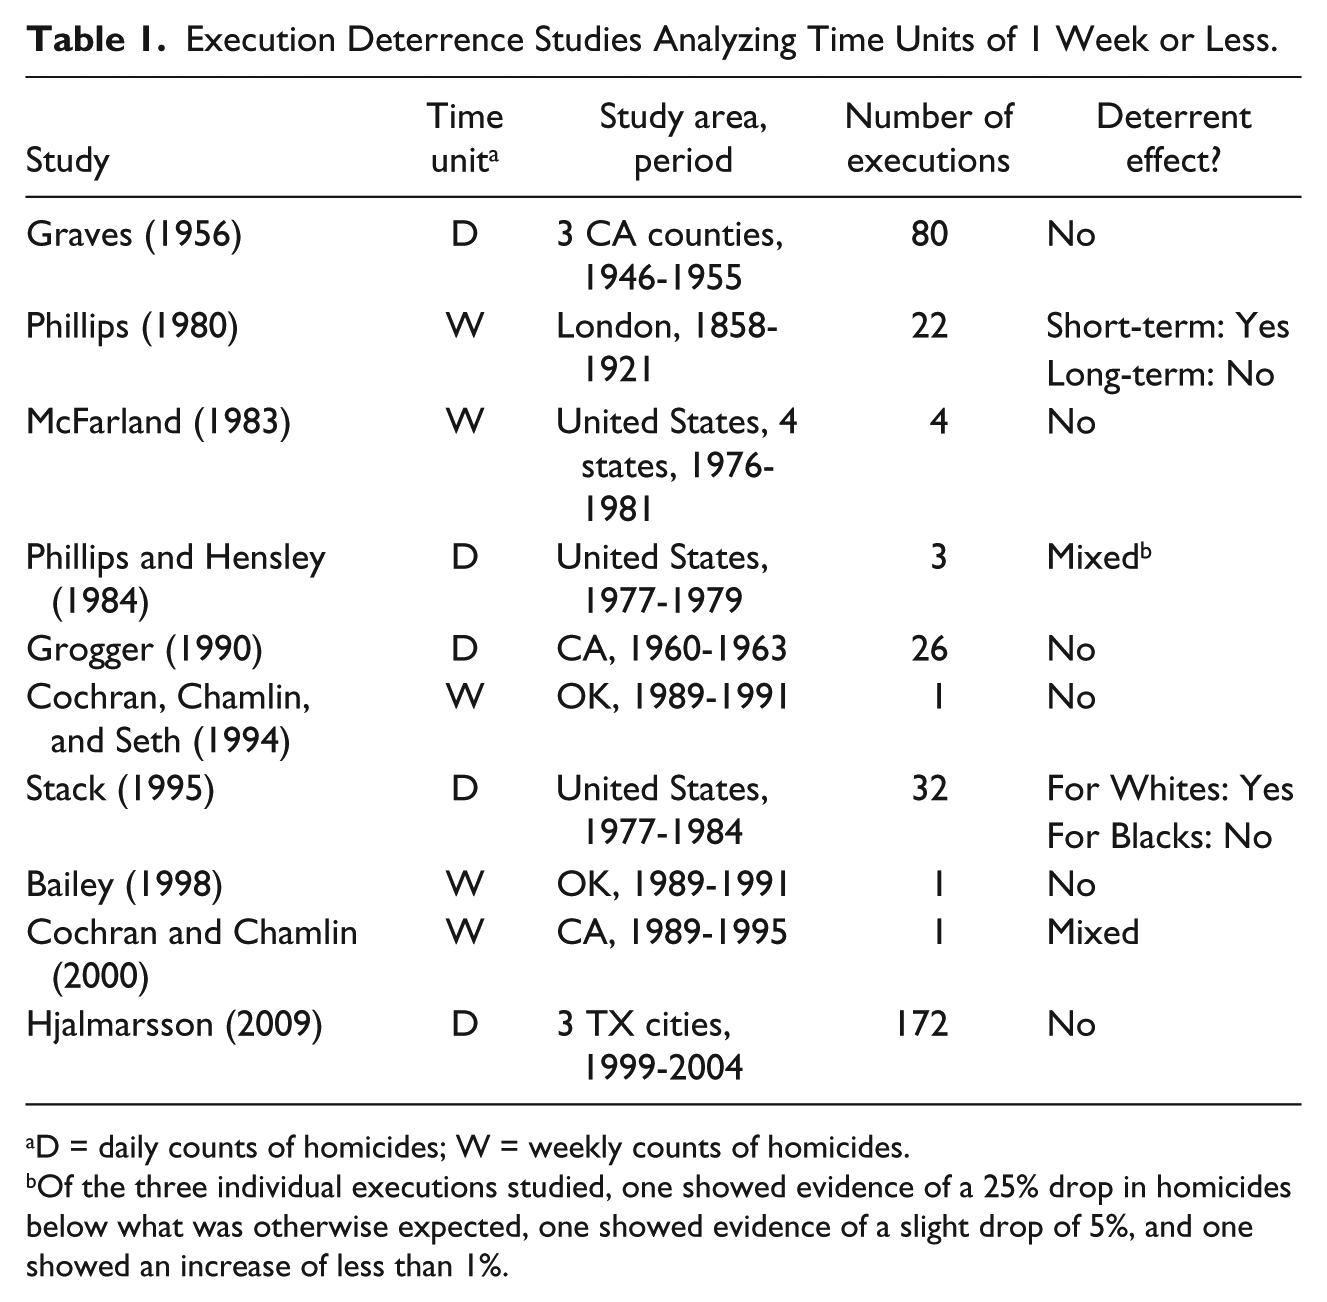
D = daily counts of homicides; W = weekly counts of homicides.
Of the three individual executions studied, one showed evidence of a 25% drop in homicides below what was otherwise expected, one showed evidence of a slight drop of 5%, and one showed an increase of less than 1%.
On the other hand, if each execution deterred three homicides, all in the week in which it occurred, this would be a quite substantial share of the average weekly homicide count. In Texas, the weekly average homicide count during 1977-2013 was 35.13, so a hypothetical drop of three homicides due to short-term deterrent effects of an execution would be 8.5% of the weekly homicide total. Furthermore, Texas averaged five homicides per day, so if this hypothetical deterrent effect of an execution was very short-lived and operated entirely within a single day, a three-homicide drop would be a 60% drop in the homicide count on each execution day. In sum, any short-term deterrent effects that executions may have become more detectable the shorter the temporal unit used in the analysis.
The shortest time unit for which homicide data are routinely available is the day. Death certificate data compiled in the Mortality Detail Files of the CDC can indicate how many homicide deaths occurred in a given location such as a state for any individual day. These data allow analysts to detect very short-lived deterrent effects. However, a disadvantage of analyzing short time periods is that the possibility of temporal displacement of homicides is increased—Prospective killers may merely defer their murders to a later time rather than be deterred altogether from committing them.
A second virtue of using short time units is that it makes it less likely that relatively slow-moving social changes, such as shifts in the degree of moral condemnation of violence or respect for the law, could account for changes in homicide frequency, allowing analysts to largely rule out these factors, or any other gradual long-term changes in causal factors, as alternative explanations of the homicide changes. While cultural change might account for changes in homicide frequency over the course of years, it is unlikely to explain sharp changes in homicide over the course of a few days.
Prior Execution Deterrence Research Using Short Time Periods
Table 1 summarizes prior research on the deterrent effects of executions that used short time intervals, defined here as 1 week or shorter. The first thing worth noting is that studies of this type claim only a tiny fraction of the hundreds of empirical studies done on deterrent effects of the death penalty (National Research Council, 2012; Yang & Lester, 2008). We could find only 10 studies that used daily or weekly data. Thus, the vast majority of death penalty studies conducted heretofore were probably incapable of detecting short-term deterrent effects of executions. If executions have exclusively short-term deterrent effects, lasting only a matter of days, virtually all prior research has missed it.
The second noteworthy pattern among these few studies examining short time periods is that nearly all of them covered only a few executions—Only two studies covered more than 32 executions, only one covered more than 80, and three of the studies were case studies of just one execution. These are all very small numbers of executions in light of the fact that there were 5,218 executions in the United States between 1930 and 2013, and 1,359 just between 1977 and 2013 (Bureau of Justice Statistics, 2014). This undercuts the external validity of these studies, as the results regarding deterrence might be a peculiarity of the handful of places and times where these few executions were carried out. Magnifying this problem further, these studies mostly covered only a single state or city, and the three that covered an entire nation studied only very short periods of time—no more than 8 years. These limitations result in samples that provide little basis for formal generalization to executions as a whole, as well as limited statistical power. The present study attempts to remedy these problems by (a) using daily homicide counts, (b) studying the entire United States, and (c) covering all 489 days on which executions occurred during this 20-year period.
In 2012, the National Research Council issued a report assessing the empirical research on Deterrence and the Death Penalty. The report concluded that shortcomings in existing research precluded any firm conclusions about whether the death penalty exerted any unique deterrent effect on murder. The two most serious problems identified were (a) a failure to take account of noncapital punishment, which was likely to be more frequent or severe in the same places and times where the death penalty was often used, and (b) incomplete or implausible models of prospective offenders’ perceptions of the risk of capital punishment.
We attempt to reduce these problems in two ways. First, although there are no data available on the average length of prison sentences across all states, or any other measure of noncapital punishment severity, it is possible to measure and control for the number of offenders imprisoned in each state in each year, and to estimate daily prisoner counts using linear interpolation.
Second, we specify a simple model of the process by which perceptions of the risk of capital punishment for murder are likely to be elevated for short time periods, and use empirical data to predict when these short-term elevations are most likely to occur, and thus when deterrent effects are most likely to be elevated above baseline levels.
Theory
How might executions exert a short-term deterrent effect? Virtually all prospective killers are likely to be aware that at least some killers, in some jurisdictions in the United States, are sentenced to death and, in some cases, executed, for their crimes. If this awareness generates a deterrent effect uniquely attributable to capital punishment, there could be a baseline level of deterrence prevailing at all times, and in all places—possibly even in areas that do not in fact have a death penalty statute or have one but do not actually execute murderers. It probably is impossible to detect a constant deterrent effect—one that does not covary with the risk of execution or the existence of death penalty statutes. It should, however, be possible in principle to detect variations in deterrent effects, that is, deviations from whatever baseline deterrent effect may operate, due to variations in use of the death penalty.
We propose that if there is any unique deterrent effect of capital punishment, it is most likely to be strongest when executions are carried out, because these events remind prospective offenders of the possibility that they could be legally put to death if they commit a murder, and thereby increase prospective killers’ fear of the death penalty. Furthermore, for prospective offenders who were unaware that their state had a death penalty, executions could inform them that murderers in their jurisdiction might suffer this punishment.
We further propose, in accord with previous death penalty researchers, that executions that are given more publicity through news outlets are more likely to exert deterrent effects than less publicized executions (Hjalmarsson, 2012; Phillips & Hensley, 1984; Stack, 1995; Stolzenberg & D’Alessio, 2004). Any elevated deterrent effects of capital punishment should therefore be strongest on the days when the volume of news coverage about a given executions is highest—typically the day that an execution is carried out, shortly after that day, or shortly before. Our reasoning is that larger numbers of prospective murderers are reminded of the risk of capital punishment when a larger number of news stories are disseminated.
Finally, we specify that detectable elevations of deterrent effects of capital punishment are most likely to occur in the state where an execution was carried out, based on the fact that news coverage of a given execution is largely confined to the state in which an execution is carried out. In sum, if executions cause any increase in deterrence, resulting drops in homicide counts should be greatest on days near an execution, when news coverage is strongest, in the states in which executions occurred.
If, on the contrary, executions do not cause any elevation in the deterrent effect of capital punishment, we would expect daily homicide counts to be roughly the same on or near execution days as on other days. Note that such a result would not necessarily show that there is no unique deterrent effect of capital punishment whatsoever, as it could not rule out the possibility of a constant baseline effect. Furthermore, it is even possible that the threat of capital punishment could uniquely deter some prospective murderers even if executions were rarely or never carried out, even in places without a death penalty, due to exaggerated perceptions of the risk of capital punishment. Null results would, however, indicate that whatever deterrent effects that capital punishment may have are not elevated when executions occur.
We hypothesize that capital punishment is nevertheless relatively more likely to exert a unique deterrent effect, if it exerts any at all, at times and places where the punishment is actually inflicted on murderers, when and where the imposition of the penalty is most widely reported. If no deterrent effects were detected in these especially likely times and places, it would cast serious doubt on whether they operate in other, less likely, times and places.
Method
Our methods are modeled after those used by Grogger (1990) in his study of daily homicide counts in California in 1960-1963, with some revisions to minimize the problems identified in the previous section. We cover all 499 executions carried out in the United States between 1979 and 1998. We began with 1979 because daily homicide data were not available before 1968, and there was only one execution during the period from 1968 through 1978. Years after 1998 were not covered because CDC mortality data for individual days are no longer freely available.
The General Research Design
The research design is a panel design, and the unit of analysis is the state-day. The state is the most appropriate areal unit for two reasons. First, death penalty statutes are enacted by state legislatures and murderers are executed under the authority of states, not municipalities or counties. Second, executions are routinely covered by news media throughout the state in which executions occur (with the possible exception of Texas, where executions have occurred so often that they may have become less newsworthy than in other states—Hjalmarsson, 2012), but rarely by news outlets outside the state. Thus, the population of the state carrying out the execution is more likely to be aware of the occurrence than persons outside the state, and more likely to be thereby reminded of the threat of execution for murder. The dependent variable is the number of homicides occurring on a given day in a given state. These counts exclude killings due to legal intervention—homicides by police and executions. Rather than computing per capita homicide rates, we controlled for the estimated daily population of the state as a covariate.
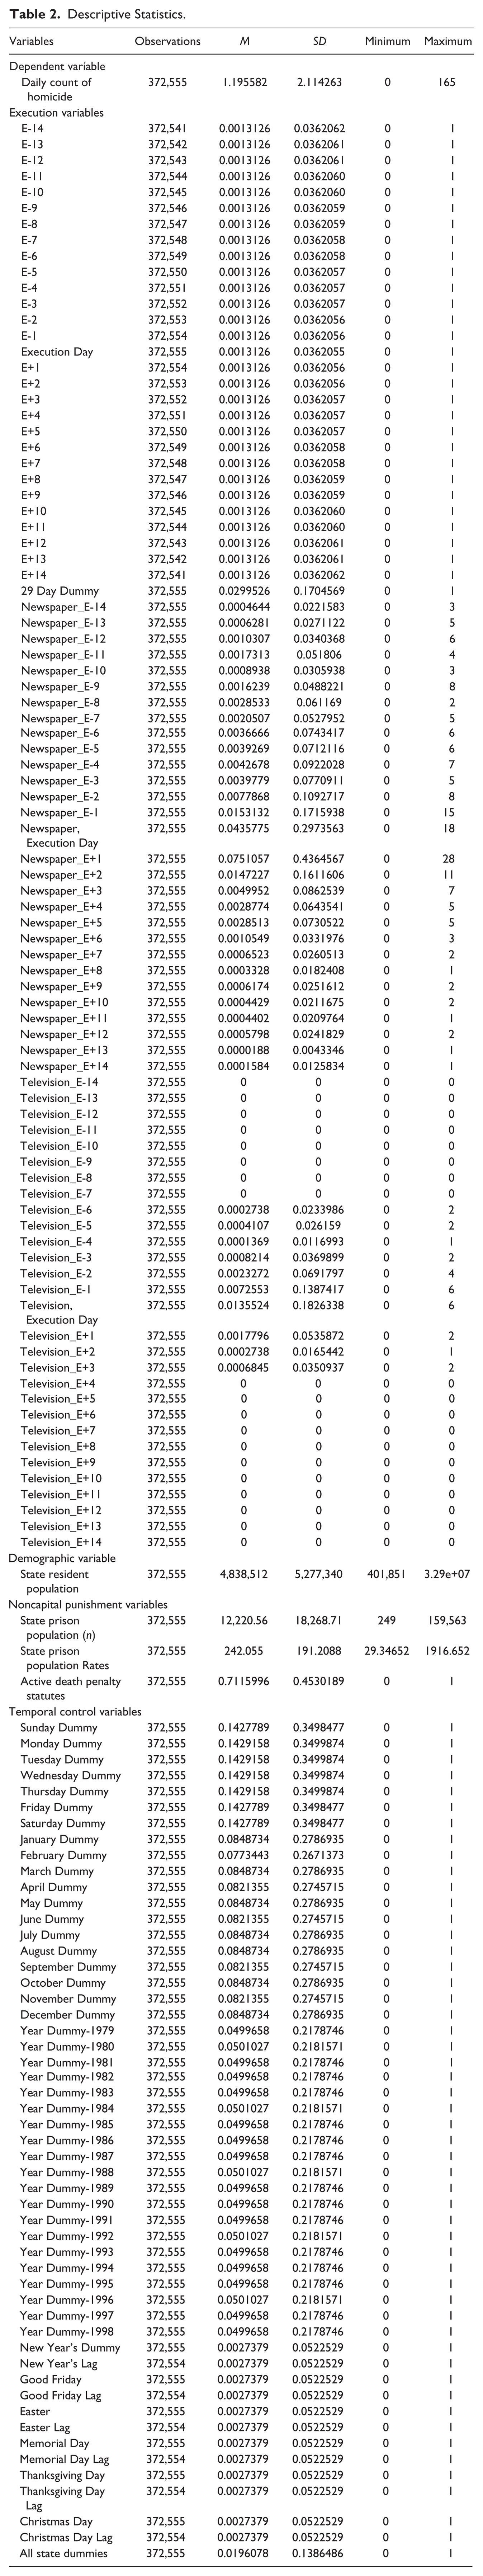
Models were estimated using negative binomial regression because daily homicide counts are discrete variables and their distributions are both distinctly nonnormal (positively skewed) and overdispersed, that is, have standard deviations that exceed their means (see Table 2). Version 14 of STATA statistical software was used to compute the estimates. All models included dummy variables for each state to control for unmeasured factors that influence homicide frequency but might also be correlated with the occurrence of executions.
Descriptive Statistics.
Measuring the Occurrence of Executions
Each state-day was dummy-coded as to whether an execution occurred within the designated state on or near that day. There was no point to recording the number of executions carried out in a given state on a given day, because the number was 1 for all but eight of 499 state-days with an execution. Any test for different effects of multiexecution state days would therefore be based on just eight cases out of 372,541 total state-days, and thus wildly unstable. Similar to Grogger, we coded for whether a given day fell within the period from 14 days before an execution to 14 days after an execution—a total of 29 days including the day of the execution itself. Our reasoning was that if no elevation of deterrent effect was evident on days just before or after an execution, it was unlikely that such elevation would occur at times more remote from the execution, when awareness of the risk of execution was less likely to be elevated among prospective killers. As a result, there are 29 execution dummy variables, each coded 1 or 0 depending on whether a state-day was a given number of days before or after an execution carried out in that state. For example, the variable labeled E-14 was coded 1 for a given state-day only if that day was 14 days before an execution in that state, while a variable labeled E+14 was coded 1 only for state-days that fell 14 days after an execution occurring in that state. The variable labeled Execution Day denotes the day of an execution and is coded 1 only for state-days on which an execution was carried out in the designated state.
To illustrate, suppose an execution was carried out in California (CA) on January 15, 1990. The state-day of CA on January 15, 1990, would be coded 1 on the E variable. CA on January 16, 1990, would be coded 1 on the E+1 variable because it was one day after an execution in that state; CA on January 17, 1990, would be coded 1 on the E+2 variable; and so forth. Likewise, CA on January 14, 1990 (the day before the execution) would be coded 1 on the E-1 variable; CA on January 13, 1990, would be coded 1 on E-2; and so forth. State-days in states other than CA would be coded 0 for this 29-day period, unless an execution had also occurred in those states during that period. The omitted category was state-days in which no executions occurred in the designated state within 14 days of the designated day. The exact dates of all executions were derived from the execution database maintained by the Death Penalty Information Center (2014).
We also coded each state-day as to whether there was a state law providing for the death penalty for murder in effect in that state on that day. The meaning of the coefficient for this variable is necessarily ambiguous, as it represents the effect on homicide counts of everything associated with changes in the presence of a death penalty statute in a state other than the variables we explicitly controlled, not just the effect of changes in whether the state has a death penalty. It serves to control for changes in whatever unmeasured homicide-relevant causal factors there are that are correlated with support for capital punishment. For example, it could help to indirectly control for any alterations in deterrent effects due to changes in the severity of prison sentences imposed for murder. Longer prison sentences are more likely to prevail in states that provide for the death penalty, and the reintroduction of the death penalty is likely to be accompanied by increases in sentence length (National Research Council, 2012). A fair number of jurisdictions did change as to whether they had a death penalty statute during the study period. Two jurisdictions abolished the death penalty during our study period, Rhode Island and the District of Columbia, while six states reenacted it: New Jersey, New York, New Hampshire, Kansas, New Mexico, and Massachusetts. Ten other states did not have a death penalty at any time during this period: Alaska, Hawaii, Iowa, Maine, Michigan, Minnesota, North Dakota, Vermont, West Virginia, and Wisconsin.
Controlling for Temporal Regularities
Homicides occur according to various well-known temporal patterns, peaking during the summer, on weekends, and on or near some holidays (Grogger, 1990; Phillips & Hensley, 1984; Stack, 1995). To control for these temporal effects, our control variables included dummy variables for each day of the week and each month of the year, omitting one day dummy (Wednesday) and one month dummy (February) to avoid perfect collinearity. To control for long-term trends in unmeasured causes of homicides, we also included dummy variables for each of the years covered by our data, omitting one of them (1995). We also included dummy variables for New Year’s Day, Washington’s Birthday, Lincoln’s Birthday, Good Friday, Easter, Memorial Day, July 4, Labor Day, Thanksgiving, and Christmas. Finally, we included dummy variables for the lagged versions of each of these holiday variables, to take account of the possibility that the day before holidays might also have elevated homicide counts. People often take off from work the day before holidays, which implies that they are more likely to be free of the discipline of the workplace and more likely to be drinking, either of which could elevate homicide (Grogger, 1990; Stack, 1995).
Controlling for Effects of Noncapital Punishment
We sought to estimate the unique effect of executions above and beyond the effects of other kinds of legal punishment, especially imprisonment. Therefore, we controlled for the estimated daily count of state prison inmates in each state, using linear interpolation to estimate figures for each day, applied to the official state totals reported for December 31 of each year (Sourcebook of Criminal Justice Statistics Online, 2014). Thus, any reductions in homicides associated with the occurrence of executions cannot be attributed to the incapacitative or deterrent effects of larger numbers of criminals being imprisoned. There are, however, no data available on average sentence lengths, so we could not directly control for noncapital punishment severity.
Measuring News Coverage of Executions
We hypothesized that short-term deterrent effects of executions were most likely to occur when news coverage of the executions was higher, based on the assumption that a larger number of prospective killers would be reminded of the risk of capital punishment at those times. We did not assume that all executions were given equal coverage by the news media, but instead actually measured the degree of coverage. We measured two kinds of coverage: (a) the number of newspaper stories about a given execution appearing on a given day and (b) the number of national television network stories about a given execution broadcast on a given day. The Lexis-Nexis Academic Universe database was used to identify newspaper stories. The variables measuring daily newspaper coverage of executions count the number of newspaper articles published about each execution in the state where the execution occurred for each of the 29 days surrounding the execution. For example, the Newspaper E-1 variable represents the number of newspaper stories about a given execution published in the same state as the execution, one day before the execution occurred, while the Newspaper E+1 variable represents the number of newspaper stories about a given execution appearing the day after an execution took place in that state, and so on. Therefore, there are 29 daily newspaper coverage of executions variables, including the 14 preceding-days variables, the execution date variable, and the 14 following days. Stories appearing in newspapers considered to be national in coverage—the New York Times, Washington Post, USA Today—were treated as stories appearing in all 50 states and D.C.
Consider an illustrative example. Mark Hopkinson was executed in Wyoming on January 22, 1992. News of this execution was published on different days by many Wyoming newspapers, as well as national newspapers. The stories published on January 9, 14, 20, 21, 22, and 23, 1992, in the national newspapers were counted for all 50 states and D.C., in addition to stories published in Wyoming newspapers. On the contrary, a story about this execution appearing in the Chicago Sun-Times on January 22 was not counted. When the identical story appeared in a newspaper in multiple editions in 1 day, it was counted as one story, to avoid double counting.
The second execution news coverage variable was daily national television coverage of executions. Comprehensive data were not available for news stories disseminated by local television stations or radio. Television may be an especially important source of news about executions because it is considered to be the most reliable source of news by the subsets of the populations that are most heavily involved in homicide, including young adults, African Americans, low-income people, and illiterate persons (Bailey, 1990; Peterson & Bailey, 1991). Our television news variables measure the number of national network television news stories aired about each execution during each of the 29 days surrounding a given execution. The TV news variables pertaining to the 14 days preceding an execution are denoted Television E-14, Television E-13, . . . , Television E-2, Television E-1, where the E-14 variable represents the number of television stories about executions on the 14 days before an execution occurred within the same state, while television news stories on days following an execution are designated Television E+1, Television E+2, . . ., Television E+14. The Television Execution Day variable measures the number of television stories about execution on the day the execution occurred.
The Vanderbilt Television News Archive (retrieved October 15, 2015, from http://tvnews.vanderbilt.edu/) was used to establish the number of national television network stories broadcast for each day concerning each execution. This database is the most extensive and complete archive of evening television news broadcasts in the United States, covering more than 30,000 individual regular and special network evening news broadcasts by the three major U.S. national broadcast networks. We counted stories broadcast by the American Broadcasting Company (ABC), Columbia Broadcasting System (CBS), and the National Broadcasting Company (NBC), the only three national news sources that were covered by the archive for the entire study period (Vanderbilt Television News Archive, 2015).
Network news stories aired by ABC, CBS, or NBC about executions were treated as stories airing in all 50 states and the District of Columbia on a given day. Similar news stories that were repeatedly broadcast by the same television network on a given day were counted as just one story, to avoid double counting.
Findings
We predicted that any unique deterrent effect of executions on homicide should be strongest when news coverage of the executions was strongest. Figure 1 illustrates the temporal pattern of newspaper coverage of executions relative to the occurrence of the executions, while Figure 2 shows the pattern for national network television stories. The vertical axes display the aggregate counts of news stories associated with each type of day. For example, Figure 1 for E-1 shows that there were a national total of about 5,000 newspaper stories appearing on the day before executions, aggregated across all such days for all 489 execution days in the United States in 1979-1998.
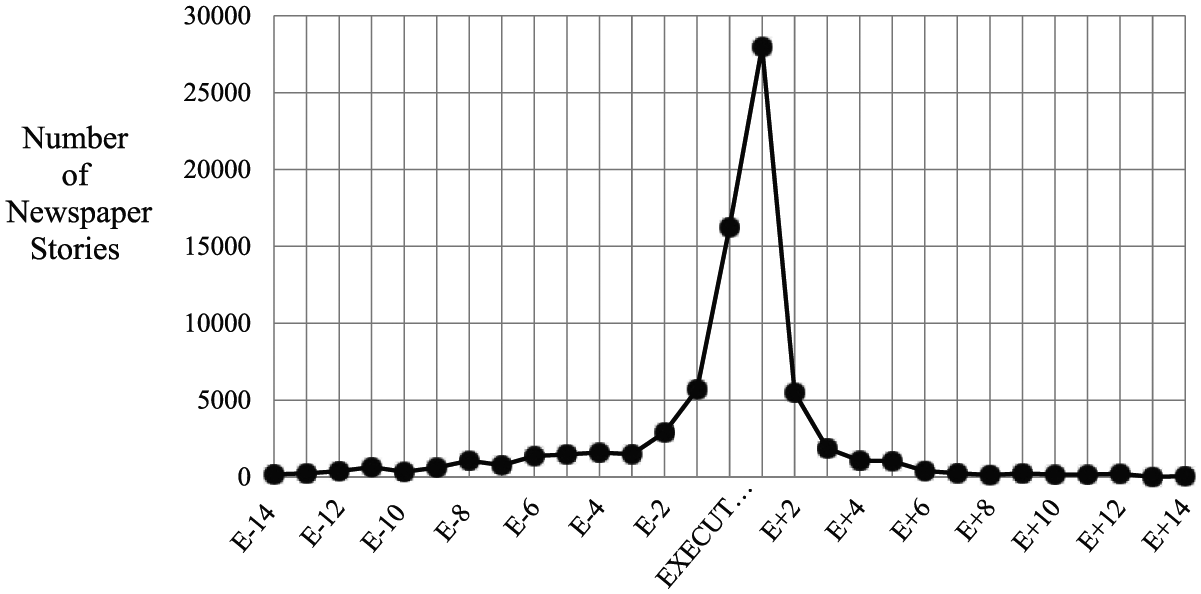
Number of in-state newspaper stories relative to execution days, 1979-1998.
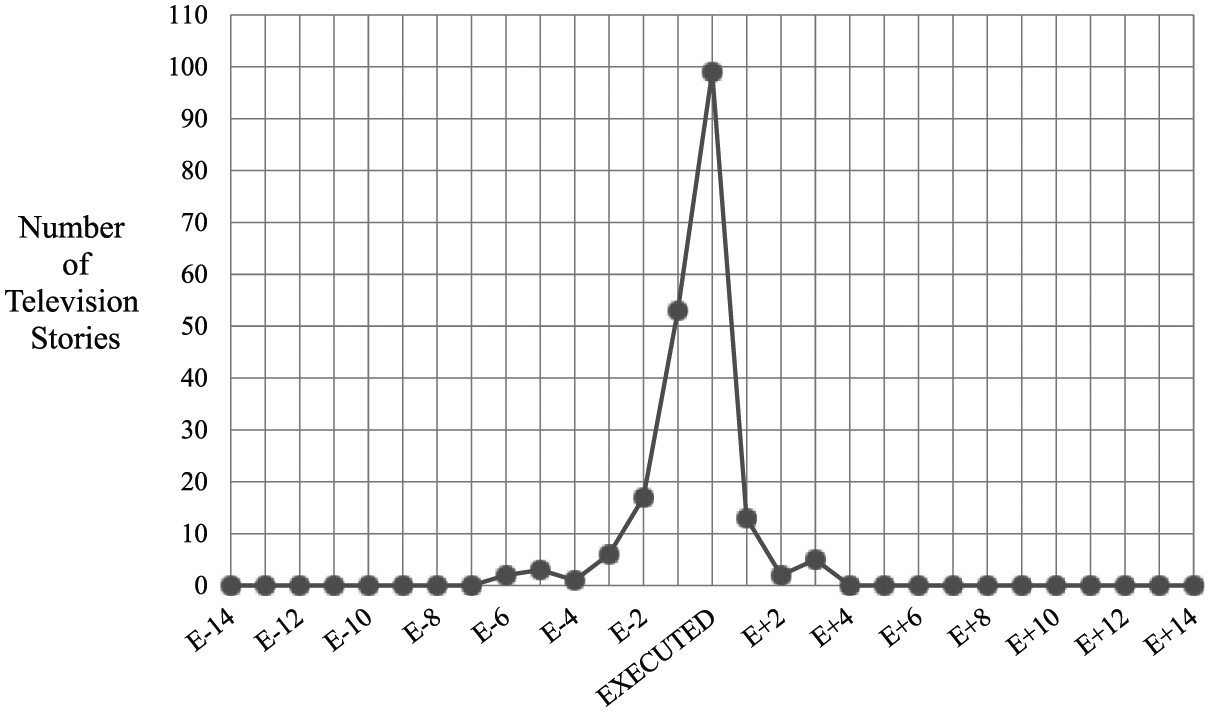
Number of national television stories relative to execution days, 1979-1998.
Figures 1 and 2 display very similar patterns for newspaper and television coverage, showing that nearly all news stories are concentrated within a few days of executions, with coverage peaking right around the day of the execution. The only difference between the two news types is that national television coverage peaks the day of the execution, while newspaper stories peak the day after the execution. All executions are publicized, but the amount of publicity differs sharply by closeness of the date to the day of the execution: 79% of newspaper stories and 92% of national news stories appeared within 2 days of the execution (E-2 through E+2). If prospective killers are most likely to be deterred by executions when news coverage is higher, drops in daily homicide counts should be most pronounced within a day or two of executions. If news stories about executions elevate perceptions of execution very quickly, deterrent effects of the executions should likewise peak the day of executions or the day after.
Table 2 lists the variables in our models of daily homicide counts for state-days and shows their descriptive statistics. Our data cover 51 states including D.C., and 7,305 days in the period from January 1, 1979, through December 31, 1998 (including 5 Leap days), for a total of 372,555 state-days. This huge sample size gives us tremendous statistical power. There were 489 days on which executions occurred in this period. Our results therefore apply to all executions occurring in the United States in this 20-year period.
Table 3 displays the negative binomial regression estimates of our full models with and without the variables measuring the volume of news coverage. All but one of the 58 coefficients for newspaper and national television coverage variables were nonsignificant. (Note that there are no coefficient estimates for national television coverage for days more than 6 days before executions or more than 3 days after, because such coverage was nonexistent for those days and there was therefore no variation on these variables.) That is, there were no drops in daily homicide accounts associated with the amount of newspaper or television coverage of executions on any of the days near executions. Thus, there is no support for the hypothesis that deterrent effects of executions are greater when news coverage is greater. Table 3 also shows that estimates of deterrent effects of executions are substantively identical across models with or without the news variables. We therefore omit the news coverage variables from subsequent versions of our models.
Negative Binomial Regression Model of Daily State Homicide Counts 1979-1998.
p < .10. **p < .05. ***p < .01.
Correspondingly, our estimates of the deterrent effects of executions for the most part do not comport with predictions that such effects would be stronger when news coverage was greater. Some of the coefficients of the execution variables are negative, and some are even positive, but not significantly different from zero. Five of the negative coefficients are significantly different from zero, but readers should keep in mind that these estimates are based on more than 372,000 state-day cases, so even very small coefficients can be significant.
More importantly, the temporal pattern of these possible deterrent effects does not, with one exception, correspond to theoretical expectations. There are statistically significant drops in daily state homicide counts 13 days before executions occurring in the state, 4 days before executions, the day of executions, and 5 and 6 days after executions—but not for any of the other days. Figure 3 illustrates the pattern of possible short-term deterrent effects implied by the execution day coefficients in Table 3. Only the drop on the execution day itself fits our deterrence model. In fact, the largest negative coefficient was for days 5 days after an execution—a finding that does not comport with either the temporal pattern of news coverage or any deterrence model with which we are familiar. There would be nothing surprising about lagged effects per se, but for effects to be larger 5 days after executions than for days just 1 to 4 days after the executions is hard to reconcile with an interpretation that these are deterrent effects. Likewise, there could well be heightened deterrent effects before an execution, especially if there was a high level of news coverage before the execution, but we know of no version of deterrence theory that would predict such effects only for days 13 days or 4 days before an execution, and not for days 1 to 3 or 5 to 12 days before executions.
Temporal pattern of possible deterrent effects implied by execution variable coefficients in Table 3.
On the other hand, the coefficient for the day of executions is significant and negative, and is consistent with the interpretation that it represents a genuine short-term deterrent effect, as it corresponds to a peak in television news coverage of executions, as well as being the day with the second-highest amount of newspaper coverage (see Figures 1 and 2). Given that even very small coefficients could be statistically significant with our enormous sample size, however, it is important to consider the substantive significance of this coefficient. The antilog of the logistic coefficient of −0.0623307 implies an odds ratio of 0.93957, that is, that there are, on average, 6.04% (1 − 0.93957 = 0.0604) fewer homicides on execution days in execution states compared with state-days days not within 14 days of an execution in the same state, holding constant the control variables included in the model. To put this in perspective, across all state-days, there are an average of 1.195582 homicides per day per state (Table 2), so a 6.04% reduction would imply a reduction of about 0.072 homicide per execution.
The implied aggregate impact of all executions on national homicide totals is quite small when we take into account how rarely executions are carried out in the United States. From 1977 through 2013, there were 1,359 executions in the United States, an average of 36.7 executions per year. If only the execution day coefficient represented a genuine deterrent effect, that is, the deterrent effect of executions was confined to the day of the execution, then 36.7 executions would deter a total of just 2.65 homicides per year across the entire United States (−0.072 × 36.7 = −2.65), compared with annual homicide counts in the 1979-1998 study period of 20,000-23,000. Given current willingness to actually execute murderers, the aggregate short-term effect of all executions on U.S. homicide counts surely must be regarded as extremely small by any reasonable standard.
One possible explanation for the unexpected temporal patterns of apparent deterrent effects 4, 5, and 12 days after executions is that they might be attributable to overlapping 4-week execution periods. A date that was 5 days after one execution might also be the date that a different execution occurred in the same state. Thus, what appears to be an anomalous homicide drop inexplicably occurring 5 days after an execution could actually be due to a less surprising same-day effect of a different execution occurring 5 days after the first one. In the few states that carried out frequent executions, like Texas, the 4-week period surrounding one execution sometimes overlapped the 4-week period surrounding a different execution in the same state. This was not a problem for coding the execution variables—a given state-day would be coded 1 on more than one execution variable—nor is it a problem for estimation, but it could contribute to confusion in interpreting the meaning of the coefficients for these variables.
We tested this explanation by searching for pairs of execution days that occurred within 14 days of each other in the same state. Most of these were in Texas. We were especially interested in pairs of executions separated by 4, 5, 6, or 13 days, as these were the pairs that might explain the unexpected significant negative coefficients for execution variables E-13, E-4, E+5, and E+6. We found that, out of 107 pairs of executions occurring within 14 days of each other in the same state, there were only eight such pairs separated by 4 days, seven pairs separated by 5 days, eight pairs separated by 6 days, and four pairs separated by 13 days. In fact, the most common intervals between pairs of “nearby” executions were 7 days (24 pairs) and 1 day (18 pairs). Neither interval corresponds to any of the execution variables with a significant negative coefficient. We concluded that it was unlikely that the unexpectedly significant negative coefficients for execution variables were a product of overlapping execution periods.
Bogus Intervention Test
Notwithstanding our efforts to rule out spurious results due to various temporal regularities in homicide counts, it is always possible that there are very subtle or complex regularities that we did not anticipate. Perhaps the days when executions are carried out, or that are near to such dates, are associated with lower homicide counts for timing-related reasons that go beyond the regularities in human behavior associated with the day of the week, month, year, or holidays, which we did control for. One way to assess the possibility of such a temporally related spurious or artifactual result is a bogus intervention test (Baron & Reiss, 1985), in which intentionally erroneous dates are assigned to interventions. In this spirit, we created year-ahead bogus interventions—each execution was treated as if it had been carried out in the same state, on the same day of the week, but 1 year later than it actually occurred. Thus, an execution that was carried out in Arkansas on August 10, 1990, would be intentionally coded as having occurred on August 10, 1991. Executions carried out in the last year of our study period, 1998, were “wrapped around” to 1979, the first of the study period.
If the significant negative coefficients for execution variables spuriously reflected some unknown temporal regularity, they would also appear in the bogus intervention analyses even though the state-days coded as execution days did not actually carry out executions on those days. Such results would suggest that our methods could generate significant negative coefficients for “execution” variables even though those variables did not actually denote days near an execution, thereby casting doubt on the interpretation that executions had actual deterrent effects. Table 4 reports the resulting estimates, which are based on the same models as shown in Table 3. Estimates pertaining to the other variables besides execution variables are omitted to conserve space.
Results of Bogus Year-Ahead “Interventions” Analysis.
Note. Coefficients with significance under .10 are marked in bold. All the variables shown in Table 3 were also included in these models, but estimates of parameters for the variables not shown were omitted to conserve space.
The results indicate that one can indeed obtain significant but clearly spurious negative coefficients for the execution variables. Of the 29 days near a bogus execution date, two showed significant negative coefficients (6 days before executions and 9 days after), and another three showed near-significant (.05 < p < .10) negative coefficients (14 days before executions, 1 day after, and 9 days after). These results obviously cannot reflect actual deterrent effects of executions because the “execution” dates are not on or near days when executions occurred. We do not know why these spurious associations occur, but can say that these results suggest that even the result we obtained indicating a drop in homicides on the day that executions were carried out may have been similarly spurious.
Sensitivity Tests Regarding Ways of Representing Executions
We also performed sensitivity tests to see how robust findings were with respect to how we represented the occurrence of executions, trying out alternative measures. The 29 execution day variables are correlated with each other, contributing to an inflation of standard errors of the coefficients for these variables. We therefore tested several single-variable representations of the occurrence of executions. The resulting estimates of the execution variable coefficients and standard errors are shown in Table 5.
Sensitivity of Estimates to Methods for Representing the Occurrence of Executions.a
Note. All variables shown in Table 3 were also included in these models.
*p < .10. **p < .05. ***p < .01.
First, we estimated models in which the “Execution Day” dummy variable was the sole execution variable. The results indicate that the estimated drop in daily homicide counts for execution days and its standard error remained essentially unchanged when the rest of the execution variables were omitted. We then substituted a different binary execution variable, which simply measured whether any executions had occurred in the designated state within 14 days, before or after, of the designated day. The coefficient for this variable in a sense represents an average of the coefficients for all 29 execution variables included in the original model, so we would expect it to be weaker than the Execution Day coefficient, but larger than the various nonsignificant coefficients. This was indeed what we found (see Table 4, estimates for the 29-day dummy). Finally, we also tried using a single execution variable indicating whether any executions had occurred in the designated state within 7 days of the designated date. The resulting coefficient was stronger than that of the 29-day dummy but weaker than that of the Execution Day variable (see estimates for 15-day dummy). Taken as a whole, the estimates indicate statistically significant but weak short-term drops in daily homicide counts around the time of executions, which are largely attributable to effects occurring on the day of executions.
Discussion and Conclusions
Daily homicide counts do not generally drop on any of the days within 2 weeks of executions, excepting a small drop on the day of the execution. We cannot, however, definitively rule out the possibility of temporal displacement. That is, executions may merely cause some killers to defer their crimes to a later date (Phillips, 1980). Were this true, however, we would have expected to see significant positive coefficients for the dummy variables representing days, say, 7 to 14 days after an execution. Some killings might well be deferred for weeks or even months, to times outside of the period covered in our analyses, but if temporal displacement were a common phenomenon among killers, one would expect at least a few killings to be deferred for only a week or two, showing up in our data as significant increases in homicides 7 to 14 days after executions. We found no evidence of that. This suggests that temporal displacement of killings in response to executions either does not occur or it occurs but only for periods exceeding 2 weeks. The latter possibility strikes us as unlikely.
It is impossible to rule out the possibility that the sheer existence of capital punishment exerts a unique deterrent effect that does not, however, covary with the occurrence of executions. One could always speculate that there is some “baseline” deterrent effect attributable to the awareness among prospective murderers of the theoretical possibility of being executed for murder, but that the effect is no stronger when executions are carried out, or in places where the probability of murderers being executed is higher.
Furthermore, it is possible that there is some unique deterrent effect of executions, but the effect is counterbalanced by a “brutalizing” effect of executions on the population (Bowers & Pierce, 1980). To the extent that such an effect takes a long time to develop, our research design cannot detect it. Indeed, if such effects are extremely gradual and take years to cumulate to a point when they are detectable, sharp tests of brutalization may not be feasible, especially if analysts cannot convincingly state, a priori, just how long this process takes. On the other hand, if brutalization effects develop only over months or years, and are dispersed across many executions, our estimates of short-term (with 14 days) effects of executions are unlikely to be substantially influenced by such gradual and diffuse effects.
Although we controlled for the number of persons imprisoned, we could not take account of the severity of noncapital punishments, such as the length of prison sentences. The effect of executions might be confused with the effects of the more severe prison sentences that are typically imposed in the same places where executions are most numerous (National Research Council, 2012). We do not, however, regard this as a serious problem as the vast majority of prior research indicates that the severity of noncapital punishment has no detectable effect on criminal behavior (see reviews of this massive literature by Doob & Webster, 2003; Nagin & Pogarsky, 2001; Pratt, Cullen, Blevins, Daigle, & Madensen, 2006). Perceived severity of legal punishment is likewise generally unrelated to criminal behavior; Paternoster (2010) summarize the enormous body of prior research this way: “ . . . perceived severity and celerity of punishment do not appear to be effective deterrents to crime” (p. 818). Furthermore, perceptions of the average length of prison sentences imposed for serious crimes are unrelated to the average lengths of sentences actually imposed (Kleck et al., 2005), so even if perceived sentence lengths did affect criminal behavior, actual sentence lengths would be unrelated to crime rates. As the severity of noncapital punishment appears to have no effect, its omission from our models should be inconsequential.
It would seem to be reasonable to expect that any unique deterrent effect of the death penalty would be strongest in places and at times when the penalty is actually imposed, that is, when executions are carried out. Furthermore, one would expect that such effects, if they existed, would be most evident near the times when executions occur, even if not confined to such times. Finally, it seems reasonable to expect such effects would be stronger for executions with more news coverage because the perceived risk of execution should be elevated the most when larger numbers of prospective murderers are reminded of the risk. We found virtually no evidence for such effects. Executions may have slight deterrent effects, but our results suggest that they are confined to the day when executions are carried out. Furthermore, the impact of executions on homicide is unrelated to the number of stories either in newspapers or on national television.
One might plausibly speculate that executions in one state (or publicity about executions) might exert effects in other states, especially neighboring states, but it is far less plausible that executions would routinely have more effect outside the state in which the execution occurred than inside the state. As we generally found no significant in-state effects of executions, this suggests that there were no significant cross-state effects.
Likewise, one might speculate that it is public announcements by prosecutors that they will seek the death penalty, or court sentencings to death, that generate deterrent effects, rather than executions. While such speculations have some a priori plausibility, we are not aware of any theoretical rationale why such preliminary events should exert more deterrent effect than actually executing killers.
It should be noted that we classified homicides according to the state in which the victim died, which is not necessarily the state in which the homicidal attack occurred. Thus, the victim of a killer who attacked in State A might die in a hospital in State B, and their death would be attributed to State B rather than State A, the jurisdiction whose punishments could be imposed on the killer. This problem would not apply to homicide deaths that occurred at or near the scene of the attack, and we are not aware of any reason why this sort of misclassification of the location of other homicides would be related to the occurrence of executions.
Future research needs to directly measure perceptions of the risk of execution for murder. Arguably, we indirectly measured perceptions, if one is willing to believe that perceptions of this risk tend to be higher when news coverage of executions is more widespread, but we recognize that some scholars would not be willing to accept this premise, or would note that this measure is at best a very partial indicator of perceived risk. National surveys of probability samples of the population, with oversampling of subpopulations at higher risk of committing murder, could directly ask respondents about whether they believe that their state has a death penalty statute, and their beliefs as to the probability of a murder resulting in the execution of the killer. These individual perceptions could then be related to (a) the actual presence of a death penalty statute and the actual probability of murder resulting in execution in the respondent’s state and to (b) homicide rates.
Footnotes
Declaration of Conflicting Interests
The author(s) declared no potential conflicts of interest with respect to the research, authorship, and/or publication of this article.
Funding
The author(s) received no financial support for the research, authorship, and/or publication of this article.