
Abstract
This exploratory research examines the predictive accuracy of the Youth Assessment and Screening Instrument adopted by the North Dakota Juvenile Court through a retrospective review of assessment and court records. While studies of YASI from New York, Virginia, and Canada provide some confidence in the instrument’s predictive validity, questions remain concerning its accuracy among female and other specialized populations. This study finds a moderate effect for the instrument’s predictive accuracy in relation to general reoffending from a random sample of juvenile probationers (AUC = 0.66, p = .002, 95% CI [0.56, 0.75], N = 139), but results were notably weaker for females compared to males. Further research is needed on its accuracy among African American and Native American youth.
Introduction
Beginning in 2002, juvenile court officers (JCOs, a.k.a., juvenile probation officers) in the state of North Dakota transitioned from professional judgment to the use of actuarial risk assessment instruments. Specifically, they established a contractual relationship with Orbis Partners to utilize the Youth Assessment and Screening Instrument (YASI). This relationship has since continued for nearly two decades. Though reportedly subject to an initial norming process, and further evaluations completed elsewhere (Jones et al., 2014, 2016; Kennealy et al., 2017; Orbis Partners, 2007; Scott et al., 2019; Skeem et al., 2017), the instrument’s use has gone untested within this predominantly rural Midwestern state.
This exploratory study represents only the second independent validation of this instrument (Scott et al., 2019), and the first to do so within the United States (with exception to a substantially modified version of the instrument implemented in California, see Skeem et al., 2013). Scott et al. (2019) noted that prior published assessments of predictive validity for this instrument have otherwise come solely from the tool developers (Jones et al., 2016; Orbis Partners, 2007). This project, supported by a modest university grant, sought to assess the YASI’s predictive validity. The authors reviewed a random selection of electronic case files produced by the court between 2010 and 2017. In the following sections we discuss the prevalent use of juvenile probation, risk assessment as an evidence-based practice, review the research specific to YASI implementation, followed by an overview of the current study, its methods, results, and implications for practice and further research.
Literature Review
Unlike many other states that suffered during the Great Recession of the late 2000s (Eichengreen, 2015), North Dakota experienced a later economic recession, during the mid-2010s, impacted largely by its dependency on agriculture and oil production (Webster, 2016). During the 2000s, North Dakota was booming when much of the country faced an economic crisis (for more see Archbold, 2015; Heitkamp & Mayzer, 2018). The recent recession, however, has led to substantial budget cuts and reductions in the state workforce, including a reduction from 39 to 36 JCOs, with the economy continuing to remain tenuous for the region according to economic reports from Creighton University.
With exception to Maine and Vermont, North Dakota is unique from other states given 39 of its 53 counties are classified as completely rural (North Dakota Department of Commerce, 2017). Further, as reported by the US Census Bureau the state’s largest minority population is Native American at 5.5%, with just under half of this population living outside of a reservation according to the North Dakota Indian Affairs Commission. The representation of Native American youth in the juvenile justice system appears to be proportional to their representation in the larger population (National Center for Juvenile Justice, 2017).
Despite these economic and population differences, the rate of delinquency has been consistent with that of the larger national trend (Hockenberry, 2019), a continual and steady reduction over the past decade. Specifically, the state has experienced a steady decline in its total delinquent and unruly juvenile referrals from about 10,000 in 2008 to just under 7,000 in 2018 (North Dakota Juvenile Court, 2018). While NCJJ reported a decrease of 49% in juvenile referrals across the nation from 2005 to 2016, North Dakota has experienced a decline of about 33% from 2008 to 2018. This trend has held true despite continued growth in the state’s population and recent economic developments (North Dakota Department of Commerce, 2016). In terms of structure, along with 22 other states, juvenile probation is a state-operated function under the judiciary (National Center for Juvenile Justice, 2017).
Most pertinent to the current study, North Dakota is one of 38 states to have adopted a single youth-specific risk assessment tool for statewide use (National Center for Juvenile Justice, 2017). Five other states utilize YASI statewide including Hawaii, Illinois, New York, Vermont, and Virginia. Note, though not implemented statewide, the California Division of Juvenile Justice has adopted the use of a modified YASI instrument known as the CA-YASI (Kennealy et al., 2017; Skeem et al., 2017). Finally, YASI is also used in the UK and Canada (Jones et al., 2016).
The Role of Risk Assessment in Community Corrections
Risk and needs assessment is a core tenet of evidence-based practice in community corrections (Crime and Justice Institute, 2009), and also the key to appropriately referring youth to proper services, ideally evidence-based programs (Greenwood, 2014; Howell et al., 2019) that target dynamic risk factors (Latessa et al., 2015). The goal of risk assessment is to identify those at greatest risk to reoffend and focus supervision and services on that specific population. This is not only fiscally responsible, but prior research has demonstrated exposing low-risk youth to intensive services can lead to adverse outcomes (Krysik & LeCroy, 2002; Schwalbe, 2007). Further, it has been well documented that a large proportion of delinquent behavior stems from the actions of a small number of juveniles (Howell et al., 2019). Accurate assessments allow resources to be directed at this criminogenic population, where the impact is most likely to have a desirable effect. Further, empirical assessments have been shown to be more objective, reliable, and equitable than clinical risk assessments or professional judgments (Dawes et al., 1989; Duwe & Rocque, 2017; Grove & Meehl, 1996; Schnieder et al., 1996).
Actuarial risk assessment instruments typically divide youth into ordinal classifications of low, medium, or high risk for repeat offending by assigning numerical scores to a series of risk factors known to correlate with subsequent delinquent behaviors (Schwalbe, 2007). Domains of interest include prior criminal history, substance abuse, family relations, peer delinquency, and school-related bonds and performance. The scores associated with these domains, comprising a risk index, are weighted and summed to yield an overall composite risk score. Standardized cut-offs are developed to categorize youth into one of several ordinal classifications ranging from low to high risk. While early-era instruments focused primarily on risk and classification, modern day instruments are also used to guide intervention selections based on need and responsivity considerations (Andrews et al., 1990). This has led to a greater interest in dynamic (i.e., alterable) risk factors (e.g., substance abuse, cognitive errors) in addition to static risk factors (e.g., criminal history, age, race, gender).
The Proliferation of Risk Assessment in Juvenile Justice and the Need for Validation
There are numerous risk assessment instruments available of varying quality and effectiveness (Baird et al., 2013; Desmarais & Singh, 2013; Schwalbe, 2007). In more recent years, as the use of risk assessment instruments has permeated the field of probation, more attention has been paid to their predictive validity, especially in comparisons across instruments and between differing populations subjected to a given assessment (Shepherd et al., 2013). Whereas instrument development is based on an estimation sample in which risk factors associated with recidivism are identified and combined to form an index, validation is assessed using a separate sample in which the predictive validity of that index is examined (Krysik & LeCroy, 2002). It must be recognized that not all instruments are developed with the same level of statistical rigor, nor subsequently validated. Examples include adaptations of the Model Risk Assessment Instrument and the North Carolina Assessment of Risk (Howell, 1995; Schwalbe et al., 2004). Though often containing similar risk factors as actuarially developed instruments, such instruments were typically developed through consensus building with juvenile justice professionals (Schwalbe, 2007; Taxman & Belenko, 2012).
Further, instruments developed more recently have tended to be lengthier, measuring risk factors using large multi-item scales (DeVellis, 2012). The Youth Level of Service/Case Management Inventory (YLS/CMI), for example, examines eight domains of risk using a total of 42 items (Schwalbe, 2007). Others, such as the Washington State Juvenile Court Assessment, utilize alternative matrix scoring procedures and other novel approaches in calculating risk (Barnoski, 2004). Though often measuring similar concepts, their method of development and execution can vary significantly.
Regardless of the approach, the goal is to produce an instrument that possesses high predictive validity (i.e., can accurately predict the risk of recidivism). When instruments possess low levels of predictive validity the information provided is little better than that of subjective professional assessments, if not altogether misleading (Krysik & LeCroy, 2002). Poor predictive validity can be a real concern for agencies that adopt risk assessment instruments from other jurisdictions without subsequent validation (Jones et al., 2001). By doing so, the agency is assuming what worked in one jurisdiction will work in another (Taxman & Belenko, 2012).
Systematic reviews and meta-analyses of adult risk assessment validations have generally produced positive outcomes, noting well developed instruments can predict recidivism significantly above chance (Barbaree et al., 2001; Gendreau et al., 1996, 2002). Similar outcomes have been found for juvenile populations (Schwalbe, 2007). Schwalbe’s systematic review and meta-analysis of juvenile risk assessment instruments included 28 studies. The YLS/CMI was the most commonly researched instrument, present in 11 of the 28 studies. Schwalbe (2007) found third generation instruments (e.g., YLS/CMI, Young Offender Level of Service Inventory) that utilized multi-item scales to measure a given construct tended to have improved predictive validity. That said, the YLS/CMI, which was the most heavily researched, possessed some of the highest and lowest effect sizes of all instruments studied, suggesting further research was warranted. With exception to the YLS/CMI, few instruments have been validated across multiple samples. Not only are validation studies needed, periodic re-validation studies were also recommended.
Another issue that has complicated the use of risk assessment instruments has been their performance variability across gender, race, and ethnicity (Shepherd et al., 2013). Shepherd and colleagues argue that risk assessment in juvenile justice is still relatively new and the majority of validation research has focused on males because they constitute a large proportion of delinquent and criminal behavior. Their review of the literature concerning the Structured Assessment of Violence Risk in Youth (SAVRY), YLS/CMI, and PCL-YV concluded further investigation is still needed in this regard. Female recidivism, for example, is likely to be influenced by victimization and abuse, depression, self-esteem issues, mental illness, substance abuse, truancy, sexual promiscuity, and relationship or family issues. Variations in coping responses across gender suggests the predictive validity of risk assessment is likely to be impacted by these differing behavioral patterns. Some instruments have been developed specifically to apply to female antisocial behaviors, including the Early Assessment Risk List for Girls (EARL-21G), but little research has been conducted often due to small sample sizes. Attempts have also been made to examine factors unique to Aboriginal offenders (e.g., chronic criminal histories, pain, anger, and depression passed down through generations) in Australia and Canada, but with no discernable improvement on recidivism prediction. Despite disproportionate representation of minority populations involved in the criminal justice system, little research has attempted to compare the predictive validity of risk assessment instruments across racial and ethnic populations. From the research that does exist, results are often mixed or contradictory (Singh et al., 2011; Skeem et al., 2004; Snowden et al., 2010).
A Review of the Research on YASI
The authors were able to retrieve five reports concerning predictive accuracy research specific to the YASI instrument from peer-reviewed academic journals (Jones et al., 2014, 2016; Kennealy et al., 2017; Scott et al., 2019; Skeem et al., 2017). In addition, a technical report was located from Orbis Partners (2007) as well as a series of reports produced for the California Department of Corrections and Rehabilitation (Skeem et al., 2013a, 2013b). Three additional reports have been cited previously but could not be retrieved (Brown et al., 2012; Orbis Partners, 2012; Skeem et al., 2012; as cited in Jones et al., 2014).
In terms of predictive validity, Natalie Jones and colleagues found a statistically significant and large effect using a Canadian sample of youth under community supervision; however, the authors note that prior implementations of YASI had yielded more modest results (Jones et al., 2016, p. 189). The authors reference a prior report produced for New York State where outcomes overall were notably weaker (Orbis Partners, 2007). Further, a recent evaluation conducted by Scott et al. (2019) also found a relatively moderate effect amongst another Canadian sample of justice-involved youth. Additionally, a report produced by Skeem et al. (2013) provided evidence of a moderate effect for the uniquely adapted CA-YASI, though their research focused exclusively on males. In terms of demographics, though YASI was reportedly normed for females (Jones et al., 2016; for further discussion see Jones et al., 2014), it has consistently performed better for males (as demonstrated by Jones et al., 2016; Scott et al., 2019). In the case of New York State results overall were weak-to-moderate for both males and females, though the authors noted an issue with females being over-classified (Orbis Partners, 2007). Finally, though Jones et al. (2016) found similar results by race and ethnicity comparable to their overall results (Orbis Partners, 2007), but no other studies examined these distinct subpopulations.
Though not a focus of the current study, several articles have examined other important qualities of the YASI, including its construct validity (Skeem et al., 2017), convergent validity (Scott et al., 2019), and interrater reliability (Kennealy et al., 2017). Skeem et al. (2017) reported the CA-YASI possessed little evidence of construct validity with exception to criminal history and substance abuse. They concluded other domains such as attitudes, social-cognitive skills, and social influences do not accurately measure what they are intended to measure and therefore are poorly equipped to guide treatment referral decisions. Scott et al. (2019) further assessed convergent validity by comparing the results of YASI with the YLS/CMI. They found the risk scores of the two instruments to be strongly correlated. Though results were nearly identical for males, the YLS/CMI performed better for females (see Table 2 of Scott et al., 2019, p. 819). Lastly, Kennealy et al. (2017) examined practitioners’ consistency in scoring the CA-YASI. Using a group of expert scorers for comparison, they found only 59% of staff scored the tool with good accuracy. Interestingly, they found staff performed poorly for subscales that required greater judgment (e.g., attitudes) compared to straightforward measures such as criminal history. In addition, they found newer staff were more consistent compared to more experienced staff. Indeed, prior research has shown the quality of risk assessment implementation can directly impact the predictive ability of the tool (Latessa et al., 2015).
Current Study
This research examines the YASI’s predictive accuracy using a random sample constructed in coordination with the North Dakota Juvenile Court. Similar to Hawaii and Vermont, no prior publications have examined the performance of YASI in this state. Data were collected from three distinct data systems including the state’s YASI CaseWorks software, the state court case management system (CMS), and the state’s Odyssey criminal records check software. The research was funded by a small internal university grant and the research protocol associated with this publication was reviewed and approved by the University of North Dakota Institutional Review Board (IRB-201802-215). Records were manually checked and documented using the Statistical Package for the Social Sciences (a.k.a., SPSS). Three research assistants were hired to support the project. One undergraduate student assisted solely in project planning, while one graduate student was heavily involved in data collection working closely with the principal investigator. One additional graduate student participated in a small quality assurance check whereby five cases were collected for review, with no disagreements in data transference observed. The primary goals of this research were to determine (1) the extent to which data necessary for evaluation were present and retrievable, and (2) to what extent does this tool accurately predict the likelihood of recidivism.
Method
Sampling Procedures
A random sample of 500 cases were reviewed, extracted from a sampling frame of 3,754 case identification numbers provided by the court. Note, this sampling frame included all cases associated with a YASI CaseWorks record, not all cases in the CMS. It also excludes archived cases that have since been sealed (i.e., case records over 10 years old). We immediately removed nine cases due to duplicate identifiers. Another 97 cases were omitted because no corresponding record was present in CMS. Fourteen cases lacked probation supervision as a sanction and therefore were subsequently removed. Two cases were found to possess incomplete assessments and lacked a final classification. Finally, of the remaining 378 cases 239 cases possessed an insufficient follow-up period for a three-year review (i.e., still active or under 3 years from completion), resulting in 139 valid cases suitable for further review and analysis.
Recidivism
Various measures of recidivism have been utilized in prior studies of YASI. For example, Jones et al. (2016) examined records of new offenses over an 18-month fixed follow-up period. Scott and colleagues, alternatively, used a 24-month fixed follow-up period based on reconviction/readjudication while Skeem et al. (2013) examined rearrest within 1 year after release from detention. The current study relies on the state’s recidivism definition specific to juvenile probation;
Youth under community supervision (formal and informal) for a delinquent offense that admit or are adjudicated or convicted within three years of supervision closure/termination and youth under community supervision that are placed with an agency within three years of community supervision closure/termination.
Specifically, we reviewed court records to determine if a given youth committed any new offense that led to a subsequent sanction or formal action of probation, detention, or referral. Note, unlike Scott et al. (2019), new adjudications were not counted as recidivism unless they occurred after their supervision was terminated. Further, in every case we limited our review to a given juvenile’s initial probationary offense and initial YASI assessment. In some cases, a juvenile may have served multiple terms of probation and recidivated multiple times. Only the first term of probation was considered in this review. For youth that age out of the juvenile system the authors used the state’s Odyssey records check database. Note only misdemeanor and felony offenses were considered a recidivating event for those that aged out. However, youth with juvenile status offenses (a.k.a., unruly) that resulted in formal action or a referral (e.g., social services) were counted as a failure (i.e., recidivating event).
YASI Measures
YASI consists of a 34-item Pre-Screen which, if deemed moderate or high risk, results in a Full Assessment including 50 additional items (a sample of items used in the assessment is provided in the appendix of Jones et al., 2016, pp. 193–194). The Pre-Screen is comprised of nine domains; legal history, family, school, community/peers, alcohol and drugs, mental health, aggression/violence, attitudes, and skills. The Full Assessment incorporates additional items but also adds a domain for employment and free time. CaseWorks utilizes a proprietary algorithm that weighs and summarizes these items and domains to produce a composite risk and strength score (for further description see Jones et al., 2016; Orbis Partners, 2018). Using baseline cutoffs derived from a preliminary study conducted in Illinois, classifications of low, moderate, or high risk are assigned (Jones et al., 2016). According to Natalie Jones and colleagues the expected range of recidivism is 10% to 20% for low risk, 30% to 40% for moderate risk, and 50% to 60% for high risk youth (Jones et al., 2016, p. 185). Primarily used to assist in case planning, YASI also includes protective measures and provides a corresponding classification of low, moderate, or high strength.
Predictive Accuracy and Statistical Power
In addition to examining frequency distributions and bivariate analyses of recidivism by offense type, risk level, and protective measures compared across gender and race; the authors utilize the receiver operating characteristic (ROC) area under the curve (AUC) statistic to assess predictive accuracy (Hamilton et al., 2019). The AUC has been applied across many fields, initially used in a military setting (Howard, 2017), to a variety of tests in which the probability of a predicted outcome can be verified (Georgiou, 2019). The AUC produces an effect size ranging from 0 to 1, with a value of 0.50 indicating the instrument performed no better than if one were to rely on random chance. Scores above 0.50 indicate greater predictive validity. Most recently, Hamilton et al. (2019) relied on benchmarks informed by Rice and Harris (2005, p. 8) which distinguished an AUC of <0.56 as negligible, 0.56 to 0.63 as small, 0.64 to 0.70 as moderate, and scores of 0.70 or greater as indicative of a large effect. However, other benchmarks based on professional judgments exist. For example, Orbis Partners (2007) interpreted AUC values below 0.60 as small, values ranging from 0.60 to 0.70 as moderate, and values above 0.70 as large (for further discussion see Helmus & Babchishin, 2017). As Ellis (2010) explains, however, such benchmarks should not be construed as rigid standards, but used for general guidance.
It is argued that studies of predictive accuracy should conduct analyses using the risk categories and risk scores (Howard, 2017, p. 118). However, the project team had access solely to the risk classifications displayed in Caseworks. Raw risk and domain scores were not available for retrieval, products of Orbis Partners’ proprietary algorithms. That said, Howard (2017) notes the risk categorization, as opposed to risk scores, are particularly pertinent to policy and practice decisions. As Skeem et al. (2013) note, in practice juvenile probation officers rely on the classification to make supervision and case planning decisions (not the score). Nonetheless, this does present a practical dilemma when conducting independent evaluations of some risk assessment instruments. For studies not conducted by Orbis Partners independent researchers have gone so far as to conduct new assessments using their own alternative scoring methods (Scott et al., 2019). To be clear, the use of risk categorizations, as opposed to risk scores, does impact AUC results. Howard (2017, p. 115), for example, reported a drop in AUC values from 0.78 when using ten categories compared to 0.75 for three categories for a simulated study of general reoffending. Raw risk scores are also needed to adjust item weight and classification cutoffs (Georgiou, 2019). That said, only Orbis Partners would have the means to alter this instrument. As such, the current study produces conservative AUC estimates. The primary criticism for relying on risk categorizations to compute AUC values is the concern that cutoffs used for these categorizations may be altered over time (Howard, 2017). This is of little concern to the present research given the instrument has not been modified since its implementation in 2002.
For an in-depth discussion of sampling power specific to the AUC the authors recommend reviewing Obuchowski et al. (2004) work. Obuchowski and colleagues confirmed a balanced ratio of success and failures can produce highly accurate AUC values with each group possessing as few as 10 cases if the outcome is expected to be very strong (0.90). To obtain a statistically significant but weak effect (0.60), however, they recommend a larger sample size of 135 per group (2004, p. 1123). In the current study results are well balanced with a recidivism rate of 53%. To detect a statistically significant “fair” effect of 0.70 Obuchowski et al. (2004) suggest a minimum of 33 cases per group. The present study possesses group sizes of 65 (i.e., non-recidivists) and 74 (recidivists), indicating more than sufficient statistical power. However, the subgroup analysis for females is more suspect given group sizes of 21 and 28, suggesting the sample size is underpowered for detecting statistically significant weak or fair results. Likewise, for African American and Native American youth the group sizes of 5 to 11 and 6 to 20 are unbalanced and insufficient for detecting a statistically significant outcome of any strength. Looking solely at whites, however, the groups (recidivists vs. non-recidivists) are similar and possess sufficient sample size to detect fair or greater results. Amongst this sample the risk of sampling error is highest amongst African American and Native American youth.
Results
Descriptive Analyses
Table 1 displays the rate of recidivism for the sample, broken down further by sex, race, and offense type. The overall three-year recidivism rate was 53.2%, with the most common recidivating event concerning unruly offenses (22.3%). Often referred to as status offenses, unruly offenses concern truancy, tobacco or alcohol possession, running away, and ungovernable behavior. This was followed by drug related offenses (10.8%), property (7.9%), against person offenses (6.5%), public order (4.3%), and traffic violations (1.4%). From our review, drug and alcohol possession was clearly the most prominent basis for a recidivating event. Though the sample size was limited, recidivism was highest for Native Americans at 70%, followed closely by African American youth at 69%. Whites, on the other hand, possessed a recidivism rate of 48%. The recidivism rate was notably higher for females at 57% compared to males at 51%.
Three-Year Recidivism across Sex and Race by Recidivating Offense.
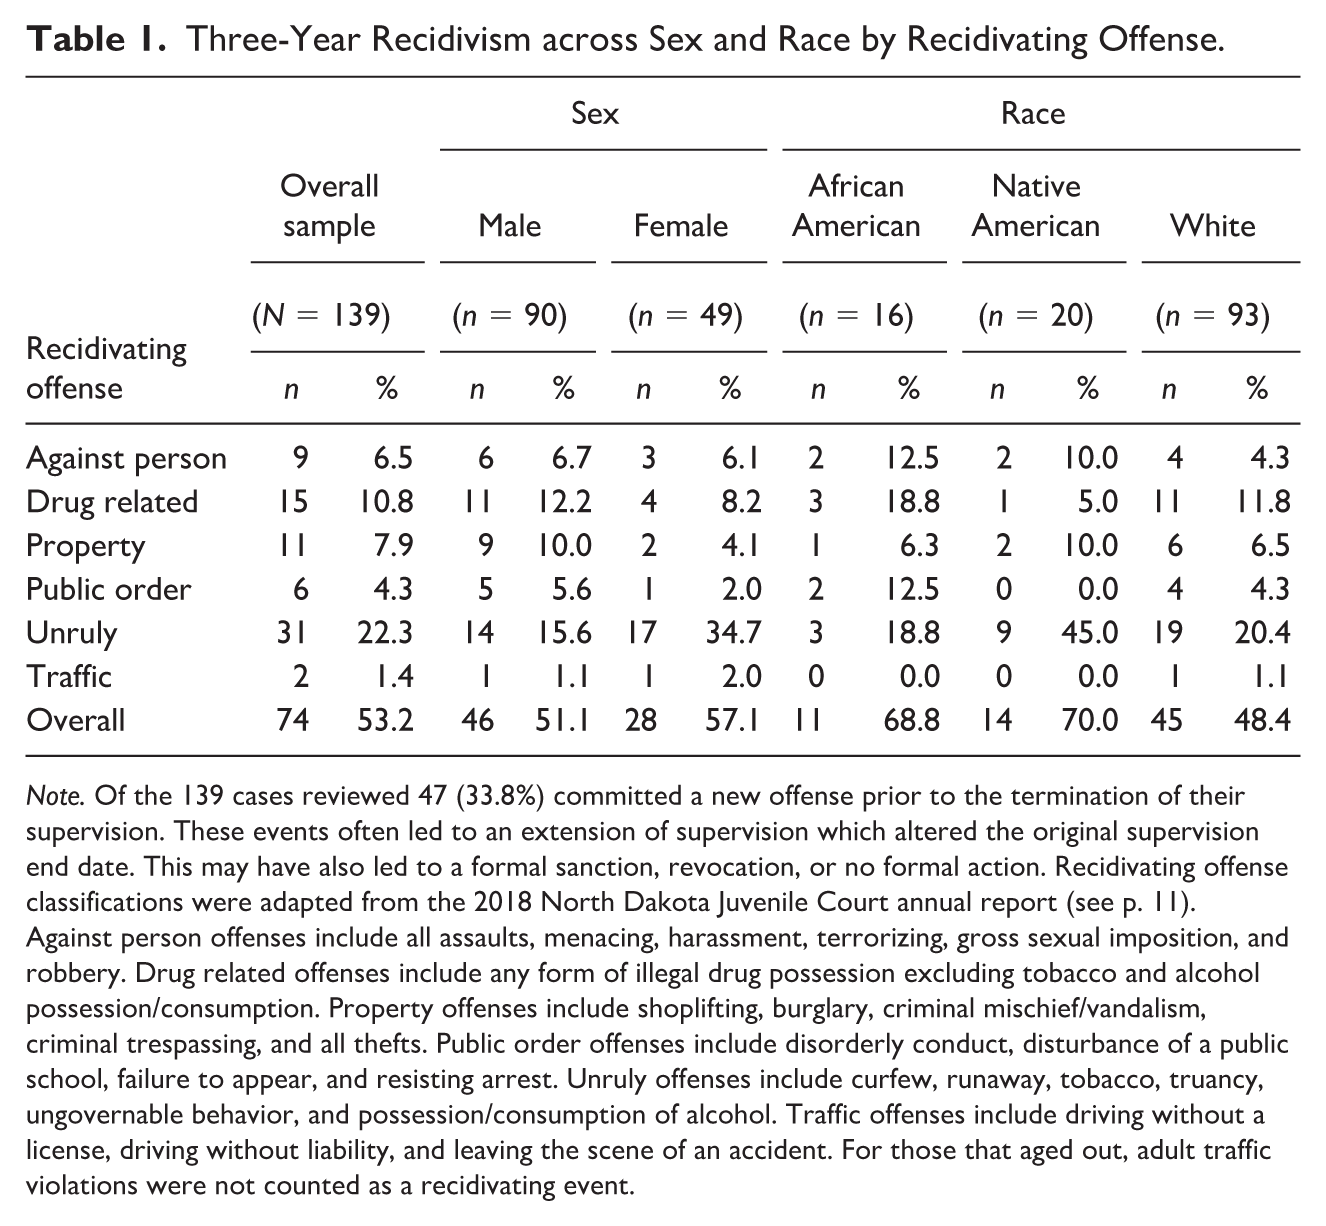
Note. Of the 139 cases reviewed 47 (33.8%) committed a new offense prior to the termination of their supervision. These events often led to an extension of supervision which altered the original supervision end date. This may have also led to a formal sanction, revocation, or no formal action. Recidivating offense classifications were adapted from the 2018 North Dakota Juvenile Court annual report (see p. 11). Against person offenses include all assaults, menacing, harassment, terrorizing, gross sexual imposition, and robbery. Drug related offenses include any form of illegal drug possession excluding tobacco and alcohol possession/consumption. Property offenses include shoplifting, burglary, criminal mischief/vandalism, criminal trespassing, and all thefts. Public order offenses include disorderly conduct, disturbance of a public school, failure to appear, and resisting arrest. Unruly offenses include curfew, runaway, tobacco, truancy, ungovernable behavior, and possession/consumption of alcohol. Traffic offenses include driving without a license, driving without liability, and leaving the scene of an accident. For those that aged out, adult traffic violations were not counted as a recidivating event.
Table 2 further examines recidivism in relation to risk and strength classification while also comparing outcomes by sex and race. Of the 139 cases reviewed there were 66 classified as low risk, 64 as moderate, and 9 as high risk. Of these, 38% of the low risk youth recidivated, followed by 67% of the moderate, and 67% of the high risk youth. Based on Jones et al.’s (2016) expected ranges, the recidivism rates for low and moderate risk youth was higher than expected, suggesting under-classification may be an issue. Nonetheless, the difference in recidivism by risk level was statistically significant with a moderate effect size (χ2[3] = 11.91, p < .01, ϕc = 0.29, 95% CI [0.10, 0.43]). Ellis (2010, p. 41) summarizes Cohen’s effect size benchmarks, noting a phi coefficient (ϕc) of 0.10 is indicative of a small effect, 0.30 a medium effect, and 0.50 a large effect. Notably, the percentage of recidivating low risk males (30%) was considerably less than that of the low risk females (48%). Likewise, the percentage of low risk whites (31%) was considerably less than African American (67%) or Native American (56%) youth. Such variations were less pronounced among the moderate risk youth. The number of youth classified as high risk was inadequate for comparison across groups.
Three-Year Recidivism Rates across Sex and Race by YASI Risk and Strength Classification.
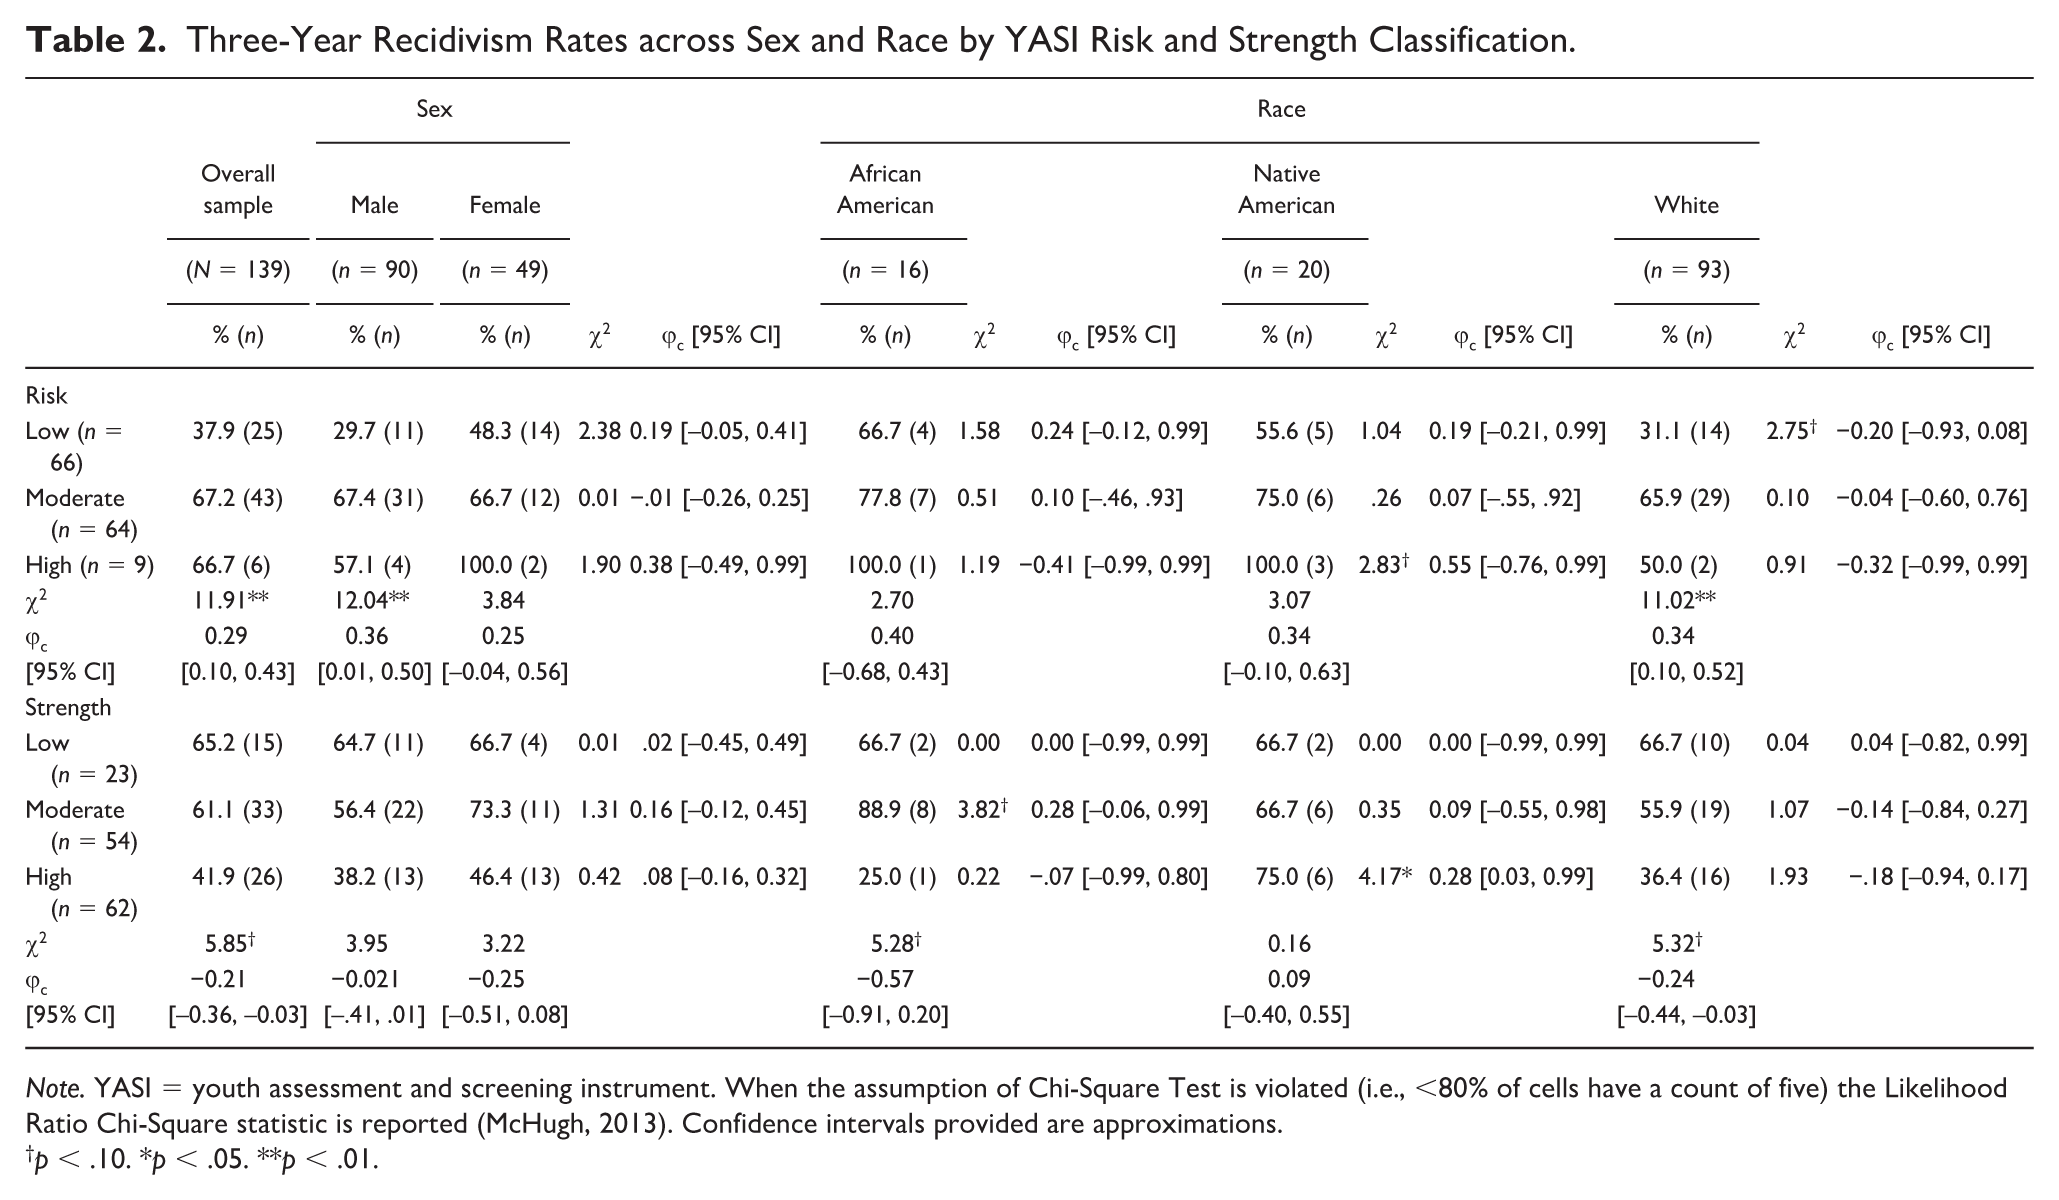
Note. YASI = youth assessment and screening instrument. When the assumption of Chi-Square Test is violated (i.e., <80% of cells have a count of five) the Likelihood Ratio Chi-Square statistic is reported (McHugh, 2013). Confidence intervals provided are approximations.
p < .10. *p < .05. **p < .01.
Though not a focus of this study, protective measure classifications were also examined in relation to recidivism and risk. As reported in Table 2, youth with low protective classifications recidivated at a higher rate (65%) than those classified as possessing moderate (61%) or high (42%) protective measures. However, the difference in recidivism was weak. Figure 1 provides a clearer picture of the interaction between protective measures and risk level. Little-to-no apparent variation exists for low or high risk youth in terms of their respective strength level. However, for moderate risk youth an intuitive pattern emerges whereby those classified as possessing higher levels of protective measures (i.e., strengths) see a reduction in recidivism from 73% (low strength) to 69% (moderate strength) to 54% (high strength).
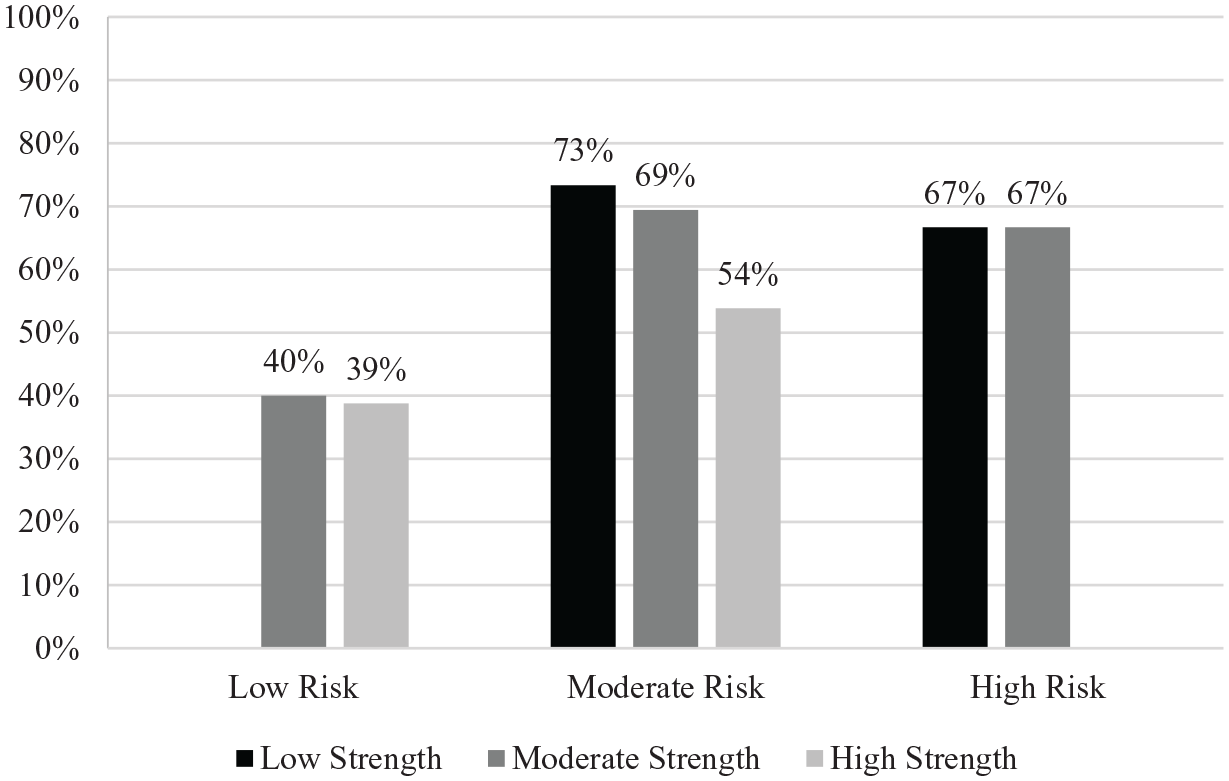
Three-year recidivism by YASI risk and strength classification.
Predictive Validity
Table 3 presents the results of the AUC for the study sample. A statistically significant AUC of 0.66 was observed (p = .002, N = 139), a moderate effect size. The confidence interval ranges from 0.56 to 0.75, giving confidence (95%) that the actual population parameter falls within this range. This range, its width influenced by sample size, indicates the effect size could be anywhere from small to very large for the state population. When broken down further into subgroups it was once again evident that the instrument likely works better for male (AUC = 0.68, p = .003, 95% CI [0.57, 0.80], n = 90) compared to female youth (AUC = 0.63, p = .135, 95% CI [0.47, 0.78], n = 49). The low sample size of African American (AUC = 0.76, p = .113, 95% CI [0.43, 0.99], n = 16) and Native American youth (AUC = 0.73, p = .117, 95% CI [0.48, 0.97], n = 20) prohibits any valid comparison by race, though the instrument performed well for the sample and was statistically significant for whites (AUC = 0.68, p = .004, 95% CI [0.56, 0.78], n = 93). Though not reported in Table 3, the authors also examined the AUC using one- and two-year recidivism follow-up intervals. Overall AUC values dropped from .66 at three-years to .61 at two-years (p = .006, 95% CI [0.53, 0.69], N = 209) and to 0.56 at the one-year interval (p = .090, 95% CI [0.49, 0.63], N = 270). The recidivism rate at one-year was 35.5% and 50.2% at the two-year interval. Further analyses also considered removing unruly/status offenses as recidivating events. However, there was no change to the resulting AUC at the three-year interval, and at most a 0.01, negligible, change at the one- and two- year intervals. Subgroup patterns remained similar regardless of the follow-up period observed.
Predictive Accuracy of YASI at Three-Year Recidivism.
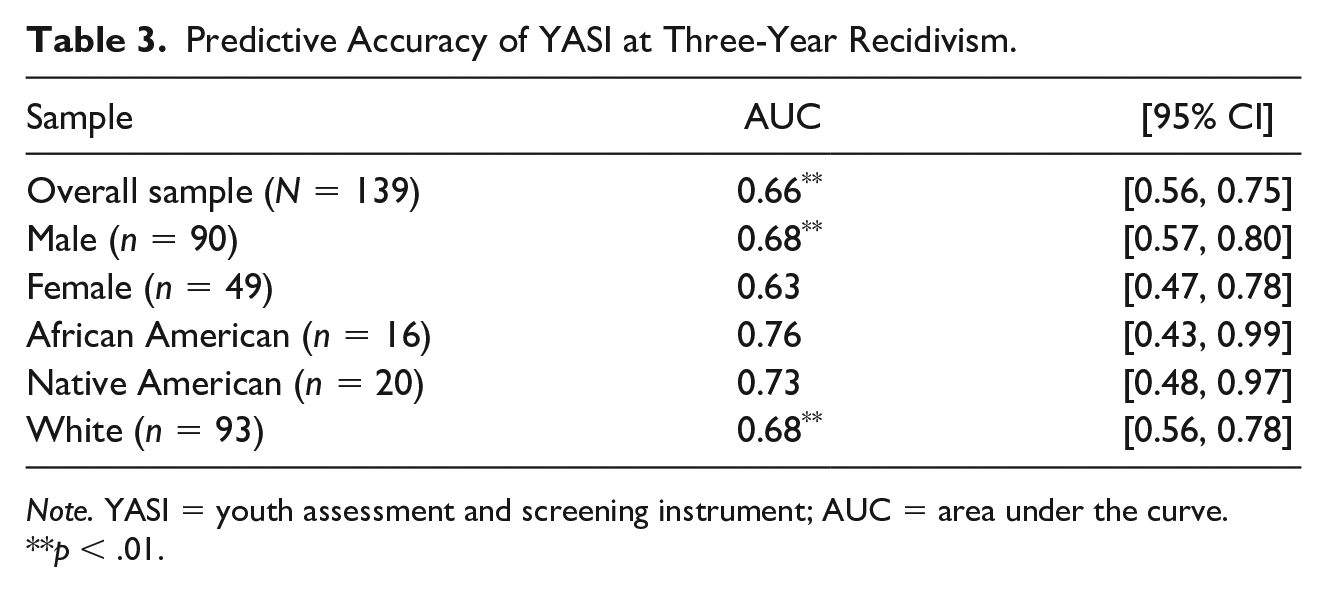
Note. YASI = youth assessment and screening instrument; AUC = area under the curve.
p < .01.
Discussion
Though there is plethora of research and discussion concerning risk assessment, the number of validation studies is limited (Schwalbe, 2007). For some instruments, such as the YASI, the number of studies can be counted on one hand (Jones et al., 2016; Orbis Partners, 2007; Scott et al., 2019; Skeem et al., 2013). Others, such as the YLS, have received much greater empirical attention (Schwalbe, 2007). This study provides new evidence of the YASI instrument’s performance specific to North Dakota probation, previously unaltered and untested since its 2002 implementation. This evidence, however, is notably weaker for general reoffending compared to the Canadian sample examined by Jones et al. (2016) which reported a large and statistically significant effect. That said, other validation studies of YASI within the US have tended to produce outcomes similar to the results presented here, specifically studies conducted in New York and Virginia with AUC values of 0.65 and 0.68 (Baird et al., 2013; Orbis Partners, 2007). Even Scott et al. (2019) more recent research with a Canadian sample and Skeem et al. (2013) research on the adapted CA-YASI provide similar outcomes with each reporting an overall AUC value of 0.65 for general reoffending. Note, as discussed previously, the definition of recidivism varies across studies making direct comparisons suspect. Nonetheless, a clear trend is apparent from the extant literature, YASI possesses a moderate level of predictive accuracy. This level of accuracy also appears to hold true across states and Canadian provinces, while Jones et al. (2016) results stand out as a potential outlier.
Another emerging pattern from the literature and reflected here is the YASI’s predictive accuracy specific to females. The effect size associated with females is notably weaker than that produced for males. This pattern is consistent across multiple studies (Jones et al., 2016; Orbis Partners, 2007; Scott et al., 2019). While the predictive accuracy for males is clearly of a moderate or greater magnitude, for females it often maintains a weak effect (Hamilton et al., 2019; Rice & Harris, 2005). Though Orbis Partners contends YASI is a gender-neutral tool, Jones et al. (2016) indicate efforts are underway to develop a YASI-Girls (a.k.a., YASI-G) instrument that will include measures specific to relationships, emotional expression, self-efficacy, sexual vulnerability, and early parenthood. (Shepherd et al., 2013). However, female-specific instruments have received little empirical evaluation and none to the authors’ knowledge have been subsequently validated (Shepherd et al., 2013). Indeed, there appears to be an ongoing debate about the inclusion of gender-responsive factors in risk assessment instruments and their potential value in improving predictive accuracy for this population (for further discussion see Van Voorhis et al., 2010). At this time the authors suggest agencies be cautious of risk assessment as currently applied to females. This issue is not unique to YASI but has been documented as a common problem across instruments (Shepherd et al, 2013).
In addition to females, there remains a question of risk assessments’ predictive validity when applied to different racial and ethnic groups (Singh et al., 2011; Skeem et al., 2004; Snowden et al., 2010). However, for YASI specifically results have been similar across groups to whites for Aboriginals in Canada (Jones et al., 2016), as well as African American and Hispanic youth in New York (Orbis Partners, 2007). Unfortunately, the current study fails to contribute meaningfully to this empirical discourse. While the authors’ results indicate high predictive accuracy among this sample of African American and Native American youth, the power of the analyses were insufficient to produce statistically significant outcomes (Obuchowski et al., 2004). Research specific to special populations, including female youth, is still needed (for more on the complicated use of risk assessment with these special populations see Monahan et al., 2017; Shepherd et al., 2013; Skeem et al., 2016; Skeem & Lowenkamp, 2016; Snowden et al., 2010).
Limitations
This study represents an initial exploratory examination of North Dakota Juvenile Court’s risk assessment instrument. Currently, the state’s CMS is incapable of producing any form of automated data extraction for research purposes (to-date the court has yet to produce a statewide recidivism rate). The workload required for manual data collection was significant and naturally constrained the scope of the project, which subsequently influenced statistical power (Obuchowski et al., 2004). Though the sample size is adequate for examining overall outcomes for general reoffending, it is problematic when attempting to breakdown the data further for special populations or by offense type. Despite this limitation, this work contributes to the existing literature on the predictive accuracy of YASI by adding the results of yet another state, North Dakota. The consistency of results across states and localities provides some evidence of the robustness of the instrument in its application across a variety of settings, though the present results are insufficient for generalizing to juvenile probation populations more broadly.
Finally, the current study did not assess interrater reliability, construct validity, scoring accuracy, internal consistency, or the predictive validity of individual domains. These concerns have been well documented in the literature (Jones et al., 2016; Kennealy et al., 2017; Scott et al., 2019; Skeem et al., 2013, 2017). The authors are actively seeking funding support to broaden their research and further examine the instrument’s applicability to specialized populations within the state, the instrument’s validity and reliability, as well as measures pertinent to implementation fidelity (Vincent et al., 2016).
Conclusion
Future systematic reviews and meta-analyses will benefit from the inclusion of as many states and geographic regions as possible from a variety of investigators (Cooper, 2016; Schwalbe, 2007). As Scott et al. (2019) observed, a large proportion of YASI validation studies come from the tool developer. The risk of publication bias or “cherry-picking” samples for publication is high when tool examination is limited to a small number of scholars, especially when those scholars have a financial stake in its outcome (Taxman & Belenko, 2012). However, when the results converge across a myriad of investigators and jurisdictions greater confidence in the tool can be generated. The current study contributes to the existing literature and adds some confidence that the tool can be effective when used in a predominantly rural state.
As this study illustrates, while more nuanced analyses may not be feasible in low population jurisdictions, general tool performance can be monitored using the AUC statistic with very modest sample sizes and a small number of variables (Obuchowski et al., 2004). At a minimum, probation agencies can and should be monitoring their risk assessment’s overall performance (Schwalbe, 2007).
Note, in this particular state, it was observed that recidivism rates exceeded their expected range for those classified as low or moderate risk in this sample, raising concerns of under-classification. Indeed, implementation fidelity is known to impact tool effectiveness (Latessa et al., 2015; Taxman & Belenko, 2012). At the time the study was being conducted the state had already begun making changes to their risk assessment practices, suspecting inconsistencies across JCOs and poor scoring accuracy, though no formal research had been conducted. Kennealy et al. (2017) study, for example, reported 41% of staff scored the instrument poorly. In an attempt to improve risk assessment implementation, the North Dakota Juvenile Court purchased web-based booster trainings from Orbis Partners and consolidated the duty of risk assessment to a single JCO in each judicial district. These changes in practice were too recent to be reflected in the current study, allowing for these results to serve as a benchmark for comparison in future, more robust, replications. As stressed by Schwalbe (2007), periodic revalidations are necessary to monitor tool performance over time. Pertinent to tool performance, scoring accuracy and interrater reliability must also be assessed to gauge implementation fidelity (for further guidance on tool implementation and monitoring see Latessa et al., 2015; Taxman & Belenko, 2012).
Footnotes
Authors’ Note
Early analyses associated with this project were presented at the 2019 Academy of Criminal Justice Sciences (ACJS) annual meeting Research and Pictorial Showcase (Poster). In addition, an unpublished report was prepared for the North Dakota Juvenile Court and archived on the University of North Dakota library repository.
Declaration of Conflicting Interests
The author(s) declared no potential conflicts of interest with respect to the research, authorship, and/or publication of this article.
Funding
The author(s) disclosed receipt of the following financial support for the research, authorship, and/or publication of this article: The research associated with this article was funded by an Early Career Award from the University of North Dakota, Office of the Vice President for Research and Economic Development.
The research protocol associated with this publication was reviewed and approved by the University of North Dakota Institutional Review Board (IRB-201802-215).