
Abstract
This study examined the temporal variations in calls for service before, during, and after the COVID-19 pandemic lockdown in China using a sample of 37,124 police service calls made from January 1, 2019, to December 31, 2020 to a 110 command center in a county-level city in Hubei Province. There was a significant temporal effect, and the calls for service peaked between 08:00 and 19:59 throughout the entire period. The busiest hours of the day for calls for police service were between 12:00 and 19:59, and the calls peaked between 12:00 and 15:59 during the lockdown. The distribution of calls by weekday showed no significant pattern, with the exception of traffic-related calls. The results are discussed from the perspective of routine activity theory.
Introduction
A total of 251,788,329 COVID-19 cases have been confirmed globally since COVID-19 was identified in late 2019, including 5,077,907 deaths as of November 12, 2021 (World Health Organization, 2021). The coronavirus pandemic has not only given rise to major human, social, and economic crises, but it has also challenged the responses to said crises. It has disturbed the daily operations of organizations and routine tasks, particularly for frontline officers (Zhang & Wang, 2021). For example, a survey showed that the pandemic has greatly affected the internal and external operations of Illinois police departments, with 94% of the respondents reporting the establishment of many new safety measures, such as the distribution of personal protective equipment and the frequent sanitization of squad cars and cleaning of police stations (Ekici & Alexander, 2020). The survey also found that 82% of police agencies suspended their police academies and in-service training activities. Police have had to make changes and implement processes to allow frontline officers to provide the services that citizens deserve (Mehdizadeh & Kamkar, 2020). In this context, determining how to deploy police resources has important implications for responding to people’s calls for help in crises such as the COVID-19 pandemic.
In many countries, dialing emergency telephone numbers, such as 000, 111, 911, or 999, connects callers to their local emergency services. In China, the number is 110. Service calls to 110 have increased the efficiency of crime fighting and improved responsiveness to public service calls (Wong, 2002) since the number was popularized in the 1980s. Various slogans were introduced to promote the phone number’s use, such as “If you call the police quickly, the suspect cannot escape” (zhiyao baojingzao, xianfan taobuliao). Beyond crime fighting, 110 service calls have played a critical role in providing services during the COVID-19 pandemic in China. For example, on February 8, 2020, police officers in Huma County, Heilongjiang Province, received an emergency call (Administrative Division, 2020) from someone who said his father was experiencing a medical emergency. Due to traffic restrictions during the pandemic, the caller needed the police’s help to take his father to the county hospital. Unfortunately, service calls have received little attention in China (e.g., Chen et al., 2021; Dai et al., 2021), and only a few descriptive studies have been performed (e.g., Cheng et al., 2020; Wei, 2020).
Most research on service calls has focused on Western contexts (e.g., Ammar et al., 2005; Antunes & Scott, 1981; Barthe & Stitt, 2009; Bonomi et al., 2006; Boulton et al., 2017; Cihan et al., 2012; Glazener et al., 2020; Hirschel et al., 1994; Hodgkinson & Andresen, 2019; Oths & Robertson, 2007; Shore & Lavoie, 2019; Towers et al., 2018). Only a very small body of work has examined exceptional events, such as natural disasters (LeBeau, 2002) and pandemics (Ashby, 2020, 2021; Hodgkinson & Andresen, 2020; Ivandić et al., 2020; Lersch, 2020; Mohler et al., 2020), or planned events, such as the Olympics (Decker et al., 2007). However, such studies have often only discussed certain types of calls, such as those related to crime (Hodgkinson & Andresen, 2020; Mohler et al., 2020) and mental health issues (Lersch, 2020). More importantly, these studies have mainly focused on changes in the quantity of police service calls. In addition, only a few studies (e.g., LeBeau, 2002; Vaughan et al., 2018, 2019) have investigated the temporal patterns of calls. In short, research on temporal variables of the COVID-19 pandemic has been scant.
Investigating the temporal variations in police service calls caused by the COVID-19 pandemic has both theoretical and practical implications. According to routine activity theory, crime occurs when motivated offenders and suitable targets are aggregated in the same time and space and capable guardians are absent (Cohen & Felson, 1979). Natural disasters and the policies for coping with them can cause the physical environments or behavior patterns of both offenders and targets to shift (Decker et al., 2007). Consequently, this can alter the temporal patterns of criminal events. However, very little research has addressed temporal variations during the COVID-19 pandemic. In particular, Chinese authorities have enforced strict quarantine measures to curb the spread of the virus, such as lockdowns, which has made it difficult for scholars to investigate the temporal patterns in police service calls in China. Practically, investigating the temporal patterns of such calls can also provide empirical evidence that can help police reallocate their resources to cope with the changes in these patterns as policies for curbing the spread of COVID-19 (e.g., lockdown and quarantine) are implemented or lifted.
Thus, we examined the effect of the lockdown on temporal variations in police service calls during the COVID-19 pandemic using service call data from a 110 command center in a county-level city in Hubei Province. More specifically, we investigated the differences in the temporal patterns before, during, and after the lockdown in China.
Literature Review
Theoretical Foundation
Cohen and Felson (1979) proposed routine activity theory as a new perspective from which to understand how crime occurs. According to the theory, crime is the result of three factors: motivated offenders, suitable targets, and lack of guardianship. Crime is not likely to occur when one of these three factors is missing. Cohen and Felson (1979) argued that structural change in routine activity can explain crime rates by affecting the convergence of the three elements in space and time. Thus, crime is a function of major changes in the basic structure of society (Felson, 2008). Scholars (Andresen & Malleson, 2015; Ashby & Bowers, 2013; Ratcliffe, 2002) have pointed out that the temporal analysis of criminal events lags behind the spatial analysis of criminal events. This does not mean that the temporal dimension is not important. On the contrary, “the explanatory power of the theory depends on routine activities exhibiting a clear temporal sequence and order” (Yar, 2005, p. 418). Therefore, it is important to understand the temporal dimension of criminal events.
Temporal patterns have been investigated in different contexts based on routine activity theory. For example, using police records data from January 1, 2006, to December 31, 2009, in Stockholm, Sweden, Uittenbogaard and Ceccato (2012) assessed the geographical clustering of offenses over time. They achieved this by investigating the concentration of violent and property offenses across three elements of time: time of day, time of week, and season. They observed distinct concentration patterns in violent and property crimes based on time. Violent crimes in the city center were concentrated during the winter months, whereas the city center was a hot spot for property crimes during the summer months. Next, Ceccato and Uittenbogaard (2014) collected data from the Stockholm Public Transport database, including 62,265 crime events reported to the central alarm service from 2006 to 2009. They found that crimes tended to happen more often in the evening, at night, on weekends, and on holidays. They also found evidence of seasonal variations in crime. The most crimes against people were committed in the winter, presumably the result of people being more likely to take public transportation and of low temperatures forcing them to be indoors at the stations during this season.
Furthermore, de Melo et al. (2018) investigated temporal variations in crime in Campinas, Brazil, using data from 2010 to 2013. They found that crime exhibited temporal patterns in the Latin American context. For example, burglaries were most concentrated during the weekdays, probably because offenders attempt to commit this type of crime when homes are empty and thus lack capable guardians. Andresen and Malleson’s (2015) study supported this finding. They found that criminal events were more common during the week than on the weekend, with burglary, including residential and commercial burglary, showing the same pattern.
Overall, the studies described above indicate that routine activity theory is useful for understanding the temporal dimension of criminal events. Given the sudden outbreak of the COVID-19 pandemic and its significant effects on people’s routine activities, we expected to observe temporal variations in criminal events in our data. We also observed changes in temporal patterns in non-Western contexts.
Temporal Variations in Police Service Calls
Police functions include fighting crime, maintaining order, and providing services. Police service calls constitute an important medium for police to achieve these functions for citizens. People who place calls for help are connected to the police, who respond to emergencies, such as assaults, disputes, domestic violence, and traffic accidents. As Ashby (2021) pointed out, understanding service calls is essential for understanding police work. Using service call data, researchers have investigated the temporal patterns of various types of calls (e.g., Bickis et al., 1995; Clare et al., 2019; Cohn, 1996; Cohn & Rotton, 2003; Holcomb & Radke-Sharpe, 2006; Jasso et al., 2007; LeBeau & Corcoran, 1990; LeBeau & Coulson, 1996; Marco et al., 2017; Møller et al., 2015; Noble, 1996; Rotton & Cohn, 2004; Seguí et al., 2019; Sheldon & Prunckun, 2017; Vaughan et al., 2018, 2019; Wang et al., 2015), estimated the mediation effect of calls to the police for services (Charkoudian, 2005), examined police response times (Lee et al., 2017), and compared citizens’ demand for police services (Johnson & Rhodes, 2009).
Research on calls has mainly focused on property crimes (e.g., Cohn & Rotton, 2000; Tompson & Bowers, 2013) and has produced mixed results. For example, using calls-for-service data from the Minneapolis Police Department during 1985, 1987, and 1988, Cohn (1996) suggested that the most effective variables in predicting service calls appeared to be temporal variables, such as the presence or absence of light, the time of day, the day of the week, and the first day of the month. The findings showed that criminal behavior was more prevalent after dark, on weekends, and during the spring and summer months. Based on this data set, Cohn and Rotton (2000) focused on calls for service related to burglary, robbery, and theft. They found that both time of day and day of the week predicted thefts, burglaries, and robberies. For example, robberies decreased on Sundays after peaking during the late evening hours (i.e., from 21:00 to 03:00) on Saturdays. Similarly, based on the study of two areas in the U.K., Tompson and Bowers (2013) showed that dark environmental conditions were significantly associated with an increase in the expected number of street robberies. However, taking advantage of data from the Dutch National Crime Intelligence Service, Van Koppen and Jansen (1999) showed that Friday was the most popular day for robberies, but the peak number of robberies varied across types of target, peaking at the times when the most money could be expected. For example, banks were robbed right after opening at 09:00.
A few studies have identified the temporal patterns of violent crime (e.g., Cusimano et al., 2010; Nelson et al., 2001; Van Koppen & Jansen, 1999), suggesting that “the convergence of perpetrators and victims occurred during evening hours” (Rotton & Cohn, 2004, p. 295). For example, after collecting 12 months of data from the city centers of Cardiff and Worcester, Nelson et al. (2001) revealed a similar pattern of violent crime, showing that incidents occurred primarily on Fridays and Saturdays. Violent crime peaked between 23:00 and 03:00, which was “associated with youthful visitors” (p. 271). Cusimano et al. (2010) studied 4,587 ambulance dispatches and 10,693 emergency room admissions for violent injury occurrences among adults during 2002 and 2004 in Toronto, Canada. The findings demonstrated a temporal pattern, with violence-related injuries peaking at night and bottoming out in the morning, followed by a slow increase during the afternoon. More specifically, the two highest hourly counts for assault injury dispatches occurred between 22:00 and 22:59 and between 02:00 and 02:59. The periods between 20:00 and 03:59 accounted for more than half of all assault-related injury calls.
Domestic violence/disputes have also been investigated (e.g., Cohn, 1993; Koutaniemi & Einiö, 2021; LeBeau, 1994) and have presented some similar temporal patterns. For example, in an early study, Cohn (1993) used data from 1985, 1987, and 1988 in Minneapolis, Minnesota, to examine the associations between weather and temporal variables and rape and domestic violence calls to the police. The findings indicated that the factors associated with domestic violence and rape were different. Domestic violence was more likely to be affected by immediate temporal and weather variables. More specifically, assaults occurred more frequently during clement weather, but rape calls were not affected by the same variables. A possible explanation for rape events is that “the plan is well thought out” (Cohn, 1993, p. 80). Using data on domestic dispute calls in 1986 from a police department in Charlotte, North Carolina, LeBeau (1994) discussed how police calls for domestic disputes oscillated between the perspectives of obligatory and discretionary activities. The results showed that the days of the week primarily allocated to discretionary activities—Friday, Saturday, and Sunday—exhibited the highest mean levels of domestic disputes. Meanwhile, by hour, the rhythm of domestic disputes “reached its highest at 22:00” (p. 153). Similarly, to investigate temporal patterns of day of the week and hour of the day, Vaughan et al. (2018) used 20,000 calls related to intimate partner/domestic abuse and 20,000 mental health–related police service calls. They found that police service calls related to intimate partner/domestic abuse peaked between 21:00 and midnight. They also found that Saturday and Sunday were the lowest volume days for mental health–related police service calls and that the peak time occurred between 13:00 and 22:00. In another study, Vaughan et al. (2019) also showed that mental health–related police service calls demonstrated a distinct temporal pattern for the time of day, with a peak between 15:00 and 18:00.
Despite the aforementioned empirical research investigating the temporal variables of various calls, research on exceptional events has been relatively limited. For example, LeBeau (2002) indicated that the nature of the calls places more emphasis on order maintenance and service functions, after examining how a natural disaster—Hurricane Hugo—altered routine activities from September 22 to October 2, 1989, in Charlotte, North Carolina. LeBeau (2002) also found that calls for service abruptly increased when Hurricane Hugo arrived and remained high for over a week. However, with the outbreak of the COVID-19 pandemic, temporal patterns of police service calls have remained underexplored, especially in China, where heavy lockdown measures have been enforced. Within the context of exceptional events, we may expect to find different temporal trends before, during, and after the lockdown. Thus, this study explored the temporal variation in calls for service at the weekly and hourly levels during the COVID-19 pandemic.
Data and Methods
The data were taken from a 110 command center of a county-level city in Hubei Province, China. The command center has five police officers. When they receive calls, police officers request basic information. Then, based on the event type, they dispatch officers from a specific police station within the jurisdiction of the call. For example, traffic incidents are assigned to traffic police. When the incident concerns theft, the police officer at the 110 command center will identify the area. If it occurs in the countryside, the officer will assign the frontline officer at the local police station to the scene; if it happens in the city, the officer will check the value of the theft. The officer will distribute the call to the criminal police when the amount exceeds about $300; otherwise, the incident will be allotted to the frontline officer at the police station within the jurisdiction.
The dataset consisted of information related to the date and time of occurrence and the type of calls for service made from January 1, 2019, to December 31, 2020. After deleting duplicate records, 37,124 calls for service remained.
The researchers categorized the calls into seven types: violent crime, property crime, public order crime, traffic, domestic violence, disputes, and other. First, we divided crimes into three types of calls: violent crime (e.g., homicide, rape, robbery, and assault), property crime (e.g., theft, burglary, fraud, embezzlement, and tax evasion), and public order crime. Public order crimes include a number of activities that are illegal because they offend public morality (Hagan & Daigle, 2019). Such nonpredatory crimes include prostitution, substance abuse, gambling offenses, and disorderly conduct. Second, traffic-related calls were also examined because traffic law enforcement is regarded as an important police function (Dempsey & Forst, 2014). Such calls included traffic accidents, traffic jams, traffic disputes, and traffic violations (e.g., drunk driving or driving without a license). Third, domestic violence was used as a category due to the surge in domestic violence during the pandemic (Dai et al., 2021; Zhang, 2020). Most of the domestic violence calls were made by wives who were being abused by their husbands. Fourth, common disputes are also very widespread in China (Dai, 2017; Zhang, 2021). Such disputes usually involve family relations, economic problems, employer–employee relations, neighborhood relations, emotional issues, and doctor–patient relations. The final category, other calls, included calls that could not be categorized into the six aforementioned categories. These included calls for help relating to lost children, the elderly, and mentally ill people, as well as suicides, drownings, becoming trapped in an elevator, and falling from a building, among others.
The city’s actual lockdown occurred between Friday, January 24, 2020, and Wednesday, March 18, 2020. However, because a typical week starts on Monday and ends on Sunday, in our analysis, we redefined the lockdown period as being between Monday, January 26, 2020, and Monday, March 16, 2020.
To capture the change in service calls before, during, and after the lockdown, we adopted a sequence of analytical approaches. First, line figures of the weekly calls were plotted against time to show the trends in different call categories, especially before, during, and after the lockdown. Then, the distributions of the calls by time of day and weekday were also plotted using area plots to further show whether and how COVID-19 influenced the temporal patterns of each call category. One-way analysis of variance (F-tests) was then conducted to determine whether the differences were of statistical significance.
Results
Figure 1 displays the temporal changes in weekly calls for different categories. The overall number of calls decreased dramatically during the COVID-19 lockdown but quickly returned to its original level after the lockdown was lifted. Three types of crimes (i.e., violent, property, and public order) demonstrated two distinct patterns during the lockdown: violent crime and property crime decreased during the lockdown, whereas public order crime increased. Notably, despite violent crime and property crime returning to their original levels after the lockdown, the return rate for property crime was much slower than that of violent crime. This implies that restoring criminal opportunities may be harder for property crime than for violent crime.
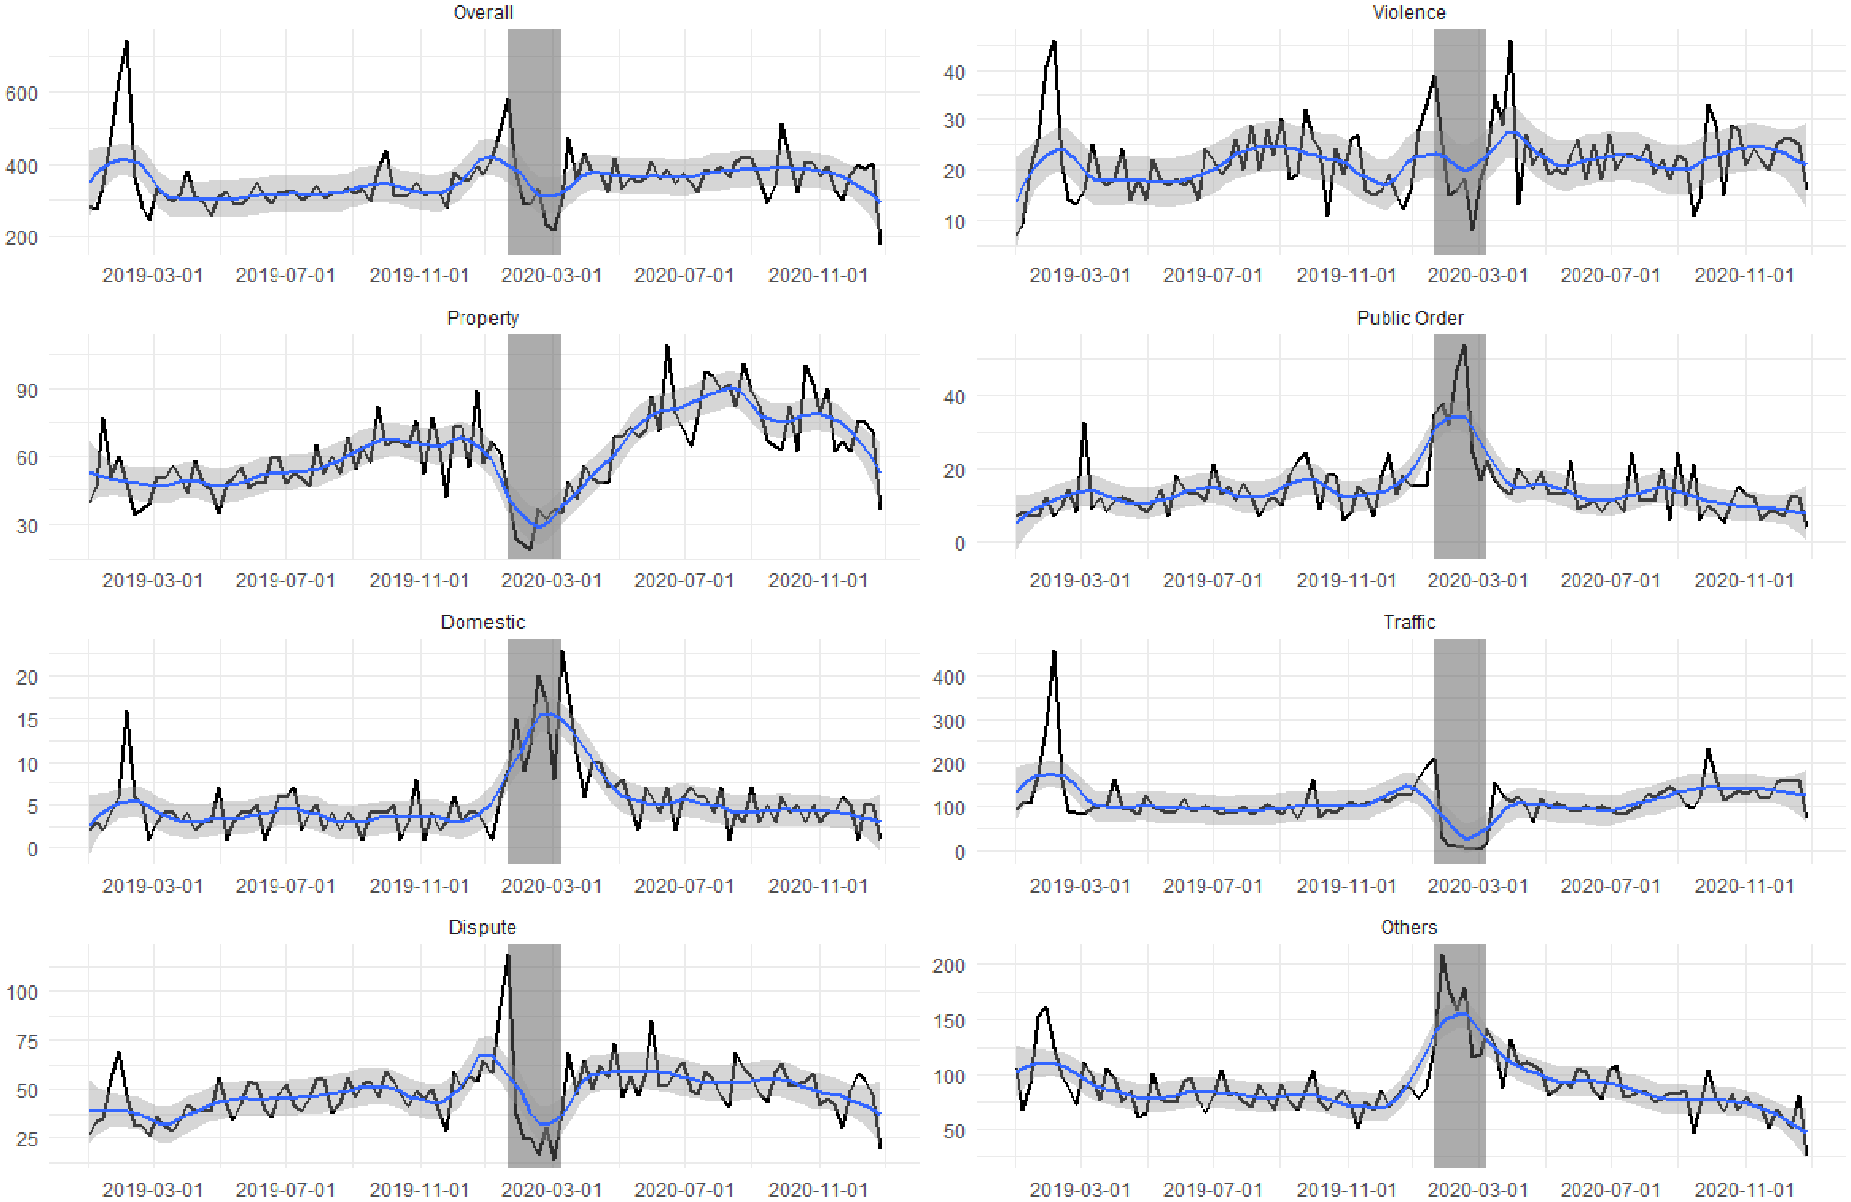
Change of weekly calls by type.
Domestic violence also increased significantly during the lockdown, but dispute cases decreased. In addition, perhaps due to the strict transportation controls, traffic-related calls almost disappeared during the lockdown, but after the lockdown, traffic-related calls almost recovered. Finally, other calls showed an increasing pattern during the lockdown.
Figure 2 shows the distributions of calls by hour. According to the upper-left plot of Figure 2, the overall distribution of calls by time remained relatively stable against time, and the COVID-19 lockdown seemed to delay the times of calls slightly. For instance, calls in the early morning (i.e., from 00:00 to 07:59) almost vanished during the lockdown, and calls in the morning (i.e., from 08:00 to 11:59) also decreased, but there was an increase in the percentage of calls in the afternoon (i.e., from 12:00 to 15:59).
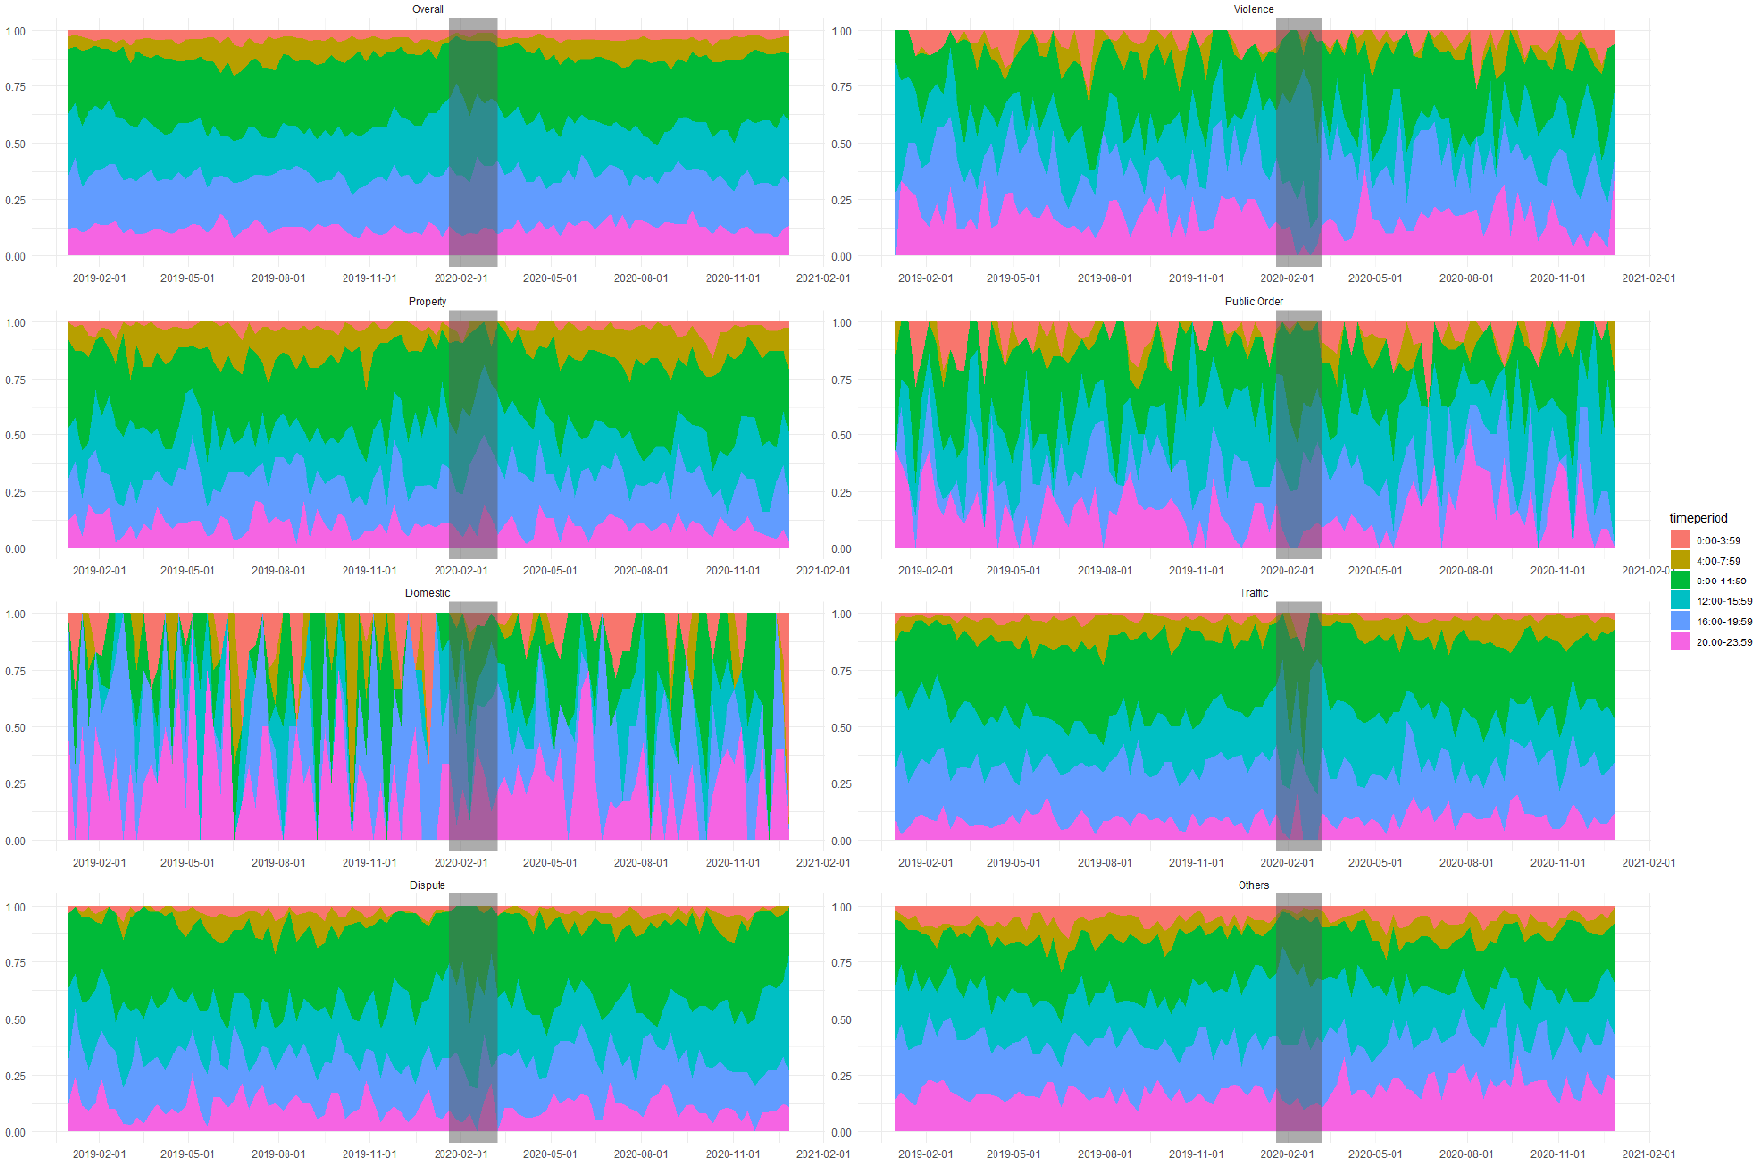
Change of weekly calls by day times.
As for the three different types of crime, the patterns could not be observed explicitly from the figures. However, the figures do suggest that for violent crime, the percentage of calls occurring in the early afternoon (i.e., from 12:00 to 15:59) increased during the COVID-19 lockdown, whereas the percentage of calls occurring late at night (i.e., from 20:00 to 23:59) decreased. As for property crime, the percentage of calls occurring in the late afternoon (i.e., from 16:00 to 19:59) increased during the COVID-19 lockdown, whereas the percentage of calls occurring in the morning (i.e., from 08:00 to 11:59) decreased. Finally, the percentage of calls for public order crime made in the morning (i.e., from 08:00 to 11:59) increased.
Domestic violence showed almost no temporal patterns because calls related to domestic violence can happen at any time of the day, whenever it is convenient for the victim to report the crime. Despite not being very explicit, traffic-related calls occurring in the morning (i.e., from 08:00 to 11:59) increased dramatically during the COVID-19 lockdown. Given that the number of traffic-related calls decreased during the lockdown, the change could largely be due to fluctuations in the sample size. A similar pattern could be observed for dispute-related calls, which suggested a sudden increase in calls occurring in the morning (i.e., from 08:00 to 11:59) and a significant decrease in calls made in the early morning (i.e., from 00:00 to 03:59). Finally, for the other category, early-morning calls decreased during the lockdown.
Figure 3 plots the distribution of calls according to the day of the week. Unfortunately, no significantly patterns could be observed for each type of call; the distributions of calls by day of the week showed no clear patterns before or after the COVID-19 lockdown. The only significant change occurred among the traffic-related calls, with a sudden increase on Sundays. Considering the lockdown ended on a Wednesday, the sudden change in calls may be largely attributable to the cases that occurred on the first weekend after the lockdown was lifted.
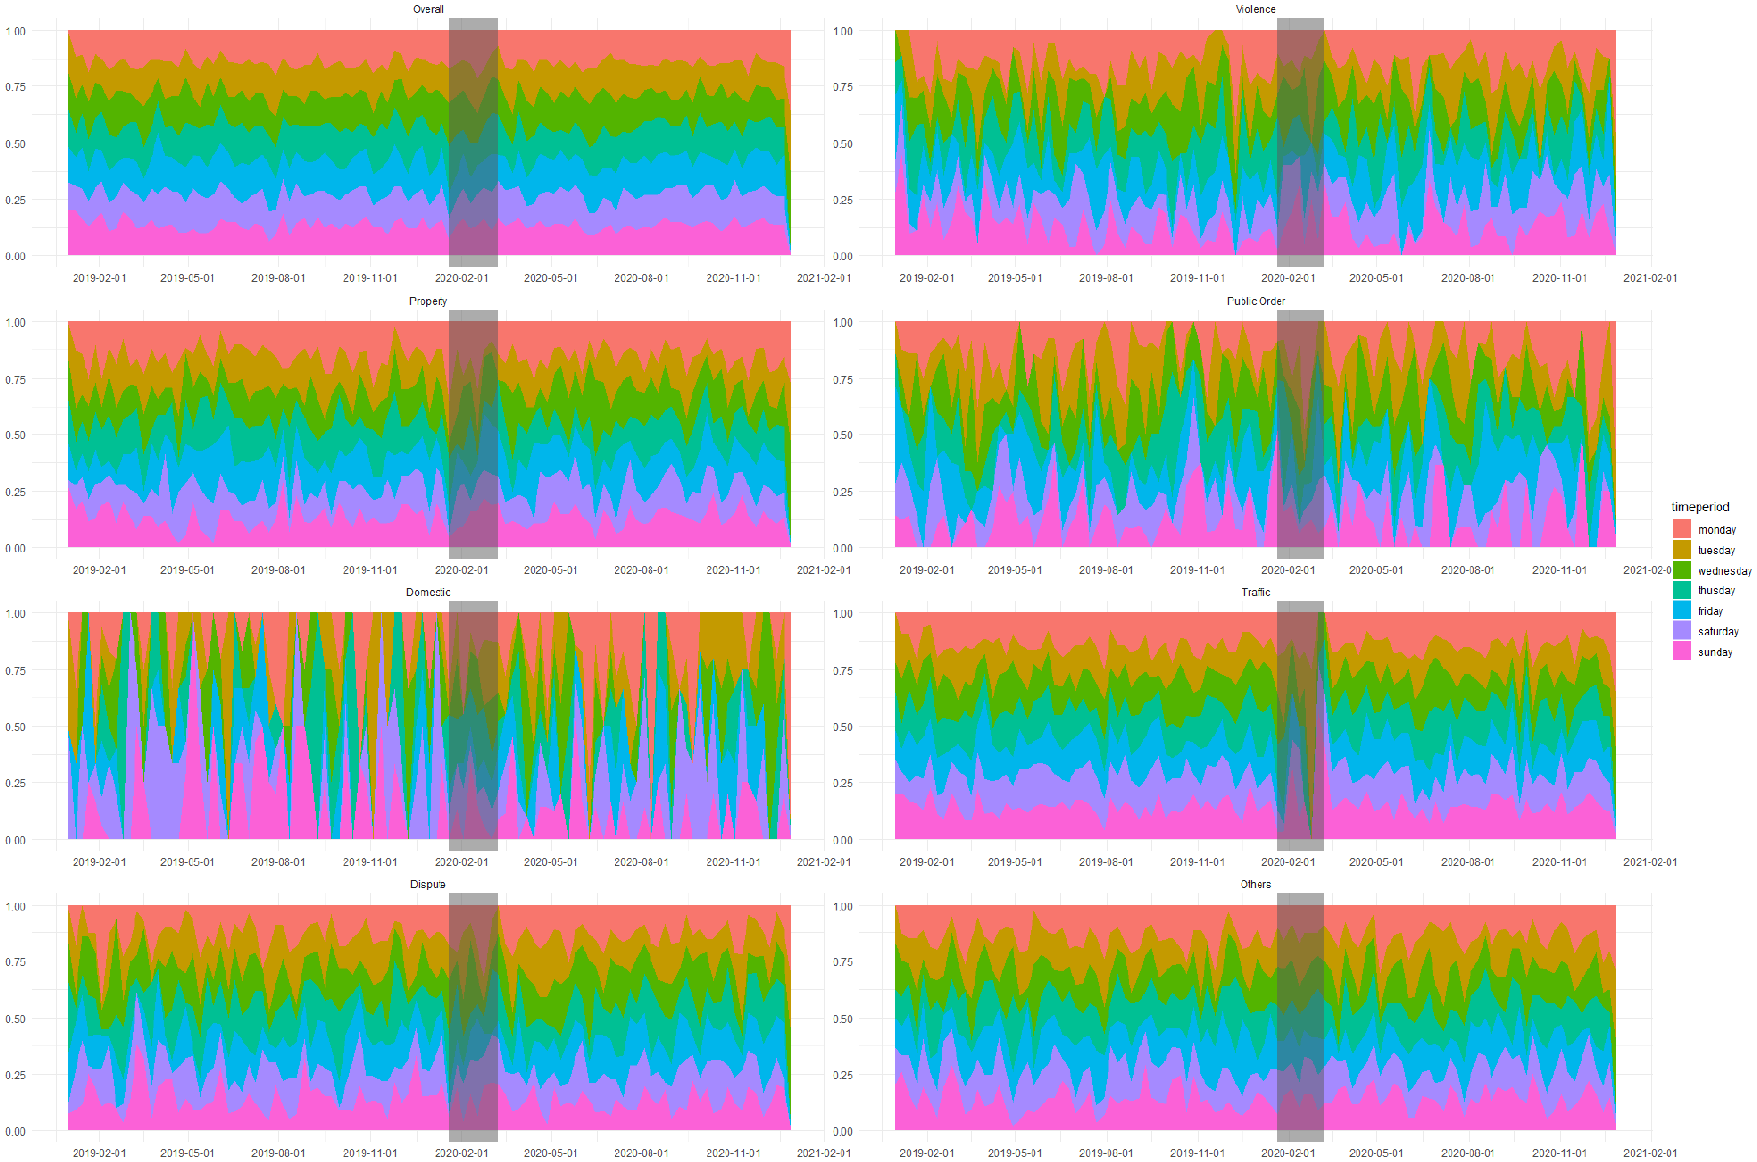
Change of weekly calls by weekdays.
Figures 2 and 3 show the changes in call patterns by time and day of the week. However, the changes cannot be evaluated directly without statistical procedures. Tables 1 and 2 show the results of the F-tests comparing the average number of weekly calls for each type of call during each hourly and daily time period.
Difference of Weekly Calls by Day Time.
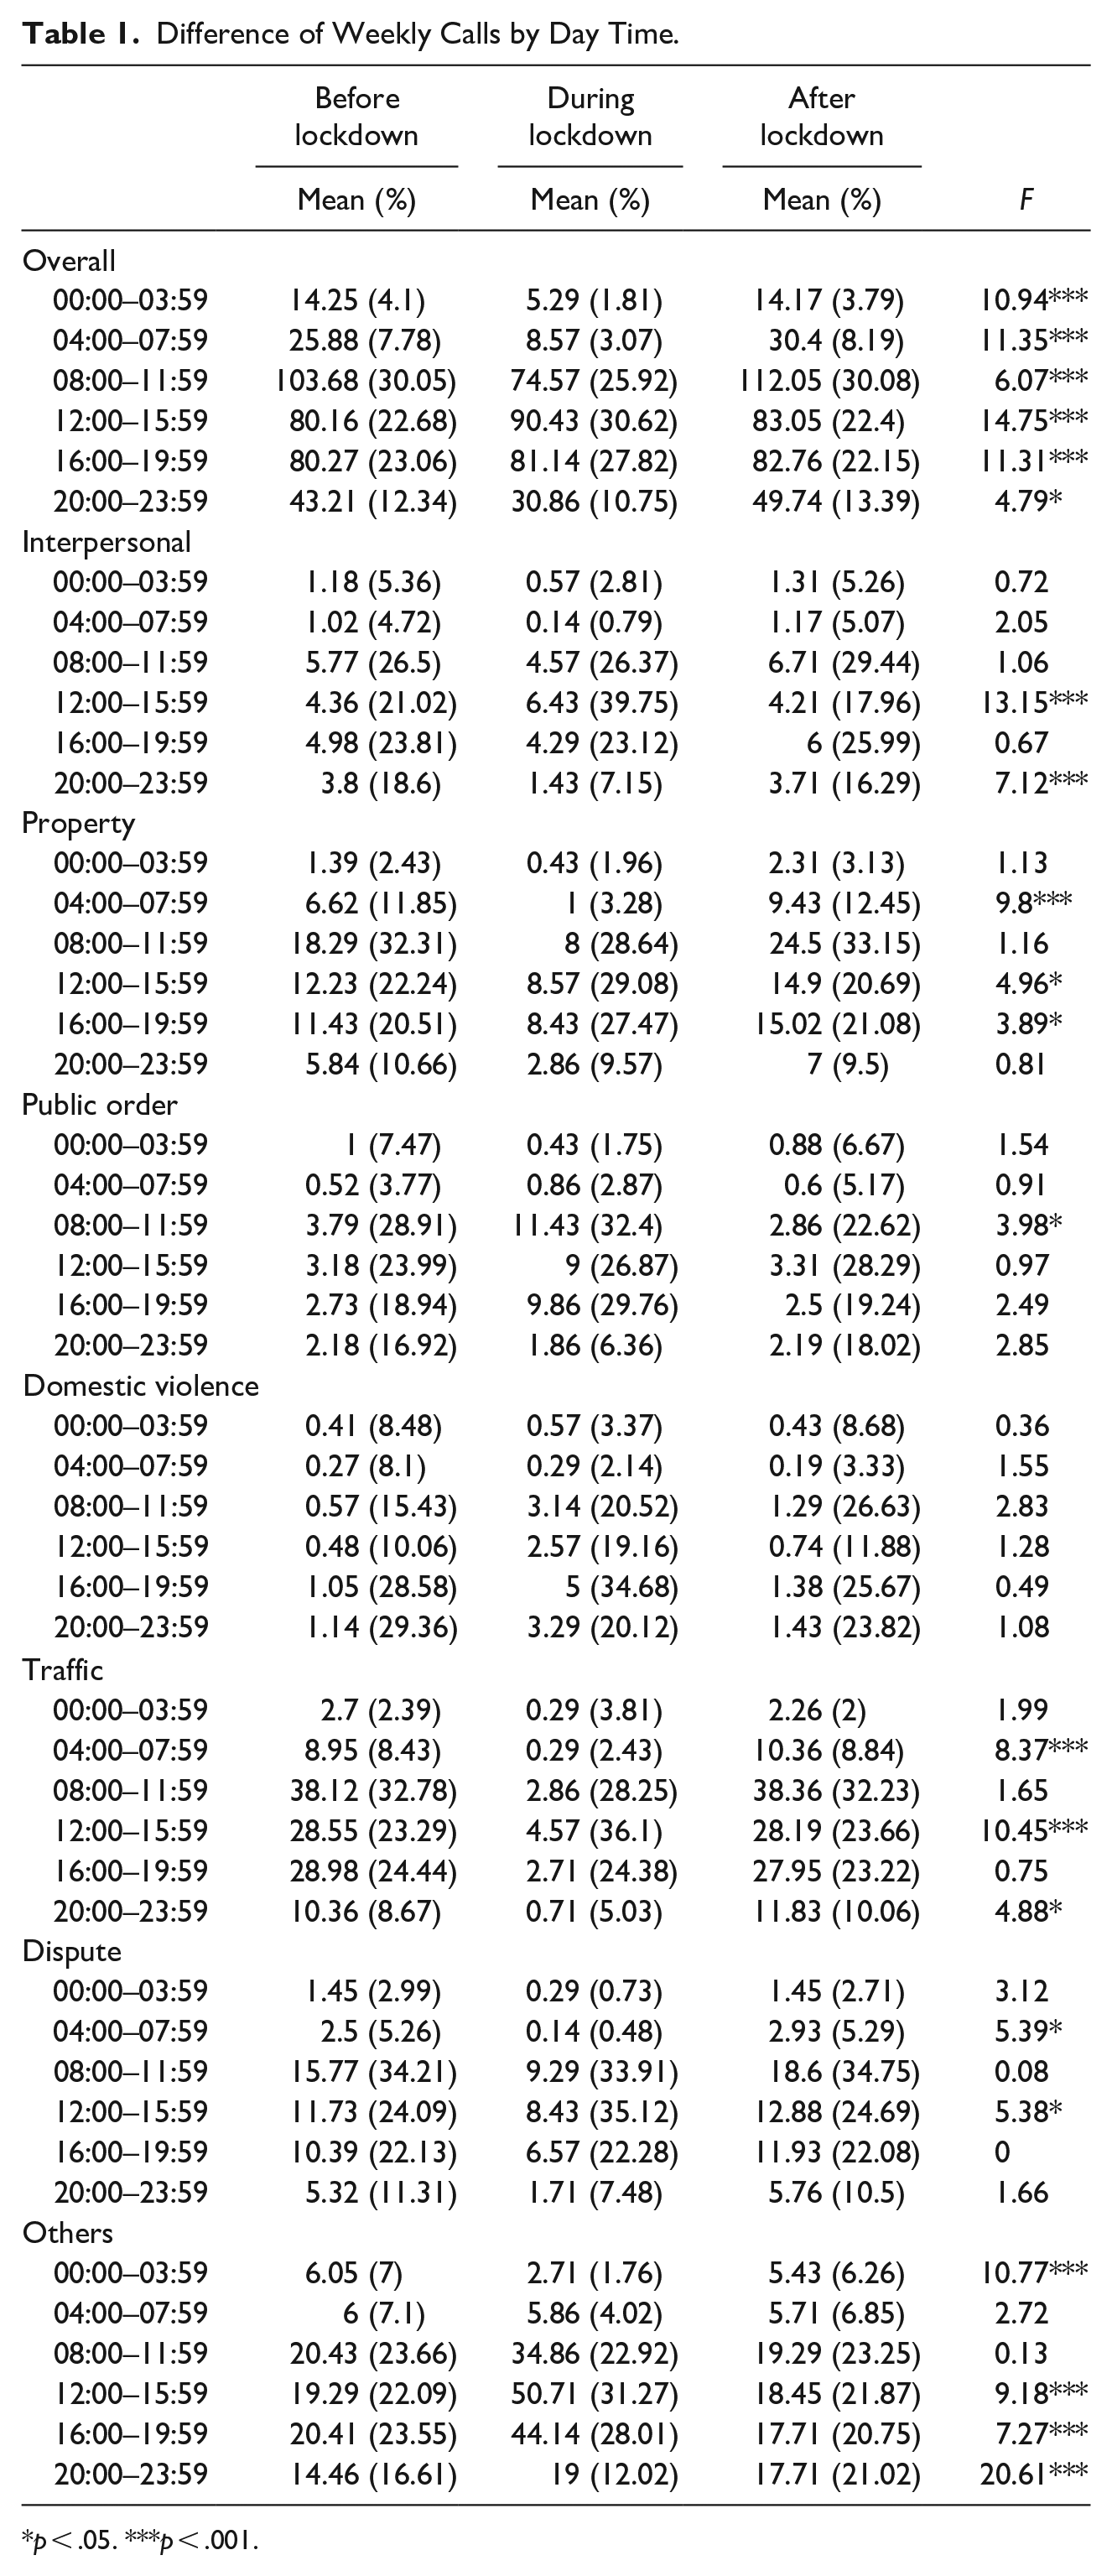
p < .05. ***p < .001.
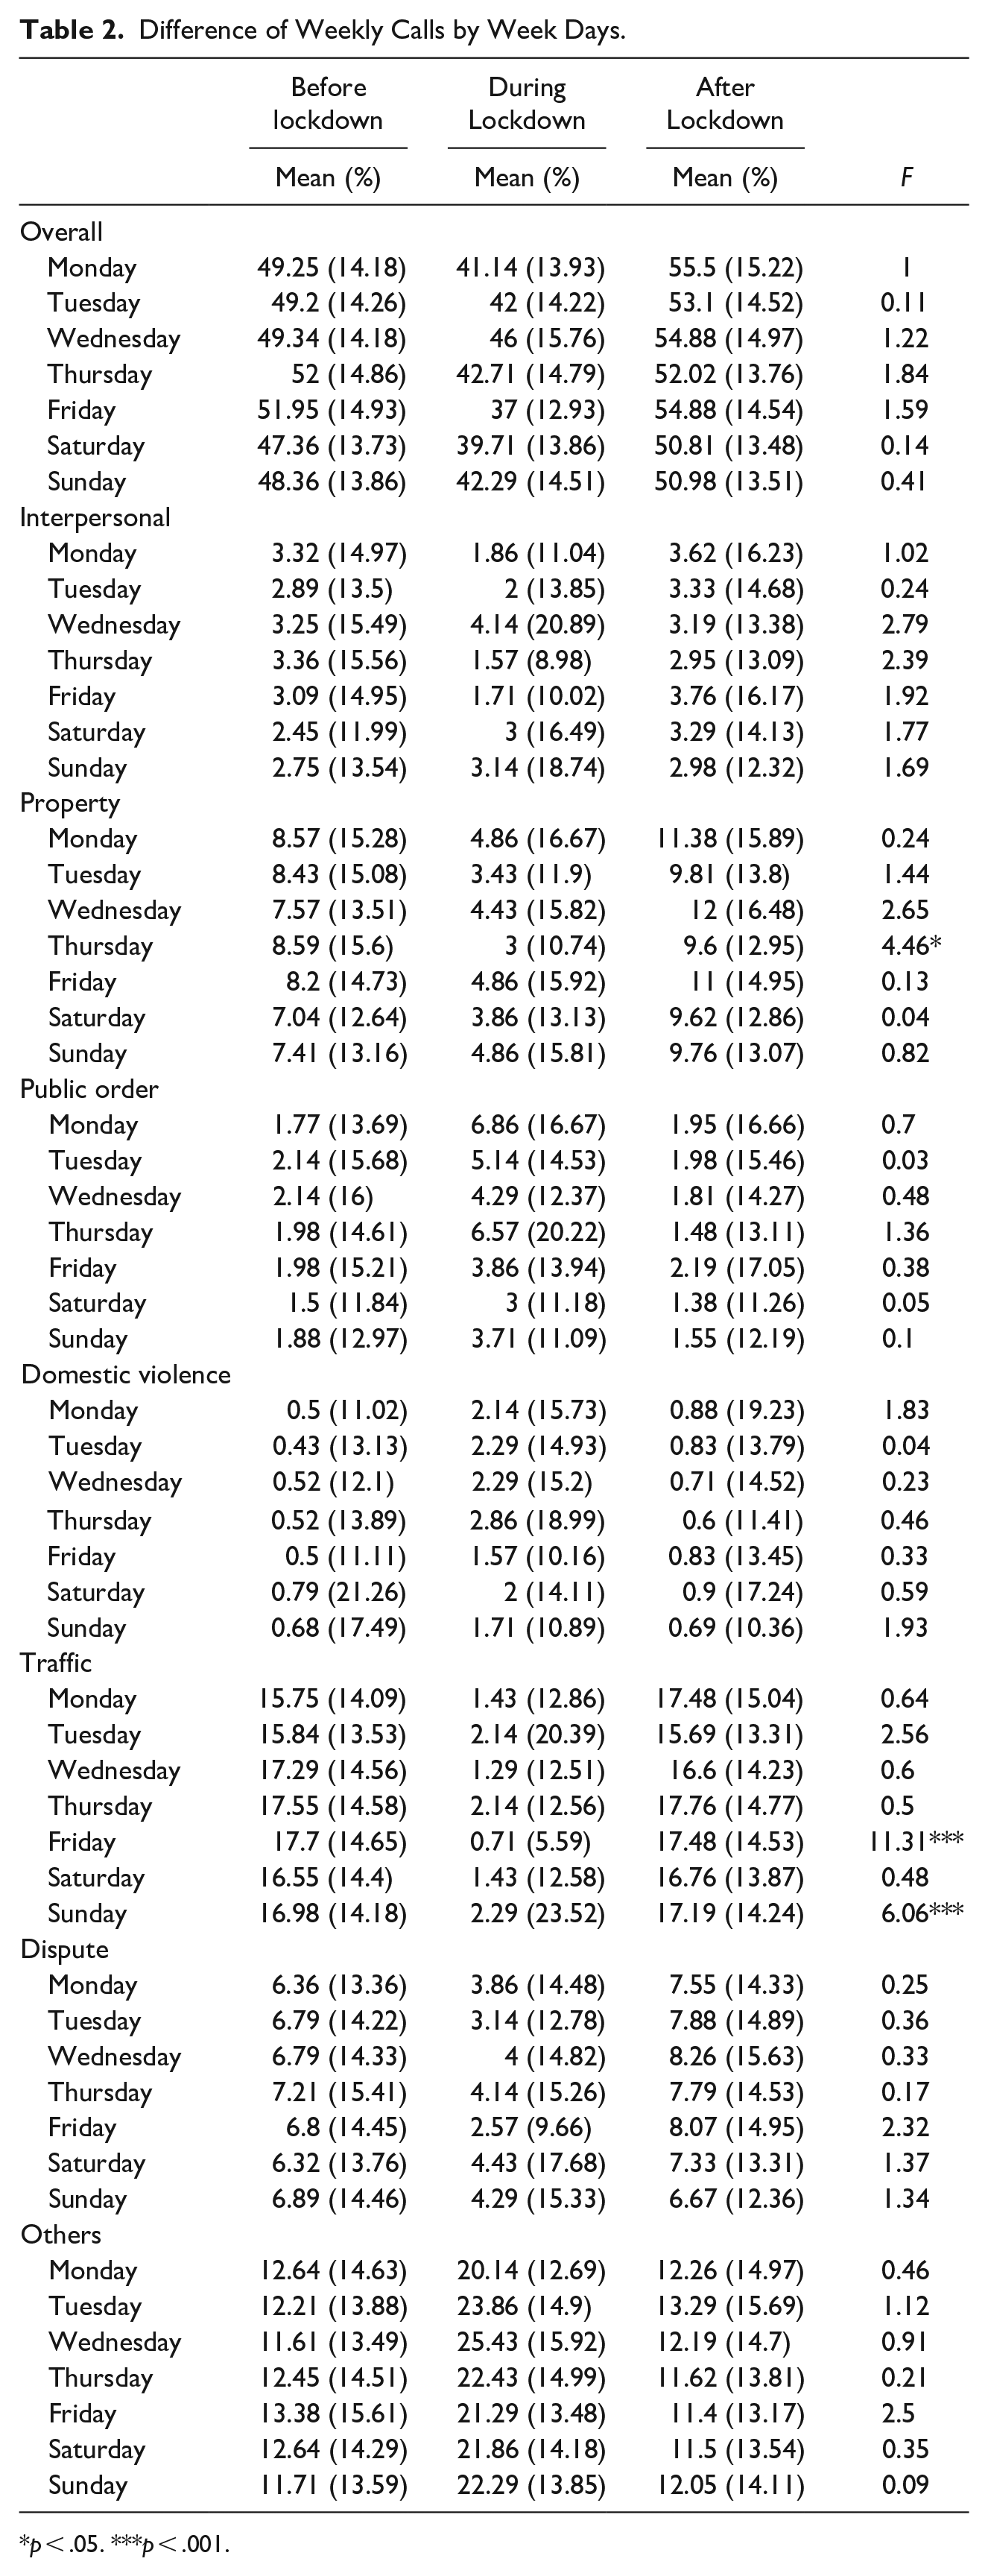
Difference of Weekly Calls by Week Days.
p < .05. ***p < .001.
Similar to the findings in Figure 2, overall, more calls switched to the afternoon, and the changes across different time periods were significant at the p < .05 level. In addition, the finding shown in Figure 2 that violence-related calls happened more often in the early afternoon but less often late at night reached statistical significance at p < .001. Property-related calls showed a significant decrease in the early morning and a significant increase in the afternoon. Public order–related calls, akin to the findings in Figure 2, showed a significant increase in the morning.
Unsurprisingly, domestic violence showed no significant differences before, during, or after the COVID-19 lockdown. Traffic-related calls in the morning decreased significantly and increased significantly in the afternoon. As for dispute-related cases, early morning calls decreased, whereas afternoon calls increased. Finally, other calls experienced a significant decrease in the early morning, but increased in the afternoon.
Table 2 shows the statistical test of the mean differences of calls by day of the week. In line with the findings in Figure 3, little statistical difference is detected, with the exception of traffic related calls, which demonstrated a significant decrease on Fridays and a significant increase on Sundays.
Discussion and Conclusion
The COVID-19 pandemic will have a lasting impact on history on a scale not seen since WWII (Stickle & Felson, 2020). Its influences on the temporal patterns of calls for police service raise questions about the extent to which another pandemic would affect such calls. Furthermore, as mentioned earlier, routine activity theory highlights that changes in the routine activities of everyday life influence criminal opportunity (Cohen & Felson, 1979). The three temporal components of criminal opportunity—rhythm, tempo, and timing—broke down during the COVID-19 pandemic, affecting the temporal patterns of calls for police service. Nevertheless, very little scholarly attention has been paid to these temporal patterns. Thus, based on data from a 110 command center in a county-level city in Hubei Province, China, we analyzed how the temporal patterns of calls for service varied before, during, and after the lockdown and provided insights into the public’s demand for police services during the crisis.
The temporal patterns of most types of calls for service were affected. Calls for service peaked from 08:00 to 19:59. For example, the percentage of calls during that time period that were violent crime–related calls were approximately 71.33% of calls before the lockdown, 73.39% after the lockdown, and 89.24% during the lockdown. This finding is inconsistent with previous research suggesting that violent crime and property crime peak late in the evening (e.g., Cohn, 1996; Cohn & Rotton, 2000; Cusimano et al., 2010; de Melo et al., 2018; Hale & Garmire, 1977; LeBeau & Langworthy, 1986; Nelson et al., 2001; Rotton & Cohn, 2004; Tompson & Bowers, 2013; Van Koppen & Jansen, 1999). Compared to before and after the lockdown, most police service calls began to increase in the morning and then peaked between 12:00 and 15:59 during lockdown. Furthermore, the mean number of calls was 90.43 compared to 80.16 before the lockdown and 83.05 after the lockdown. This means that changes in routine activities affected the timing of calls during the lockdown as well as the number of calls. Consistent with results from another exceptional event (i.e., Hurricane Hugo), LeBeau (2002) demonstrated that beyond expectations, the early morning hours showed high levels of calls. We also found that the busiest hours of the day for calls for police service were between 12:00 and 19:59, with more than half of calls received during this period during the lockdown, such as for violent crime (62.87%), property crime (56.55%), traffic violations (60.48%), and disputes (57.4%). The findings of this study are consistent with those of Holcomb and Radke-Sharpe (2006), who also indicated the late afternoon and early evening as peak hours for police service calls.
More domestic violence calls occurred between 16:00 and 19:59 during the lockdown. Before and after the lockdown, the average number of domestic violence calls was below 1.5 per day, but this increased to 5 during lockdown. Similar findings have been made before (Grech & Burgess, 2011; People, 2005). For example, using recorded incidents of domestic violence and assault between 1997 and 2004, People (2005) found that domestic assault incidents peaked between 18:00 and 21:00. Some studies have found that the occurrence of domestic violence is affected by temporal variables (e.g., Cohn, 1993; LeBeau, 1994; Vaughan et al., 2018), although we did not find any significant effects for domestic violence calls. For example, Vaughan et al. (2018, p. 61) found that “domestic related calls for police service follow an ‘expected’ temporal pattern”—that is, these calls were more frequent between 18:00 and 02:00. As for the distribution of calls by day of the week, no significant pattern was found, with the exception of traffic-related calls. Calls for service regarding traffic issues increased abruptly on Sundays, but the mean number of calls was only 2.29, compared to over 16 before and after the lockdown.
In summary, as Liu et al. (2021, p. 1) mentioned, “the magnitude of the pandemic is calling for social scientists worldwide to think deeply about basic questions of social order and social change.” Via this unique and important study, we contribute to exploring the influences of COVID-19 on temporal patterns in police service calls. Our findings are significant for frontline police officers and the government, allowing them to learn from the past and better prepare for future exceptional events. In particular, lockdowns have temporal effects on calls. In such a context, police departments must adjust policing resources and redeploy their workforces to respond to calls during the crisis. Finally, one limitation of this study is the generalizability of its results, given that we only focused on a single city. It would be of interest for future researchers to replicate this study in other cities to examine whether similar findings are made.
Footnotes
Declaration of Conflicting Interests
The author(s) declared no potential conflicts of interest with respect to the research, authorship, and/or publication of this article.
Funding
The author(s) disclosed receipt of the following financial support for the research, authorship, and/or publication of this article: This study was supported by Sichuan Province Social Science Planning Project (SC21A032).