






Abstract
Our study explores whether certain establishments repel crime in a high-crime neighborhood. We draw on interviews with 35 neighborhood insiders in 2014 and 2015, consisting of ex-offenders, residents, and police. We examine the spatial relationships between places identified by participants—churches, parks, and community gardens—and calls for service (CFS) using Ripley’s network bivariate K-function. Community gardens were associated with repulsion consistently, but only reached statistical significance for drug-related CFS. Churches were associated with both crime repulsion and attraction. Parks show evidence of repulsion for drug CFS at certain distances and for violent CFS. In sum, while qualitative data suggest compelling possibilities for certain establishments to repel crime, quantitative results are mixed about the reality.
Keywords
Introduction
Crime is highly concentrated geographically, even within high-crime neighborhoods (Weisburd, 2015). In fact, roughly 50% of crime in a city can be traced to just 2-4% of street segments, addresses, or intersections (Sherman et al., 1989; Weisburd et al., 2004). These “hot spots” have garnered interest among criminologists and practitioners alike, since pinpointing crime at the microgeographic level holds much promise for crime prevention and reduction. Further, research suggests that hot spots can often be attributed to certain types of businesses or structures that attract or generate crime (Brantingham & Brantingham, 1995). For example, alcohol outlets, retail outlets, bus stops, and sports arenas have been identified as crime attractors or generators (Bernasco & Block, 2011; E. R. Groff & Lockwood, 2014; Rengert, 1997; Roman & Reid, 2012; Roncek & Maier, 1991). Consistent with routine activities theory (Cohen & Felson, 2010), such establishments offer an ample supply of suitable targets as well as a high likelihood they will converge in space and time with motivated offenders.
While a growing body of work investigates the establishments that fuel hot spots, relatively little work has considered establishments that could do the opposite and push crime away. Indeed, high-crime neighborhoods are characterized by hot spots and cold spots. Here, a cold spot refers to microgeographic locations with relatively little to no crime. On the one hand, it could be inferred from extant theory that there may be an absence of suitable targets and/or insufficient guardianship in these locales. On the other hand, some locations may be relatively crime-free due to the presence—rather than the absence—of certain types of establishments. These establishments, which we term as repellents or safe havens—could push crime away.
Our study takes a step toward exploring this possibility by drawing on first-hand accounts of 35 neighborhood insiders, including police, ex-offenders, and residents. Participants most commonly identified churches, parks, and community gardens as establishments that may serve this function. We then bring to bear quantitative data to investigate these hypotheses. Specifically, we draw on calls for service to explore whether there is evidence of repulsion associated with churches, community gardens, and parks.
Crime Attractors and Generators
In order to understand why certain establishments may be relatively crime-free, it is first important to examine why other establishments may attract or generate crime. According to Felson and Cohen (1980), “illegal activities must feed upon other activities” (p. 393). People’s routine activities, such as traveling to and from work, play an important role in shaping criminal opportunity. These activities determine where and when crimes will occur, as well as which types and how much. Building on the idea of opportunity structures, Brantingham and Brantingham’s (1995) crime pattern theory asserts that crime should follow a predictable spatial pattern based on the movements of potential offenders and victims. Moreover, the built environment and the locations of non-residential buildings play a role in these movements. For example, people who walk to work may consider a number of environmental factors before choosing a regular route: foot traffic, busy intersections, whether there is a café along the way, etc. In short, people’s movements through urban spaces are not random, and this non-randomness shapes the distribution of crime.
Brantingham and Brantingham (1995) distinguish between two types of establishments that should have disproportionately high levels of crime around them: crime attractors and generators. Crime attractors boast criminal reputations or offer unique criminal opportunities (e.g., items to steal), while crime generators tend to draw large amounts of people, some of whom may be potential offenders or potential victims (e.g., sports arenas). Both crime attractors and generators theoretically produce hot spots, albeit through different processes. In addition, a place can act as both an attractor and generator. A bar may generate crime because a lot of people go there, creating more opportunities for altercations to occur, and it may also be an attractor if offenders go there for the explicit purpose of committing theft, given the high supply of suitable targets. Some established crime generators or attractors in prior work include alcohol outlets (Bernasco & Block, 2011; E. R. Groff & Lockwood, 2014; Rengert, 1997; Roman & Reid, 2012; Roncek & Maier, 1991), drug treatment centers and halfway houses (E. R. Groff & Lockwood, 2014; Haberman & Ratcliffe, 2015), retail outlets (Bernasco & Block, 2011; Haberman & Ratcliffe, 2015), and abandoned houses (Boessen & Chamberlain, 2017; Porter et al., 2019; A. P. Wheeler et al., 2018).
While knowledge about places that have the potential to draw crime is growing and indeed important, crime attractors and generators only tell part of the crime distribution story. High crime neighborhoods may have hot spots and cold spots. The latter, which has been given little scholarly attention, can be defined as a microgeographic location with relatively little to no crime. While there may be many cold spots across a city, their presence within high crime neighborhoods in particular represents an interesting puzzle. Indeed, the work of Sherman et al. (1989) and Weisburd et al. (2004) was groundbreaking in part because it cast doubt on the idea that neighborhood processes alone influence neighborhood levels of crime. If this were the case, then crime would be spread somewhat evenly throughout a neighborhood, rather than concentrating at a small number of street segments, addresses, and intersections. Their work highlights the importance of looking at features that vary within the neighborhood too, such as the presence of establishments that attract crime. However, the flipside of this story is that some places within a high crime neighborhood may appear to be in a crime bubble.
Where the Crime Is (Not)
Consistent with extant theory, the most intuitive hypothesis is simply that some microgeographic locations lack opportunities that would either attract or generate crime. If illegal activities are most likely to occur where legal activities concentrate, cold spots may simply be dead zones of legal activity. Alternatively, cold spots may have opportunities that are well-guarded. Target hardening measures, adequate surveillance, or proactive place managers could effectively control crime in or around places that would otherwise be attractors (see Wilcox & Cullen, 2018). For example, a diligent shop owner who installs security cameras and calls the police readily can provide this kind of guardianship. The presence of a police station may also provide significant guardianship—both perceived and in reality—to a given street.
Another possibility is that some types of structures or establishments may act as safe havens or crime repellents. This proposed mechanism is distinguished from the abovementioned hypotheses because we argue that places may serve this function irrespective of guardianship due to intrinsic moral associations or “codes.” Knowledge of criminal or street codes is well entrenched in criminology, but this work understandably tends to focus on the attitudes and belief systems that fuel criminal behavior (Anderson, 1999; Cohen, 1955). What is more lacking is a consideration of how street codes or values factor into criminal decision-making beyond the initial decision to commit crime, such as how offenders choose targets or turf. In fact, researchers have shown that offenders engage in a calculus, considering factors that may attract them, when choosing targets (Brantingham & Brantingham, 2013; Wright & Decker, 1994). Similarly, they may consider certain factors when avoiding locations to target. Criminal or street codes can shed light on how and why offenders choose certain places to target or conduct illicit activity—or conversely—why they avoid other places.
While it may seem counterintuitive to explore notions of morality in “deviant subcultures,” it would be incorrect to assume that most offenders do not possess a moral compass. A handful of studies explore how offenders use neutralizing techniques to reduce feelings of shame or guilt associated with their criminal behavior (Maruna & Copes, 2005). Studies of snitching also suggest a set of situations in which cooperating with the police or reporting crimes is deemed acceptable. For example, criminally involved persons note that cooperating with the police is acceptable if the crime was particularly “heinous,” such as child abuse, domestic violence, kidnapping, or when crimes threaten friends or family (Clampet-Lundquist et al., 2015; Rosenfeld et al., 2003). In his classic ethnography of street corner socializing, Anderson (1978) also observed that there are certain individuals in the neighborhood people know not to “mess with,” such as “’a nice ol’ lady who been ‘round here fo’ years’” (p.3). Similarly, scholars have observed offenders’ tendency to consider certain groups as being “off-limits” for victimization (Sykes & Matza, 1957). In her study of burglars, Taylor (2014) finds overwhelming consistency that participants perceive the targeting of elderly people and/or their houses as wrong. The majority also stated that children were not acceptable targets and thus, they would steer clear of children’s rooms, possessions, or the house entirely if the children might be present.
Research on protective places is relatively scant. However, the handful of studies that engage with this idea tend to focus on the capacity for certain places to provide or improve upon guardianship. For example, Kimpton et al. (2017) note that greenspaces are “contested spaces” (p.324), in that they draw people engaged in legitimate and illegitimate activities. By drawing those engaged in recreation and other legal activities, parks may provide relatively more guardianship than other spaces via “eyes on the street” (Jacobs, 1961). However, those benefits might be outweighed by those who visit the parks seeking criminal opportunities. Boessen and Hipp (2018) also discuss the potential for parks to generate collective efficacy, which should reduce crime by increasing informal control. However, research on the relationships between parks and crime is mixed (Han et al., 2018; Boessen & Hipp, 2018; Kimpton et al., 2017; Marquet et al., 2019; Groff & McCord, 2012). In addition, churches have been implicated by scholars to have protective influences on crime at the neighborhood level, given that they should be important resources for building social capital (Warner & Konkel, 2019). However, research has largely not supported this hypothesis, finding null, or even positive relationships, with crime (Slocum et al., 2013; Warner & Konkel, 2019; Wo, 2023). Much of this research has also been at the neighborhood level, making it difficult to ascertain the spatial dynamics around these locations.
Our study builds on prior research by investigating the following research question: do certain establishments act as crime repellents or safe havens? We use a mixed methods approach to investigate our research question and more specifically we employ an exploratory sequential design (Edmonds & Kennedy, 2017). In this type of design, qualitative data collection is carried out first to inductively build towards a set of pertinent variables to examine or hypotheses to test.
Data and Analytic Strategy
Our study draws on data collected from a high-crime neighborhood in Ohio. This neighborhood exhibits a crime rate that is almost double the city rate and is marked by clear borders on each side (highways, an industrial park, and a large body of water). The neighborhood is racially diverse, with those identifying as Black or African American being the majority. It is also one of the youngest neighborhoods in the city and contains a relatively large number of vacant lots. Our research efforts were conducted in cooperation with the local police department, who identified this neighborhood as a priority for crime control and reduction.
Ride-along interviews
Our study leverages data collected from interviews with ex-offenders, police, and residents. Between 2014 and 2015, we conducted ride-alongs with 14 ex-offenders, 13 police, and 8 residents as part of a study to better understand the social and environmental dynamics of crime hot spots. Our sample was mostly male (77%), half African American (49%), and the average age of our participants was 44 years old. Participants were driven through the neighborhood by a member of the research team and were instructed to “lead the way.” We told participants that we were especially interested in insights they could offer about crime.
We used a mixture of non-random sampling strategies to recruit our participants. Police were selected based on their working relationship with the neighborhood and were paid overtime by the department. We rode with police officers who patrolled during the day or night. We recruited ex-offenders from local reentry support groups and meetings, where ex-offenders obtain information about employment and educational opportunities, as well as legal, or health concerns. We “oversampled” ex-offenders and police officers since their insights should be more germane to crime dynamics. We located community members through a popular local ministry and café, where a diverse crowd of individuals eat, socialize, hold local business meetings, and attend services. Notably, the ministry is heavily involved in the community in many different aspects and welcomes people of diverse backgrounds to the café and to services provided. With community members and ex-offenders, we used snowball sampling to meet future participants through past participants. Community members and ex-offenders were provided with a $20 gift card to Family Dollar in exchange for their participation. All research was approved by our university’s Institutional Review Board.
While driving through the area, we used four GPS-enabled cameras attached to our vehicle to capture the environment. Specifically, we use “Contour Plus 2” cameras, which are designed for extreme sports (Curtis et al., 2015). We then viewed the video using free Contour Storyteller software, which allows users to match an image with an exact location on an accompanying map. Using these recordings, we were able to digitize (enter as digital data) information such as the location of places identified by participants. Specifically relevant to this analysis, we coded non-residential buildings from video footage and the type of establishment was discerned by using a mixture of participant narratives, images of the building itself (a sign or advertisement), and in some cases when there was uncertainty, we researched online.
Interviews were then transcribed using Express Scribe software and transcriptions were coded using NVivo 13 software. A member of the research team open coded transcriptions to identify places that participants referred to as potentially protective and/or positive for the neighborhood. Open coding refers to the process of identifying, naming, categorizing, and describing phenomena found in the text (Böhm, 2004). Although we use the terms “repellents,” “safe havens,” and “protective places” interchangeably, we acknowledge that they could be understood differently. In essence, we argue that each of these terms refers to an establishment that is relatively shielded from crime in a high-crime neighborhood.
Quantitative data analysis
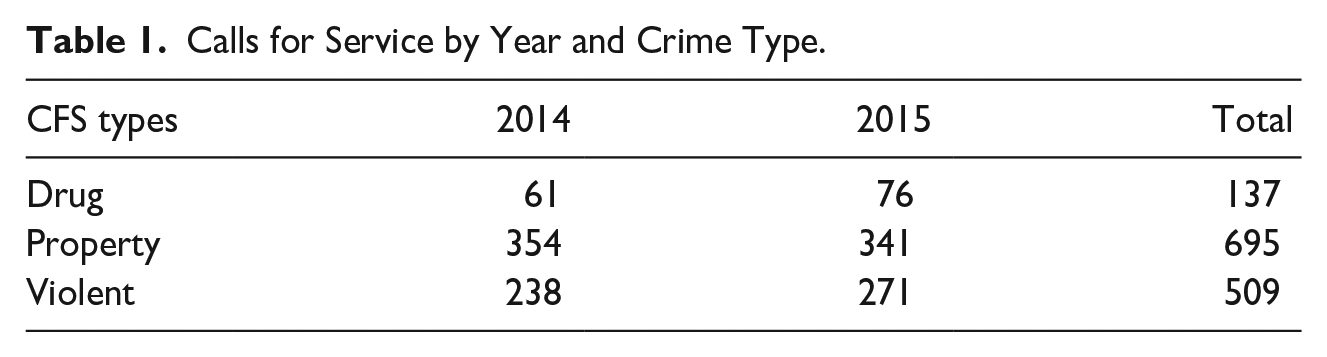
While our qualitative findings suggest potential establishments that could act as repellents, our quantitative analysis examines this possibility using calls for service (CFS) from the local police department for 2014 and 2015. We use CFS to measure crime because calls reflect a fuller picture of crime than recorded offenses or arrests (Warner & Pierce, 1993). However, we recognize that there are still discrepancies between the true level of crime and what is reported to police. Informed by our qualitative results, we parse out calls related to drug, property, and violent crimes. All CFS were geocoded to the street segment level using the street address locator tool available in ArcGIS Pro (version 2.8) (Esri, 2022). This tool identifies the location of each CFS along the street network using a polyline shapefile of reference information on street addresses from the U.S. Bureau of the Census (2015). Importantly, the street address locator tool is highly flexible, accommodating dual-address ranges and three types of street addresses: address with house numbers, street intersections, and street names. Table 1 displays calls per year by crime type. For both years, the most calls were made for property crimes, followed by violent crimes and drug crimes.
Calls for Service by Year and Crime Type.
We use a two-prong analytic approach to analyze crime concentration along street networks. 1 To begin, we provide a descriptive assessment of the locations of potential crime repellents identified by participants relative to network kernel density estimates of CFS. As the name implies, network kernel density estimation considers the density of points (capturing physical features or events) that occur along a street network using a kernel function of a set bandwidth. We calculate network density estimates for each type of CFS using the kernel density tool available in SANET (version 4.1). This tool uses a continuous and unbiased estimator that leverages a recursive function to force density estimates to be continuous, while also integrating density estimates at intersections to be just one. To remain consistent with our primary analysis, we set our bandwidth to 450 feet. This distance captures the average length of a street segment in the neighborhood.
We then use Ripley’s bivariate K-function to explore the relative attraction or repulsion associated with potential crime repellents. Ripley’s bivariate K-function has been applied in a variety of disciplines to characterize the spatial relationship between two point patterns in a given area (e.g., Amgad et al., 2015; Baddeley et al., 2014; D. C. Wheeler, 2007). In traditional applications, the method determines the expected number of points that fall within a given distance of another data point. An observed distribution is produced, which can be compared against what would be expended under a null hypothesis, in this case complete spatial randomness of crime. Thus, the null hypothesis of complete spatial randomness (CSR) serves as a benchmark for identifying the nature of the spatial relationship between particular establishments and crime. Specifically, we use the network bivariate K-function to allow us to examine these relationships along street networks. The network bivariate K-function calculates the shortest network distance between point pairs of type i and j, which is then normalized by the density of points along the network. 2 This observed distribution can then be compared to upper and lower permutation envelopes generated from Monte Carlo simulations of CSR in which points of type i and j are independently and identically distributed along the street network according to a uniform distribution.
- where
For each potential repellent and crime, the spatial relationship is characterized as either attraction, repulsion, or randomness (i.e., no relationship). Evidence of attraction is supported when there is more crime around locations than would be expected by chance alone. Evidence of repulsion is supported when there is less crime than would be expected by chance alone. Furthermore, how prolonged the distance of departure from randomness is provides additional insight. For example, a departure from randomness at a single distance (e.g., 5 ft) or sporadically over a range of distances (e.g., 5 ft, 50 ft, and 300 ft) offers less compelling evidence that the establishment is a crime attractor or repellent, as compared to a departure from randomness that is sustained over a long distance (e.g., 5 ft through 300 ft).
Importantly, to interpret our quantitative results we use both directionality and statistical significance. Given that our study is descriptive and exploratory, we discuss findings that are directionally suggestive of repulsion even if not statistically significant. Indeed, there has been recent criticism of using statistical significance as the sole criterion by which to interpret findings (Amrhein et al., 2019). In the next section, we first discuss our qualitative results, before turning to our quantitative findings
Perceived Repellents and Safe Havens
Our participants identified churches, community gardens, and parks as positive places in the neighborhood. While some participants explicitly stated that crime rarely happens around these places or that offenders would avoid them, others identified these establishments as simply positive or “good” places.
Churches
The neighborhood is home to thirteen churches or places of worship. Churches were identified by many participants (63%) as positive places that contribute to community wellbeing in ways beyond religious services, such as by organizing food and school supply drives. In addition, churches were explicitly identified by 29% of participants as places that offenders would steer clear of due to the religious significance of the church and/or the positive impact churches have on the community. These participants included one community member, five ex-offenders, and four police officers. One ex-offender describes why he personally would never target a church or conduct illicit activity in front of a church:
So what sort of things, so what sort of did you stay away from?
Well cause I was raised in the church, and that goes back to morals and values and it had some kind of connection with morals and values.
So church was a deterrent for you.
Yeah but I can't say that for everyone, because I remember I played music, and I do play in the musical ministry and even years ago when I had like, what you call glimpses of clarity, before I even went to the penitentiary, I was playing in a church and I remember that there was this guy that didn’t live too far from there. . .he broke into that church and stole our equipment. And that was something that I would never ever do. I could burn in hell or get hit by a bolt of lightning or something.
Another ex-offender noted that drug activity tended to stay away from a particular end of a street in the neighborhood because “there is a church and the kids” and another said, “you shouldn't deal drugs in front of a church or by a school.” Two police officers also specifically referred to churches as “safe havens” for community members, and a third officer remarked when passing by a church with a playground in front, No problems at this church obviously. But, this is one of the best things they did here was build this [playground] for the kids. I’ve never had a fight call there, nothing. Parents will sit on the table, watch the kids play, it’s the greatest thing in the world around here.
Another officer specifically noted that the differences between churches and other places didn’t relate to “kinds of people” that use each space, but to the spaces themselves. He describes this dynamic as follows:
I know people who are involved with drugs who go to the church for help, who go to the church to help out too. They know they have a problem, but they’re not bringing that, that problem to the church, they’re not bringing the drugs into there. They’re…it’s kind of like a, I hate to say it but like a day off. They’ll just go there and hang out and help out people and the next day they’ll be back out on the street
The historical significance of the church in predominantly Black communities has also been noted by several scholars. Du Bois (1898) highlighted the Black Church’s role as a refuge and researchers similarly note that churches have historically “provided an escape” from societal conditions for Black individuals (Morris, 1984, p. 4). They often play a role in “meeting emergency needs” of families and community members as well (Pattillo-McCoy, 1998, p. 770). Consistent with this literature, those engaged in crime may also respect the role of the church, influencing where they (do not) commit crime.
Community gardens
In our sample, 66% of participants commented on community gardens being positive spaces for the neighborhood, where adults and children come together to grow food for the community. All activity described by the participants in community gardens would be considered “pro-social,” however only one participant, a police officer, stated explicitly that he believed persons engaged in crime would avoid community gardens. Nevertheless, we explore them as another potential safe haven or repellent due to the overwhelmingly positive regard of gardens and the absence of any comments connecting crime to these locations. One police officer described, I see people at them no matter where they are at. They can be in the worst neighborhood you can possibly imagine. People will be out there gardening and taking care of them.
Just as churches are associated with children’s programs or activities, community gardens are recognized as a space for children to engage in positive behavior. One ex-offender commented Keeps the kids busy, they love them.
Yeah they love them?
And the fruits be so beautiful, they actually grow them.
So you think the kids, they like it?
Yeah, and then at the end of the season they get to sell their product. And it’s really nice. I know a couple kids that go there
Most participants discussing the community gardens noted that they are well-maintained by the community and a source of pride. For example, another ex-offender made similar comments:
The community gardens have been a real blessing. I mean, people are able to get out, and look at this one.
It’s beautiful.
People can get out and use some of that energy. . .and actually be able to see something. . .you know, come up around [what] they put their time and efforts and energy into. And then, like, when it comes to harvesting. . .they would harvest their own crops, crops that they planted. And it makes them. . .it gives them a sense of pride.
There is some research suggesting that the conversion of vacant lots to community gardens can be an effective intervention for crime reduction. Unfortunately, most research broadly examines vacant lots that have been “greened” as opposed to those being used specifically as gardens. In a study looking specifically at gardens though, Beam et al. (2021) find that converting vacant lots to community gardens in Milwaukee reduced violent crime around the lots by 3.7% to 6.4%. On the other hand, a study in Houston finds that although residents perceived the gardens to be immune to criminal activity, there was no difference in levels of crime around these lots compared to others (Gorham et al., 2009).
Parks
Finally, parks were identified by 31% of participants as positive places in the neighborhood, with 17% of participants saying they think crime stays away from the parks. One ex-offender in our sample summarized this sentiment:
I guess when [people] want to go to the park, they just really [want to] have a good time and nobody trying to fight and you know have no trouble. And they have they kids. It’s probably because they have their children with them. So many kids. So you know, and a lot of people. You do have neighborhoods, no matter what the neighborhood is, they do care about their children so you know, you not about to start a whole bunch of commotion
Another ex-offender’s perspective was that parks are actually ill-suited to deal drugs since it is hard to be visible to potential consumers, explaining that it is better to stand somewhere that gets more foot traffic. To this ex-offender, it was less a matter of moral code and more a matter of criminal opportunity. Notably, parks were also identified by some participants as potential crime attractors or generators (11%), with some claiming that parks foster opportunities for fighting or drugs. One ex-offender explains, At night you have the dope dealers hanging out in the parks and then you find needles and you know, you don’t want your kid to find that and get poked.
These conflicting views also mirror extant research on the topic. In their meta-analysis, Shepley et al. (2019) find that out of ten studies examining the relationship between parks and crime, three find positive associations, three find negative, and four find no relationship. Indeed, our interview data also paint a complicated picture of the potential role of parks.
Next, we explore whether the insights we gathered from participants are consistent with crime distribution in the neighborhood. As noted in our data and methods, our qualitative results inform our quantitative analysis in our exploratory sequential design. Thus, we examine the extent to which churches, parks, and community gardens may act as crime repellents “in reality,” using calls for service related to property, violent, and drug crimes.
Quantitative Results
Our study site includes 13 churches, 12 community gardens, and 9 parks. Figures 1 to 3 show the locations of these establishments relative to network kernel density estimates of CFS related to drug, property, and violent crimes, respectively. Before proceeding with our descriptive assessment, it is important to acknowledge that many potential crime repellents are located near the boundary of the neighborhood. The spatial measurement of physical features or events located near boundaries may lead to distorted estimates (Baddeley et al., 2015). This phenomenon is referred to as edge effects. However, we do not believe this form of bias to be of great concern for our analyses. Of particular relevance, our neighborhood’s western border is entirely shaped by a lake, forming a natural boundary. Natural boundaries are unaffected by edge effects because they create real barriers for travel. Large swaths of industrial space in the south and southeast also minimize the number of artificial boundaries. With that said, our network bivariate K-function analyses account for the possibility of edge effects by way of a geometrical correction factor. Our microgeographic focus also helps minimize the exclusion of crimes that fall within a network space of 450 feet from potential crime repellents but are located outside of the neighborhood boundary.
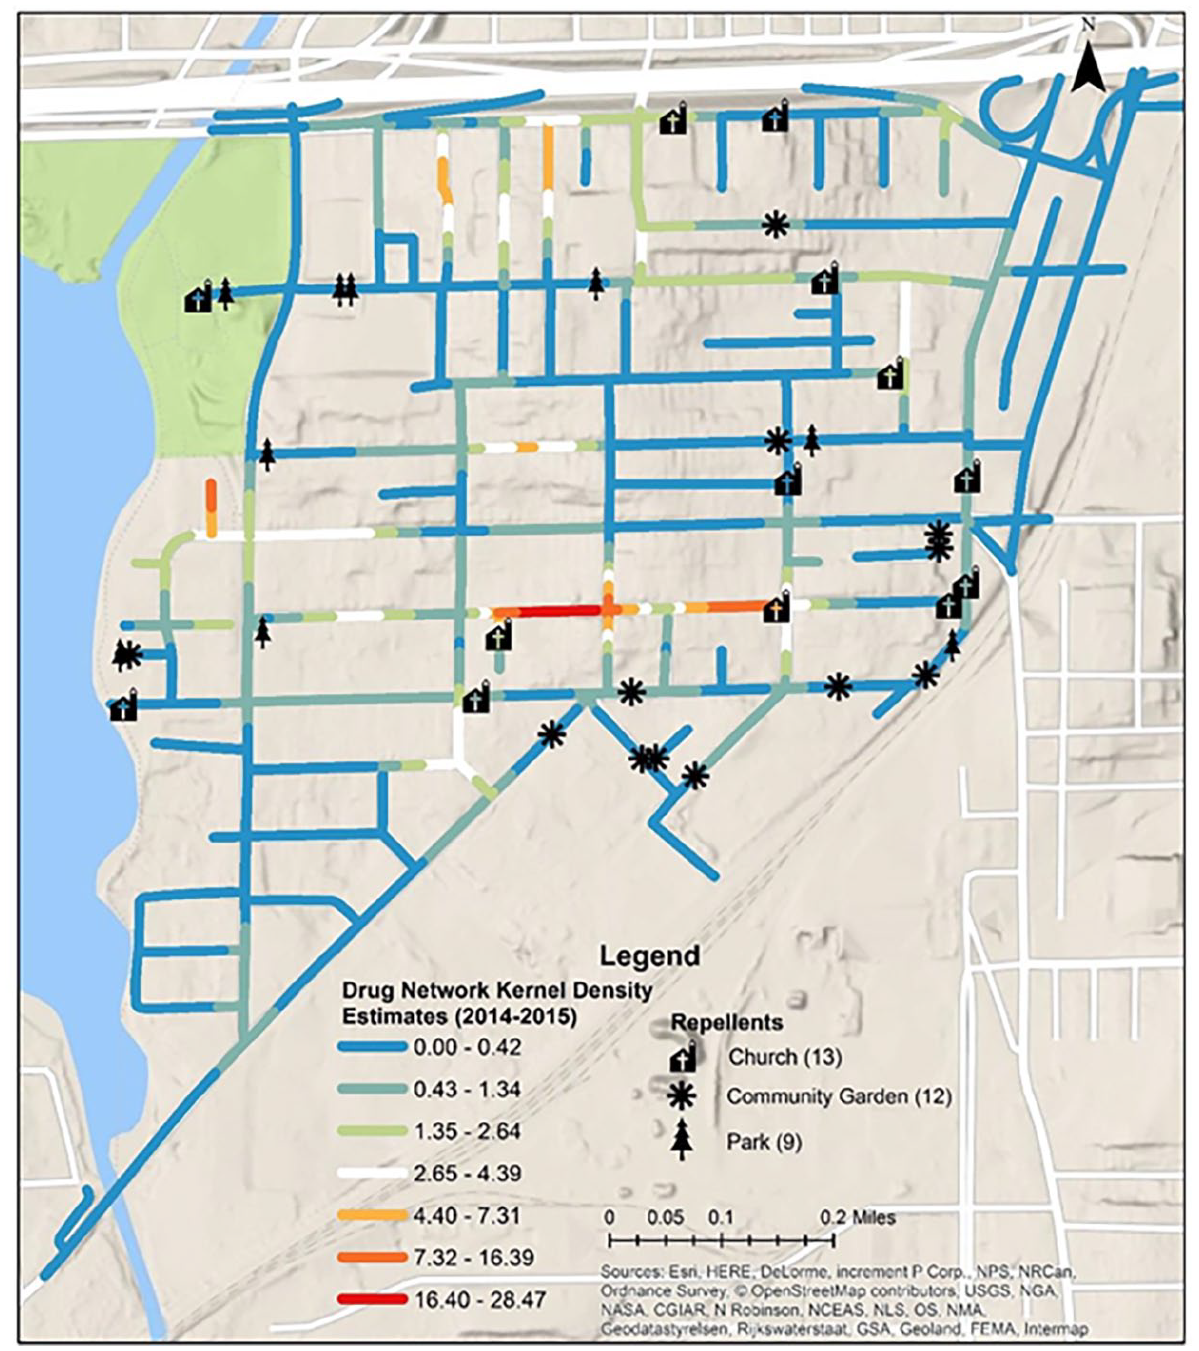
Network Kernel density estimates: CFS related to drug crimes (2014–2015).
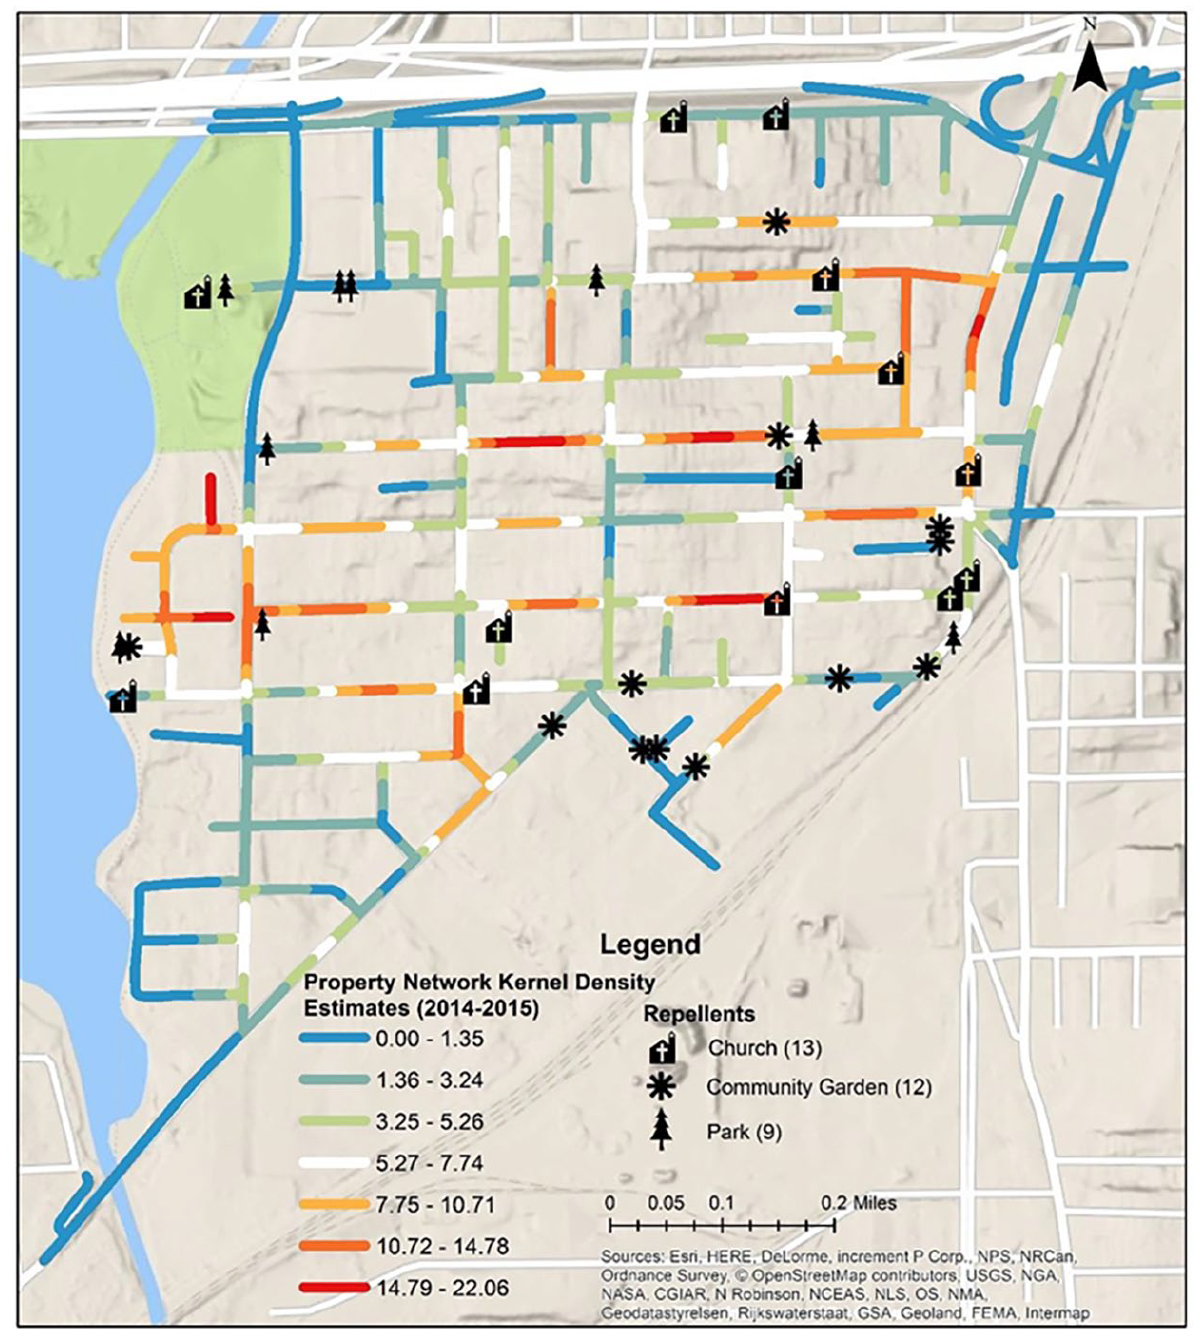
Network Kernel density estimates: CFS related to property crimes (2014–2015).
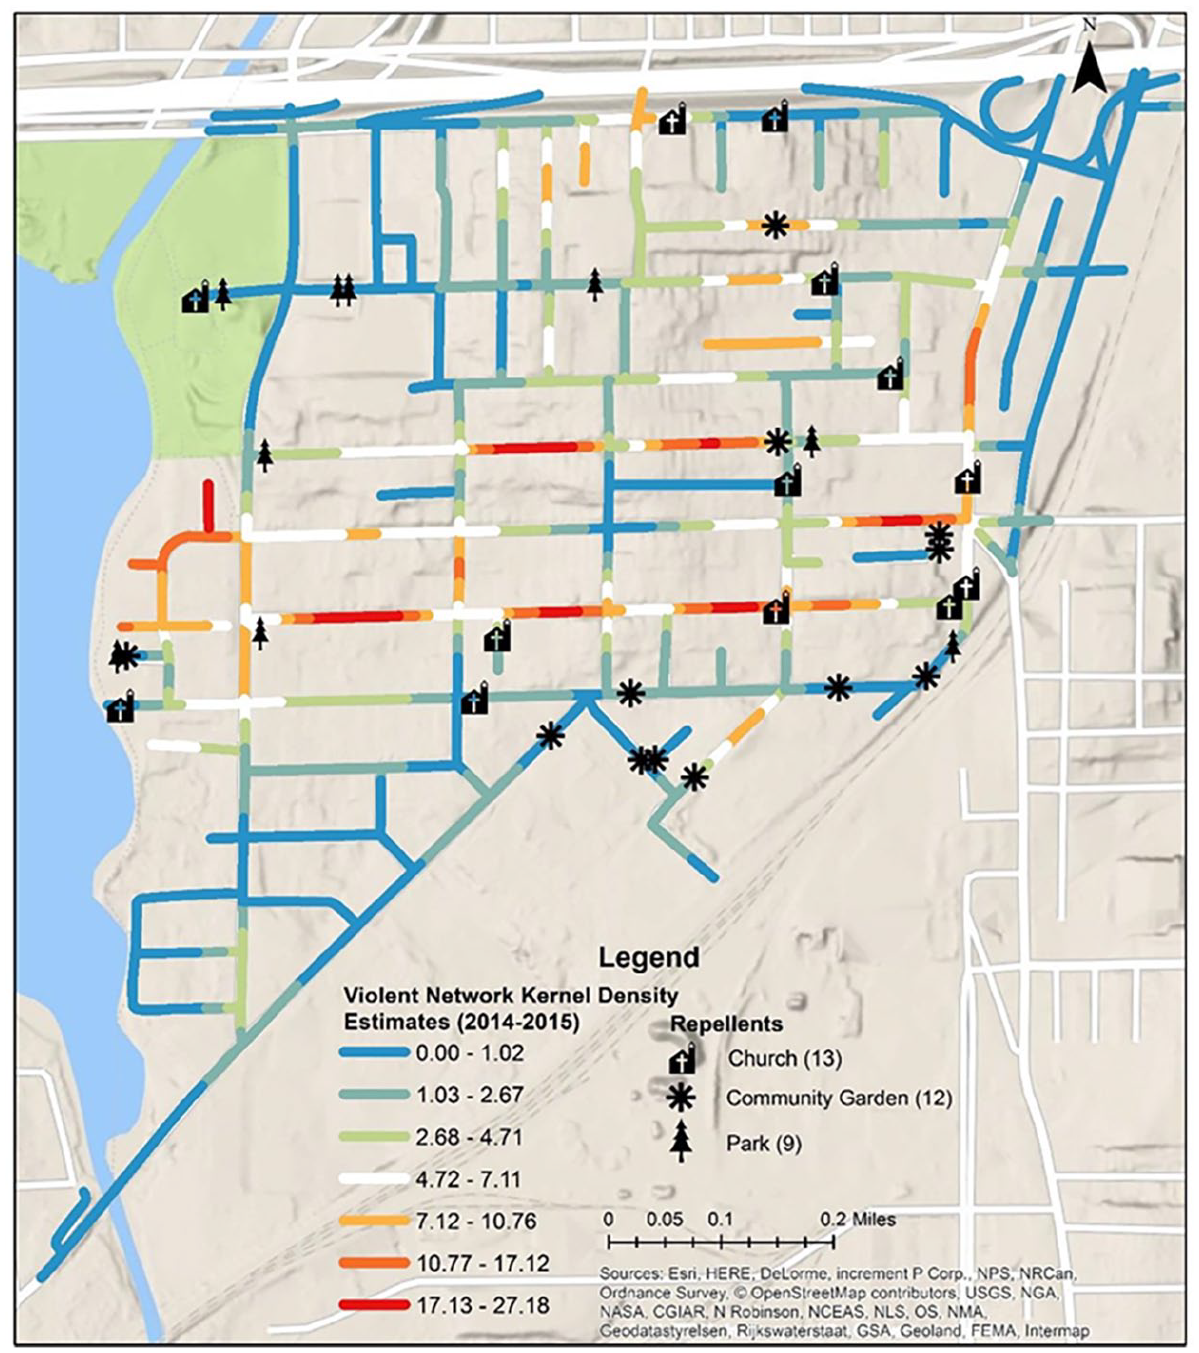
Network Kernel density estimates: CFS related to violent crimes (2014–2015).
Figures 4 to 6 show the observed
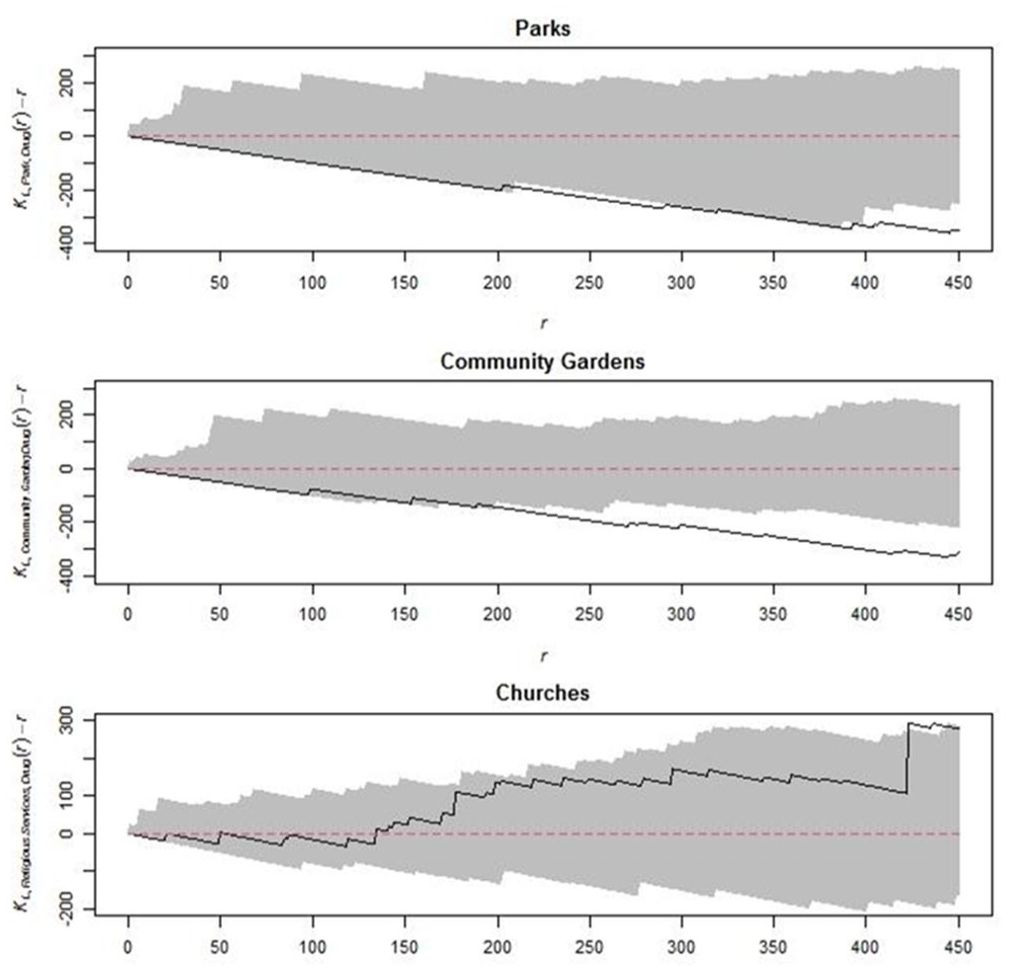
Network bivariate K-function results: CFS related to drug crimes (2014–2015).
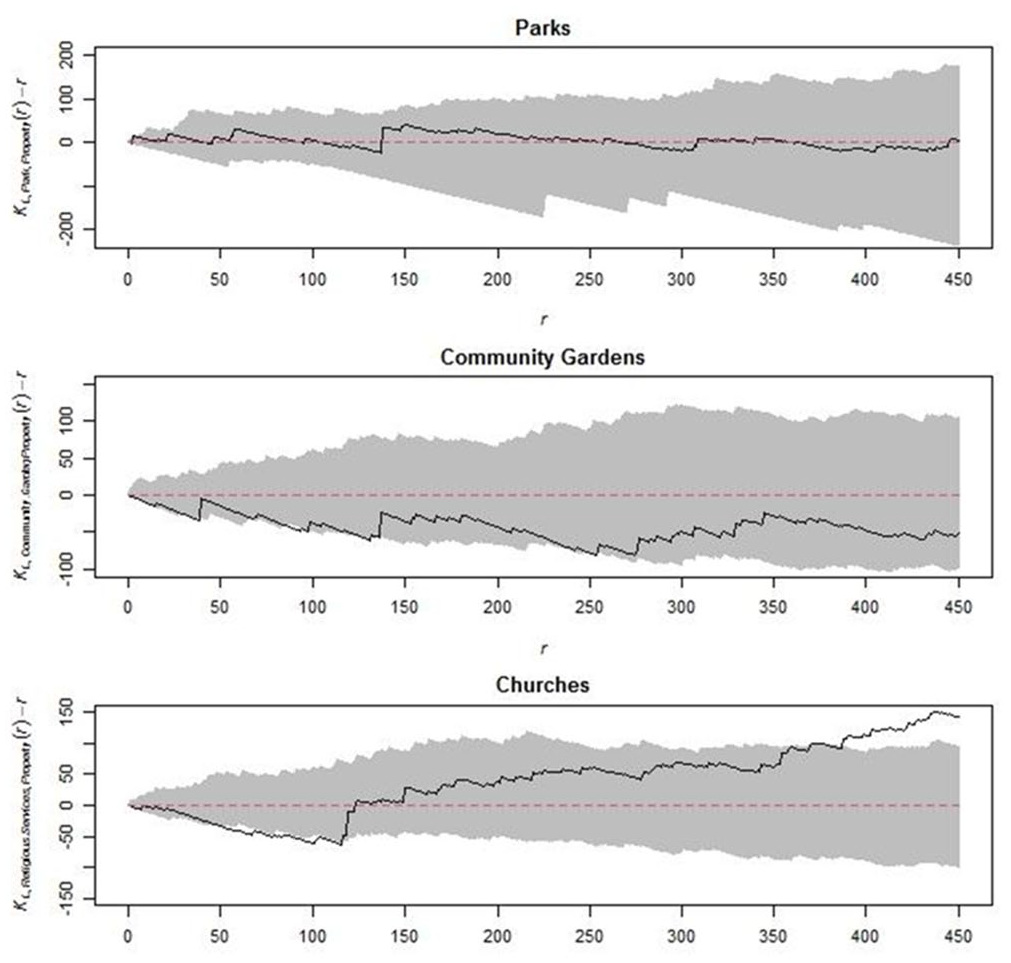
Network bivariate K-function results: CFS related to property crimes (2014–2015).
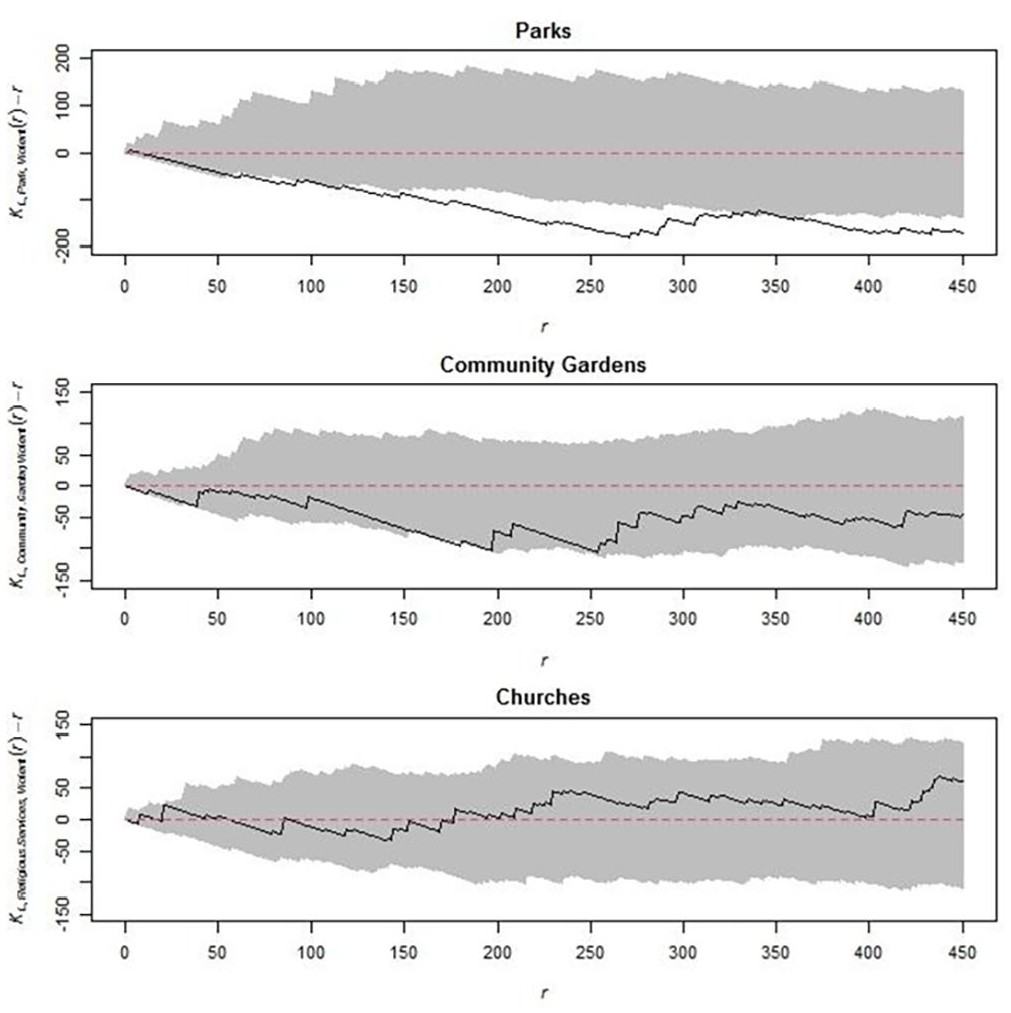
Network bivariate K-function results: CFS related to violent crimes (2014–2015).
For property crimes (see Figure 5), we observe no evidence of repulsion for parks. For community gardens, the association is consistently negative across the distance analyzed, but not statistically significant. There is statistically significant evidence of repulsion at close distances for churches (<125 ft). Not only does this effect dissipate after 125 ft, but it appears to reverse. At distances of 125 to 450 ft, churches appear to attract crime. This would translate to the area roughly half a block from a church to about two blocks away.
For violent crime (Figure 6), parks show strong evidence of repulsion both in terms of directionality and statistical significance. Repulsion reaches statistically significant levels around 50 ft and is sustained up to 450 ft. Community gardens are negatively related to crime across the distances observed too, although the relationship does not reach statistical significance at any point. Finally, violent crime showed almost no relationship with churches, either negatively or positively.
In summary, the most compelling evidence of spatial repulsion was found for community gardens, followed by parks. Spatial repulsion was detected between community gardens and all crime types, as well as between parks and drug and violent crimes. Taking directionality and statistical significance both into account equally, strong evidence was found for parks being a repellent of violent crime and community gardens being a repellent of drug crime. Again, what this means is that there were fewer crimes related to drug or violent crime than would be expected by chance alone. Churches seemed to repel property crime at very close distances but were associated with attraction at greater distances for both drug and property crime. Thus, the weakest evidence was found for churches. The fact that churches garnered the weakest evidence as repellents is somewhat surprising given that churches received the most specific mentions to this effect in our narrative data. That is, while churches did not receive the most mentions overall for being positive spaces in the neighborhood, people most often identified churches specifically as safe havens or crime repellents compared to parks and gardens.
One possibility is that there may be substantial variation within places as well. Our analysis considers each type of place combined (i.e., all churches, all gardens, all parks). We highlight one specific church to illustrate why there may be more nuance at the ground-level and why our analysis may overshadow these complexities. Figure 7 shows a magnified image of network kernel density estimates depicted for violent crime for a particular area of the neighborhood. Of all positive comments made about churches across participants (25 total comments/excerpts), nearly half related to one church in particular (circled). As illustrated here, the area around this church indeed is relatively cold in terms of violent crime. Notably, the map for property crime looks similar (not shown). This church was recognized by many in our sample as a place that has, as one police officer put it, “really opened their doors to the community and tried to bring the community together.”
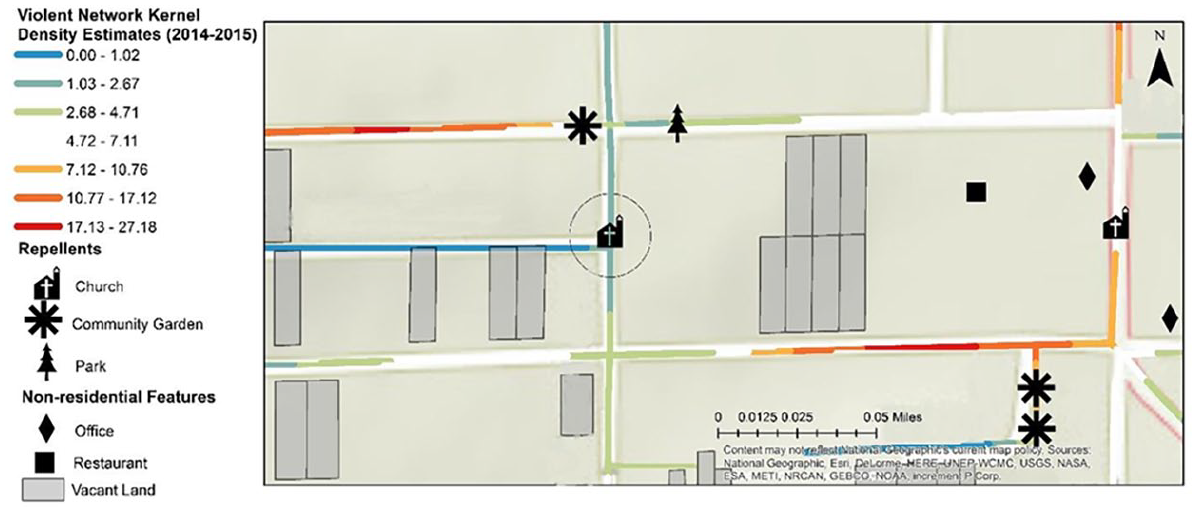
Neighborhood context around church.
Also instructive is how close the church is to a community garden and a park, which are located north of the church. This represents a cluster of positive places and there is relatively little to no crime in the immediate vicinity of these locations. However, to the west of the church are seven vacant lots and a carry-out restaurant. Indeed, vacant lots are established crime attractors/generators, as they may provide cover for illicit behavior or materials, easy escape routes, and may lead to perceptions of neighborhood decline (Branas et al., 2018; De Biasi, 2017). The parking lot of this particular carry-out was also identified by participants as a drug hub. On all sides of it is relatively more crime than in the area around the focal church. In short, there may be less crime than expected in the immediate area around the church, but just down the street, crime may flourish due to the presence of a nearby attractor or set of attractors. This map thus provides an interesting glimpse into the complex micro-environmental dynamics that may be at play within neighborhoods. There are micro-geographic characteristics that may fuel (carry-out restaurant, vacant lots), or suppress (focal church) crime. These characteristics may interact or compile to create crime patterns.
Discussion
Our study extends prior work by exploring the potential for certain places to act as crime repellents. Broadly speaking, our study is interested in crime distribution and the criminology of place, but specifically whether and why certain locations are relatively insulated from crime. While prior research examines the influence of theoretically relevant crime attractors or generators, little work has considered the alternative possibility—certain places may push crime away.
Our qualitative findings suggest that some places within a high-crime neighborhood could hold enough moral or community salience to protect the area around them from crime. Places identified by participants included churches, community gardens, and parks. Notably, an overarching theme of these three types of establishments is their association with children. Churches provide social and educational programs for children, spaces for them to play, and school supply drives. Community gardens include children as active participants and are a source of pride and cohesion in the community. Finally, parks are designated spaces built for children and families to engage in recreation. Given this theme in our findings, further research should consider the potential for places that are associated with children or designated for children to have a repelling effect on crime.
In general, all establishments were perceived by participants to play a positive role in the community, improving wellbeing and providing spaces for pro-social engagement. It is these qualities that were linked (in the minds of some participants) to them being insulated from crime. Indeed, our findings from interviews are interesting in their own right and raise compelling theoretical possibilities. Routine activities theory (Cohen & Felson, 2010) emphasizes the role of capable guardianship in dictating crime patterning (i.e., places that are less guarded should be more targeted) and place management theory (Eck, 2003) expands on this idea by further laying out the important role place managers play in limiting opportunities for crime in and around establishments (see also Eck & Madensen-Herold, 2018). Interestingly, parks and gardens are outdoor environments that are easily accessible to pedestrians and presumably less guarded than churches, which can have locked doors. While cameras may be erected in certain public outdoor spaces, churches should be more likely to have these security measures as well. However, contrary to these theoretical perspectives, when our participants discussed why they think some places are insulated from crime, they largely did not highlight concerns related to the likelihood of apprehension, detection or even opportunity; they spoke about moral significance and community.
Our quantitative results tell a more complicated story with respect to consistency in direction of relationships, how sustained relationships were across distances, and statistical significance. In terms of consistency of direction, the most compelling evidence of repulsion is found for community gardens. One possibility is that community gardens boast certain qualities of all three establishments. For one, like churches—the community gardens are often affiliated with, or run by, religious organizations. Second—and similar to parks—they are green spaces where families and children can engage in recreation and prosocial activity. Thus, it may be the combination of these factors that is so powerful. However, the relationship was only statistically significant for drugs. We alsofind evidence that parks may repel drug and violent crime, but not property crime. The relationship was particularly apparent for violence in terms of direction, distance sustained, and statistical significance. Surprisingly, given the emphasis on churches in the qualitative data, we find little evidence that churches repel crime in this locale. In fact, there were more property and drug crime than expected nearby churches (150–450 ft), although not in the immediate vicinity (0–150ft). One possibility is that the surrounding environment may be important, including land use and businesses present. For example, it could be that churches are more often located in close proximity to crime attractors (e.g., liquor store, bus stop, retail outlets) than parks or gardens. Thus, these establishments could complicate or confound the relationship.
Our quantitative findings are also tempered by three key limitations, some of which have already been introduced. First, the network bivariate K-function is a global measure. As such, it is unable to identify spatial relationships for specific establishments. The network bivariate K-function ignores physical and social attributes of the area around sites of interest that may affect crime. As it was earlier suggested, the presence of other crime attractors near sites that are under examination may influence study results. Second, our measure of crime is calls for service (CFS). While calls to the police cast a wider net than other administrative data such as incidents or arrests, they are biased by residents’ willingness to report crime (Porter et al., 2020). To that end, however, we surmise that call data around churches, parks, and community gardens may be inflated. If sentiments among our 35 participants are widespread in the neighborhood, residents may be particularly keen on protecting these areas from criminal activity and thus—more likely to call the police for crimes committed in or around these spaces. Our test may therefore be conservative. Third, we cannot make causal claims given the limitations of our data, nor can we generalize these findings to other neighborhoods. Although we cannot generalize out findings, we highlight the potential utility of our mixed methods approach for better understanding the dynamics within a given neighborhood. This approach could be utilized by researchers and practitioners alike to get a fuller picture of the social and environmental dynamics that shape crime distribution.
Our study raises interesting questions for future research. In particular, criminologists should devote more attention to understanding how offenders navigate their environment to make decisions about where to go, or not go, to conduct illicit behavior. These answers may be complex and could cut across theoretical traditions—including rational choice, opportunity, environmental, and subcultural perspectives. Indeed, the spatial distribution of crime likely reflects some combination of structure and agency. There are dynamics and processes at the ground-level that are pulling, but also pushing, crime. Decisionsare likely being made, but within an environment that is constraining, influencing and shaping those decisions. In order to understand these processes, researchers should focus on both structure and agency, and on environmental attributes that could pull or push crime. In sum, researchers should further explore where individualsgo to d and why, but also where they do not go - and why.
Footnotes
Declaration of Conflicting Interests
The author(s) declared no potential conflicts of interest with respect to the research, authorship, and/or publication of this article.
Funding
The author(s) disclosed receipt of the following financial support for the research, authorship, and/or publication of this article: This research was supported by the National Institute of Justice, Office of Justice Programs Award No. 2013-R2-CX-0004. The findings and conclusions expressed in this article are those of the authors and do not necessarily reflect those of the Department of Justice.
