
Abstract
When examining group-based differences in sentence length, researchers must manage an invariably right-skewed dependent variable. While some count-based approaches can mitigate sentence length’s overdispersion, the federal measure is continuous, and therefore, it is common to log-transform sentence length before entering it into a (single- or multi-level) linear model. Using federal sentencing data from 2018 to 2022, we show that modeling sentence length in its logged form does not “solve” the issue it sets out to—it simply saddles estimates with an analogous issue. Moreover, by product of the logarithmic function’s non-linearity and racial/ethnic differences in sentence types, the log-transformation (1) produces racial/ethnic differences non-reflective of reality and (2) kickstarts a process through which racial/ethnic effects are differentially generated.
Introduction
A surplus of studies have relied on regression-based techniques to isolate racial/ethnic differences in sentence length (Feldmeyer & Ulmer, 2011; Kim et al., 2015; Light, 2014; Ulmer et al., 2011a; USSC, 2010, 2012, 2023). Since sentence length is, by nature, right-skewed, researchers are invariably forced to correct their regression models for overdispersion. Some scholars have satiated this problem using analytic techniques that tacitly adjust for skew, such as Hurdle or Negative Binominal regression (see Hester & Hartman, 2017). These specialized approaches withstanding, the standard approach in federal sentencing research is to log-transform sentence length before entering it as the dependent variable in a multi-level, linear, model (Feldmeyer & Ulmer, 2011; Holmes & Feldmeyer, 2024; Kim et al., 2019; Light, 2014; Testa & Lee, 2021; Ulmer & Parker, 2020). The purpose of this study is to illuminate how the modal practice of log-transforming sentence length prior to regression modeling creates substantive problems of its own and, as a result, obscures basic conclusions across race/ethnicity.
Two key insights lay the groundwork for this inquiry. First, a log-transformation is a non-linear data transformation. By product of the logarithmic distribution’s flattening approaching 0 and higher underlying values, it simultaneously (1) exaggerates differences that exist among acutely short sentences and (2) diminishes differences that exist among particularly long sentences. To illustrate this phenomenon, the difference between a 0.03-month (what the federal sentencing data counts as 1-day; Kitchens, 2019) and 10.03-month sentence equates to roughly 5.81 natural log units. That same increase between 60- and 70-months? Just 0.15 natural log units. Second, and related to the point above, the log-transformation’s non-linearity creates material problems for between-group comparisons when groups are differentially exposed to the logarithmic distribution’s flattened poles. In other words, if White sentences are more concentrated at the lower end of the distribution than Black sentences, a log-transformation will exaggerate just how short White sentences are relative to Black sentences. In the same vein, if White sentences extend farther out into the distribution than Hispanic sentences, a log-transformation will exaggerate just how similar White sentences are relative to Hispanic sentences. As we will show, uneven concentrations of racial/ethnic groups within logarithmic poles generate a log-transformed dependent variable that (1) bears little resemblance to the underlying sentence length metric and (2) differentially generates multivariate racial/ethnic effects.
While this study has a manifestly empirical focus, it also has relevance for theory and policy. For starters, this research highlights a schism between statistics and lived-experience. Humans do not experience time in a logged form. That is, 1 month is roughly 30 days regardless of whether one is comparing 0-to-1 months or 1-to-2 months. Of course, one could argue that 1-month additions to 1-day and 1-month sentences are qualitatively different—and they would have a point—but the log-transformation takes this argument too far by treating the difference between the shortest federal prison sentence (0.03) and next integer value (1.03) as 37% of the overall distribution. 1 With reference to policy, the independent agency within the federal judiciary charged with giving feedback to the courts (the United States Sentencing Commission or USSC, 2010, 2012, 2023) has consistently used a log-transformed OLS approach in their multivariate analyses. USSC analyses are used by government entities when making policy decisions and have been cited in Supreme Court opinions (e.g., Pulsifer v. United States, 2024). To the extent that the agency with a “direct line” to government decision making uses this analytic technique (USSC, 2010, 2012, 2023), and the technique has a fundamental shortcoming unaddressed in research to date, revealing the issue is requisite to producing a strong evidence-base for policy.
To achieve this study’s goals, we leverage data on all federal criminal sentences in United States District Courts from January 2018 to September 2022 (the most recent data as of this writing). The remainder of this paper is structured as follows. First, we discuss the log-transformation’s role in, and implications for, isolating racial/ethnic effects on sentence length. Second, we outline the data and method used. Third, we compare model diagnostics, as well as descriptive and multivariate racial/ethnic differences, based on (1) original and (2) log-transformed sentence length. To conclude, we summarize the results, as well as provide implications for policy, research, and theory.
Background
Modeling Racial/Ethnic Differences in Sentencing
Researchers have long debated the “proper” way to model, or isolate the effect of, race/ethnicity on sentencing. Some of the earliest sentencing studies were purely descriptive (e.g., Bedau, 1965; Martin, 1934) and therefore critiqued by methodologists who pointed out that racial/ethnic differences could be the natural product of group-variance in underlying criminal conduct (Hagan, 1974; Kleck, 1981, 1985). The promulgation of sentencing guidelines in the 1970s and 1980s allowed sentencing scholars to address these methodological concerns and tightly control for offense severity and criminal history. Although the inclusion of legally relevant variables explained most racial/ethnic variance, significant differences on the basis of defendant race/ethnicity persisted (Spohn, 2000; Zatz, 1987). Into today, research shows that Black and (less consistently) Hispanic defendants receive more punitive sentences than similarly situated Whites (Doerner & Demuth, 2010, 2014; Mitchell, 2005; Holmes & Feldmeyer, 2023; Ulmer et al., 2011a; but see Light, 2022).
Conversations over archetypical analytic techniques have not stopped. Today, space in major academic journals is taken up by scholars deliberating which legally relevant controls to use (Holmes & Feldmeyer, 2024), which models to employ (Franklin, 2015; Hester & Hartman, 2017), and the most effective ways to manage selection bias (Bushway et al., 2007). The time has come for another methodological discussion, however. This time the topic is the standard treatment of sentence length’s inevitable right-skew (Holmes & Feldmeyer, 2024; Light, 2022; Ulmer & Parker, 2020). The standard medicine for sentence length’s overdispersion is a log-transformation, but, as we discuss below, the latent consequence of the log-transformation is a misrepresentation of the exact racial/ethnic differences under examination.
Managing Sentence Length
Federal sentencing scholars have focused on several outcomes ranging incarceration (Franklin & Henry, 2020), downward departure (Johnson & Betsinger, 2009), upward departure (Holmes et al., 2020), and pre-sentence adjustment (Shermer & Johnson, 2010). Nevertheless, the most commonly analyzed outcome variable in federal sentencing research is prison sentence length (Feldmeyer & Ulmer, 2011; Holmes & Feldmeyer, 2024; Light, 2014, 2022). When examining sentence length, an immediate analytic decision scholars must make is whether to employ a count or linear model. Many sentencing commission datasets code sentence length in integer form (e.g., 1, 2, 3, . . .), and therefore necessitate count-based models such as Poisson, Hurdle, or Negative Binominal Regression (Hester & Hartman, 2017; Hilbe, 2014; Long & Freese, 2014). In the federal sentencing data, however, the sentence length measure is continuous—including values such as 0.03 (1-day), 35.3 (35 months and 10 days), and 97.33 (97 months and 11 days; Kitchens, 2019). Naturally, then, the typical federal sentencing study employs a (single- or multi-level) linear regression model (Brennan & Spohn, 2009; Kim et al., 2019; Ulmer et al., 2011b; USSC, 2023).
With the linear regression model picked out, the researcher knows they must sate particular model assumptions—such as independence, homoscedasticity, and normality (Fox, 2015). With reference to normality, sentence length as an outcome variable has been identified as particularly problematic because it is invariably right-skewed (Doerner & Demuth, 2010, 2014; Kim et al., 2016, 2019; Ulmer et al., 2011b; USSC, 2012). In other words, although most federal prison sentences are less than 2 years, the full distribution includes 10-, 15-, and 27-year sentences in the 90th, 95th, and 99th percentiles, respectively (see Figure 1a). Of course, the linear model does not assume the dependent variable is normally distributed—it assumes the residuals are normally distributed—but models with a skewed dependent variable often produce skewed residuals (depicted later in Figure 3; Hilbe, 2014). Beyond normality concerns, the worry also exists that exorbitantly long sentences will have undue influence (i.e., act as outliers).
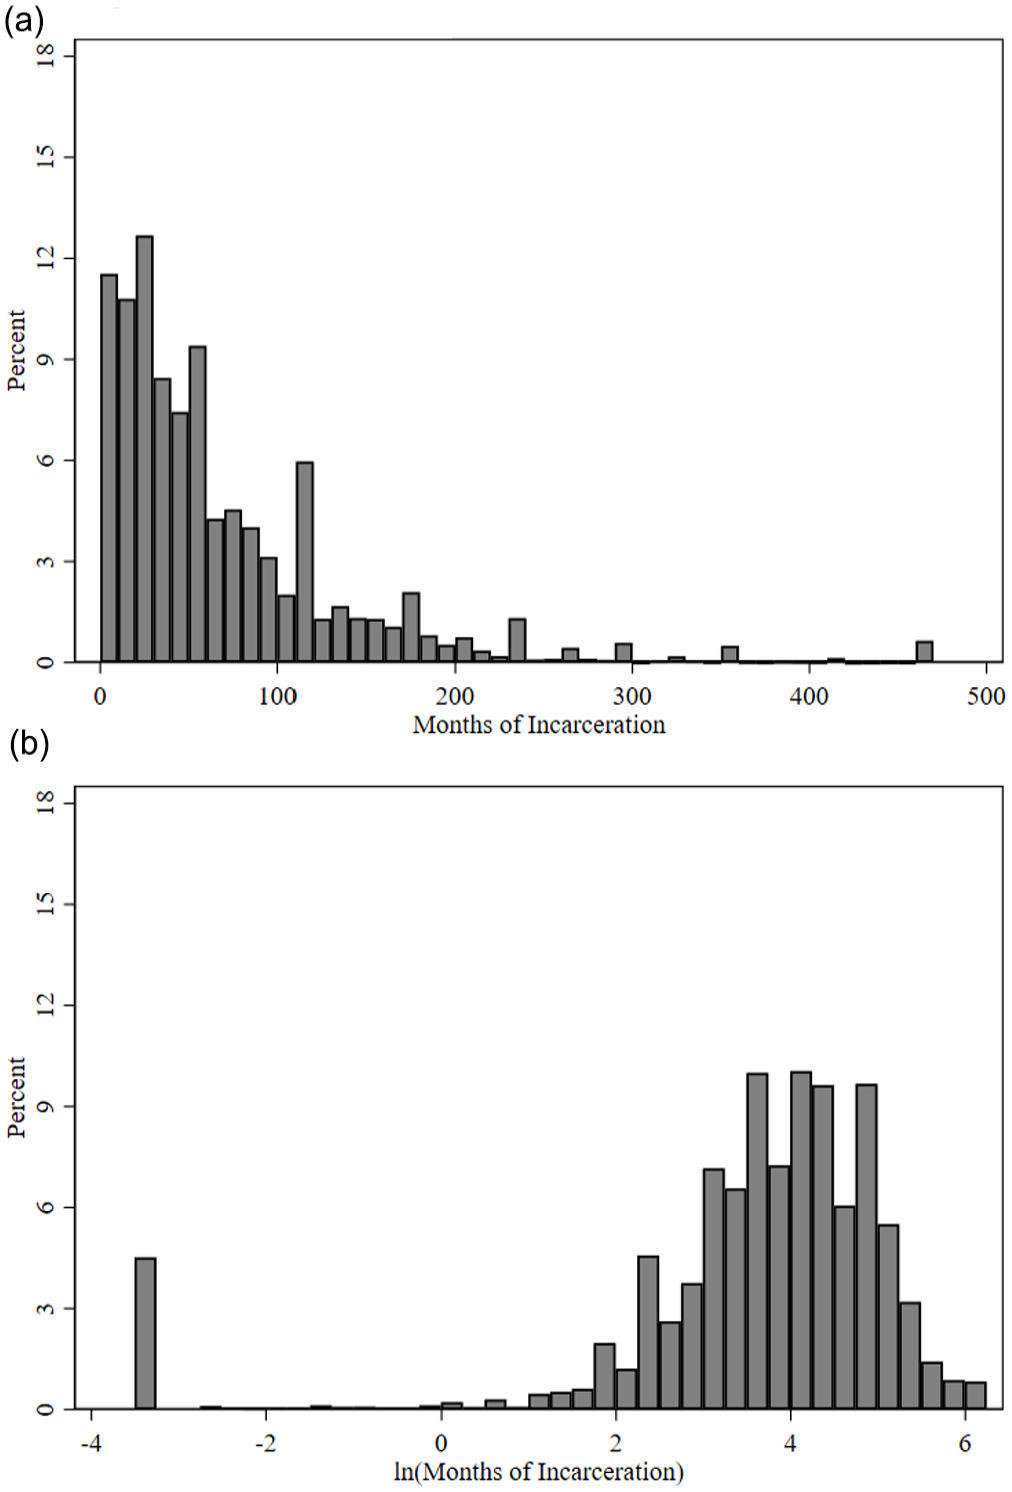
Histogram of sentence length in original and log-transformed metric: (a) original sentence length and (b) log-transformed sentence length.
Bearing these normality and outlier concerns in mind, scholars employing the standard linear approach often log-transform sentence length before entering it into the regression model (Anderson & Spohn, 2010; Kim et al., 2015; Steffensmeier et al., 2017; Ulmer et al., 2011b; Ulmer & Parker, 2020; USSC, 2023). On first glance, the log-transformation is the medicine the model needs. Sentence length is made up of positive, real, numbers—making all its values subject to the logarithmic distribution (see Footnote 2 on 0’s). 2 Moreover, as depicted on the right side of Figure 2, the log-transformation is a non-linear data transformation—meaning it will suppress the magnitude of differences amongst extremely long sentences and, therefore, ameliorate right-skew.

The log-transformation’s non-linearity: Original sentence length by log sentence length.
These benefits withstanding, the exact characteristic of the log-transformation which reduces right-skew—its non-linearity—produces left-skew and small value outliers. This situation arises because, as shown on the left side of Figure 2, the log-transformation exponentially embellishes differences amongst small values (ln[0.03] = −3.51; ln[0.1] = −2.30; ln[0.5] = −0.69; ln[1.03] = 0.03). The rapid degeneration in log sentence length as original sentence length (never quite) reaches 0 is a material issue for federal sentence length models because a sizeable number of federal sentences are less than 1 month—therefore highly vulnerable to the log-transformation’s small value embellishment. Figure 1b clearly visualizes this modeling problem. As evidenced by the constricted x-axis and more equal distribution of cases across positive-value bins (relative to Figure 1a), log-transforming sentence length does impose a more normal distribution amongst larger values. However, it simultaneously leaves behind a sizeable left-tail because 7% of cases receive dispositions between 0.03- and 0.1-months, which are coded as ≤−2 natural log units. Clearly, then, log-transforming federal sentence length does not solve skew or impose a normal distribution on the measure (its original intent), instead it creates left-skew and leaves the distribution non-normal.
The potential for the log-transformation to have unintended consequences does not stop at issues of model fit—it extends to between-group comparisons. Put simply, when two groups are differentially exposed to the log-transformation’s (1) small value embellishment or (2) large value suppression, sentence length and log sentence length become qualitatively different metrics. To illustrate this possibility, Scenario 1 in Table 1 presents two groups comparable in all but their sentences of less than a year (Group A receives the shortest sentences more often). When original sentences are compared the average difference in sentence length is 0.31%. However, when log sentences are compared the average difference is 18.86%. Why? Because the log-transformation cartoonishly deflates sentences of less than a year—dragging down average sentences for Group A to a greater degree than Group B. A similar issue exists when groups unevenly receive particularly long sentences. That is, as shown in Scenario 2 of Table 1, when two groups are similar in all but the longest sentences there will be larger differences in original sentence length (4%) than logged sentence length (1%) because the log-transformation deflates differences amongst longer, not embellishes differences among shorter, values.
Illustration of Potential for Log-transformation to Obscure Group-based Differences in Underlying Metric.
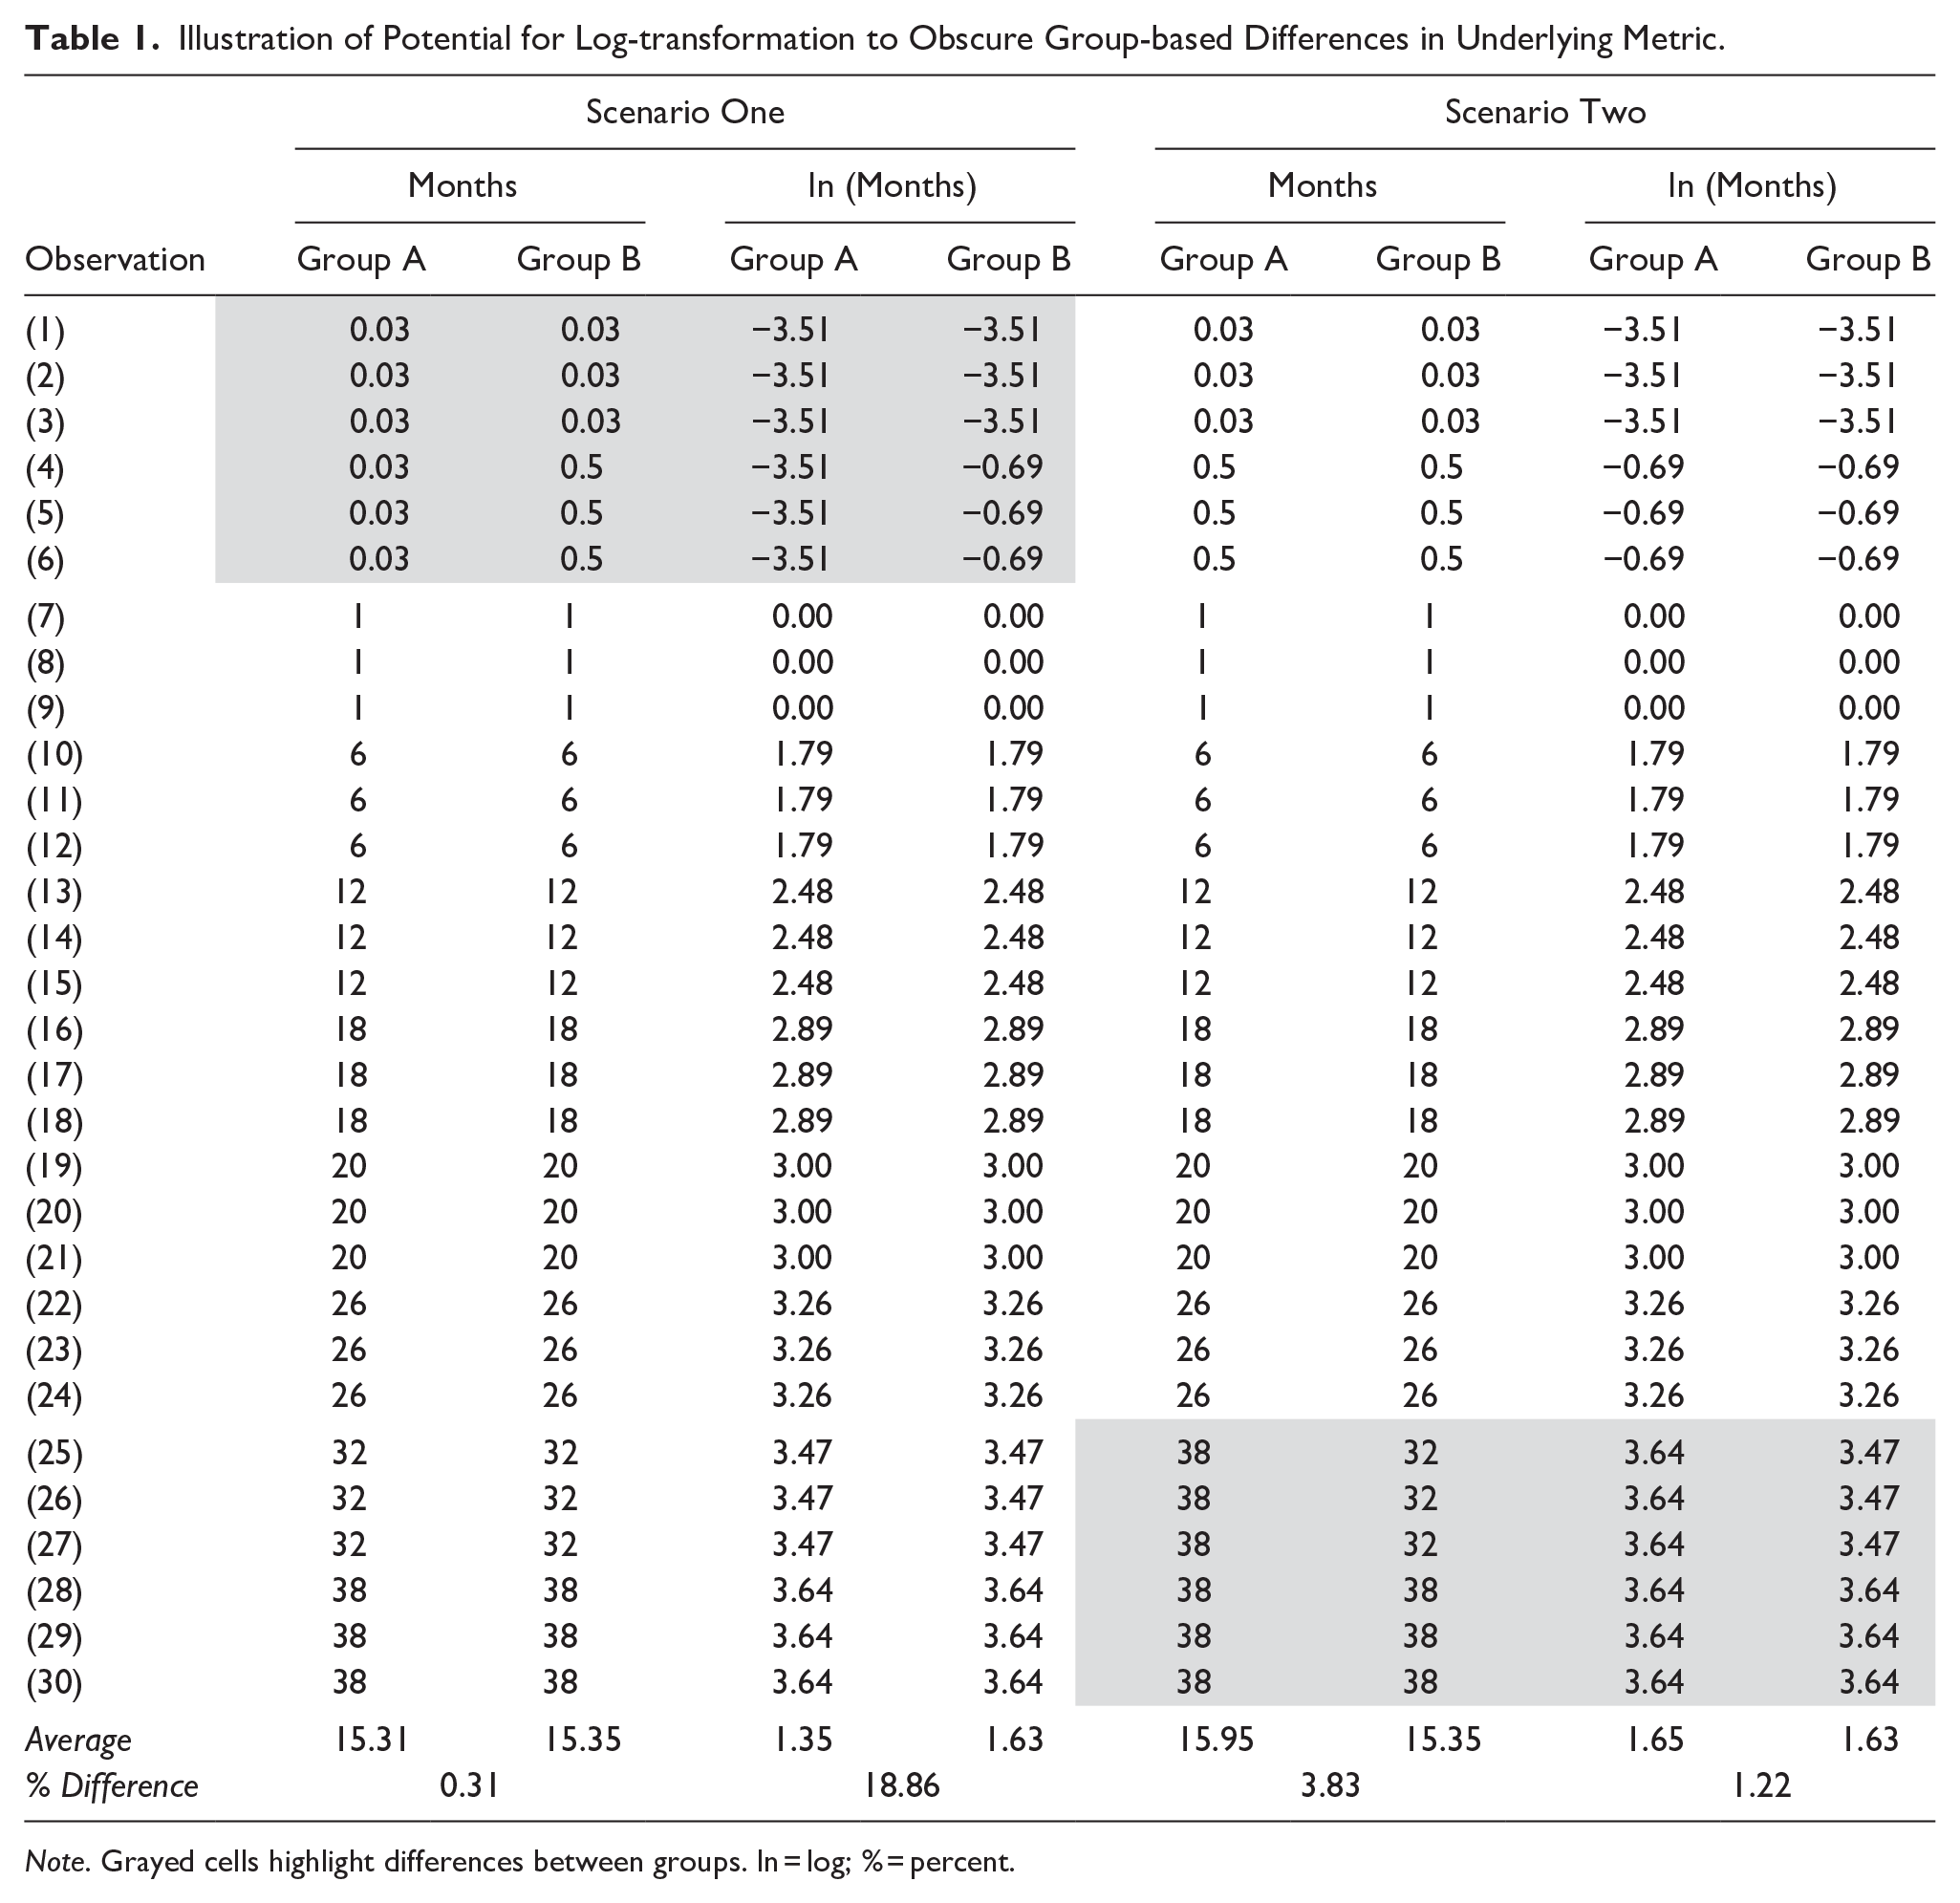
Note. Grayed cells highlight differences between groups. ln = log; % = percent.
Against the backdrop of these concerns, the goal of this study is to look “under the hood” of sentence length’s standard log-transformation. By doing so, we illuminate how this typical practice fails to solve the skewness problem it sets out to, instead saddling the model with an analogous problem. In addition, we demonstrate how White sentences play into a key vulnerability of the log-transformation—ultimately producing racial/ethnic differences contingent on outcome operationalization.
Data and Method
Data for this study come from the United States Sentencing Commission’s Monitoring of Federal Criminal Sentences data series. These data are published annually and include all felony and serious misdemeanor criminal cases sentenced in United States District Courts (the trial courts of the federal system; Kitchens, 2019). Aligning with prior research, we exclude cases with a juvenile defendant, disposed of in a territory district, with a focal immigration offense, and with missing information (Holmes & Feldmeyer, 2024; Johnson et al., 2021). The final analytic sample includes 174,215 cases sentenced across 90 districts from January 1, 2018 to September 30, 2022 (the most recent data as of this writing).
Dependent Variable
This study has two outcome variables, both rooted in prison sentence length. Our first, what we call original sentence length, is operationalized as the months of incarceration ordered by the judge at sentencing (top-coded at 470 months to reflect life sentences; USSC, 2010, 2012, 2023). Our second, log sentence length, is the natural log of original sentence length. Our models follow the standard practice of past research by examining sentence length amongst those sentenced to prison (see Kim et al., 2015; Spohn et al., 2014; Testa & Lee, 2021; USSC, 2023). However, as we return to in the discussion section and Appendix B, the decision to omit those not sentenced to prison is consequential for the log-transformation because retaining them requires the addition of a constant (Light, 2022; USSC, 2012).
Independent Variable(s)
Defendant race/ethnicity is the primary independent variable. Similar to past federal sentencing research (see Kim et al., 2015; Ulmer & Parker, 2020), race/ethnicity is coded using a series of dichotomous variables representing White (ref.), Black, Hispanic, and Other. Alongside race/ethnicity, we include a battery of legal and extralegal controls. In terms of legal controls, we account for between-group differences in case severity using guideline presumptive sentence (ranging from 0 to 470 months, logged in regression models). 3 Past research suggests that criminal history has an added, curvilinear, effect on punishment above and beyond its contribution to presumptive sentence, so we also include controls for guideline criminal history category and its squared term (Holmes & Feldmeyer, 2019; Ulmer, 2000). Other legal controls, having to do with case processing, include mandatory minimum eligibility (1 = Yes), government-sponsored departure (1 = Yes), multiple conviction counts (1 = Yes), trial (1 = Yes), pre-sentence detention (1 = Yes), and focal offense type (1 = Economic, Firearm, Violent, Sex, Other; ref. = Drug). Our extralegal controls are defendant sex (1 = Male), age (years), age-squared (years 2 ), educational attainment (1 = High School Graduate, Some College, College Graduate; ref. = Less than High School Diploma), citizenship status (1 = Non-Citizen), and sentencing year (1 = 2019, 2020, 2021, 2022; ref. = 2018). As discussed below, we adjust for sentencing district by using it as the level 2 grouping variable in a multi-level model.
Analytic Plan
This study’s primary analytic tool is the multi-level ordinary least squares (OLS) regression model, with cases nested within districts. The multi-level approach has been well established in past sentencing works (Johnson et al., 2008; Kim et al., 2019; Light, 2014; Ulmer & Parker, 2020) but is particularly well suited to this study because it (a) adjusts for inter-district correlation in sentencing and sentencing predictors and (b) allows for case-level effects to vary randomly across districts. Unconditional models show significant variance at the district-level—5% and 7% in original and log sentence length, respectively—further underlining the appropriateness of the approach. 4 When case-level predictors are modeled, all are allowed to vary randomly across district (besides squared terms), they are grand-mean centered to allow for caseload compositional effects (e.g., % Black or % trial on district average sentence lengths), and robust standard errors are used.
The following analysis takes place in three stages. In the first stage we examine the distribution of residual terms from two multi-level models: one examining original sentence length and one examining log sentence length. The goal of this exercise is to critically investigate the problem with modeling sentence length in its original form, as well as understand how log-transforming sentence length fails to solve the issue. In the second stage we descriptively contrast original and log sentence length across racial/ethnic groups. This rudimentary comparison serves to demonstrate how the log-transformation’s non-linear poles unevenly impact racial/ethnic groups—ultimately producing qualitatively different variables. In the final stage, we sequentially model sentence length in its original and log-transformed metric. For each dependent variable, Model 1 sets the baseline for racial/ethnic effects after only accounting for district, Model 2 adds legal controls, and Model 3 adds extra-legal characteristics. Sequentially modeling, as opposed to only examining fully specified racial/ethnic effects, allows us to understand how racial/ethnic effects are uniquely generated (for similar practice see Holmes & Feldmeyer, 2024; Ulmer et al., 2016).
Results
The Justification for the Log-Transformation
To briefly review, the log-transformation has largely been justified on the grounds that sentence length in its original form is heavily right-skewed (as shown in Figure 1a above), and therefore will produce abnormal standard errors and outliers (Holmes & Feldmeyer, 2024; Kim et al., 2015; Ulmer & Parker, 2020). One way to assess this position is to visually plot the multi-level model’s residuals against quantiles of a normal distribution. As visualized in Figure 3a, residuals from a fully-specified model with sentence length in its original form diverge from the normal distribution at higher values, signifying heavy right skew and outliers when sentences are particularly punitive. Another, numerical, way to assess the normality of residuals is through a Shapiro-Wilks test. When this test is done, we again find evidence of abnormal, skewed, and residuals (W = 0.849, p < .001). Therefore, like past research warns, modeling sentence length in its original form produces non-normal error terms and outliers.
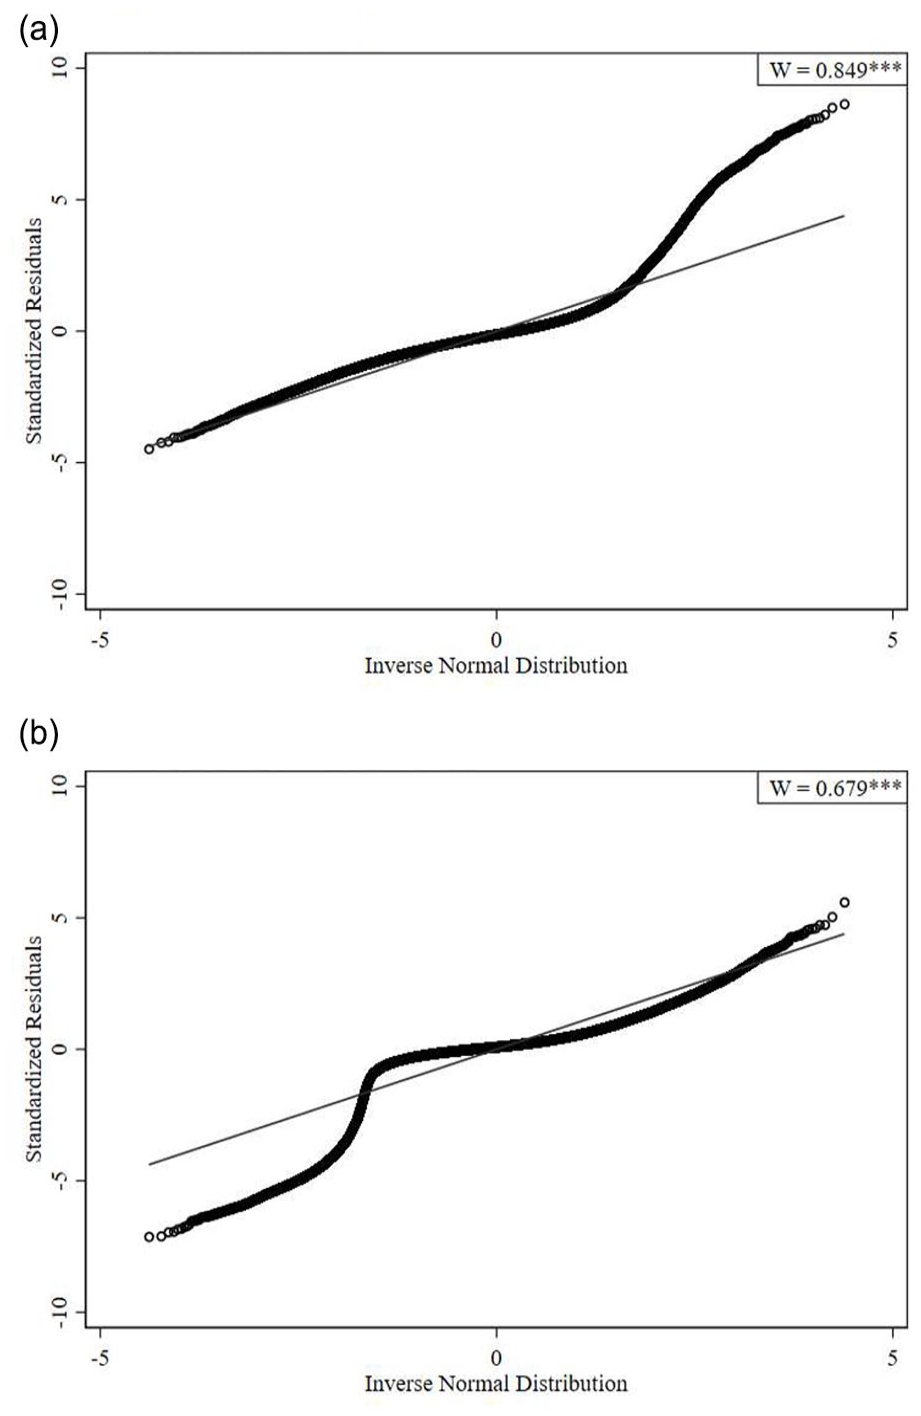
Standardized residuals by quantiles of normal distribution: (a) original sentence length and (b) log-transformed sentence length.
Theoretically, a log-transformation is the medicine that original sentence length needs to sate the normality assumption and undue influence (i.e., its non-linearity will soothe over differences amongst larger values). However, as demonstrated in Figure 3b, the exact diagnostics tests from models with sentence length in its logged form show this not to be the case. That is, log-transforming sentence length simply inverses the residuals to begin diverging at the lower (not higher) end of the normal distribution. In addition, the Shapiro-Wilks test continues to imply problematic residual terms (W = 0.679, p < .001). Bearing this in mind, the common practice of log-transforming sentence length does not assuage sentence length’s normality problem, it creates one of its own.
Implications of the Log-Transformation for Racial/Ethnic Comparisons
Clearly, the decision to model sentence length in its original or logged form impacts basic model fit issues (or the lack thereof). How does this decision impact comparisons across race/ethnicity, however? To begin to unpack this question, Table 2 depicts White, Black, and Hispanic punishments across sentence length operationalizations (full sample descriptives available in Appendix A). Analyses of sentence length in its original metric show White defendants receive 2.7-month longer sentences than Black defendants and 12.9-month longer sentences than Hispanic defendants. Meanwhile, analyses of sentence length in its logged form show White defendants receive shorter sentences than Black defendants and a much smaller Hispanic-White gap (just 2%, not 18%).
Distribution of Sentence Length Across Racial/Ethnic Groups and Operationalization.
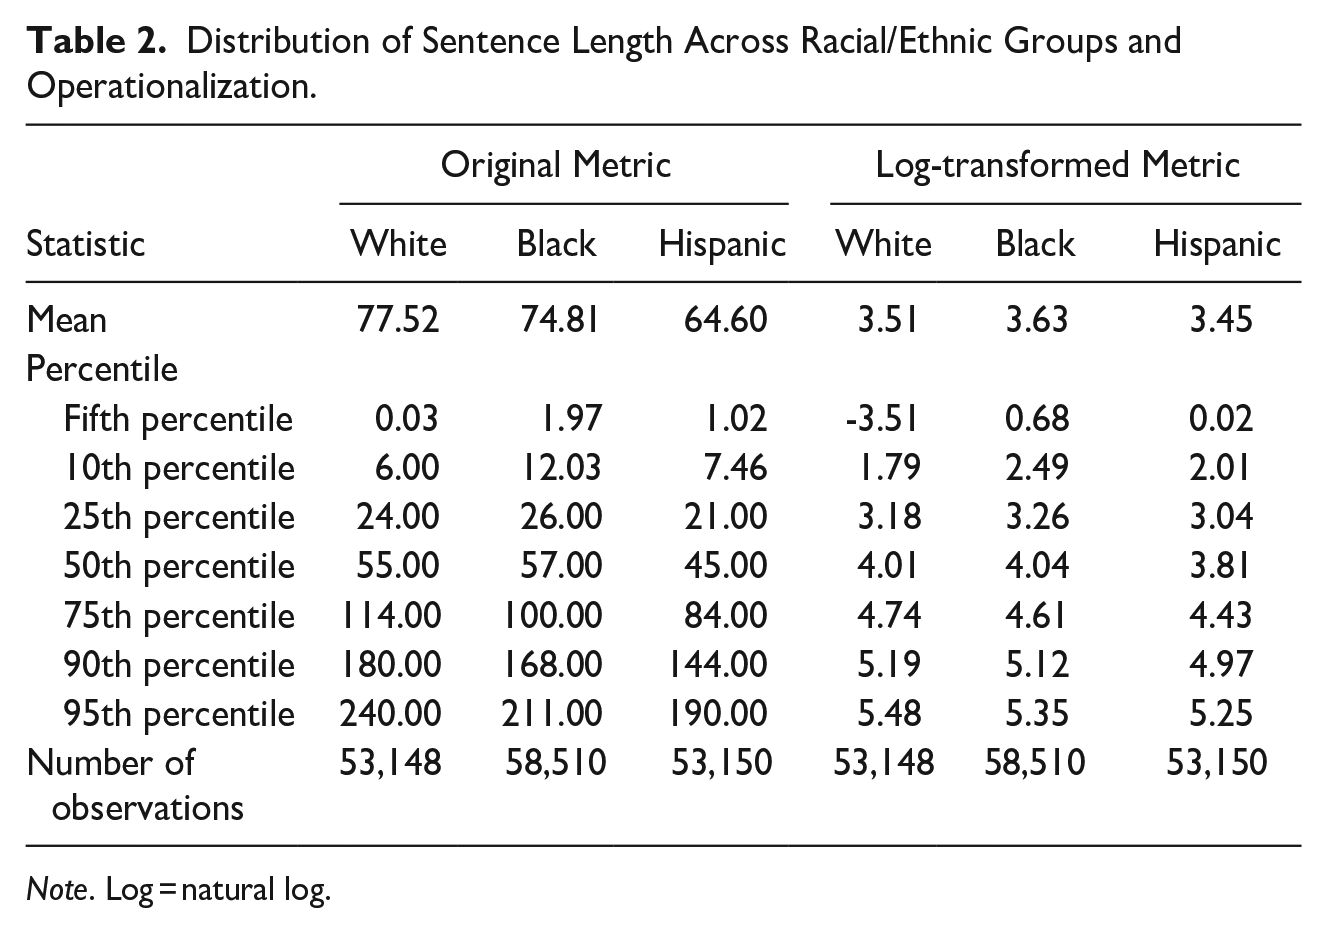
Note. Log = natural log.
Why do these two metrics—both rooted in the same underlying variable—show always substantive, and sometimes directional, differences across race/ethnicity? Two reasons, both having to do with the non-linear poles of the logarithmic distribution. First, racial/ethnic groups are unevenly impacted by the log-transformation’s embellishment of just how short less than 1-month sentences are. As shown in Figure 4 log-transforming sentence length trades right-skew for left-skew for all racial/ethnic groups but especially Whites. About 7% of White defendants garner less than 1-month dispositions—the sentences most impacted by the log-transformation’s small value embellishment—compared to just 4% of Black and Hispanic defendants, respectively. Consequentially, the log-transformation floods the White sample with cartoonishly short sentences—dragging their average sentences downwards to a greater degree than other racial/ethnic groups. It is hard to overstate how important White overrepresentation in particularly short sentences is for producing incongruent original and log-transformed sentence length metrics but consider that despite 5,000 more Black individuals being sentenced in federal courts (White = 53,148, Black = 58,510) White defendants received 500 more 1-day sentences (White = 2,886, Black = 2,381).
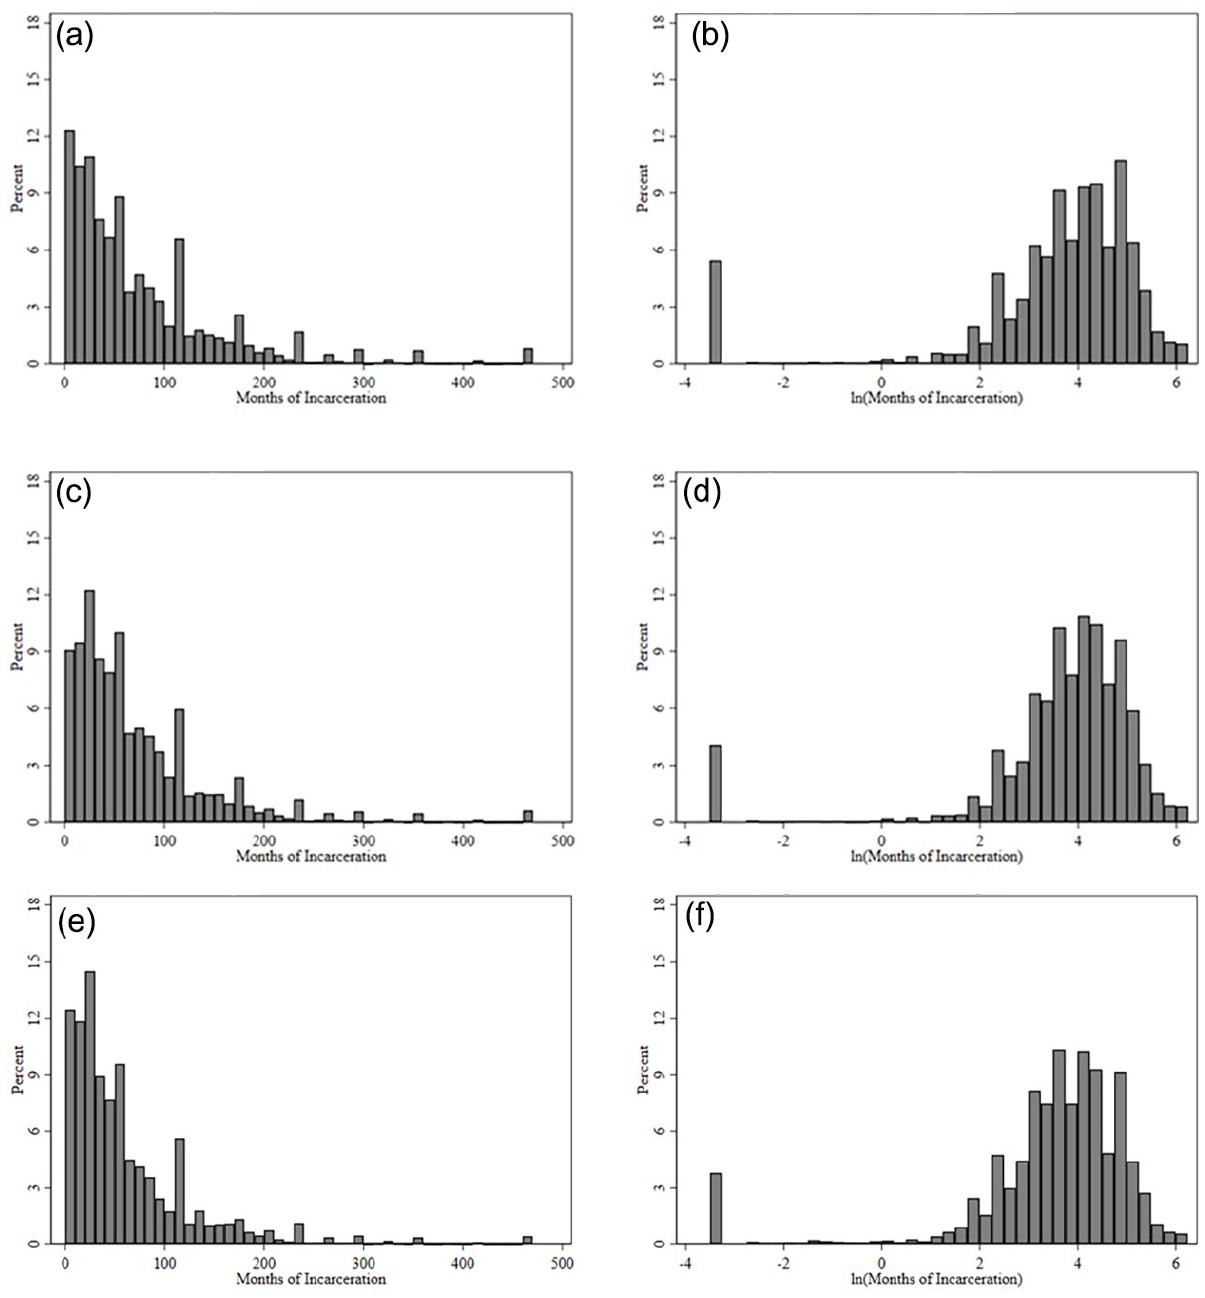
Distribution of sentence length across racial/ethnic groups and operationalizations: (a) White—sentence length, (b) White—log transformed sentence length, (c) Black—sentence length, (d) Black—log transformed sentence length, (e) Hispanic—sentence length, and (f) White—log transformed sentence length.
Second, racial/ethnic groups—again, particularly Whites—differentially extend out into the sentence length distribution and therefore are unevenly impacted by the logarithmic distribution’s diminishment of large value differences. To illustrate, Table 2 shows that the 90th and 95th percentile of White original sentences are 22% and 23% longer than Hispanic original sentences. However, when we look at these same distributional differences in log form the Hispanic-White gaps at the 90th and 95th percentile are just 4% and 4%, respectively. The same phenomena can be seen for Black-White comparisons: the Black-White gap at the 95th percentile is 13% in original form, but just 2% in log form. Consequently, White sentences play into a dark underbelly of the log-transformation—benefiting from both its (a) exaggeration of short and (b) suppression of long sentences to produce racial/ethnic comparisons non-reflective of how racial/ethnic groups are actually sentenced relative to one another.
Comparing Racial/Ethnic Effects from Multivariate Models
Up to this point, we have demonstrated that (1) log-transforming sentence length does not fix the model fit issue it sets out to and (2) sentence length and log sentence length are distinct metrics. A logical question one may still have is: how does this impact the racial/ethnic effects gleaned from the standard multivariate model that sentencing researchers have relied on for decades?
Model 1 in Table 3 begins to answer this question by estimating two multi-level models, one with original sentence length and one with log sentence length, using only race/ethnicity as a predictor. In the original metric model Black and Hispanic effects are null—suggesting that district (the level 2 grouping variable) explains why Whites receive longer sentences than minorities. Meanwhile, in the log-transformed model Black and Hispanic effects are positive and significant, suggesting that inter-district differences cannot account for (a) why Black defendants receive longer log sentences than Whites and (b) why the Hispanic-White log sentence length gap is not greater than 0.06 units.
Multi-Level OLS Regression Models Examining the Predictors of Federal Sentence Length, 2018 to 2022.
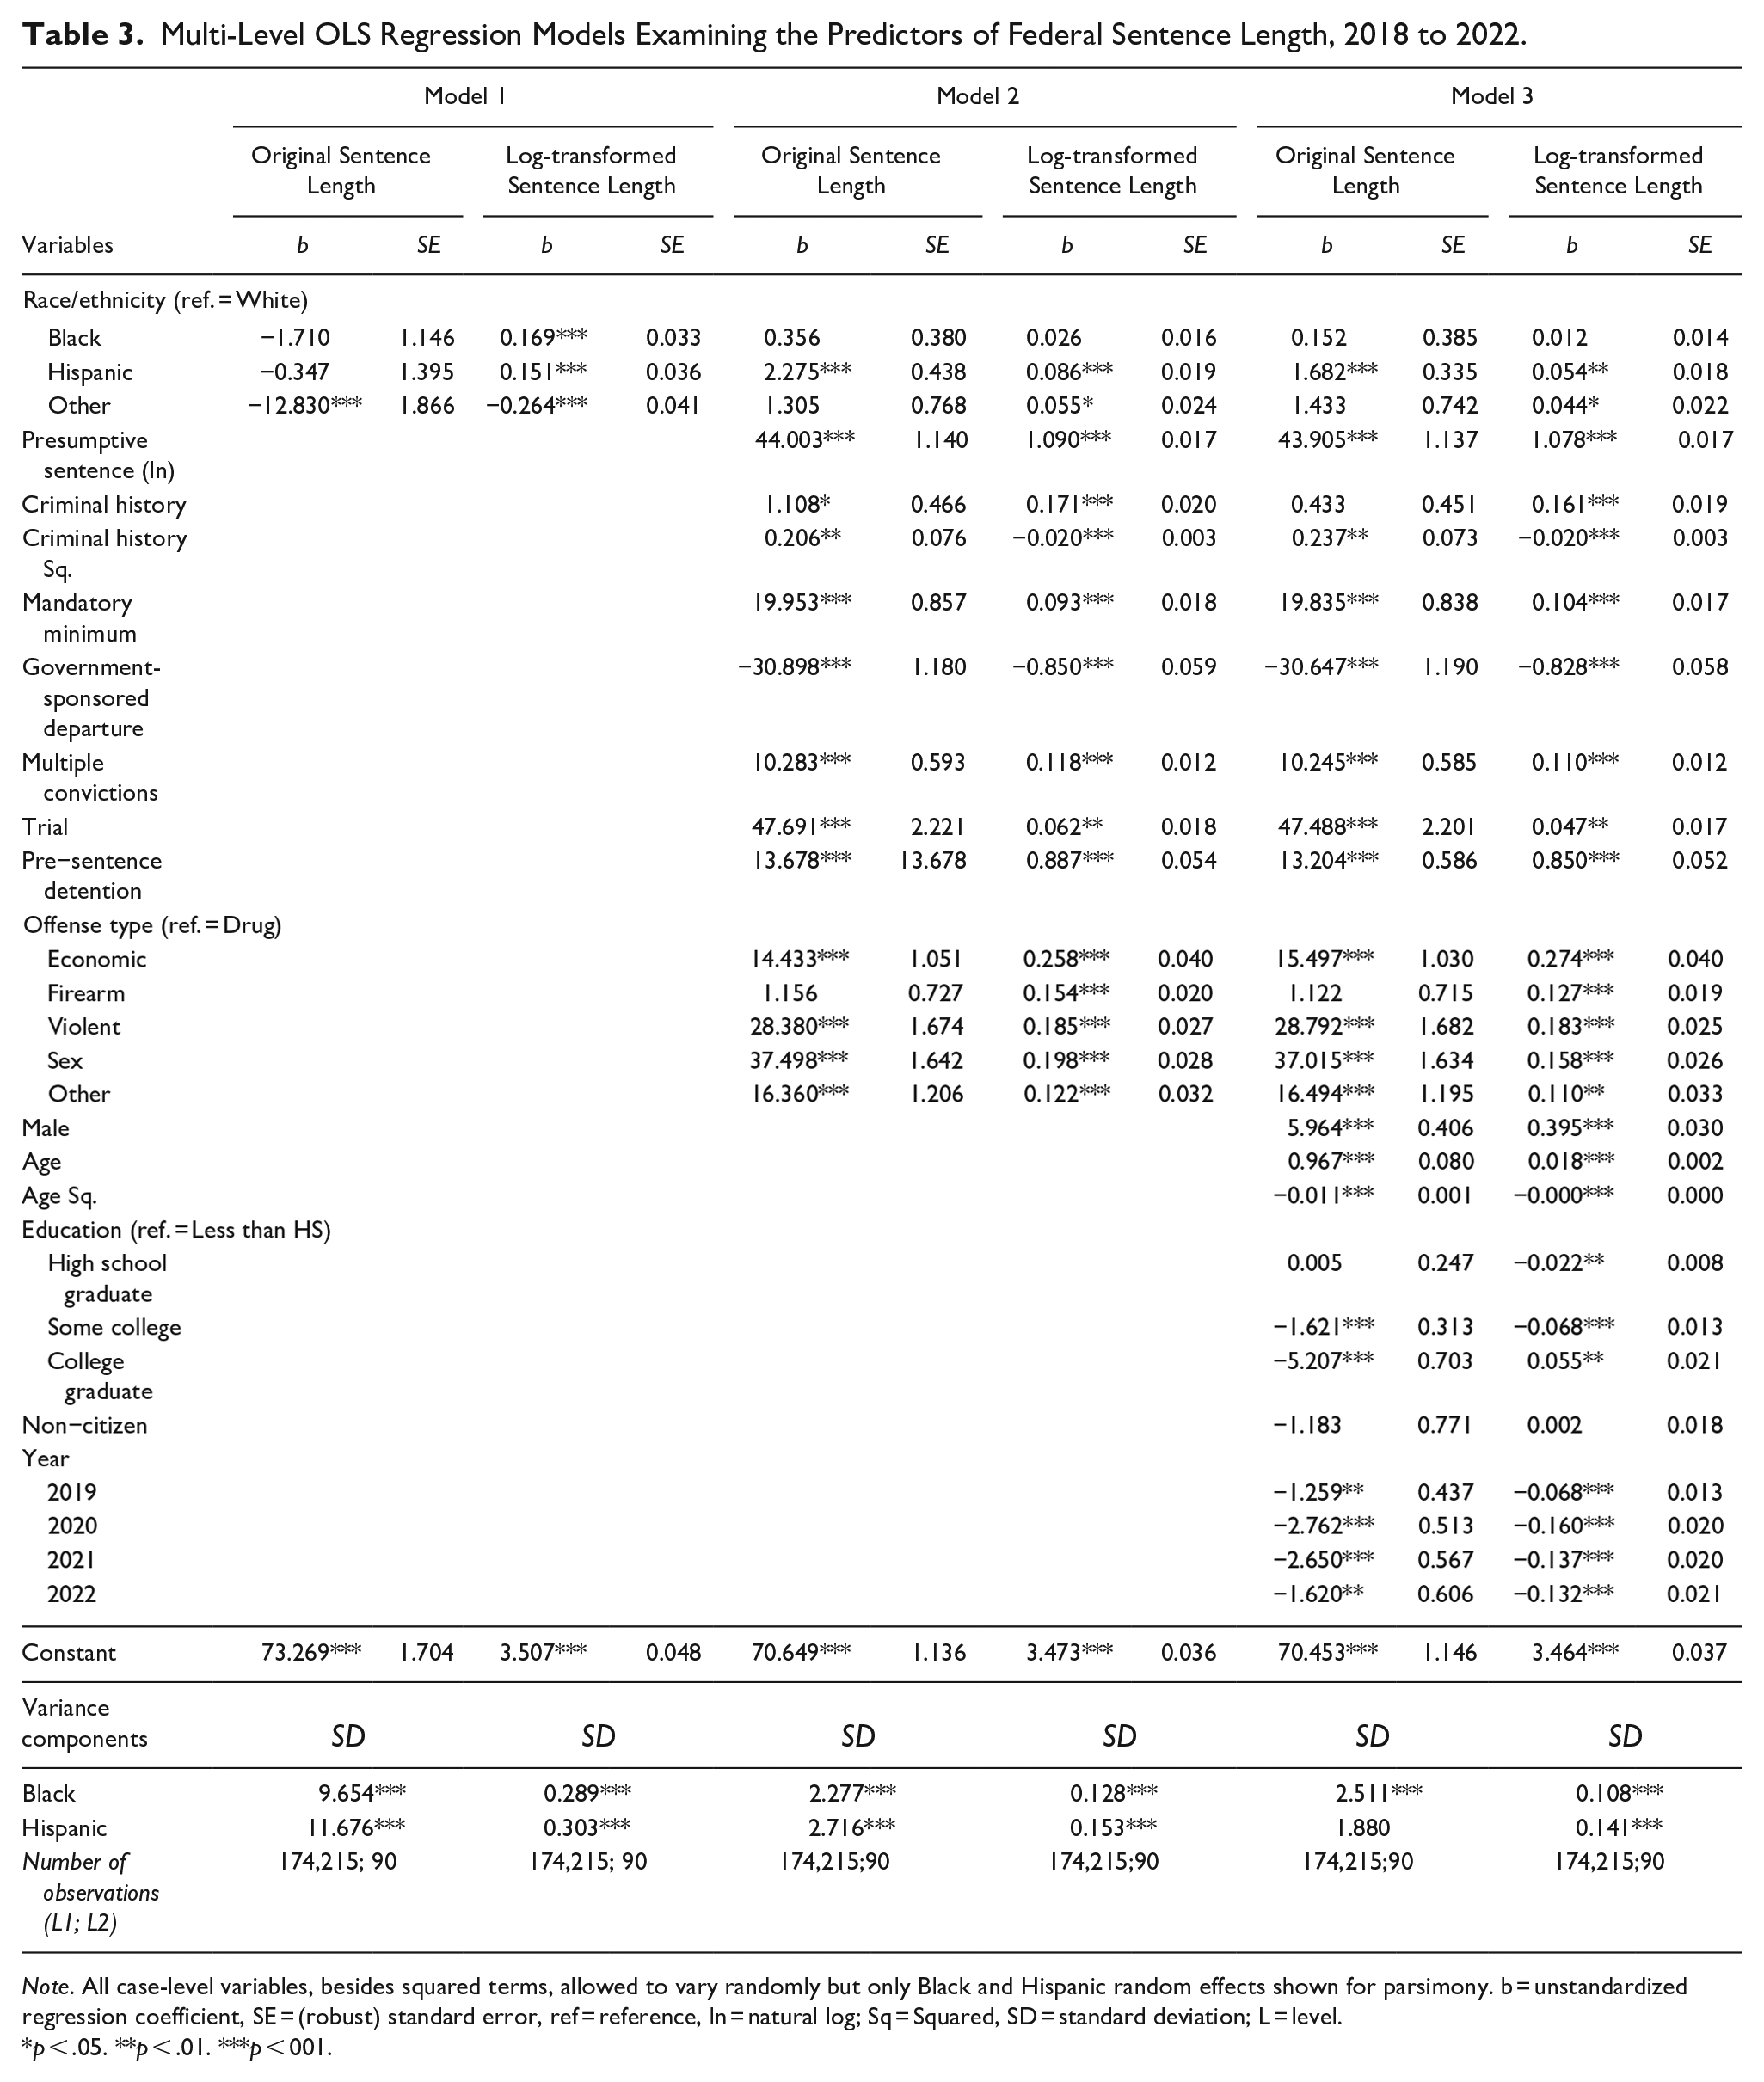
Note. All case-level variables, besides squared terms, allowed to vary randomly but only Black and Hispanic random effects shown for parsimony. b = unstandardized regression coefficient, SE = (robust) standard error, ref = reference, ln = natural log; Sq = Squared, SD = standard deviation; L = level.
p < .05. **p < .01. ***p < 001.
Of course, the goal of a multivariate model is to control for between-group differences in all observable criteria (not just district). Given that prior research shows that legally relevant criteria explain most variation in sentencing (for reviews see Spohn, 2000; Ulmer, 2012), Model 2 adjusts the racial/ethnic estimates for these characteristics. The inclusion of legally relevant criteria to the original metric model leaves the Black effect null but moderates Hispanic to produce a disadvantageous effect (net of controls). Meanwhile, these factors being included in the log sentence length model explain away the remaining Black effect and leaves Hispanic defendants receiving longer sentences than similarly situated Whites.
When one looks past the mechanical reporting of coefficients, Model 2’s findings become quite important. They suggest original and log sentence length provide incongruent “pathways” to Hispanic disadvantage (i.e., a positive Hispanic effect, net of controls). Understanding how, and why, necessitates a slight probe into the data. Hispanic defendants in the federal system are overwhelmingly convicted of drug offenses (about 64% of all Hispanic defendants). In drug cases, Hispanic defendants receive 21% shorter original sentences, but only 4% shorter log-transformed sentences, than Whites. The reason this difference between dependent variables is particularly large is because the non-linear impact of the log-transformation is acutely insidious in drug cases. To illustrate, there are about 14,000 more Hispanic drug defendants in the sample, but the volume of 0.03-month drug sentences (those most impacted by low-end non-linearity) are virtually identical for White and Hispanic defendants. In addition, White drug sentence lengths extend much farther out into the sentence length distribution (e.g., 75th percentile of White drug sentences is 2 years longer than the 75th percentile of Hispanic drug sentences). As a result, simply controlling for offense type has an uneven impact across models. In the original metric model, the control for offense type leaves the model wondering why Hispanic defendants are not receiving shorter sentences (after all, they are being sentenced at quite a high clip in cases where their expected sentence is 21% shorter). However, that same control does not have the weight in the log-transformed model (the high clip of Hispanic defendants are only expected to receive a fraction of that 21% shorter sentence).
Model 3 completes the modeling process by adjusting for extralegal characteristics common to federal sentencing research. 5 These results show directionally and statistically similar, but slightly smaller, racial/ethnic effects relative to Model 2. In one of the more interesting findings—albeit not the focus of this study—the Hispanic effect varies randomly across districts in the log-transformed, but not original metric, model. This means that if one was interested in explaining why some places are more punitive toward Hispanic defendants, they would be justified in doing so in log sentence length, but not original sentence length, models.
In short, no matter which dependent variable one uses fully-specified models produce null Black-White differences and longer Hispanic sentences relative to Whites. These final decimals and asterisks withstanding, the way these racial/ethnic effects get generated drastically differ. The original metric model starts from a baseline of null racial/ethnic effects, has Hispanic disadvantage produced by legally relevant controls, and in the end generates a district-static Hispanic effect. Meanwhile, the log sentence length model starts from a baseline of Black and Hispanic disadvantage, shows similar Hispanic (but not Black) results once legally relevant factors are adjusted for, and yields a randomly varying Hispanic effect.
Our control variable estimates largely align with past research. Defendants with longer presumptive sentences, eligible for a mandatory minimum, not subject to a government-sponsored departure, exposed to multiple conviction counts, who exercised their right to trial, and detained pre-sentencing received longer sentences, net of controls. The effects of our non-linear controls merit note. Age (Doerner & Demuth, 2010; Steffensmeier et al., 1995), criminal history (Holmes & Feldmeyer, 2019; Ulmer, 2000), and educational attainment (Franklin, 2017) are identified in the log-transformed model as having a curvilinear relationship with sentencing. That is, increased age and criminal history magnified sentencing (up to a point) and the longest sentences were reserved for those at the poles of the educational spectrum. However, only age’s curvilinear effect translated into the model with sentence length in its original form. As discussed in more detail below, these heterogeneous findings deserve a full study’s worth of attention because the log-transformation guarantees the dependent variable itself will be non-linear.
Discussion
The standard way that researchers have isolated the effect of race/ethnicity on sentence length is to linearly regress legal and extralegal variables onto a log-transformed dependent variable (Anderson & Spohn, 2010; Holmes & Feldmeyer, 2024; Ulmer & Parker, 2020; USSC, 2010, 2012, 2023). By and large, studies using this method have concluded that Black and (to a lesser extent) Hispanic defendants receive longer prison sentences than similarly situated Whites (for reviews see Spohn, 2000; Ulmer, 2012). This study critically assessed the logic of sentence length’s log-transformation, starting with a consideration of the standard normality justification and ending with a deliberation of multivariate, racial/ethnic, effects. The results of this study can be briefly summarized. First, the log-transformation does not solve the skewness problem present in the original metric model. That is, instead of correcting the original metric model’s heavy skew, abnormal errors, and extreme outliers, the log-transformation takes the original right-skew, trades it for left-skew, and leaves the model with the same complications.
Second, the latent consequence of the log-transformation is that racial/ethnic differences in sentence length do not reflect real, observed, differences. Our descriptive comparison of original and log-transformed sentences across racial/ethnic groups—which bore little resemblance to one another—underlines this point. The reason for this discord is that White sentences are unevenly impacted by the logarithmic distribution’s non-linear poles, which flatten at 0 and exceedingly high values (see Figure 2). Put another way, White sentences, to a greater degree than Black or Hispanic sentences, play into a key vulnerability of the logarithmic function—producing a flood of artificially deflated White, but not so much Black or Hispanic, sentence length values.
Third, not only are sentence length and log sentence length qualitatively different metrics but the use of log sentence length kickstarts a process through which racial/ethnic effects are differentially generated. As shown through our sequential multi-level analysis, original metric models start from a baseline of null racial/ethnic differences, while log-transformed models start by trying to explain why minorities receive longer sentences than Whites. As we move through the modeling process, we find that drug offenses amplify Hispanic-White disparities in original sentence length, but mute Hispanic-White disparities in log sentence length. Moreover, Hispanic effects are static across place in original metric, but not log-transformed, models. Thus, sure, system-wide average racial/ethnic effects (net of controls) are the same regardless of whether one uses sentence length or logged sentence length, but the mechanisms driving, and details associated with, these effects sharply contrast.
After reading this study, one may logically ask how to mitigate the problems associated with the log-transformation’s application. If the federal sentence length measure remains continuous—with decimal values—count-based models will be insufficient. Of course, a researcher could round the federal sentence length measure to the nearest integer, and then test the efficacy of the Poisson, Negative Binomial, or Hurdle models (see Hester & Hartman, 2017; Hilbe, 2014). Although these approaches would correct for overdispersion without exposing the data to the logarithmic distribution, they would sacrifice specificity in the dependent variable (i.e., treat a 15- and 45-day sentence the same). Another potential option would be for a researcher to add a constant to sentence length prior to the log-transformation (see Anderson & Spohn, 2010; Holmes & Feldmeyer, 2024; Light, 2022). The addition of an integer constant would force log-values to take a positive number—mitigating the impact of extreme small value differences such as −3.51 natural log units for a 0.03-month sentence. Nevertheless, as shown in Appendix B, simply adding a constant does not (a) solve the problem of skewed residuals or (b) fix the sizeable differences in race/ethnicity across sentence length operationalizations. 6 While discerning a “silver bullet” fix to this problem is not the goal of this study—these potential solutions set researchers up with a launch pad to ameliorate the problem.
Two methodological points warrant clarity. First, when making comparisons across groups the log-transformation, in and of itself, is not the problem. Rather, it is the log-transformation’s non-linear poles unevenly impacting the groups under consideration. As follows, if each racial/ethnic group had a similar sentence length distribution, and therefore was identically impacted by the log-transformation, then the logged metric would show similar racial/ethnic differences to the original metric. Consequentially, one should not assume the log-transformation’s non-linearity will obscure their sentence length comparison—it might not—and this problem should be implemented as a diagnostic check during the model-building process.
Second, in this study we take the standard approach of excluding 0’s from sentence length models (Brennan & Spohn, 2009; Doerner & Demuth, 2010; Steffensmeier et al., 2017; Ulmer & Parker, 2020) but the decision to do so is particularly important for the log-transformation. Since the natural log of 0 is undefined (i.e., missing in statistical software) a researcher who wants to retain those not sentenced to prison in the analytic sample must add a constant prior to the log-transformation. This is exactly the reason Light (2022, p. 1117) gave in his recent study for adding a 1 prior to log-transforming sentence length. When a constant is employed, which constant to employ is significant. If the constant is too small (e.g., 0.001 and 0.01; see USSC, 2012) it will make the log-transformation’s small value embellishment worse—producing even more extreme left-skew. Meanwhile, if the constant used is too large (e.g., 10 and 20) the log-transformation will doom the dependent variable to compress important variance in sentence length. In turn, regardless of whether one excludes or maintains 0’s in the analytic sample the identified problems with the log-transformation persist, and perhaps future research should consider the utility of different constant magnitudes in log-linear modeling.
Several implications flow from this study. Academic studies in prominent journals (Brennan & Spohn, 2009; Holmes & Feldmeyer, 2024; Ulmer et al., 2011b) have used original sentence length for descriptive analyses and log sentence length in regression models. To be sure, this approach makes sense—few would argue that log sentence length is a more intuitive metric for a public audience than months. However, the consequence of this approach is that these studies are liable to show one set of descriptive differences and model another. The recognition of this issue in USSC (2010, 2012, 2023) reports has the ability to be particularly translational because their analyses have been consistently relied upon by Congress, and even cited in Supreme Court decisions (Pulsifer v. United States, 2024).
Not only does this study have the potential to inform policy discussions, but it highlights a lively theoretical conversation in sentencing. Scholars have long argued that the “social meaning” of a one-unit increase in punishment varies depending on the baseline expected sentence (Engen & Gainey, 2000; Holmes & Feldmeyer, 2019; Ulmer, 2000). For example, sentencing 1 to 15 additional days of incarceration when they were expecting time-served is qualitatively different than sentencing 1 to 15 additional days when they were expecting 5 years. Log-transforming sentence length tacitly accounts for this argument by treating a one-unit increase at a low-level as far greater than a one-unit increase at a high-level. Our position is that even if one accepted that sentence length considerations are patently non-linear (see Engen & Gainey, 2000), the log-transformation’s application to the federal sentencing data takes the argument too far. That is, when left unchecked the log-transformation produces a model where a 1-month increase at sentence length’s smallest value is five times greater than a 1-month increase at the next integer value.
Understanding that the log-transformed sentence length measure is, in and of itself, non-linear also highlights a potential to reconsider the research on non-linear sentencing effects. For example, our original metric model suggested that those with particularly extensive criminal histories received longer sentences, while our log-transformed model showed that criminal history effects maxed-out at high values. To the extent that those who fall into the highest criminal history categories receive the longest sentences, and the log-transformation itself “maxes out” large sentence length values, the curvilinear “criminal history effect” may actually be driven by the data transformation—not criminal history considerations. Against that backdrop, future research is needed that compares the explanatory power of normative considerations vs. data manifestations for common curvilinear sentencing effects such as age (Doerner & Demuth, 2010; Steffensmeier et al., 1995), criminal history (Holmes & Feldmeyer, 2019; Ulmer, 2000), and education (Franklin, 2017).
Like virtually all social science studies, this study has limitations. Past research overwhelmingly justifies the log-transformation on the grounds of right-skew (Holmes & Feldmeyer, 2024; Kim et al., 2015; Ulmer & Parker, 2020), and therefore we focus on the assumption of normality. However, there are more considerations that go into the decision to use an original or log-transformed dependent variable. Linear regression models assume constant variance in error (Fox, 2015), but assessments of error terms show that log-transformed models are unique from original metric models in having systemic negative error at large expected values. Meanwhile, log-transformed expected values cannot be exponentiated without bias (Wooldridge, 2010), meaning that the validity of marginal effects can be contingent on the decision to log-transform the dependent variable. Along these lines, future research is needed to understand how log-transforming sentence length impacts an array of statistical concerns, not just skew. More broadly, we use federal sentencing data but the vast majority of criminal prosecution occurs at the state-level. While differences in the types of sentences that White, Black, and Hispanic defendants receive have been detected at the state-level (Chen, 2013; Hester & Hartman, 2017; Mitchell et al., 2023; Wang et al., 2015), the log-transformation unduly impacting state-level racial/ethnic sentence length estimates should be subject to empirical investigation, not assumed.
Taken together, the most commonly analyzed outcome variable in federal sentencing research is prison sentence length—an inevitably right-skewed measure. To satiate concerns about normality and outliers, federal sentencing scholars often log-transform the measure prior to entering it into regression models. While the log-transformation makes sense in theory, its application has unintended consequences. Specifically, its non-linearity takes the original right-skew, trades it for left-skew, and saddles the model with the exact assumption violations it had before. What’s more, the logarithmic function deflates White sentences to a greater degree than Black or Hispanic sentences—producing an obscured portrait of racial/ethnic differences in sentencing. In the end, sentence length and log sentence length derive from the same source (the court’s disposition), but through heterogenous statistical pathways produce appreciably different results.
Supplemental Material
sj-docx-1-cad-10.1177_00111287251341854 – Supplemental material for Skew for Skew: A Cautionary Tale of Log-Transforming Sentence Length in Studies of Race/Ethnicity
Supplemental material, sj-docx-1-cad-10.1177_00111287251341854 for Skew for Skew: A Cautionary Tale of Log-Transforming Sentence Length in Studies of Race/Ethnicity by Bryan Holmes in Crime & Delinquency
Supplemental Material
sj-docx-2-cad-10.1177_00111287251341854 – Supplemental material for Skew for Skew: A Cautionary Tale of Log-Transforming Sentence Length in Studies of Race/Ethnicity
Supplemental material, sj-docx-2-cad-10.1177_00111287251341854 for Skew for Skew: A Cautionary Tale of Log-Transforming Sentence Length in Studies of Race/Ethnicity by Bryan Holmes in Crime & Delinquency
Footnotes
Acknowledgements
Thank you to the anonymous reviewers for their helpful comments and suggestions.
Declaration of Conflicting Interests
The author declared no potential conflicts of interest with respect to the research, authorship, and/or publication of this article.
Funding
The author received no financial support for the research, authorship, and/or publication of this article.
Supplemental Material
Supplemental material for this article is available online.
Notes
Author Biography
References
Supplementary Material
Please find the following supplemental material available below.
For Open Access articles published under a Creative Commons License, all supplemental material carries the same license as the article it is associated with.
For non-Open Access articles published, all supplemental material carries a non-exclusive license, and permission requests for re-use of supplemental material or any part of supplemental material shall be sent directly to the copyright owner as specified in the copyright notice associated with the article.