
Abstract
In June 2024, the Minnesota Department of Corrections implemented the Minnesota Severe and Frequent Estimate for Discipline (MnSafeD), a fully-automated, gender-specific classification assessment that was designed to predict prison misconduct. Customized to Minnesota’s prison population, the MnSafeD was created to identify the relatively small group of residents disproportionately responsible for much of the misconducts and violence that take place in prison. This study revalidated the MnSafeD on the first 8,631 residents who were scored on the instrument. The results showed the MnSafeD performed very well overall, achieving an area under the curve (AUC) of 0.84. The instrument’s predictive accuracy was better for the men and for the post-intake reassessments (0.86). The results revealed there were no predictive disparities by race/ethnicity.
Introduction
The majority of state prison systems in the U.S. use classification systems to assess residents for their risk of institutional misconduct (Duwe & Clark, 2025), which includes rule violations that run the gamut from disobeying orders and possession of “contraband” (i.e., alcohol, drugs, etc.) to assaults against staff and other residents (Camp et al., 2003). Prison misconduct not only increases the costs of incarceration (Lovell & Jemelka, 1996), but it also disrupts the safety and security of the environment for both residents and staff. Residents who experience victimization in prison have negative psychological outcomes (Johnson Listwan et al., 2010), while research has long shown that correctional officers experience a relatively high level of job stress that has been linked to a number of adverse mental and physical health effects (Brower, 2013).
Classification systems often contain an intake assessment, which focuses more on the resident’s prior criminal record because little is known about the institutional conduct for those with no history of incarceration, and a reclassification assessment that places more emphasis on the resident’s recent conduct during confinement (Austin, 2003). Combined, the intake assessment and reassessment are used to place residents at custody levels that are aligned with their risk for institutional misconduct. Higher-risk residents are typically assigned to more restrictive custody levels such as close or maximum, whereas lower-risk residents are placed at minimum or medium custody levels where they have fewer restrictions and greater freedom of movement within the facility.
Despite the widespread use of classification systems to assess the risk of institutional misconduct, there has been relatively little research to date on the performance of these instruments. Instead, much of the literature on risk assessment in corrections has focused on the prediction of recidivism, which is the most common outcome used for correctional populations. Of the extant research on institutional misconduct, most studies have examined the individual and situational characteristics associated with rule violations. Others, however, have focused on validating existing risk assessment tools or attempting to create new ones specifically designed to predict outcomes related to prison misconduct.
Literature Review
Individual and Situational Factors for Prison Misconduct
The two main perspectives that have been used to explain prison misconduct are importation and deprivation. Whereas importation argues that misconduct occurs as a result of the characteristics and experiences that residents bring with them into prison, deprivation holds that situational factors within the prison environment influence resident misconduct (Tewksbury et al., 2014). Given that classification assessments are applied to individuals, the findings from the importation literature are especially relevant to identifying individual-level characteristics that influence misconduct.
Prior research has shown that prison misconduct is a significant predictor of recidivism (Gendreau et al., 1996; Hamilton et al., 2021). Because both are forms of rule-violating behavior, prison misconduct and recidivism share many of the same risk and protective factors. As with recidivism, some of the strongest predictors of misconduct are static factors like criminal history, age, and race (Gendreau et al., 1997).
While research has shown that dynamic factors, or criminogenic needs, such as antisocial thinking, antisocial peers, education, employment, and family/domestic relationships have an impact on recidivism risk, the same is true for prison misconduct. For example, a recent study found that antisocial thinking, as measured by the Texas Christian University-Criminal Thinking Scales (TCU-CTS), is positively associated with prison misconduct (Duwe et al., 2023). A number of studies have shown that gang membership (i.e., identification as a member of a security threat group) is positively associated with rule violations (Gaes et al., 2002; Griffin & Hepburn, 2006; Tewksbury et al., 2014), which is consistent with the finding that antisocial peers increase the risk of prison misconduct (Gendreau et al., 1997). The study by Gendreau et al. (1997) also revealed that education, employment, and marital status are significant predictors of institutional misconduct. Although research has not demonstrated that childhood trauma is a criminogenic need, a recent study by Clark and Duwe (2024) showed that past exposure to adverse childhood experiences increased prison misconduct for males, but not for females. Likewise, despite not having a strong empirical relationship with recidivism, a history of mental illness has been cited as a risk factor for misconduct (Austin, 2003).
Just as research has shown that cognitive-behavioral, education, and employment programing reduce recidivism (Gendreau et al., 1996), so, too, have studies on prison misconduct. Reale et al. (2025) recently found that a cognitive-behavioral intervention reduced misconduct, which is consistent with the conclusion drawn by French and Gendreau (2006) that cognitive-behavioral treatment programs are the most effective intervention for curbing disciplinary infractions. Education and employment programing have also been found to reduce misconduct (Duwe et al., 2015; Gover et al., 2008; Steiner & Wooldredge, 2014), although their effectiveness has been more modest and sometimes inconsistent. More generally, greater involvement in programing, which also entails less idle time, has been noted as important for reducing misconduct (Austin, 2003).
Prior Research on the Development and Validation of Classification Assessments
The last few decades of the twentieth century were marked not only by rapid growth in the implementation of classification assessments by state prison systems (Austin, 2003), but also by the increased use of actuarial tools (i.e., instruments developed on the basis of statistical methods) to assess recidivism risk. The emergence of the risk-needs-responsivity (RNR) model during this time shifted the focus of recidivism risk assessment beyond static factors to a consideration of criminogenic needs, which are dynamic risk factors that are susceptible to change (Andrews et al., 2006). As the use of risk and needs assessment instruments has proliferated since the 1990s, so has the body of research that has examined their development and evaluated their predictive performance. More recently, studies have investigated whether risk and needs assessment tools exacerbate the racial and ethnic disparities that have long pervaded the criminal justice system.
Even though the vast majority of U.S. prison systems have been using classification assessments since the latter twentieth century, no published studies have—with the exception of original MnSafeD validation (Duwe, 2020)—evaluated their performance. Instead, several studies have focused on creating actuarial tools to predict violent or dangerous misconduct. Using data from nearly 10,000 residents in California’s prison system, Berk et al. (2006) found that random forests—a type of machine learning algorithm—performed better than several other supervised learning algorithms in predicting serious misconduct. Likewise, Cunningham and Sorensen (2006) used data on several thousand maximum security residents in Missouri’s prison system to create the Risk Assessment Scale for Prison (RASP), which was found to have strong predictive validity for violent misconduct.
More recently, two instruments were developed to assess the risk of restrictive housing placement. Helmus et al. (2019) developed and validated the Risk of Administrative Segregation Tool (RAST) on a Canadian prison population. Designed to be administered one time at intake, the static, six-item tool had a relatively high level of predictive validity in predicting administrative segregation placements within 2 years of admission. That same year, Labrecque and Smith (2019) used data from a U.S. prison population to create the Risk Assessment for Segregation Placement (RASP), which was also a static instrument designed to be administered one time at intake. The results showed the RASP performed well not only on the validation sample, but also when it was later revalidated in Oregon (Labrecque, 2022).
Present Study
To date, existing research has not validated a classification assessment instrument that has been implemented within a U.S. state prison system. While the Minnesota Severe and Frequent Estimate for Discipline (MnSafeD) was originally developed and validated in 2020 (Duwe, 2020), it was not implemented by the Minnesota Department of Corrections (MnDOC) until June 2024. This study extends the literature on institutional misconduct risk assessment by revalidating the MnSafeD, a gender-specific, fully-automated instrument that was designed to identify the small segment of the prison population that is disproportionately responsible for much of the misconduct that takes place. The present study uses multiple metrics to evaluate its predictive performance on the first 8,631 individuals scored on the instrument whose follow-up period ended before January 2025.
Consistent with recent risk assessment research, analyses are also performed to test for predictive disparities by race and ethnicity. The primary concern with a classification assessment that has predictive disparities is that it will lead to some individuals being overclassified on the basis of their race and/or ethnicity. Given how classification assessments are traditionally used, overclassified residents would be more likely to receive placement at higher-custody facilities that generally have more restrictions, less freedom of movement, and reduced access to programing.
Data and Method
Development and Validation of the MnSafeD
The MnSafeD was designed to be a gender-specific, fully-automated classification system customized to Minnesota’s prison population. The findings from prior research not only show that women tend to be overclassified when scored on the same recidivism risk assessment tools as those used for men (Van Voorhis, 2012), but also that facility-level factors can influence misconduct (Camp et al., 2003). To avoid overclassifying women, who are housed in a different facility than the men in Minnesota, the MnSafeD was designed to be gender-specific insofar as separate assessments were created for male and female residents. Moreover, because reassessments are a key design feature of classification systems (Austin, 2003), automating the scoring process has long been considered a goal, if not a best practice (Hardyman et al., 2002). Automating the scoring process not only increases reliability, which improves predictive validity (Duwe & Rocque, 2017), but it also expands assessment capacity (Duwe, 2024). Recent scholarship has demonstrated that customized, home-grown risk assessment instruments deliver strong predictive performance, especially in comparison to off-the-shelf tools (Duwe, 2024; Duwe & Rocque, 2018; Hamilton et al., 2022).
The outcome predicted by the MnSafeD is severe and/or frequent misconduct (SFM), which is defined as five or more discipline convictions, three or more discipline convictions resulting in a segregation penalty, or one or more violent misconducts against staff or other residents. Because individuals are assessed every 6 months, the MnSafeD was designed to estimate a resident’s likelihood of SFM over the next 6 months (i.e., until the next reassessment) or until the day of release for those with a release date less than 6 months away. The impetus for using this measure of misconduct derived from the observation that a relatively small segment of Minnesota’s prison population—about 10%—was responsible for a majority of the disciplinary infractions and all of the violent misconducts that take place, which dovetails with the well-known finding that a small group of prolific individuals are disproportionately responsible for much of the crime that occurs (Chaiken & Chaiken, 1984; Wolfgang et al., 1972; Wright & Rossi, 1986). From a risk management perspective, accurately predicting who will have serious, violent misconduct, and/or a lot of discipline convictions is critical. Therefore, as long as the highest-risk residents can be proactively identified, then it may be possible to improve the safety of correctional institutions by mitigating their risk for misconduct.
To develop and validate the prediction models for the MnSafeD, both data splitting (i.e., split-population) and k-fold validation methods were used. The male and female samples were split into training and test sets, with the training set comprised of individuals released from 2006 to 2009 and the test set including people released in 2010 and 2011. Consistent with the need to predict SFM in 6-month intervals, the dataset was further split into 6-month increments for both males and females. Due to attrition in the sample sizes, models were developed up to the 2-year mark for the women and up to the 4-year mark for the men.
Regularized logistic regression (RLR) was the classification algorithm used for all 12 models that were trained and tested—eight for males and four for females. To identify the items that were significant and robust predictors of SFM for each of the 12 models, a bootstrap variable selection method developed by Efron and Gong (1983) was applied to the dataset. RLR models were estimated in which predictors were added one at a time until no further single addition achieved significance level a = .10. Among the significant predictors, interaction terms were added to the models and tested to determine whether any had a statistically significant (p < .10) effect on SFM.
Bootstrap resampling was used to refine the selection of predictors for each model, and predictors were retained as long as they were statistically significant at the .05 level in at least 70% of the 1,000 bootstrap samples. After removing predictors that did not achieve statistical significance in at least 70% of the samples, another 1,000 bootstrap samples were estimated. This process was carried out for each of the 12 models. To identify the best RLR algorithm for each of the 12 prediction models, the area under the curve (AUC) was used. After identifying the parameters that yielded the highest AUC for each algorithm, predictive performance was then evaluated on the test sets.
Using multiple metrics, the results showed the models achieved a relatively high level of predictive performance. For example, the average area under the curve (AUC) was 0.832 for the female models and 0.836 for the male models. The results also indicated that predictive performance generally improved after the initial classification assessment. The improved performance among the later assessments reflects the fact these models were able to draw on more recent behavioral indicators such as misconduct and involvement in work and programing (Duwe, 2020).
Revising the MnSafeD
Following the initial development and validation of the MnSafeD (Duwe, 2020), several revisions were made prior to its debut in June 2024. First, the sample for the training and test sets was expanded to include everyone released from Minnesota prisons between 2006 and 2021. In doing so, the sample contained 10 additional years of more recent releases from prison. Moreover, the sample size increased from 39,355 releases to 102,562, of whom 91,942 were male and 10,620 were female.
Second, and perhaps more important, the design of the MnSafeD was simplified to help facilitate its implementation. Because it was created to be fully automated, information technology (IT) resources were required to implement the instrument. To help with this effort, the MnSafeD was simplified by paring down the number of statistical models within the instrument. For both the men and the women, the revised version of the MnSafeD contains the following models: (1) intake, (2) 6-month reassessment, and (3) recurring.
The intake models were designed to predict SFM from the day of admission until the 6-month mark (i.e., 6-month reclassification date) or release date for those with confinement periods less than 6 months. For residents with confinement periods greater than 6 months, the 6-month reassessment models were created to predict SFM from that date until the 12-month mark or release date for those released at some point between 6 and 12 months. For residents with confinement period greater than 1 year, the recurring reassessment models were designed to predict SFM over the next 6 months (i.e., next reassessment date) or until the day of release for those released prior to the next reassessment date.
The procedures used to create the six statistical models were the same as those described above. That is, data were split into training (2006–2016 releases) and test sets (2017–2021 releases), and k-fold validation methods were used to internally validate the models. RLR was the classification algorithm used, Efron and Gong’s (1983) bootstrap variable selection method was used to identify significant and robust predictors, and the AUC was the metric used to identify the models with the best performance. The predictive performance results were similar to what was reported by Duwe (2020).
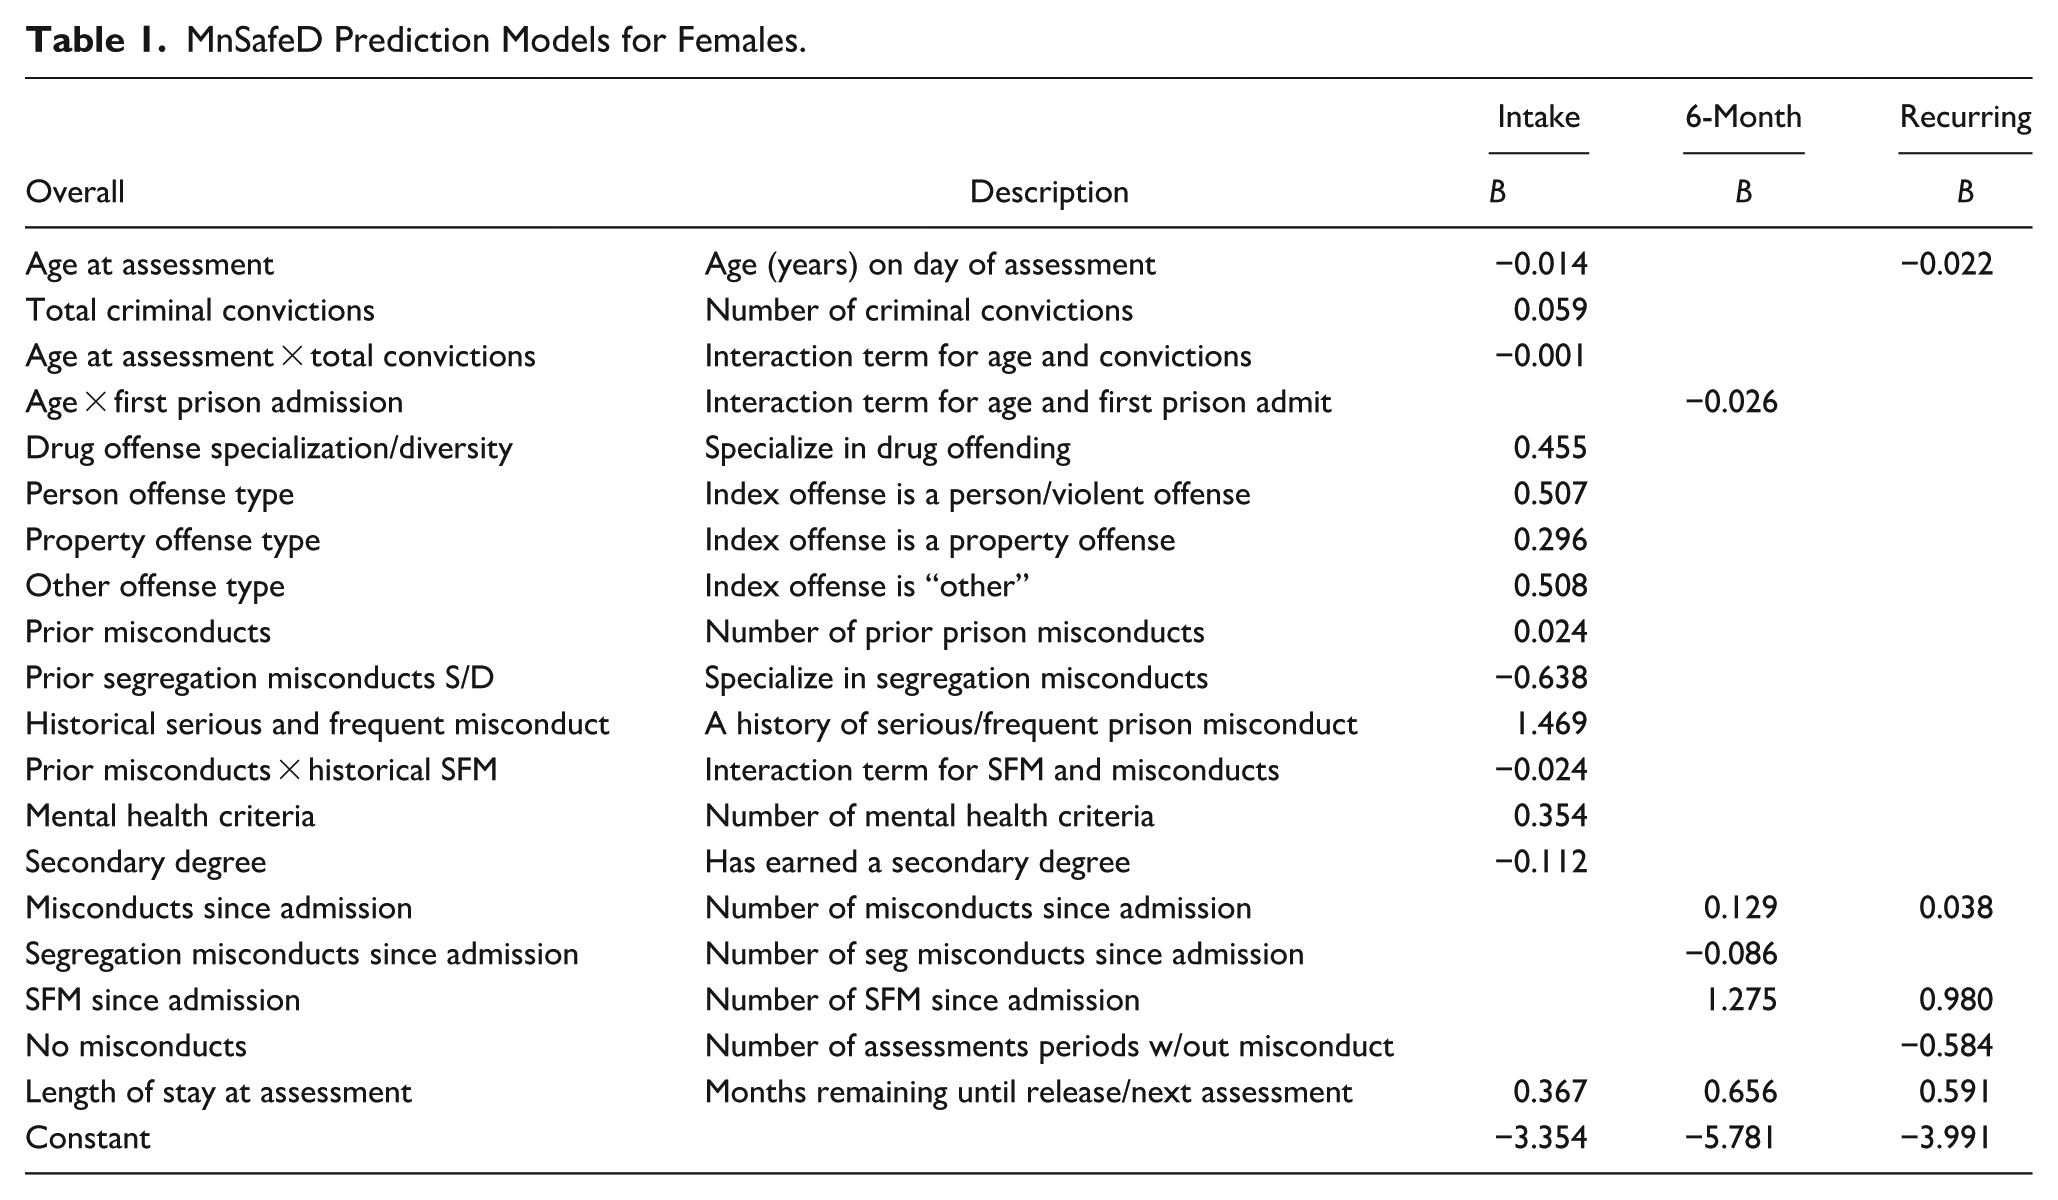
The statistical models for the MnSafeD, which show the unstandardized coefficients for the statistically significant predictors, are presented in Table 1 for the women and Table 2 for the men. In general, there were more significant predictors identified for the men in comparison to the women. Most notably. involvement in a security threat group (STG), marital status, and idle assignments (i.e., lack of participation in programing and/or work assignments) predicted misconduct for the men but not for the women. The models also contain several interaction terms, which indicate the impact of some predictors on SFM was dependent on another item. For example, STG involvement predicted SFM in the 6-month reassessment model for the men, but only for those who had never been to prison before.
MnSafeD Prediction Models for Females.
MnSafeD Prediction Models for Males.
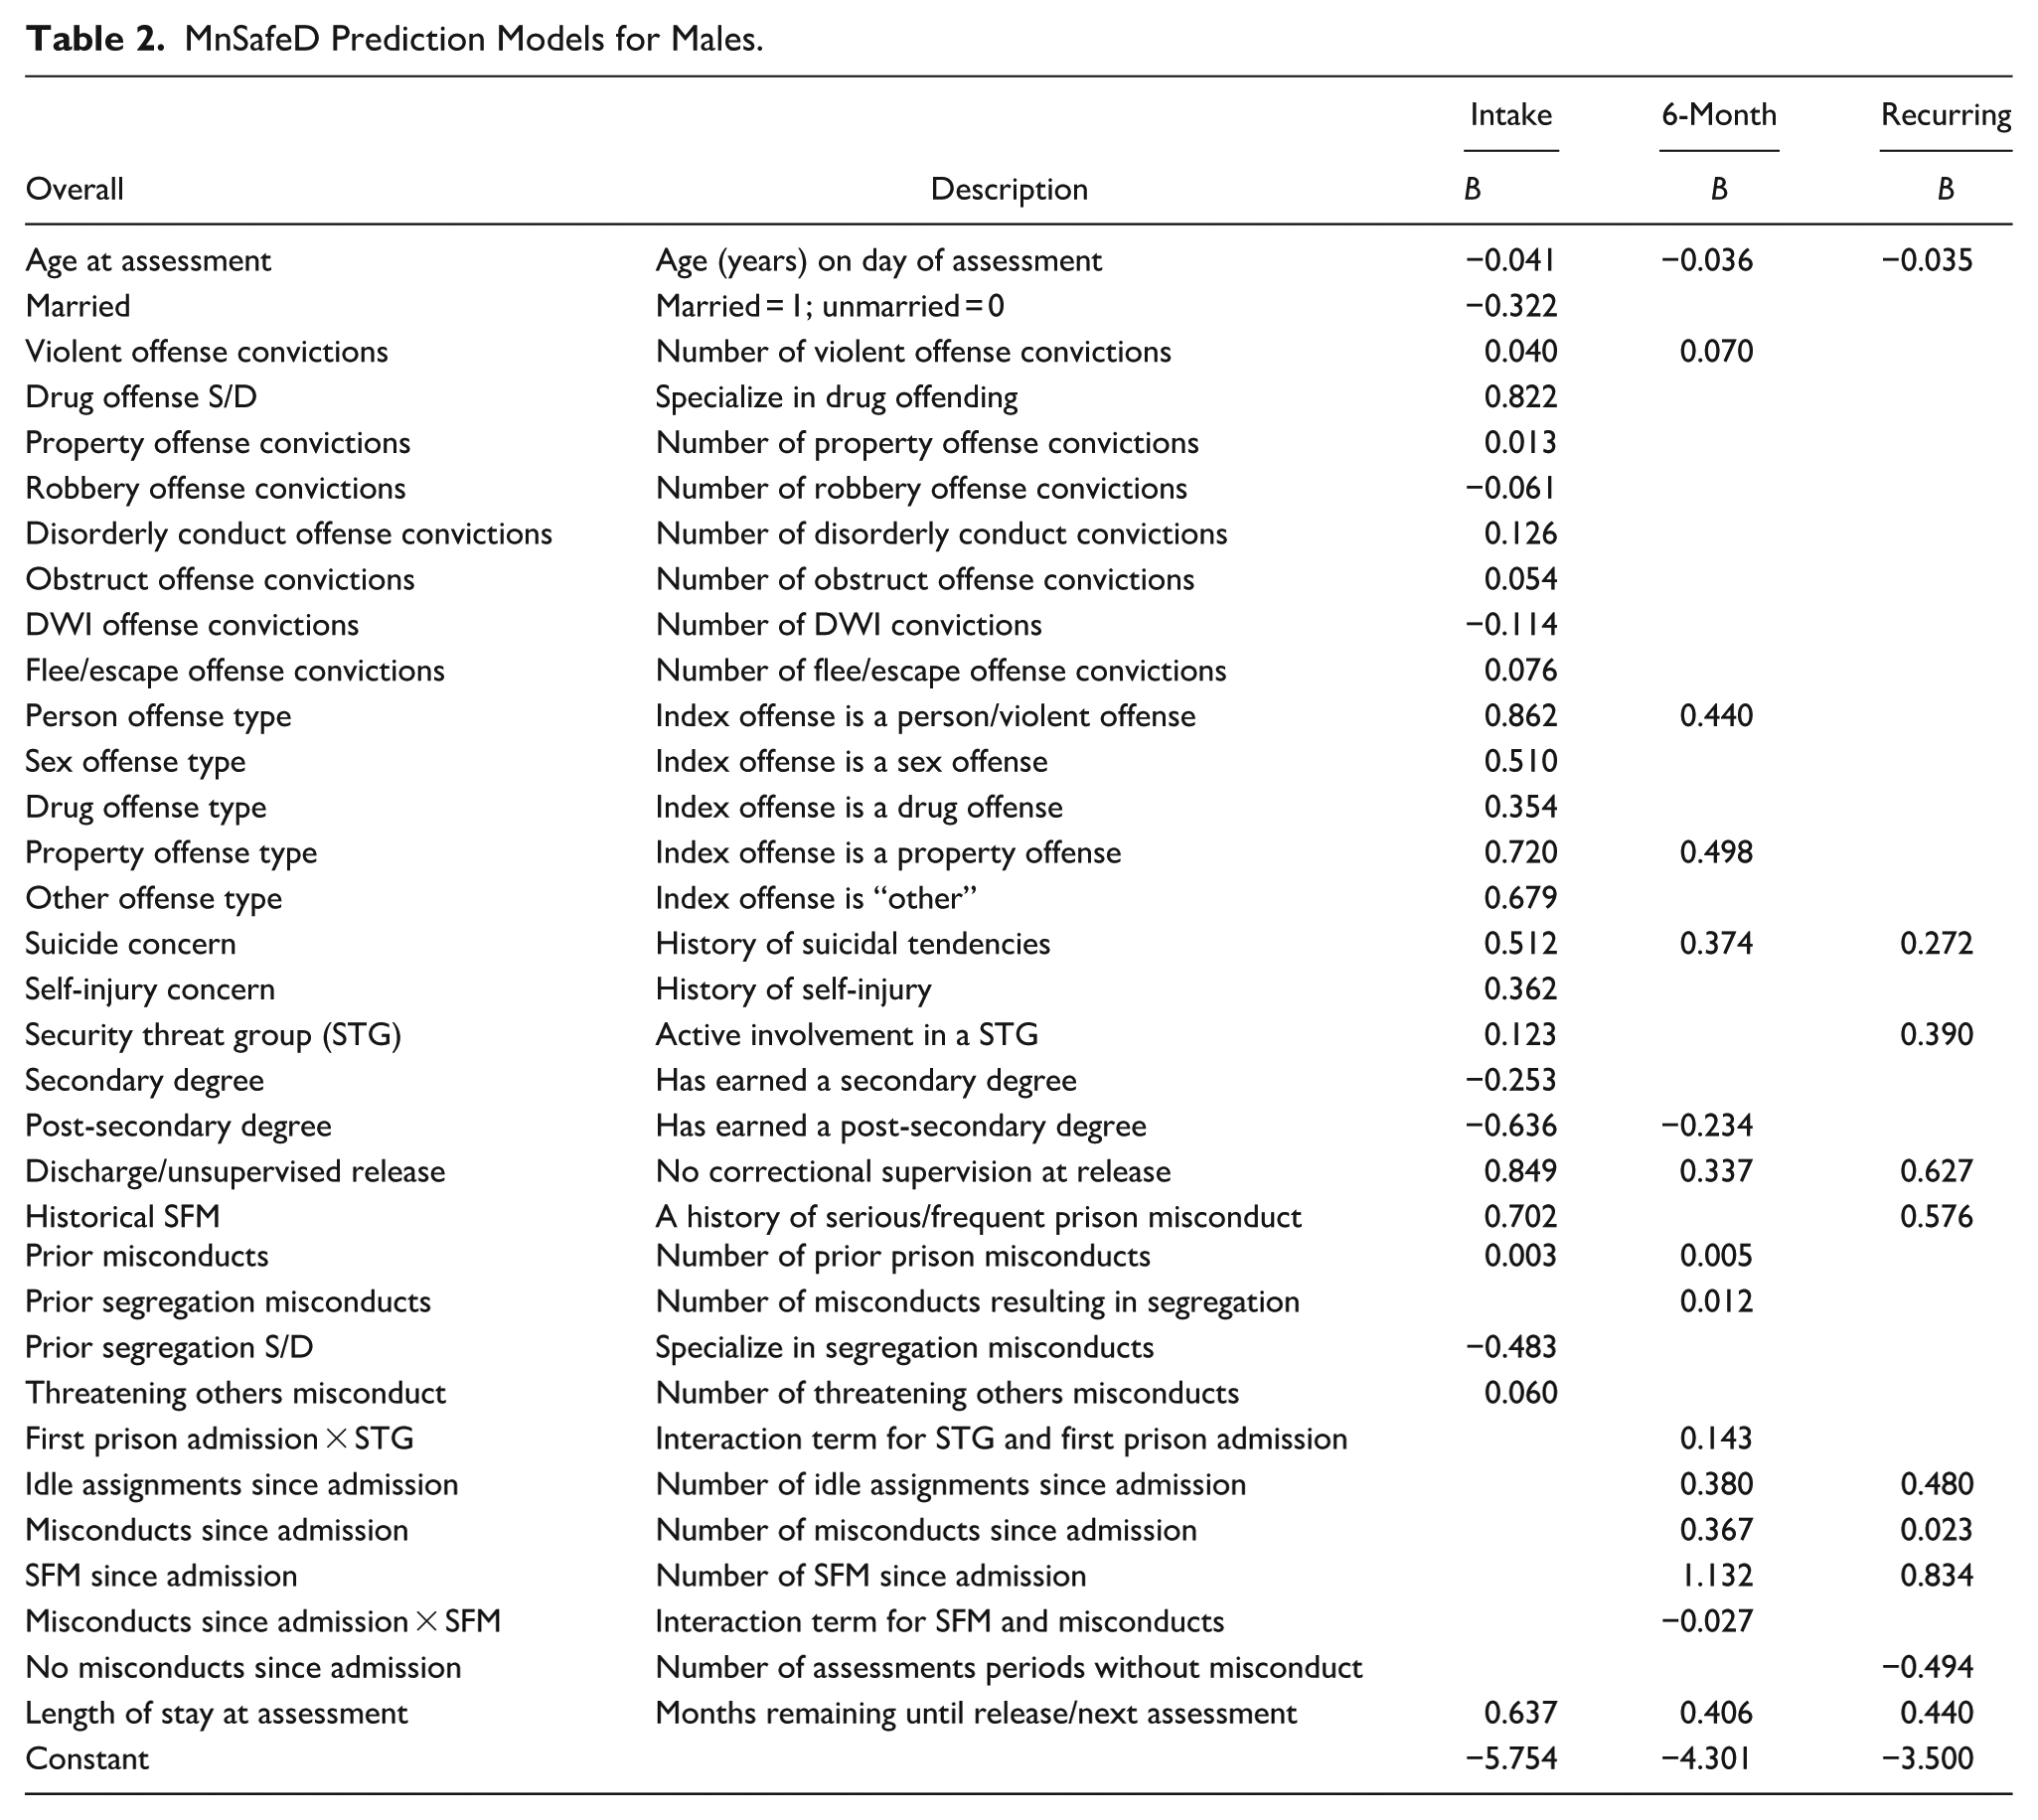
For both the men and the women, the intake models contain a number of prior criminal history predictors. Because it is necessary to assess individuals who have never been to prison before, prior criminal history provides a proxy measure for whether residents may be more likely to violate prison rules and regulations. The intake models, which predict the likelihood of meeting the criteria for SFM during the first 6 months in prison, also contain measures for offense type, prior history of misconduct, educational achievement, mental health, security threat group (STG) involvement (males only), marital status (males only), age at assessment, and length of time until reassessment or release (whichever comes first).
The 6-month reassessment models contain fewer measures of criminal offending, including index offense type and prior convictions. Instead, these models rely more on measures captured during the first 6 months in prison. In particular, the 6-month reassessment models contain a number of predictors relating to misconduct during the first 6 months in addition to an item that measures the number of times a resident was on idle status and, thus, not participating in programing or prison labor (males only). Age at assessment and length of the assessment period were also significant predictors.
The recurring models, which are applied once residents have been in prison for at least 12 months, do not contain any criminal history measures. Rather, these models rely exclusively on recent behavioral indicators that are more relevant to predicting misconduct. Moreover, both the female and male models include an item that measures whether residents have been free of discipline convictions during an assessment period. As a result, by abstaining from misconduct, residents can lower their MnSafeD score over time.
MnSafeD in Practice
All of the data used to populate the items on the MnSafeD are automatically extracted from the state’s criminal history repository and the Corrections Offender Management System (COMS), the MnDOC’s management information system. The MnSafeD was designed to automatically generate assessments on the day of intake and every 6 months thereafter. Yet, its design also allows MnDOC staff to manually generate new assessments, which generally takes less than 10 s to produce, at any time during a person’s confinement period.
When the items within the MnSafeD have been populated with data, the statistical models produce a SFM probability over the next 6 months from the day the assessment is run. For individuals who will be released in less than 6 months from the assessment date, the MnSafeD generates a SFM probability from the assessment date until the day of release. An individual’s probability is used to generate a percentile ranking, which is their MnSafeD score. Due to variations in the SFM base rate across the three types of assessments (intake, 6-month, and recurring) by gender, the percentile ranking provides a more stable metric in comparison to the predicted probability.
The percentile rankings were based on the probability distributions from the test set for the men and women. To illustrate, let us assume a male has just been admitted to prison and, thus, receives a MnSafeD score based on the intake model. A probability of 20% would place this individual at the 89th percentile. Therefore, his MnSafeD score would be 89%. For women, a probability of 20% on the intake assessment would place an individual at the 62nd percentile, which would be their MnSafeD score.
Revalidating the MnSafeD
The revalidation dataset consists of the first 8,631 residents (624 women and 8,007 men) in Minnesota’s prison system who were scored on the MnSafeD and their follow-up period ended before January 2025. The predicted outcome measure is SFM, which was operationalized as five or more discipline convictions, three or more discipline convictions resulting in a segregation penalty, or one or more violent discipline convictions during the follow-up period. For example, if an individual had two discipline convictions during the follow-up period, but one of the convictions was for violent misconduct, then they would meet the SFM criteria. On the other hand, if a person had four non-violent discipline convictions during the follow-up period, but only two of which resulted in a segregation penalty, then they would not meet the SFM criteria.
Consistent with prior research that has used multiple metrics to evaluate the predictive performance of risk assessment instruments (Duwe, 2019; Duwe & Rocque, 2017; Hamilton et al., 2016; Tollenaar & van der Heijden, 2013), this study used four different statistics to assess predictive validity. There are three main dimensions of predictive validity: 1) accuracy, 2) discrimination, and 3) calibration. For predictive accuracy, one of the more commonly-used metrics is accuracy (ACC), a threshold-based measure that looks at whether an assessment makes correct classification decisions. For example, if someone who met the SFM criteria had a predicted SFM probability less than 50%, then this individual would be incorrectly classified (i.e., false negative). Conversely, if this person had not met the SFM criteria, then they would be accurately classified (i.e., true negative). The ACC value ranges from 0% to 100%, and higher ACC values reflect greater accuracy in making correct classification decisions.
The second dimension of predictive validity, discrimination, measures the degree to which an assessment separates—in this instance—those who engage in SFM from those who do not. This study used the AUC to evaluate the MnSafeD’s predictive discrimination. One of the most widely-used statistics to evaluate predictive performance, the AUC is relatively robust across different recidivism base rates and selection ratios (Smith, 1996). With values that range from 0 to 1, the AUC statistic is interpreted as the probability that a randomly selected individual who engaged in SFM had a higher score on the MnSafeD than a randomly selected resident who did not.
Due to the relatively large sample size, especially for the men, nearly all AUC values were statistically significant at the .05 level. To assess the substantive importance of the results, this study relies on the guidelines provided by Rice and Harris (2005). Effect sizes are considered large if the AUC value is 0.714 or higher, medium if the value ranges from 0.639 to 0.713, small if the value ranges from 0.556 to 0.638, and negligible (or near random) if the value ranges from 0.500 to 0.555. In general, a risk assessment instrument is considered to have at least adequate predictive validity if the AUC value meets or exceeds 0.640.
Calibration measures how well the predicted values from a model correspond with the observed outcome being predicted. Whereas predictive discrimination assesses relative risk, calibration taps into absolute risk. In order for a prediction instrument to make accurate absolute assessments of risk, the model’s predicted values must be calibrated with the observed SFM outcomes. With values that range from 0 to 1, root mean square error (RMSE) measures the squared root of the average squared difference between observed SFM and predicted probabilities. The closer the RMSE value is to zero, the better the calibration.
In addition to these metrics, a consolidated metric was used to assess overall predictive performance. The SAR (squared error, accuracy, ROC [receiver operating characteristic]) is a combined measure of discrimination, accuracy, and calibration, and its formula is: (ACC + AUC + (1 – RMSE))/3 (Caruana et al., 2004). In previous recidivism prediction research that has used the SAR, values have ranged from 0.63 to 0.83 (Duwe, 2019; Hamilton et al., 2016; Tollenaar & van der Heijden, 2013).
To test for the presence of predictive disparities by race/ethnicity, multiple logistic regression models were estimated (Flores et al., 2016; Hamilton et al., 2021). In doing so, this study determines whether race/ethnicity had an impact on the SFM outcomes independent of the MnSafeD score. If MnSafeD is balanced among racial/ethnic groups, then only the risk score will significantly predict the SFM outcome.
Results
As shown in Table 3, 60% of the assessments were from the recurring model, 24% were from the intake model, and 16% were from the 6-month reassessment model. The results also show that 14% of the total sample met the criteria for SFM during the assessment follow-up period, which is a little higher than the reported rate in the original validation (Duwe, 2020). Women had a higher rate of SFM during the first 6 months following intake, whereas the men had a higher rate for the 6-month and recurring assessments.
Severe and Frequent Misconduct by Gender, Race/Ethnicity, and Model.
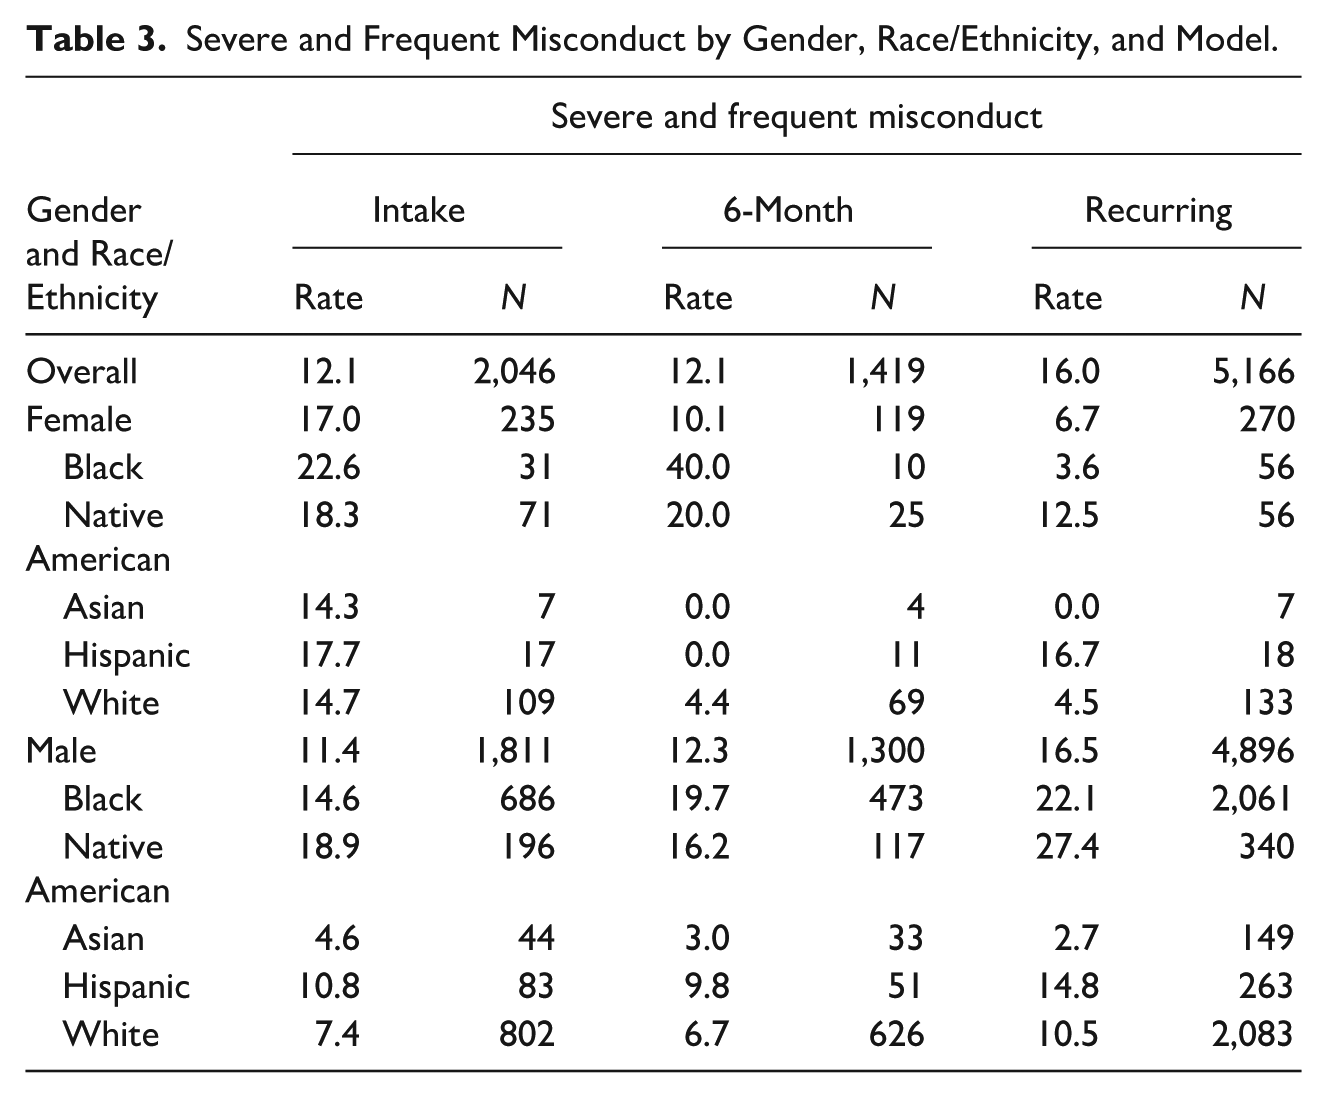
The results in Table 3 also reveal disparities in SFM outcomes by race/ethnicity. For both the men and the women, residents identifying as Black and Native American had higher SFM rates than those identifying as Hispanic, Asian, and White. In fact, Asian residents generally had the lowest SFM rates, although the number of Asian women who received MnSafeD assessments was very small.
To evaluate the MnSafeD’s predictive performance, the AUC, ACC, RMSE, and SAR statistics were calculated, which are shown in Table 4. The results from all 8,631 assessments reveal the MnSafeD had an AUC of 0.84, which is well above the large effect size threshold reported by Rice and Harris (2005). In addition, the ACC value was 0.85, while the RMSE was 0.35. With SAR values ranging from 0.63 to 0.83 in prior corrections risk assessment research, the overall SAR value (0.78) is near the top end of this range.
MnSafeD Predictive Performance by Gender, Race, and Model.
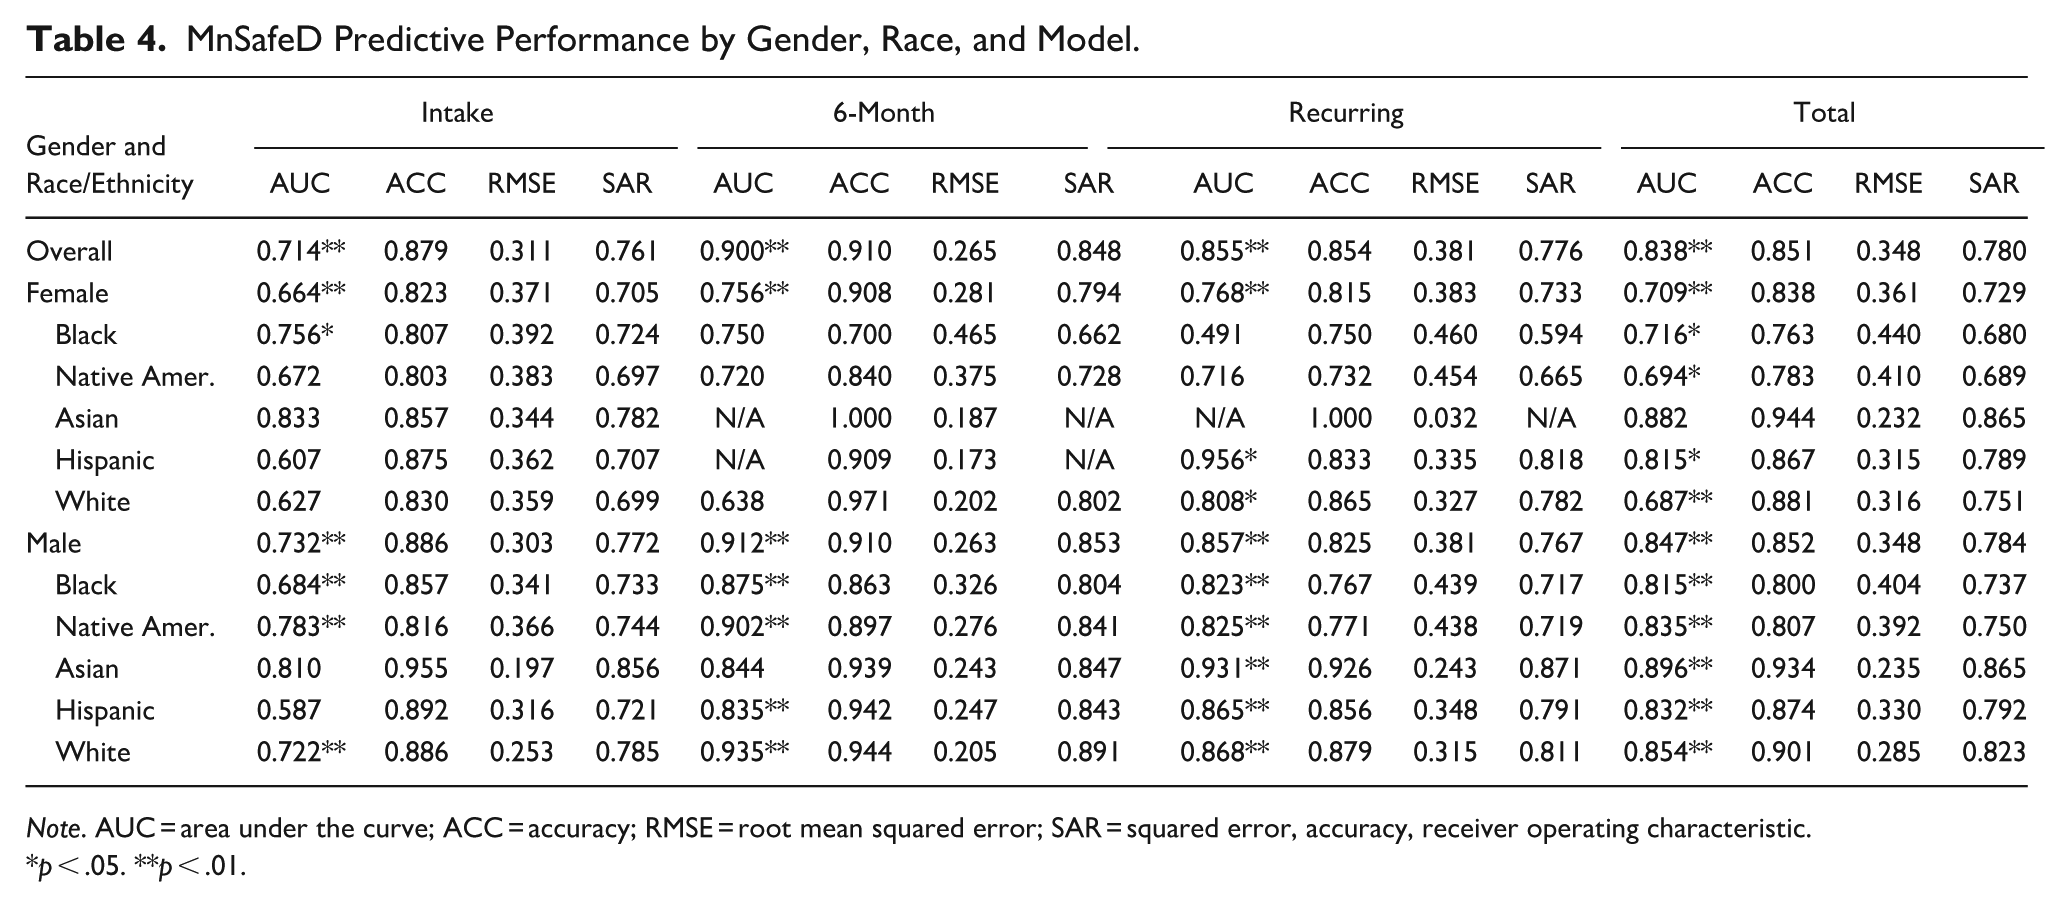
Note. AUC = area under the curve; ACC = accuracy; RMSE = root mean squared error; SAR = squared error, accuracy, receiver operating characteristic.
p < .05. **p < .01.
Notwithstanding this relatively high level of predictive performance overall, there were differences across gender, assessment type, and race/ethnicity. While the predictive accuracy and calibration statistics for women and men were similar, the AUC was much higher for the men. For instance, the AUC value for the 624 women assessed on the MnSafeD was 0.71, which was just below the large effect size threshold identified by Rice and Harris (2005). The overall AUC for the men was 0.85, a large difference that was also reflected in the SAR values for the women (0.73) and men (0.78).
The results also showed the two reassessment models performed much better than the intake assessment. The overall AUC for the intake assessment was 0.714, which meets—albeit barely—Rice and Harris’s (2005) large effect size threshold. However, the AUC value was 0.90 for the 6-month reassessment and 0.86 for the recurring assessment. While the 6-month reassessment had the smallest sample size (N = 1,419), an AUC value of that magnitude connotes a very high level of predictive discrimination. Indeed, the SAR value for this assessment (0.85) is greater than the top value reported in prior corrections risk assessment research.
The MnSafeD generally performed better for individuals identifying as Asian, although the overall sample size was less than 250. On the other hand, its performance was below the overall average for Native American individuals. For people identifying as Hispanic, Black, and White, the performance was mixed across gender and the type of predictive validity metric.
While the results from Table 4 indicate the MnSafeD has relatively high predictive accuracy overall, it is also important to examine whether its performance varies significantly by race and ethnicity. To this end, a total of 12 multiple logistic regression models were estimated across gender, race/ethnicity, and assessment type. The results from these models, which are presented in Table 5, reveal an absence of significant predictive disparities by race/ethnicity. None of the race/ethnicity covariates were statistically significant, while the MnSafeD score was the only statistically significant predictor in 10 of the 12 models. Overall, the findings suggest the MnSafeD has predictive parity by race/ethnicity.
MnSafeD Predictive Parity by Gender, Race/Ethnicity, and Model.
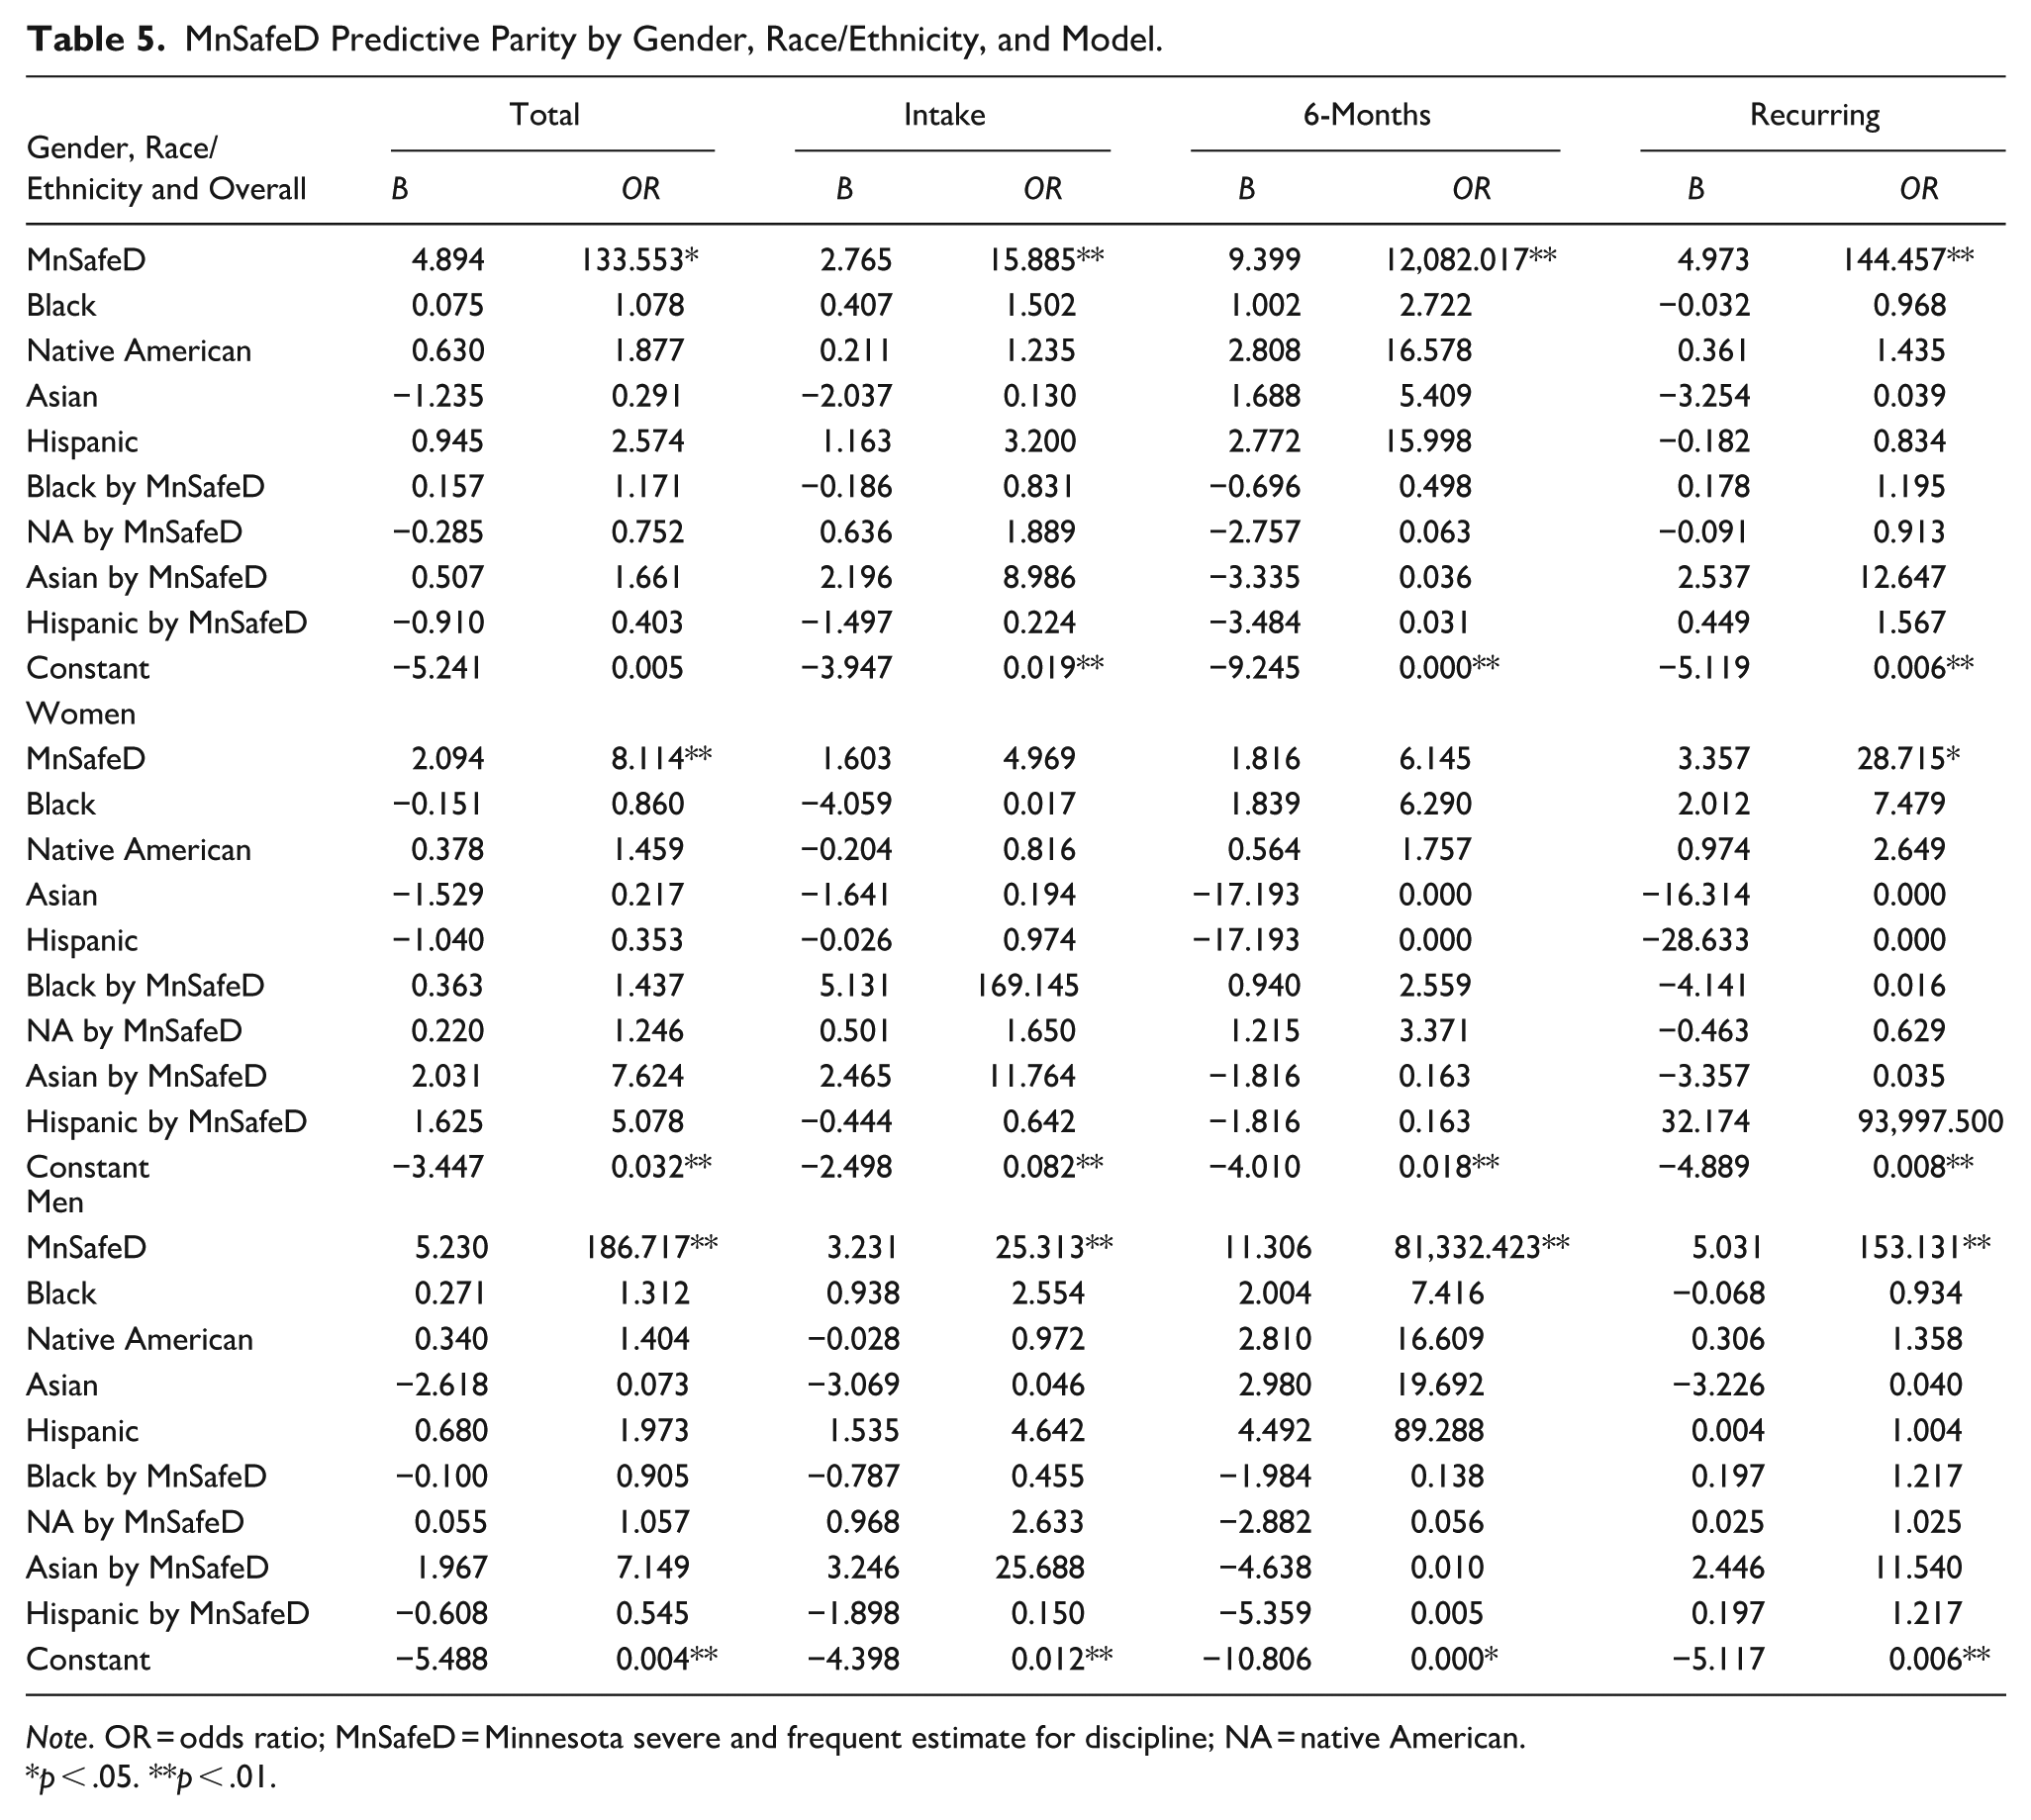
Note. OR = odds ratio; MnSafeD = Minnesota severe and frequent estimate for discipline; NA = native American.
p < .05. **p < .01.
Discussion
The results from the MnSafeD revalidation reveal that it achieved a relatively high degree of accuracy in predicting SFM for residents in Minnesota’s prison system. Although studies on the performance of instruments designed to predict prison misconduct have been minimal, the MnSafeD’s overall AUC value (0.84) is greater than the level of predictive discrimination typically reported in research on recidivism risk assessment instruments. While the intake assessment had a large effect size overall, the reassessments (i.e., 6-month and recurring) performed much better, with AUC values exceeding 0.85. Likewise, although the MnSafeD’s performance was adequate for the women, it was substantially better for the men. The findings also indicate the MnSafeD had predictive neutrality by race and ethnicity.
The MnSafeD’s strong predictive performance is likely due to several factors. First, the MnSafeD was revalidated on a population similar to the one on which it was originally developed and validated, and prior research shows there are performance advantages associated with using a customized assessment (Duwe, 2024; Duwe & Rocque, 2018; Hamilton et al., 2022). Second, automated scoring eliminates inter-rater disagreement, and the increase in reliability leads to improved predictive accuracy. Third, rather than relying on one statistical model, or algorithm, applied at the time of intake, the use of multiple reassessment models yields better predictive performance. Indeed, the reassessment models achieved high levels of predictive accuracy by using more recent behavioral indicators and relatively few pre-prison measures such as criminal history. Finally, it is possible that operationalizing the outcome as severe and frequent misconduct, as opposed to any misconduct, may have helped enhance the instrument’s predictive performance. When the outcome was measured as any misconduct during the follow-up period, the AUC for the entire sample was 0.78. Prior studies using similar measures, such as violent misconduct (Berk et al., 2006; Cunningham & Sorensen, 2006) and misconduct resulting in segregation (Helmus et al., 2019; Labrecque, 2022; Labrecque & Smith, 2019), have reported relatively high levels of predictive validity.
The main limitation with this study is that the results reflect one state’s experience with implementing and revalidating a classification assessment system. Thus, the extent to which the findings are generalizable to other institutional corrections systems is unclear.
Implications for Research and Practice
Despite this limitation, the results from this study likely hold several implications for correctional research and practice. First, the findings provide further evidence that automated scoring and customization are critical design features that not only help increase reliability and validity, but are also important for establishing an efficient assessment process that can accommodate frequent reassessments.
Second, most of the residents in Minnesota’s prison system do not engage in any misconduct and, as shown above, only a small segment of the population has severe and/or frequent misconduct. These findings, which are consistent with what Austin (2003) reported more than two decades ago, may call into question how many different custody levels are needed within a prison system. Like many states, Minnesota has four custody levels—maximum, close, medium, and minimum. Yet, the pattern of misconduct observed in Minnesota suggests it may be possible to operate with fewer custody levels without jeopardizing the safety of residents and staff.
Third, reliable and valid classification systems can be used to improve institutional safety by not only identifying those at greatest risk of SFM, but also by taking steps to mitigate that risk. The conventional approach, at least within Minnesota, has been to place higher-risk residents in either close or maximum custody facilities, where programing resources are more limited. Moreover, to maximize the impact on recidivism, programing has generally been back-loaded toward the end of confinement. To produce better institutional and post-prison outcomes, however, higher-risk residents should be prioritized for programing at the time of intake, which would also be aligned with the risk principle from the RNR model (Andrews et al., 2006). After all, the findings from this study and prior research have shown that idle time elevates the risk for institutional misconduct (Austin, 2003; Duwe, 2020). Front-loading programing for those who are higher risk would likely decrease their chances of engaging in misconduct, which could, in turn, also lead to a more successful transition from prison to the community.
Finally, although the vast majority of state prison systems report using a classification assessment system (Duwe & Clark, 2025), there is a paucity of research on their performance. To this end, more studies are needed that evaluate the degree to which these systems are reliable and accurate in predicting misconduct. As with recent scholarship on recidivism risk assessment, future research should also examine whether classification assessments are achieving predictive neutrality across gender and race/ethnicity. Because classification systems influence the facilities where residents are placed and, by extension, the types and quantity of resources to which they may have access, determining whether individuals are being misclassified is paramount.
Footnotes
Declaration of Conflicting Interests
The author declared no potential conflicts of interest with respect to the research, authorship, and/or publication of this article.
Funding
The author received no financial support for the research, authorship, and/or publication of this article.