
Abstract
This study advances the argument that criminological analysis requires greater crime specificity, emphasizing the need to define and study offenses at finer levels of distinction. We propose a four-level classification framework to organize crime data from broad legal categories to target-specific forms. Using 8,706 metal theft incidents in Louisville, Kentucky (2011–2016), the analysis shows that disaggregating metal theft into target-specific forms (e.g., air conditioners, catalytic converters, copper wiring) reveals temporal and spatial variations invisible in aggregate data analysis. These differences illustrate how greater empirical specificity can sharpen theoretical understanding and promote more prevention. The framework is adaptable to other crime types, offering a scalable model for refining criminological theories, improving data systems, and informing targeted interventions.
Introduction
Property crimes, though less harmful than violent offenses, remain among the most common and costly forms of crime, affecting individuals, businesses, and communities alike (Tapp & Coen, 2025). Within this broad category, metal theft poses a particularly disruptive problem, targeting critical infrastructure and residential and commercial properties. Metals retain consistent market value through scrap resale and recycling, creating ongoing opportunities for theft that are difficult to trace or regulate (Whiteacre et al., 2015). This combination of enduring value, weak traceability, and diverse target environments makes metal theft a persistent challenge for both law enforcement and crime prevention practitioners (Kooi, 2010).
Much of the existing research on crime relies on broad offense categories such as “theft,” “burglary,” or “property crime” as dependent variables (Rosenfeld, 2018). Although analytically convenient, such aggregations may obscure important distinctions in offender behavior, target selection, and spatial or temporal dynamics. Recent developments in crime analysis and prevention suggest the value of more refined classification frameworks that account for variation within crime types, as evidenced by studies highlighting the limitations of aggregated offense categories (see literature review). The present study uses metal theft to demonstrate how greater analytical specificity can be used to sharpen theoretical understanding and crime prevention efforts.
To move from broad crime categories to target-specific approaches, we introduce a four-level crime classification framework. Using metal theft as an illustrative case, the framework progresses from general legal categories (Level 1) to highly specific target-specific forms (Level 4; e.g., air conditioners, catalytic converters, copper wiring). This increased granularity reveals distinct opportunity structures, temporal rhythms, and spatial patterns that aggregate analyses obscure. Accordingly, to demonstrate the value of Level 4 specification, we examine temporal (long- and short-term) and spatial (land-use and block-group) variation in metal theft. Importantly, our aim is not to develop or test a causal model of metal theft itself. Rather, we focus on how Level 4 analyses uncover substantively important variation hidden at Level 3 (or higher), yielding insights relevant to policy and opportunities to refine extant theories (e.g., routine activity and crime pattern theories). By sharpening the definition and measurement of the dependent variable, this approach aligns with longstanding calls to avoid treating “crime” as a uniform phenomenon and instead clarifying the specific behaviors under study (Cornish & Clarke, 2014; Haberman et al., 2022; Newton & Felson, 2015).
The framework serves both conceptual and applied purposes. Conceptually, it equips researchers to examine and refine existing theories by enabling finer distinctions in the dependent variable, an essential yet often underexamined aspect of criminological theory testing. In practice, it provides a replicable structure for disaggregating crime data, thereby supporting more targeted prevention strategies, policy design, and resource allocation. Although demonstrated here using metal theft, the framework readily generalizes to other property crimes, such as burglary, vehicle theft, or fraud.
Using 6 years of incident-level data from Louisville, Kentucky, this study applies the framework to 8,706 reported metal theft incidents, disaggregating the data by form, land-use context, temporal pattern, and neighborhood socio-economic characteristics. The analysis reveals distinct patterns in when and where metal theft occurs that would remain hidden under broader classifications. We provide tools for refining crime theory and practice, as discussed further in the literature review and results.
Literature Review
Metal Theft
Metal theft is “the theft of items for the value of their constituent metals” (Whiteacre & Howes, 2009, p. 3). It has emerged as a significant global crime problem, impacting infrastructure, businesses, and private property (Bennett, 2008). Driven by fluctuating metal prices, facilitated by gaps in regulatory frameworks, and often exacerbated by weak enforcement mechanisms, this crime has been studied across various contexts (see Stickle, 2017). Research has identified economic influences, geographic patterns, and crime dynamics as key themes in understanding and addressing metal theft. Despite the ongoing harm caused by this crime, there have been comparatively few studies of metal theft.
Among these few studies, a consistent finding in the literature is that metal theft closely tracks commodity prices, a pattern known as the price-theft hypothesis. Studies in the U.K. and Europe (Brabenec & Montag, 2018; Sidebottom et al., 2011; Sidebottom et al., 2014) and the U.S. (Stickle et al., 2024) have shown that thefts of metals, such as copper and platinum-group elements, rise and fall in step with their market value. Meta-analyses confirm that studies find a positive, elastic price–crime relationship (Draca et al., 2019; Quinn et al., 2023), supporting rational choice perspectives that hold that offenders respond to perceived rewards (Cornish & Clarke, 2014). Though this economic mechanism explains broad trends, it does not account for the substantial variation within metal types. For example, it seems likely that fluctuations in iron/ steel products could follow a different temporal pattern than those in copper-based items if the two price markets do not move similarly over time. The current study does not examine price dynamics directly, but the four-level framework we propose enables future research to disaggregate metal theft by target-specific forms and test whether such within-type variation aligns with or diverges from market-level patterns. The present study builds on the limited metal theft literature by shifting attention from market-level price fluctuations to form-specific analyses, examining how distinct targets (e.g., copper wiring, catalytic converters, air conditioners) differ in their spatial and temporal patterns.
Perhaps not surprisingly, metal theft is not uniformly distributed across the built environment. Some research indicates that thefts are concentrated in areas where scrap metal recycling markets are active and regulations are weak (Whiteacre & Howes, 2009). For instance, research on railway metal theft in the U.K. demonstrates that crime clusters near scrap yards and high-risk transit hubs (Ashby et al., 2017). In the U.S., Posick et al. (2012) found that urban areas with large-scale infrastructure projects experience more frequent incidents, while rural areas show patterns of targeted theft from isolated utility stations and farms. Although some research has explored spatial variation in metal theft, it has often focused on specific locations, such as railway stations, parking garages, construction sites, or specific types of metal. Temporal analyses further reveal that metal theft follows predictable patterns, with spikes during economic downturns and when security is low, such as at night and on weekends (Ashby, 2016).
Studies examining the nature of metal theft offenders indicate a mix of opportunistic criminals and more organized networks (Ashby, 2016). Evidence from the U.K. and the U.S. suggests that thieves exploit poorly secured infrastructure, often returning to previously targeted locations, leading to repeat victimization (Robb et al., 2014). Research also points to behavioral heterogeneity among offenders, with some engaging in opportunistic or subsistence-level scavenging and others pursuing more systematic, technically skilled thefts (Stickle, 2017, 2020). Such differences in offender profiles and target selection provide strong grounds to suspect that “metal theft” encompasses multiple distinct behaviors and targets rather than a single homogeneous crime type. Disaggregating incidents by target-specific form (Level 4) is therefore essential to reveal how these variations manifest in opportunity structures, spatial patterns, and temporal rhythms distinctions that remain hidden when metal theft is treated as a singular subtype (Level 3).
Efforts to mitigate metal theft have focused on regulatory interventions and situational crime prevention strategies. Market Reduction Approaches (MRA) suggest that limiting the ease of resale through stringent scrap metal regulations can reduce theft rates (Mares & Blackburn, 2014). In St. Louis, a ban on cash payments for scrap metal transactions resulted in a significant decrease in reported thefts (Mares & Blackburn, 2014). Similarly, in the U.K., increased policing of scrap yards and the introduction of the Scrap Metal Dealers Act resulted in a measurable decline in metal theft (Ashby et al., 2017). Other successful interventions include increased surveillance, security markings on metal assets, and target-hardening measures for vulnerable infrastructure (Price et al., 2014).
The limited body of literature on metal theft has established some important insights into its economic drivers, geographic distribution, offender typologies, and prevention strategies. However, these studies often examine a single metal type or treat metal theft as a singular crime subtype. This study builds on that foundation by applying a target-specific (Level 4) lens to metal theft, examining distinct forms (e.g., copper wiring, air conditioners, catalytic converters) across spatial and temporal dimensions to uncover patterns obscured by broader classifications.
Routine Activities and Crime Pattern Theory
Though there are a variety of theories that could be used to explain property crime generally and metal theft more specifically, we discuss two here. Routine activities theory (RAT) was originally developed by Cohen and Felson (1979) and focused on the location and timing of criminal events, in contrast to extant theories, which focused on explaining why an individual would become crime-prone. This shifted the approach from the offender to the offense or event. RAT posits that crime occurs when a “motivated offender” encounters a “suitable target” in the absence of a “capable guardian” who might otherwise prevent the crime. As such, crimes occur when and where they do in predictable ways at the confluence of these three factors. Changing any of these three components markedly decreases the likelihood of crime occurring in a particular place or at a specific time.
Another theory that focuses on when and where crime occurs is crime pattern theory (CPT), developed by Brantingham and Brantingham (2013), as part of broader developments in the study of environmental criminology (see Bruinsma & Johnson, 2018; Sidebottom & Wortley, 2015). This theory posits that criminals have specific “awareness spaces” based on their daily (routine) activities. These awareness spaces include where individuals live, work, and socialize, as well as the paths between them. Crime is much more likely to occur when an individual predisposed to crime encounters a target within their awareness space. Both theories can be considered part of a larger set of explanations of crime that view it at least partly as a function of “opportunity.”
Though developed separately, both RAT and CPT would predict that metal theft should follow similar temporal and spatial patterns based on regularities in when and where individuals prone to crime encounter or seek out suitable targets. Thus, one important goal of the study is to explore whether metal theft can be treated as a single phenomenon, based on when and where more specific categories occur, or whether there are important distinctions within metal theft that can, in future studies, be used to refine the application of these theories.
The Value of Crime Specificity: A Framework for Classification
Advancements in criminological research underscore the need for greater specificity in studying crime (e.g., Newton & Felson, 2015; Haberman et al., 2022). Rather than relying on broad categorizations, scholars increasingly examine crime in finer detail across time, place, and classification. Three key areas—temporal granularity, spatial resolution, and crime disaggregation—reflect this shift by refining the measurement and analysis of crime.
Temporal Granularity
Both RAT and CPT suggest that crime unfolds within complex temporal patterns as part of the rhythms of daily life. Historically, crime data were aggregated into annual or monthly reports (e.g., the Uniform Crime Reports) due to limited availability and the difficulty of independently collecting comprehensive crime data. The increasing availability of detailed crime data provides opportunities to increase the temporal detail at which data are studied. For example, researchers such as Sherman et al. have emphasized the importance of analyzing crime at micro-time scales, particularly in the development of hotspot policing (Sherman et al., 1989). Weisburd et al.’ work further demonstrated that crime does not occur randomly but follows short-term patterns, emphasizing the value of fine-grained temporal analysis in shaping law enforcement strategies (Weisburd et al., 2004).
Recent studies have expanded these findings. Corcoran et al. (2021) used high-resolution temporal data to classify crime typologies by the time of day when offenses are most likely to occur, and Koppel et al. (2023) examined how social disruptions, such as the COVID-19 pandemic, influenced crime rates. The growing availability of high-frequency data, from surveillance footage to real-time police reports, has further advanced nuanced crime forecasting (Yu et al., 2014). Such temporal granularity provides detailed data that can be used to re-examine theories and enhance predictive models to better target interventions. Just as temporal granularity improves understanding of when a crime occurs, spatial resolution sharpens understanding of where it occurs.
Spatial Resolution
The concept of spatial resolution, which refers to the level of geographic detail at which crime data are collected and analyzed, has significantly influenced criminological research and crime prevention strategies. Early research tended to compare crime across states, cities, metropolitan areas (Land et al., 1990; McCall et al., 2010), or neighborhoods (Shaw & McKay, 1942), again due to data limitations. Advancements in data collection, geographic information systems (GIS), and crime mapping have enabled researchers to analyze crime at finer spatial scales, including block groups, blocks, street segments, and even specific addresses or buildings (Ratcliffe, 2010). Brantingham et al. (2009) were instrumental in integrating spatial resolution into criminology through environmental criminology and crime pattern theory, demonstrating that crime clusters occur at highly localized spatial units rather than broader geographic scales. Recent studies have continued to refine the understanding of the spatial dimensions of crime. Malleson et al. (2019) explored how different spatial scales impact crime pattern detection, cautioning against resolutions that are either too coarse or too fine.
Crime Classification
Crime research has long sought to refine the classification, analysis, and understanding of offenses. Three key approaches; crime disaggregation, offense subtypes, and crime classification enhance criminological research, providing law enforcement and policymakers with better frameworks for understanding crime patterns.
Crime disaggregation involves breaking broad crime categories into more specific offenses, enabling a deeper understanding of crime patterns and victimization trends. This approach is linked to criminological efforts to classify crime, with scholars such as Brennan (1987) emphasizing the need for precise classifications to enhance research and inform policy decisions. For instance, Andresen and Malleson (2016) demonstrated how disaggregating crime by type and day of the week revealed unique temporal-spatial patterns that would be obscured in aggregate data. Similarly, Curman et al. (2015) found that while aggregated crime remained stable over time, disaggregated crime types showed significant spatial variability. Newton and Felson (2015) also emphasized the value of disaggregating crime by place and time, noting that such analysis better aligns with routine activity theory and enhances theoretical and practical understanding of urban crime dynamics.
Offense subtypes take crime disaggregation a step further by categorizing crimes based on the offender’s motivation, modus operandi, or victim-offender dynamics. This method is particularly relevant to Situational Crime Prevention, which relies on tailored interventions to reduce specific crime opportunities. Army and Vellani (2021) illustrated how offense subtyping aids in identifying patterns of violent crime and informing targeted prevention strategies. Haberman et al. (2022) identified 13 distinct forms of robbery, highlighting the importance of subtyping in understanding situational crime contexts. Further, Haelterman (2016) emphasized how crime script analysis, a tool of Situational Crime Prevention, benefits from offense subtyping to map offender decision-making processes.
Crime classification models offer a structured framework for categorizing offenses based on legal definitions, offender behavior, or criminological theories. These models are especially important in Environmental Criminology, which emphasizes the role of spatial and situational factors in shaping crime patterns. Standardized classifications enhance crime mapping, predictive analytics, and targeted prevention strategies. For example, Vellani (2021) demonstrated that classification models improve the prediction of environmental crimes, while Hewitt et al. (2022) showed that sex offenses vary across environmental contexts. Ristea et al. (2020) further illustrated the predictive power of classification systems by identifying crime hotspots during large public events.
Four-Level Classification Framework
In this study, the four-level classification framework operationalizes the progression implied by these three approaches. Crime disaggregation is reflected in the transition from broad categories (Level 1) to more refined types (Level 2), which separates property crime into theft and related offenses. Offense subtyping aligns with Level 3, where thefts are grouped by motivation or target class, such as metal theft. Finally, crime classification is most fully realized at Level 4, which organizes incidents by the specific item stolen and situational context (e.g., catalytic converters, copper wiring). Thus, the proposed framework integrates disaggregation, subtyping, and classification into a single, hierarchical model.
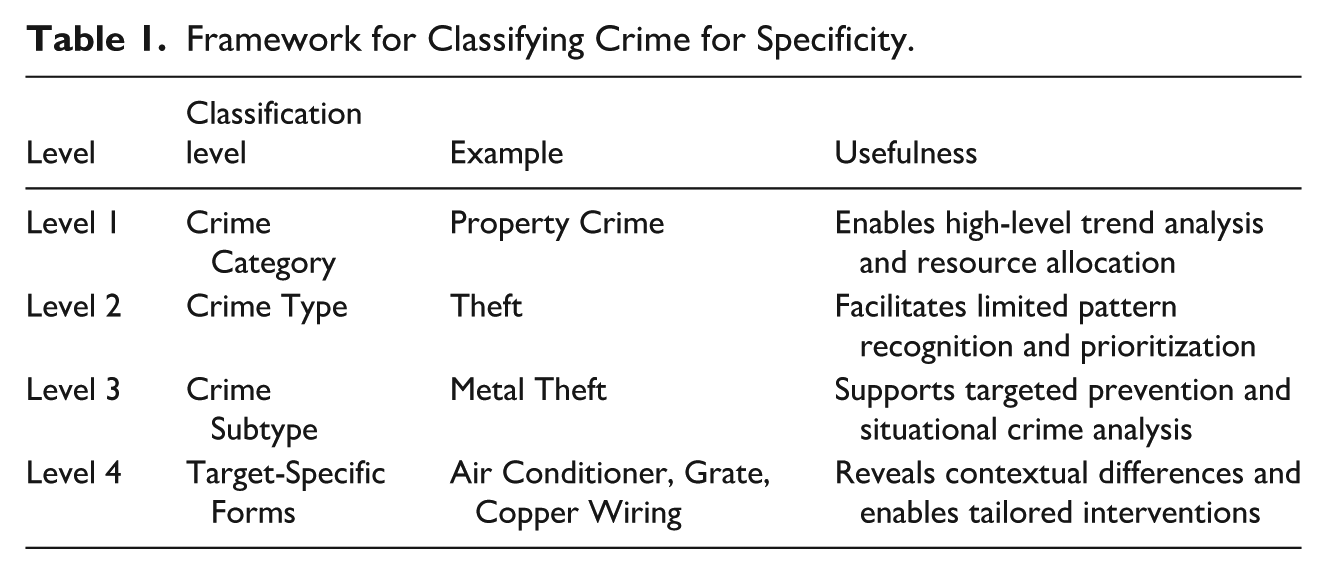
Table 1 presents the proposed hierarchy using metal theft as an illustrative example. The model progresses from general to specific, beginning with Level 1, which includes broad legal categories such as “Property Crime.” This level supports high-level trend tracking and policy planning. Level 2 narrows the classification to offenses like “Theft,” providing a somewhat more focused but still limited basis for pattern recognition. Level 3 introduces crime subtypes, such as “Metal Theft,” that enable more targeted situational analysis and resource allocation. Finally, Level 4 identifies target-specific forms, including thefts of air conditioners, copper wiring, or infrastructure grates. At this level, variations in offender behavior, opportunity structures, and environmental contexts become visible, allowing for more refined theoretical and practical insights. Rather than presenting a competing typology or theory, this four-level structure provides a systematic approach to better aligning data organization with criminological inquiry.
Framework for Classifying Crime for Specificity.
The goal in the remainder of the paper is to illustrate the utility of the level 4 specification using target-specific metal theft subtypes. As discussed above, research commonly explores variation in when and where crime occurs to better understand why it occurs and to aid prevention efforts. Therefore, we examine when (long- and short-term temporal variation) and where (land use and census-based block groups) metal theft occurs across these subtypes, which could be obscured entirely by using a level 3 (metal theft) or higher approach (theft or property crime).
Data and Methods
To explore variation in target-specific forms of metal theft, this study used incident-level data from the Louisville Metro Police Department for 2011 to 2016. The initial dataset included 8,729 reported incidents with offense code designations likely to involve metal theft. Each record was reviewed to confirm that the stolen items were, in fact, metallic. Incidents were excluded if the items were non-metallic, occurred outside the jurisdiction, or lacked reliable geocode location information. After this cleaning process, 23 incidents were removed, resulting in a final sample of 8,706 valid metal theft reports. Date and time fields in the dataset reflect when the theft was believed to have occurred, based on the police investigation, not when the report was filed. In cases of uncertainty, officers typically record the best estimated occurrence period. 1
Stolen items were categorized into five analytically meaningful target-specific forms through an iterative coding process based on narrative descriptions within the records. These forms included air conditioners, catalytic converters, grates (e.g., sewer drains and manhole covers), copper (e.g., wiring and piping), and a “mixed metals” category composed of various less frequently stolen metal items. Although retained for completeness, the mixed metals category was excluded from certain analyses due to its low frequency.
Two different levels of spatial variation were examined. At the micro-level, we examined how metal theft target types are mapped to specific land-use categories at the parcel level. One important type of variation in social landscapes within which crime may occur is land use (see Stucky & Ottensmann 2009 for a discussion). Indeed, both RAT and CPT would posit variation in the likelihood of crime across land use types based on how they structure daily interactions, influence the distribution of awareness spaces for potential criminals, shape available target patterns, and affect the presence or absence of security or guardianship efforts. Land use types were recorded by responding officers according to NIBRS standard use types, with each incident assigned a single location category (e.g., business, church, roadway). Because only one category can be selected per report, mixed-use classifications are not available. 2 For analysis, conceptually similar categories (e.g., apartments, condominiums, and single-family homes) were merged into broader groups such as “residential” to ensure adequate sample sizes and analytic clarity.
At the “meso-level” spatial analysis was explored using block groups as the unit of analysis. Spatial analysis was conducted using ArcGIS. Incident locations were geocoded and overlaid onto 2010 census block group boundaries for Louisville, obtained from the U.S. Census Bureau (https://www.census.gov/geographies/mapping-files.html). Block groups were selected as the unit of analysis to balance geographic resolution with adequate incident counts for pattern identification, representing a middle ground level of aggregation- larger than street segments or blocks but smaller than census tracts. 3 Because most block groups experienced relatively few metal theft incidents per year, incidents were aggregated across the whole 6-year study period for block group analyses. Comparing the annual distributions of target-specific metal theft types by block group did not yield substantively different spatial patterns, supporting the decision to analyze cumulative totals for the block group analyses.
The initial analytic strategy relied on descriptive statistics and spatial visualization to identify variation in the “when” and the “where” of metal theft across target-specific forms, time periods, geographic areas, and socio-economic contexts. Correlation coefficients and t-tests further support the identification of distinct patterns among the target-specific types of theft (Level 4) and facilitate comparison with total metal theft (Level 3). Data limitations prevented reliable disaggregation and comparison at Levels 1 (property crime) and 2 (theft). However, the results (presented below) provide strong evidence that even a Level 3 aggregation obscures substantively important temporal, spatial, and contextual variation visible at Level 4. Given the hierarchical nature of the classification framework and consistent findings from prior disaggregation studies (e.g., Andresen & Malleson, 2016; Haberman et al., 2022), it is reasonable to infer that further aggregation to Levels 1 or 2 would mask additional meaningful differences.
Results
This section presents the results of the Level 4 analysis, comparing them with those from a Level 3 analysis (using total metal theft as the variable of interest), focusing on target-specific forms of metal theft to illustrate how disaggregating incidents reveals distinct temporal, spatial, and contextual patterns. The presentation begins with overall distributions and annual trends by target-specific form, followed by analyses of monthly and weekly variation. Subsequent sections examine how theft forms differ across land-use settings, geographic concentrations, and neighborhood socio-economic contexts.
Annual Variation by Target-Specific Form
Long-term trends in metal theft were examined by disaggregating incidents into target-specific forms. Table 2 displays the distribution of 8,706 reported thefts in Louisville from 2011 through 2016. Air conditioner thefts accounted for the largest share (40.1%), followed by copper materials, including electrical wiring and pipes (21.8%), metal grates, such as storm drains and sewer covers (16.2%), and mixed metals (13.5%). Catalytic converter thefts were the least frequent, accounting for 8.4% of the total. All types of metal theft peaked in 2011, accounting for nearly one-third (32.0%) of all cases, and declined steadily through 2016, when only 6.4% of total incidents occurred.
Target-Specific Forms of Metal Theft and Overall Frequencies, 2011 to 2016.
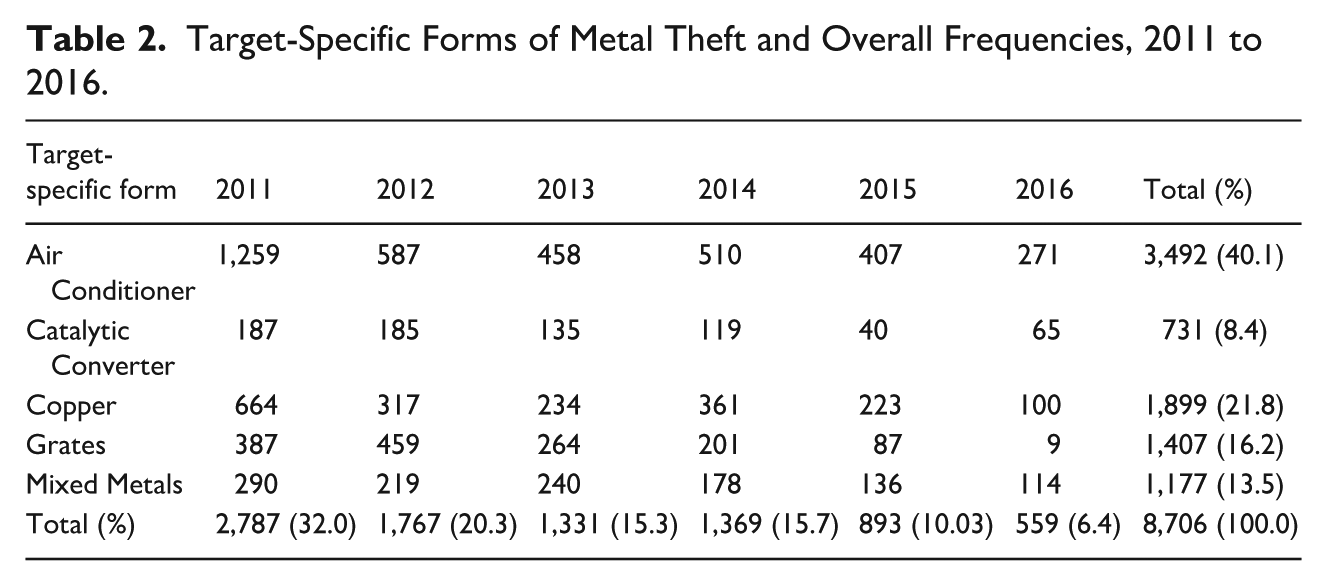
Table 3 summarizes annual percentage changes for each target-specific theft type. Although the 6-year trend shows an overall decline, the timing and magnitude of change differed markedly across forms. Grate theft increased nearly 20% between 2011 and 2012, whereas catalytic converter theft remained virtually unchanged. Air conditioner and copper theft each fell by more than half during the same interval, resulting in an overall 36% decline in total metal theft. Between 2012 and 2013, all forms declined by 22% to 43%, except for mixed-metal theft, which increased by approximately 10%. From 2013 to 2014, air conditioner theft rose 11.4%, while copper theft surged 54.3%.
Percentage Change by Year From 2011 to 2016 by Target-specific Theft Type, Louisville (N = 8,706).
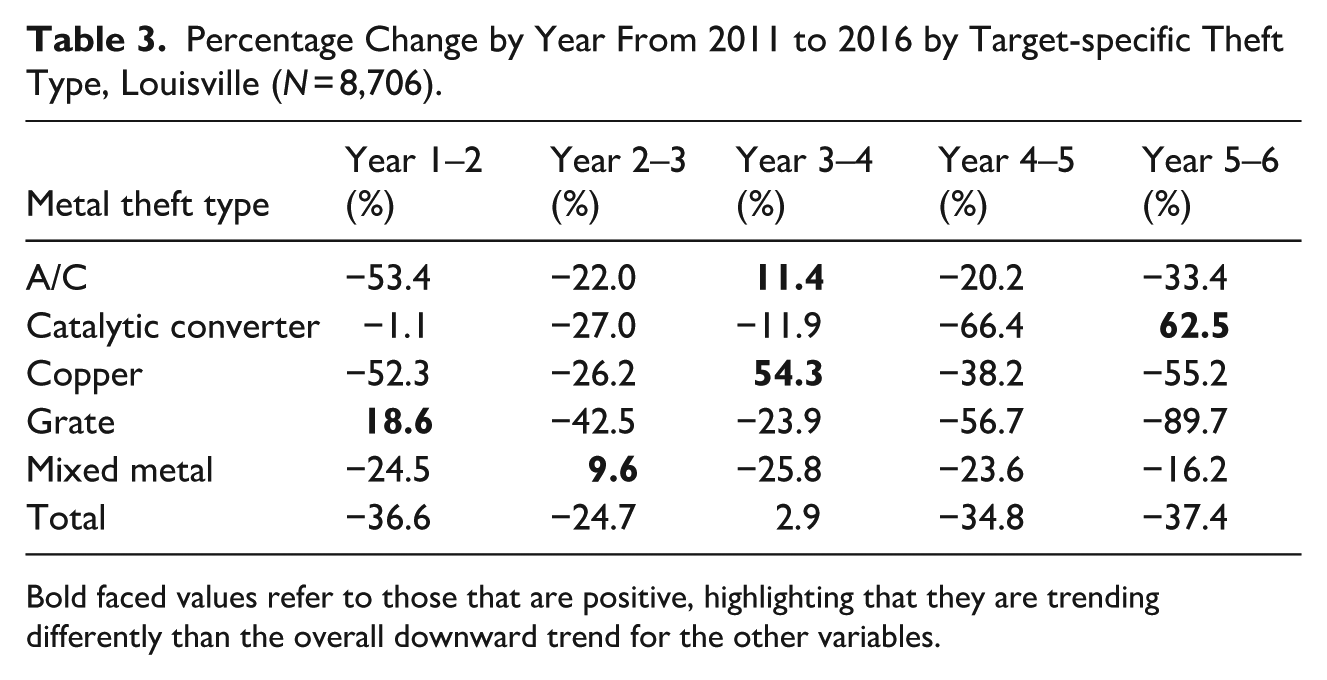
Bold faced values refer to those that are positive, highlighting that they are trending differently than the overall downward trend for the other variables.
In contrast, catalytic converter theft declined 11.9%, and both grate and mixed-metal theft dropped by roughly one-quarter. Notably, when these distinct targets are combined at Level 3 (total metal theft), the aggregate measure shows a modest 2.9% increase, thereby masking the divergent underlying trends. Comparing annual variation in offenses suggests marked differences in the magnitude and direction of increases or decreases in target-specific types of metal theft compared to an aggregate indicator of metal theft. Thus, metal theft looks very different depending on whether one uses a Level 4 or a Level 3 analysis.
Monthly Variation
Table 4 summarizes monthly descriptive statistics for the 72 months from 2011 through 2016, disaggregated by target-specific form and total metal theft. On average, 157.4 metal thefts were reported each month, ranging from 88 to 347. Some months recorded no catalytic converter or grate thefts.
Monthly Descriptive Statistics by Crime Type, 2011 to 2016 (N = 72).
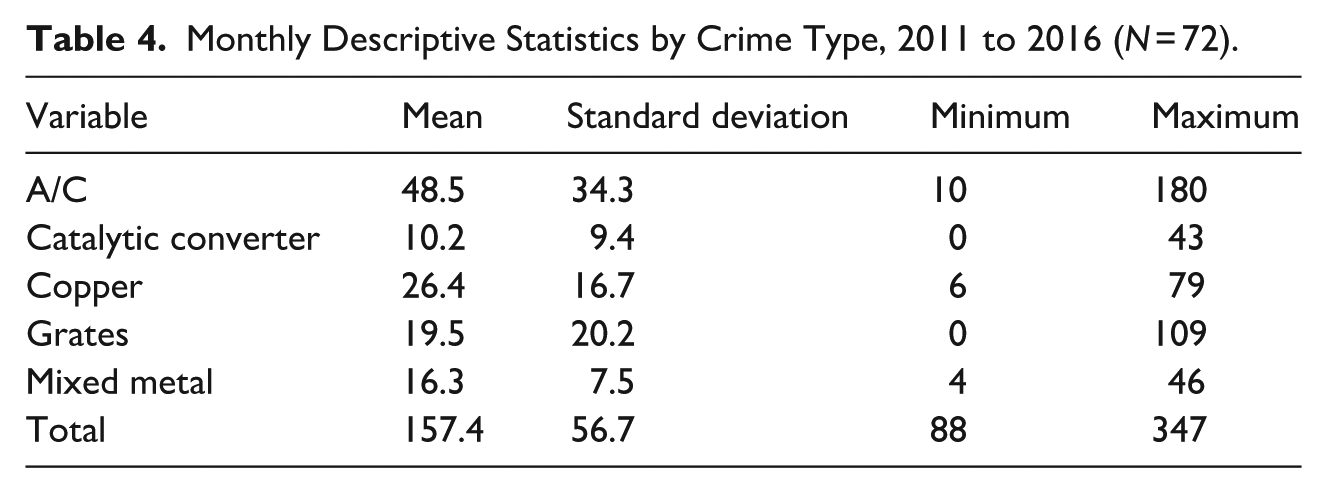
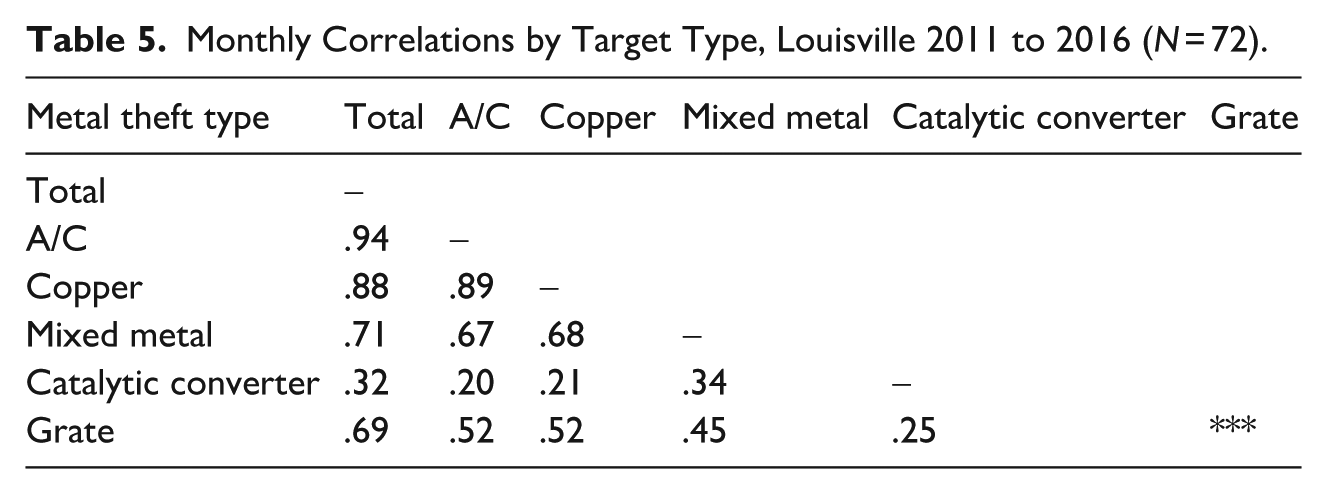
Table 5 displays the correlations among monthly counts for each target-specific form (n = 72). Correlations varied widely, indicating that different forms followed distinct monthly rhythms. Total metal theft showed the strongest association with air-conditioner theft (r = .94), consistent with air conditioners representing over 40% of all incidents. Copper theft was similarly correlated, with a correlation coefficient of .88 with total theft and .89 with air conditioners, suggesting that these two forms shared closely related temporal patterns. Mixed-metal theft showed a moderate association with total theft (r = .71) and with theft of air conditioners and copper (r = .67 and .68, respectively). Grate theft correlated .69 with total theft, but less strongly with air-conditioner and copper theft (r = .52 each). In contrast, catalytic-converter theft was a clear outlier, exhibiting weak correlations with total theft (r = .32) and with other forms (ranging from .20 to .25).
Monthly Correlations by Target Type, Louisville 2011 to 2016 (N = 72).
To assess whether the monthly trajectories of the target-specific forms of theft followed similar patterns, a time-series dataset was constructed in Stata comprising 72 monthly observations for each target-specific form of theft and the total count of metal thefts. Each series was regressed on its one-month lag, producing slope coefficients that capture the persistence of month-to-month change. Comparisons across target-specific forms were then evaluated using a t-test for the equality of regression coefficients (Paternoster et al., 1998). The t statistic is computed as:

where b1 and b2 represent the slope coefficients of the lagged variables and sb1 and sb2 are their respective standard deviations, significant t values indicate that two forms of theft exhibit statistically distinct monthly trends.
Table 6 reports the t-test results for the comparison of these slope coefficients. To conserve space, the beta coefficients and standard deviations used in the calculations are omitted. For illustration, the comparison between total metal theft and air-conditioner theft yielded lagged coefficients of 0.860 (SD = 0.062) and 0.915 (SD = 0.051), respectively, resulting in a t-value of 0.68, which is not significant at the 0.05 level. In Table 6, statistically significant differences (p < .05) are bolded and marked with an asterisk; nonsignificant comparisons are denoted “NS.”
Monthly Differences in Slopes, t-Test.
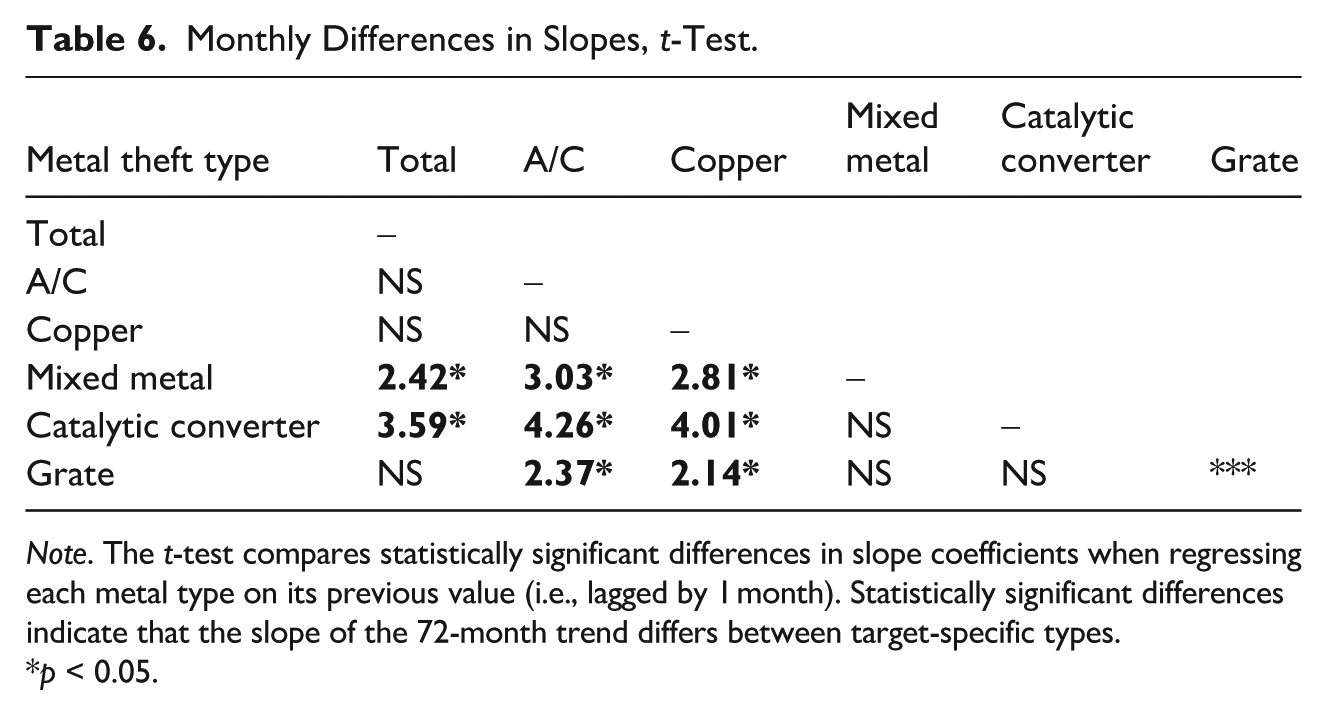
Note. The t-test compares statistically significant differences in slope coefficients when regressing each metal type on its previous value (i.e., lagged by 1 month). Statistically significant differences indicate that the slope of the 72-month trend differs between target-specific types.
p < 0.05.
As reflected in the results, the slopes for total metal theft, air-conditioner theft, and copper theft were not statistically distinguishable, mirroring the strong correlations shown in Table 5. In contrast, mixed-metal and catalytic converter thefts differed significantly from total, air conditioner, and copper thefts. Grate theft fell between these patterns; its monthly slope was similar to that of total metal theft but significantly different from those of air-conditioner and copper theft. Mixed-metal, grate, and catalytic-converter thefts also shared statistically indistinguishable slopes, apparently forming a separate temporal grouping.
Seasonal variation was further examined using monthly aggregation across the full 6-year period (N = 8,706). Figure 1 illustrates the percentage departure of each target-specific form from the overall monthly average. The reported value represents the proportional difference between the percentage of total metal thefts occurring that month and the percentage for each target-specific form [((target-specific monthly % − total theft monthly %) / total monthly theft %) × 100]. The zero point on the Y-axis indicates the overall monthly average for total metal theft since the numerator in the equation would be zero. For example, catalytic-converter theft was approximately 40% above average in January, whereas grate theft was roughly 20% below average that month. In contrast, grate theft exceeded the overall monthly average by more than 20% in June, while mixed-metal theft was more than 20% below average during the same period.
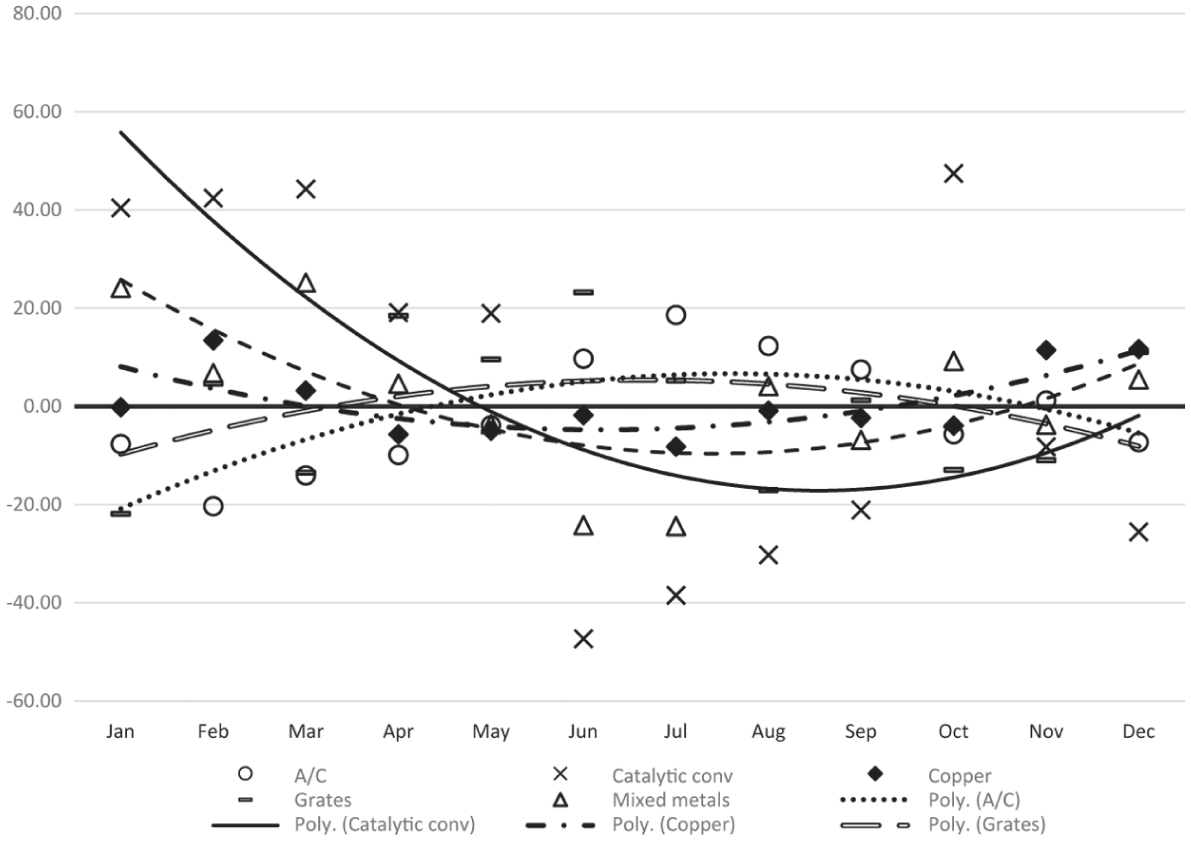
Monthly distribution of target-specific metal theft, Louisville (2011–2016).
The second-order polynomial trend lines shown in Figure 1 reveal distinct seasonal rhythms that are obscured in aggregated measures. Catalytic converter thefts were approximately 40% higher than average in January through March, but more than 40% lower in June. Air-conditioner thefts displayed the opposite pattern, peaking during the summer months and falling below average in winter. Grate theft followed a similar summer increase, whereas copper and mixed-metal thefts exhibited mild U-shaped curves with relatively higher activity in winter and late fall. These contrasts highlight that each target-specific form exhibits a distinct seasonal pattern, reinforcing the analytic value of disaggregating metal theft at the Level 4 classification.
Day of Week Variation
Table 7 presents correlations among target-specific forms of metal theft by day of the week. These values reflect the estimated day of occurrence, as recorded by investigating officers, rather than the date of report submission. Incidents were aggregated across the whole 6-year period (N = 8,706). In the dataset, the day of the week is coded as an integer from 1 (Monday) to 7 (Sunday), allowing for direct comparison of day-to-day trends.
Day of Week Correlations by Target-Specific Metal Theft 2011 to 2016 (N = 8,706).
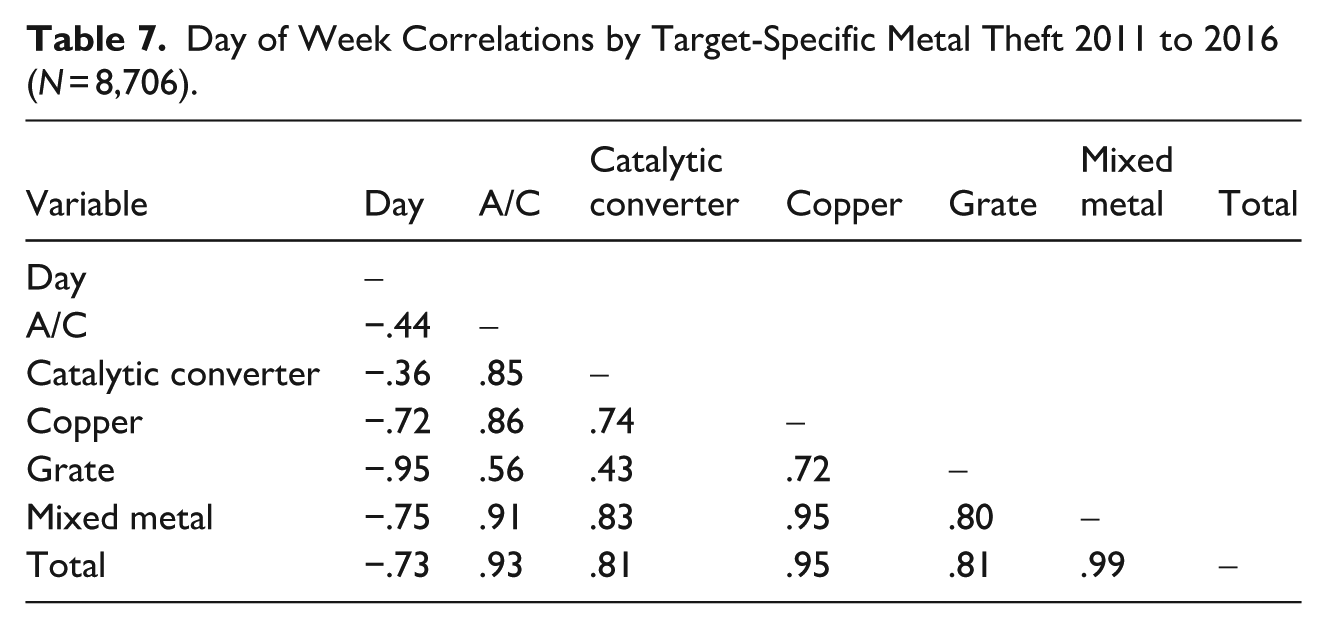
All target-specific forms show negative correlations, indicating that incidents tend to occur more frequently earlier in the week. The strength of this relationship varies substantially, ranging from −.36 for catalytic-converter theft to −.95 for grate theft. Despite their similar monthly rhythms, air conditioner and copper thefts diverged by day of the week, with correlations of −.44 and −.72, respectively. Correlations among target-specific forms also differed sharply, ranging from .43 for grate and catalytic-converter theft to .95 for mixed-metal and copper theft, highlighting a meaningful variation in weekly temporal structure.
Figure 2 visualizes these differences, showing the percentage departure of each target-specific form from the total metal-theft average for each day of the week, using a procedure similar to that in Figure 1. Catalytic-converter theft was about 10% less likely than average on Monday and Tuesday, roughly 10% more likely on Thursday and Friday, and approximately 20% higher on Saturday. Grate theft followed the opposite pattern, with more than 10% above average on Monday through Wednesday, but more than 20% below average on Friday through Sunday.
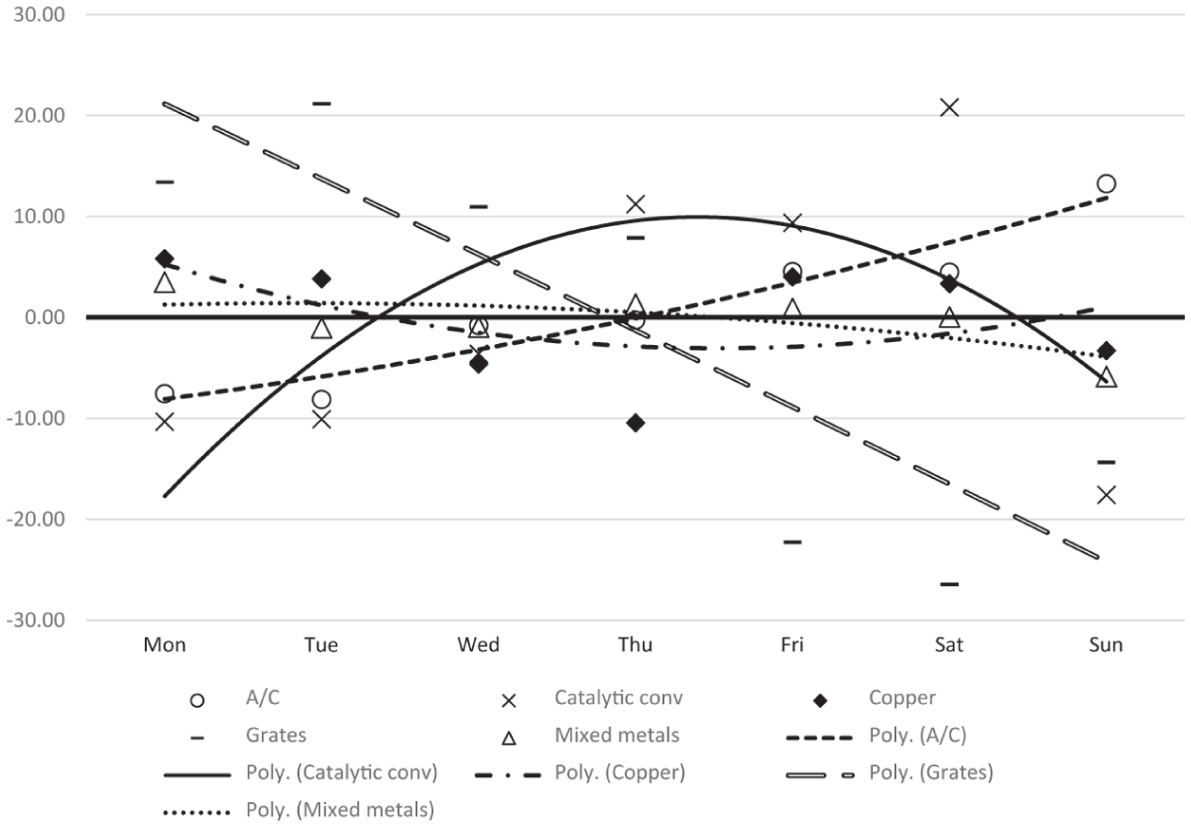
Percentage departure from monthly overall metal theft by target-specific type, Louisville 2011 to 2016 (N = 8,706).
Second-order polynomial trend lines further emphasize these contrasts. The line for grate theft (large hollow-dash) slopes sharply downward across the week, while the air-conditioner trend (small dash) rises modestly. Catalytic-converter theft follows a pronounced inverted U-shape, and copper theft displays a broad, upward-facing U. Collectively, these patterns confirm that target-specific forms of metal theft exhibit distinct weekly rhythms that would be obscured by mapping total metal theft incidents by day of the week.
Spatial Context: Land Use Patterns
Table 8 displays the distribution of each target-specific form across all land-use settings, highlighting where each theft type occurs most commonly. Here, rows sum to 100%. Air-conditioner thefts were overwhelmingly residential (79.4%), and copper thefts were similarly concentrated in residential areas (60.3%). Nearly 90% of grate thefts occurred on public roadways, and catalytic converter thefts were most common in parking areas (63.3%). To examine whether these patterns were statistically significantly different, we generated a series of two-way comparisons across all specific target-types by land use type. For example, we compared the distribution of air conditioner thefts to copper thefts. When comparing distributions of two categorical variables, the appropriate test is the Pearson chi-square test. The null hypothesis is that the two variables are unrelated. For each two-way comparison, the p-value was less than .001. Thus, we can reject the null hypothesis and conclude that the distribution of target-specific metal thefts was unrelated to land-use type. In other words, the evidence strongly suggests that the crime land-use distributions differ, and thus combining them is not advisable.
Relative Distribution of the Forms Across Land Use Categories (N = 8,706).
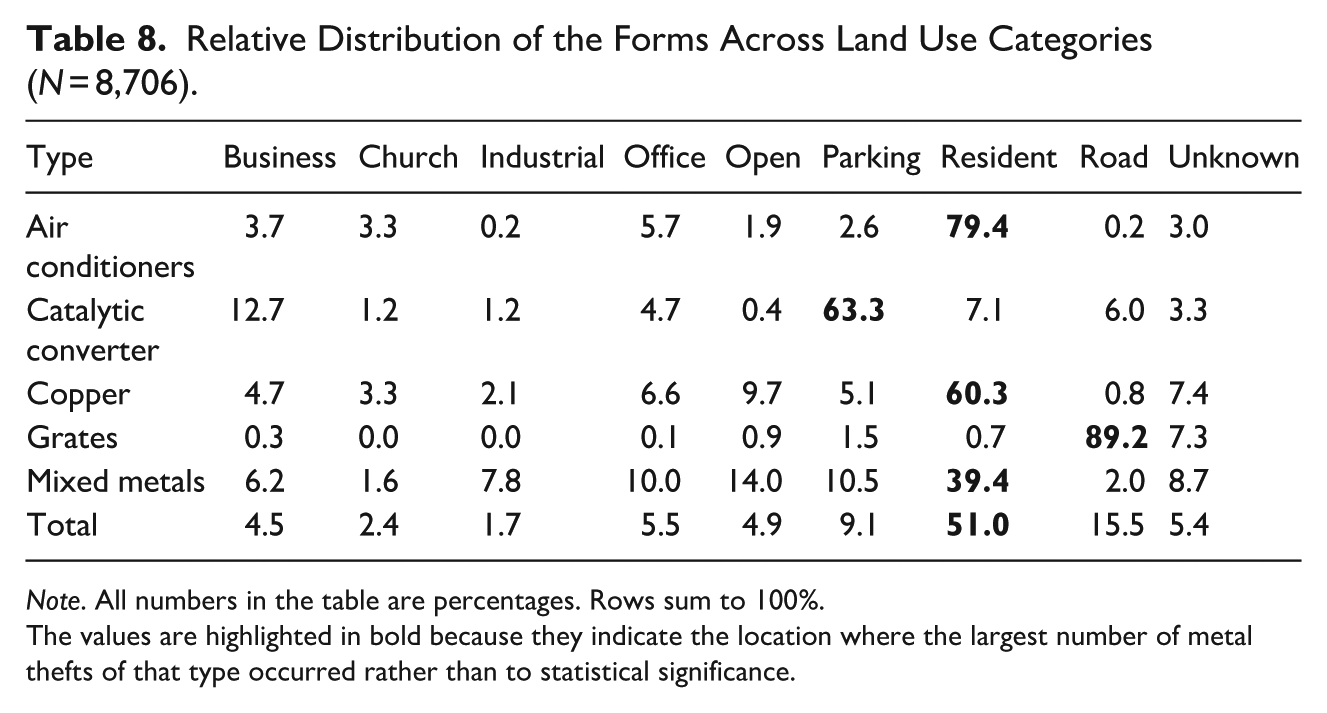
Note. All numbers in the table are percentages. Rows sum to 100%.
The values are highlighted in bold because they indicate the location where the largest number of metal thefts of that type occurred rather than to statistical significance.
Geographic Concentration
Spatial concentration was examined at the census block group level. For the first block group analysis, “high-theft” was defined as a block group in which the rate of a target-specific form of metal theft exceeded the citywide average by more than 2 standard deviations. Initially, the target-specific forms were mapped separately, as shown in Figure 3. A simple visual examination shows both overlap and distinct spatial patterning in where specific metal thefts occur most frequently.
Count of target-specific metal theft forms exceeding high-theft threshold by block group, Louisville (2011–2016).
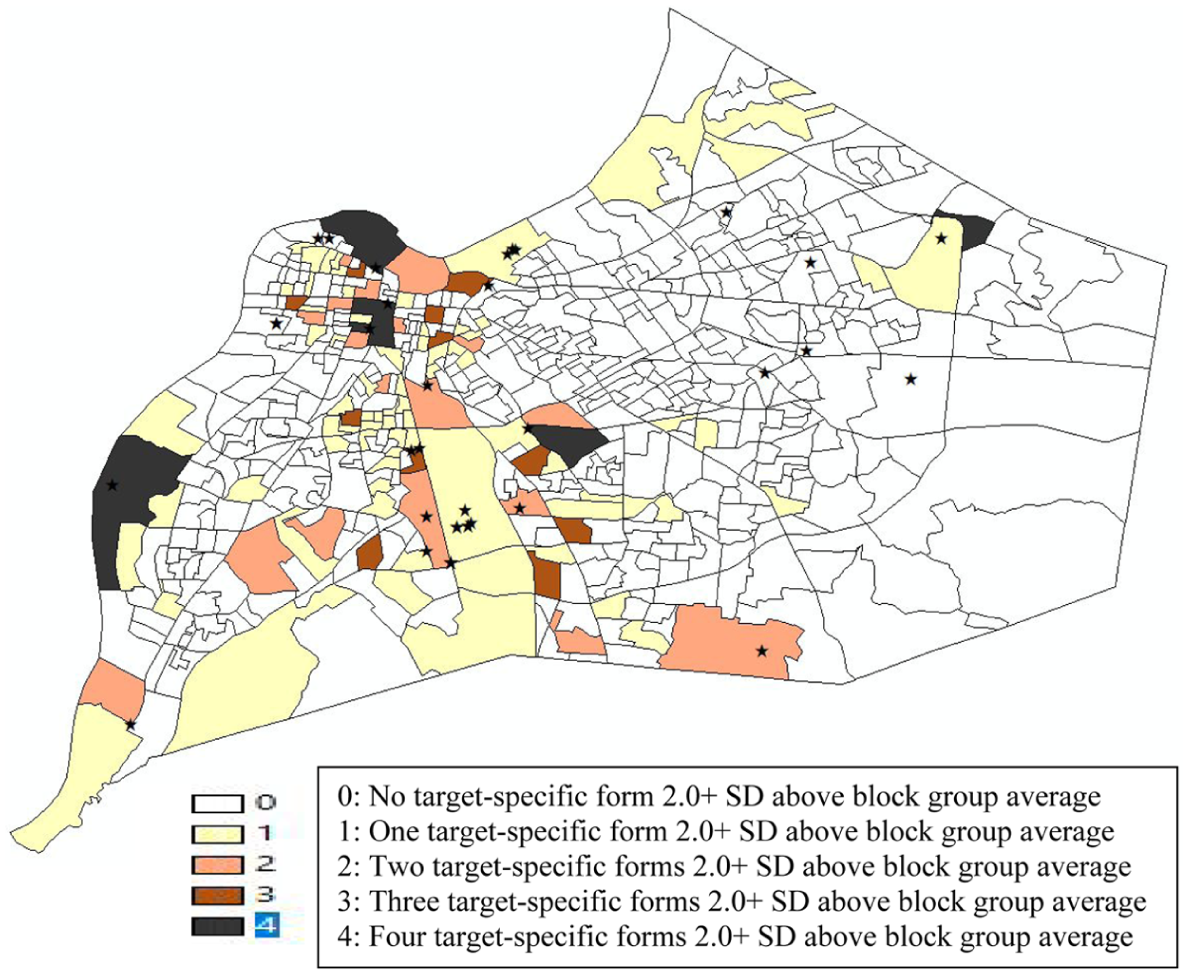
To further examine spatial clustering at the block group level, the total number of the four target-specific forms of metal theft exceeding the 2.0 standard deviation threshold was tallied. This count variable identifies how many forms are elevated relative to the block group average for each offense type, thereby capturing the degree of multi-type clustering irrespective of specific configurations. Metal theft counts were not standardized by residential population, as this denominator introduces bias in Louisville: many high-opportunity areas (industrial zones, downtown office districts, and other vulnerable non-residential sites) contain few or no residents, thereby understating risk where targets concentrate. Moreover, applying the same residential denominator to each target-specific subcategory preserves the relative relationships among forms, since it scales all counts by a constant factor.
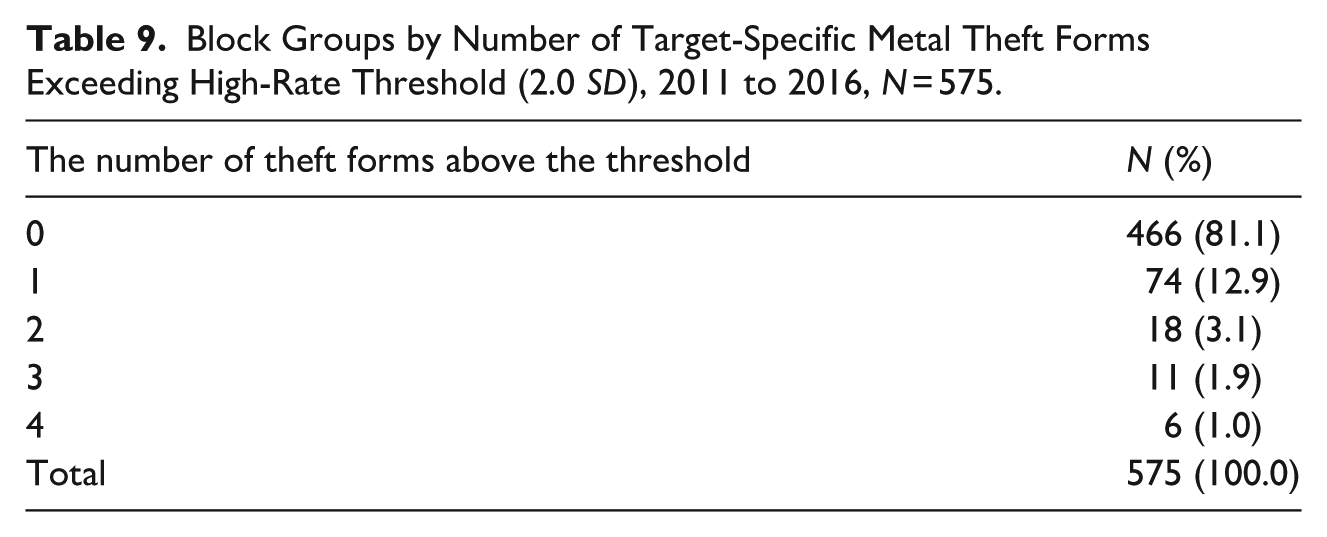
Table 9 presents a frequency distribution of the tally of high target-specific type scores across Louisville’s 575 block groups. The large majority of block groups (81.1%, n = 466) had no high-theft forms. Another 12.9% (n = 74) had one form above the threshold; 3.1% (n = 18) had two high forms; 1.9% (n = 11) had three high forms; and only 1.0% (n = 6) had elevated rates for all four forms. In addition to demonstrating Pareto-like concentration, these results indicate that while metal theft is spatially concentrated, high-theft areas rarely cluster within the same block groups.
Block Groups by Number of Target-Specific Metal Theft Forms Exceeding High-Rate Threshold (2.0 SD), 2011 to 2016, N = 575.
To further explore the degree of clustering, Table 10 presents the correlations between total and target-specific metal theft counts, aggregated by block group, over the 6-year period (2011–2016). The dataset includes only block groups with at least one reported incident (n = 472). Geographic correlations varied widely, from .23 to .70. Although air-conditioner theft accounted for over 40% of all incidents, its correlation with total metal theft was moderate (r = .65), suggesting that target-specific spatial patterns overlap only partially and do not spatially cluster in similar locations.
Block Group Correlations Among Target-Specific Metal Theft Totals by Type 2011 to 2016 (N = 472).
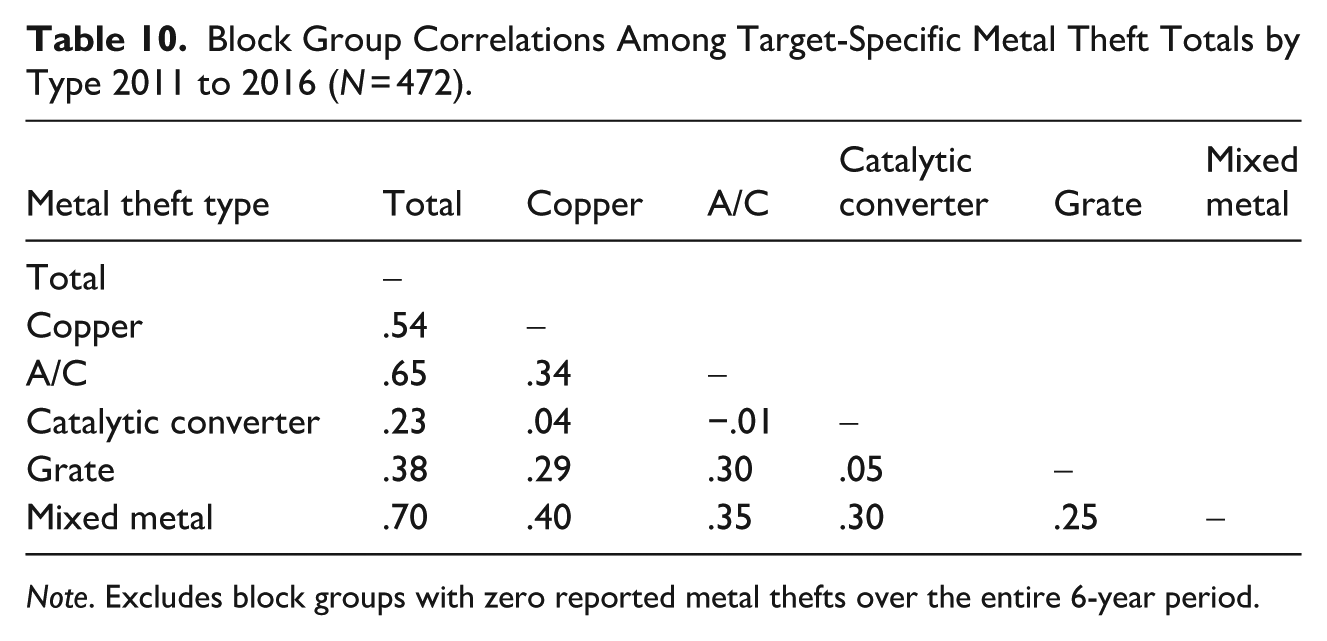
Note. Excludes block groups with zero reported metal thefts over the entire 6-year period.
Figures 3 and 4 visualize these spatial patterns. Figure 3 applies a Level 4 analysis, showing each target-specific form separately. Block groups are shaded if they exceed the high-theft (2.0+ standard deviations above the overall block-group average) threshold for that form. The maps reveal distinct geographic concentrations: catalytic-converter thefts cluster in commercial or mixed-use areas with high vehicle density, while grate thefts are more widely distributed, reflecting the citywide presence of public street infrastructure. 4
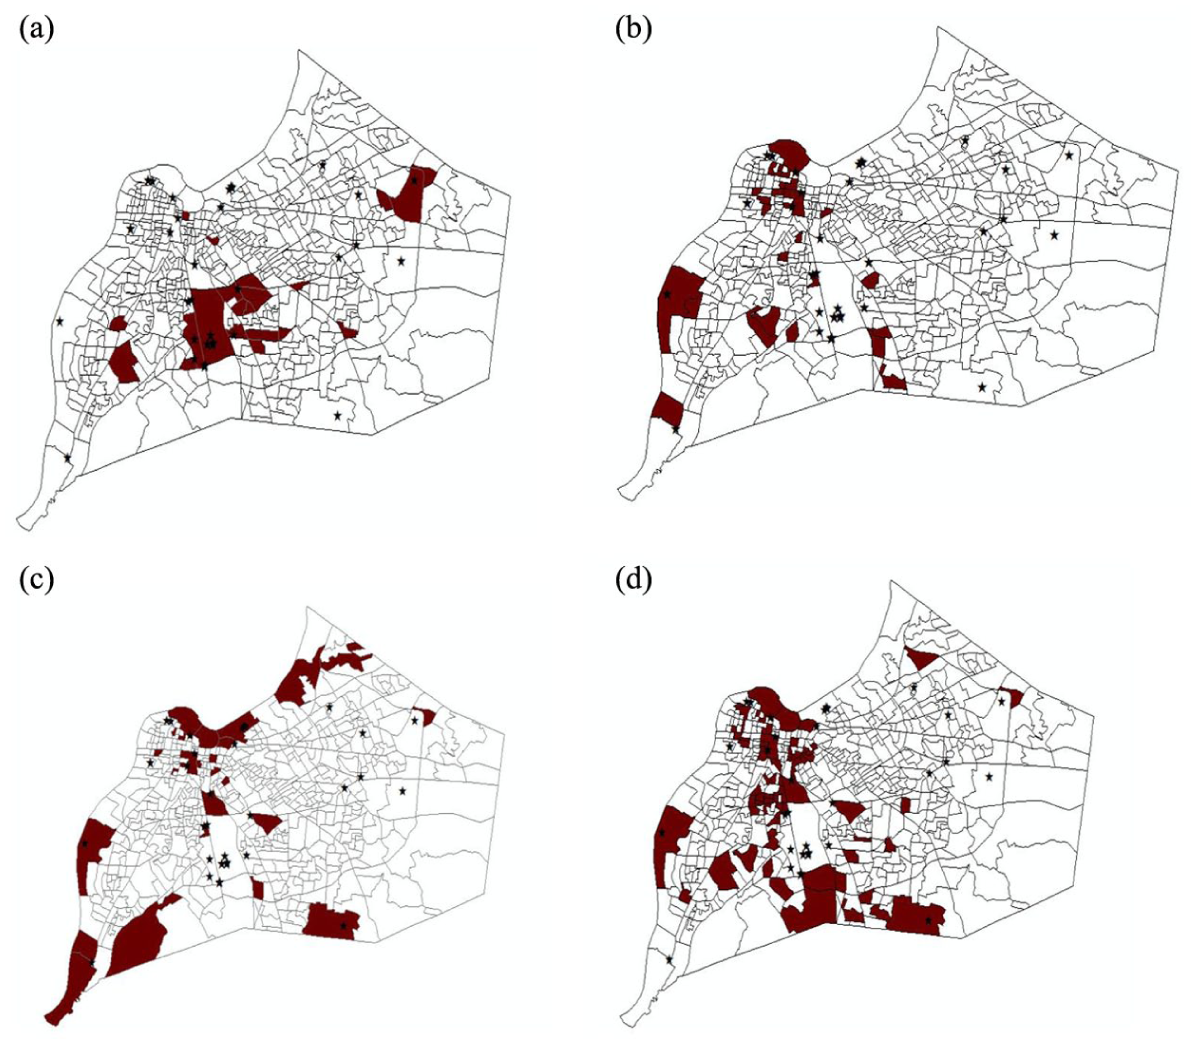
Block groups exceeding high-theft threshold for individual target-specific metal theft forms, Louisville (2011–2016). (a): Catalytic converter. (b) Air Conditioners. (c) Copper. (d). Grates.
Figure 4 maps the tally of target-specific forms exceeding the high-theft threshold within each block group. Darker shading indicates locations where multiple forms co-occurred at elevated levels, while lighter shading represents areas with one or none of the forms. 5
Socio-Economic Context
Because residential land use accounted for 51.0% of all reported metal thefts in the sample, we employ Level 4 analyses to explore whether there was variation in residential contexts for metal theft. Using median housing value (MHV) as an indicator of residential context, block groups were divided into three categories: “very low MHV” (≥2.0 standard deviations below the citywide average), “low MHV” (below average but <2.0 SD), and “average or above MHV” (at or above the citywide average). 6
Table 11 shows the average number of thefts for each target-specific form within these MHV categories, along with percentage differences from the citywide average. Metal theft was much more likely to occur in block groups with extremely low MHVs. Air-conditioner, grate, mixed-metal, and copper thefts were substantially more prevalent in very low MHV neighborhoods, with averages ranging from 135.1% to 184.0% above the citywide mean. In contrast, catalytic-converter thefts were most common in somewhat below-average MHV block groups, occurring 21.8% above the citywide mean, but were 51.9% below average in very low MHV neighborhoods and 23.6% below average in areas at or above the citywide mean. Copper, grate, and mixed-metal thefts exhibited a consistent gradient, with elevated rates in block groups with extremely low MHVs and markedly lower rates in average or above-average MHV block groups. Though a full exploration of how metal theft and socio-economic characteristics were related was not feasible due to space constraints, future research would do well to consider when and how socio-economic characteristics affect various types of metal theft.
Average Number of Thefts by Target-Specific Form and Block Group Median Housing Value (MHV) Category (With % Difference From Citywide Average).
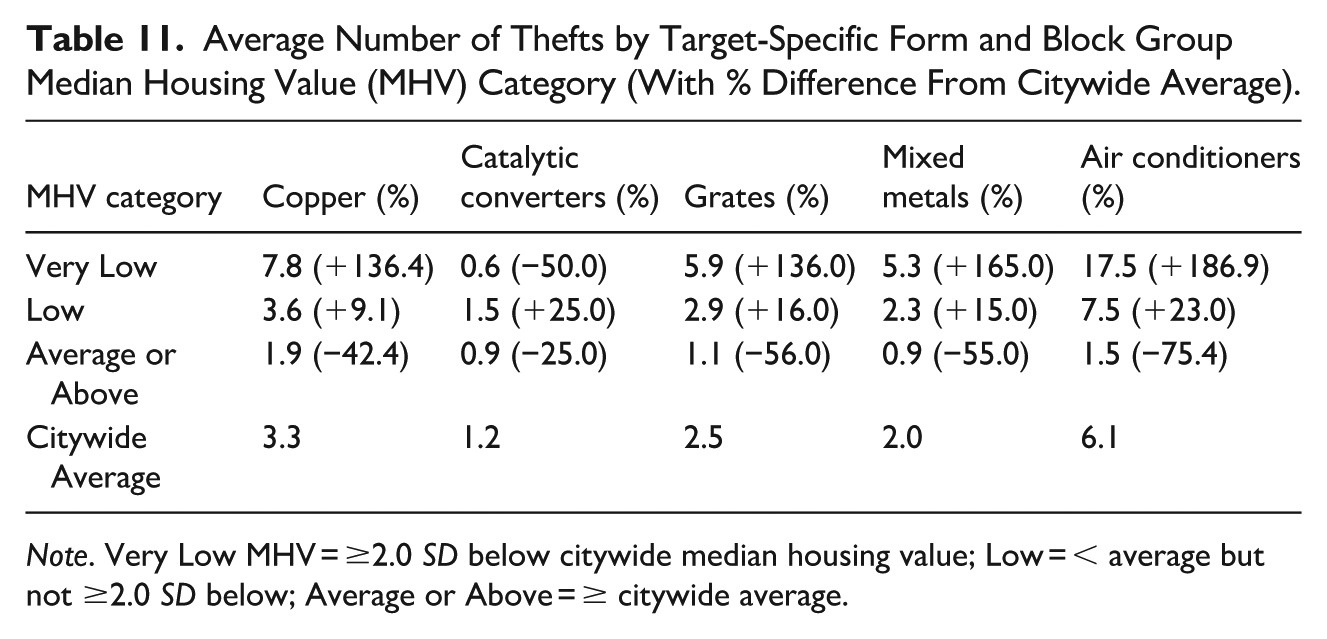
Note. Very Low MHV = ≥2.0 SD below citywide median housing value; Low = < average but not ≥2.0 SD below; Average or Above = ≥ citywide average.
Discussion
The findings from this analysis highlight the analytical and conceptual value of applying a four-level classification framework to crime data, using metal theft as an illustrative case. By comparing Level 4 (target-specific metal theft forms, e.g., air conditioners, catalytic converters, copper, grates) with a Level 3 formulation that combines all into a larger category of metal theft, the results reveal patterns obscured at the higher level of aggregation. The results reinforce a central argument of the paper, that criminological explanation and prevention depend on defining the dependent variable with precision. The distinctions uncovered here show that “metal theft” is not a single behavior but a family of situationally distinct crimes whose spatial, temporal, and socio-economic dynamics become fully visible only at Level 4 analysis. Although demonstrated through metal theft, the framework offers a scalable model for other diverse crime types, such as burglary, vehicle theft, or fraud, inviting criminologists to reconsider how offenses are conceptualized and analyzed.
Empirical Interpretation
Several findings reveal meaningful distinctions in the opportunity structures associated with each target-specific form, illustrating the analytical benefit of Level 4 disaggregation. As noted above, RAT and CPT suggest that differences in criminal opportunity should influence crime. For instance, the weak correlation between grate and mixed-metal thefts, despite their similar scrap value, suggests the importance of accessibility and situational factors, a distinction visible only when metal theft is disaggregated to Level 4. Such divergence underscores how Level 4 specification can expose opportunity structures that aggregate (Level 3) analysis obscures, thereby sharpening the application of CPT and related theories.
Temporal patterns also diverged: air conditioner thefts were most frequent in summer months and on weekdays, whereas catalytic converter thefts were more common during colder months and weekends. Within the framework of RAT, these distinctions reflect shifting combinations of motivated offenders, suitable targets, and guardianship. These contrasting rhythms, visible exclusively at Level 4, demonstrate how finer classification reveals dynamic opportunity structures that a unified “metal theft” category would mask. For example, weekday air conditioner thefts from residential areas and churches may coincide with residents’ absence during work hours, while catalytic converter thefts in parking areas illustrate a high density of exposed, poorly protected targets, more common on weekends and in colder weather.
Spatially, target-specific forms clustered in distinct land-use settings. Air conditioners were most often stolen from residences, catalytic converters from parking areas, and grates from public roadways, patterns that likely mirror the everyday placement and exposure of these items within urban environments. Again, these place-specific concentrations emerge clearly only through Level 4 disaggregation. However, across land-use types, air conditioners were the most frequently stolen items in residential areas, businesses, and churches. Socio-economic variation followed a similar logic: most forms of metal theft were concentrated in economically disadvantaged neighborhoods (even grates, apparently stolen from roadways in economically depressed areas), yet catalytic converter thefts occurred more frequently in moderately disadvantaged or commercial areas, where vehicles and large parking lots are common. This departure from prior findings linking metal theft broadly to severe economic disadvantage (e.g., Ashby et al., 2017; Bennett, 2008) further highlights how Level 4 analysis uncovers contextual factors, such as vehicle density, target type, or parking practices, that can override neighborhood SES in shaping opportunity structures.
The geographic distribution of metal theft also exhibits a Pareto-like pattern, with roughly 20% of block groups accounting for the majority of high-theft areas. Importantly, this concentration holds even when examined within individual target-specific forms, aligning with well-established regularities in the crime-concentration literature (Andresen et al., 2017; Eck et al., 2007; Weisburd, 2015), and reinforcing that opportunity structures remain sharply localized at finer levels of classification.
Together, these nuances affirm that “metal theft” is not a single behavior but a collection of situationally distinct crimes whose unique temporal, spatial, and contextual dynamics become apparent only at Level 4. Using only Level 3 categorization (metal theft), these important nuances in temporal rhythms, spatial concentrations, and contextual conditions that drive each incident type would be obscured. The present findings are also consistent with the CAPTURED framework recently applied to metal theft by Burton et al. (2026). By breaking metal theft into discrete crime-script stages, they highlight how processable and transferable characteristics become especially salient after the initial removal event insights that are only visible when metal theft is examined at the target-specific (Level 4) level proposed in the current study.
Implications for Theory
As noted, Crime Pattern Theory (CPT) and Routine Activity Theory (RAT) are two theories commonly used to explain property offenses. Both purport to explain when and where crime occurs rather than focusing on why particular individuals would be motivated to commit crime. The findings of the current study are consistent with some aspects of RAT and CPT. For example, RAT and CPT would predict—and our results confirmed—that catalytic converters are stolen where there are concentrations of vehicles such as parking garages. Additionally, lack of guardianship might explain why other targets were markedly more likely to be stolen in block groups with extremely low median housing values (as shown in Table 11). Other results were not clearly predicted by RAT or CPT. As shown in Table 3, we observed marked heterogeneity in annual percentage changes across target-specific types (e.g., all metal thefts declined from 2011 to 2012 except grate theft, which increased 18.6%; all types declined from 2012 to 2013 except mixed metal theft, which rose nearly 10%). Although both theories predict variation based on differences in opportunity structures, target suitability, and routine activity rhythms, standard applications do not explain why annual trends in grate and mixed metal thefts would diverge from each other as well as from other types of metal theft. Clearly, the specific divergence in annual trends across forms suggests that both theories would benefit from examining the heterogeneity within metal theft seen here (e.g., by incorporating target-specific differences in accessibility, seasonal demand, or awareness spaces).
Consistent with Opportunity Theory and Brantingham and Brantingham’s (1995) environmental criminology framework, the results reveal that target accessibility and situational context create distinct opportunity structure patterns that emerge clearly only when offenses are disaggregated by target-specific form. Aggregating conceptually distinct behaviors into broader categories can mask these differences and undermine theoretical inference. The Level 4 framework addresses this limitation by classifying offenses according to target-specific forms and the conditions under which they occur, thereby clarifying the environmental and situational cues that shape offending patterns. Although demonstrated here with metal theft, the approach generalizes readily to other crimes, such as burglary, vehicle theft, or retail fraud, where similar internal variation likely influences opportunity and prevention strategies.
Implications for Practice and Data Systems
Recognizing that different target-specific forms follow distinct patterns enables more effective prevention strategies. For instance, catalytic converter thefts may be reduced through enhanced lighting and surveillance in parking areas. In contrast, air conditioner thefts in disadvantaged residential neighborhoods may benefit from physical barriers or community-based guardianship, re-engineering units, or changing installation practices to “target harden.” Grate thefts, concentrated in public infrastructure, demand interagency coordination and municipal oversight rather than traditional enforcement. These examples illustrate the value of tailoring prevention to micro-level environmental features, consistent with recent CPTED research, which shows that physical design characteristics can significantly influence crime occurrence (Wijekoon & Warusavitharana, 2024).
These findings also underscore the importance of improving crime data systems. Implementing a multi-level classification approach requires detailed and consistent data collection at the reporting stage. Enhancing NIBRS or local systems to record target-specific details would enable agencies to identify crime-specific patterns without extensive post hoc coding. For example, the Arlington Police Department incorporated target-specific form distinctions among theft types to inform resource deployment (Rash et al., 2023), and Arkansas’ statewide mandate for incident-level geocoded location data enabled micro-level mapping to guide patrol strategies (Drawve et al., 2021).
Emerging tools, including natural language processing (NLP) and generative artificial intelligence (AI), may further support this process by automating classification and helping data systems evolve as crime targets and circumstances change over time (Padilla & Adams, 2025). One promising example, by Horsefield et al. (2025), used a natural language processing algorithm to examine police narratives, searching for signs of alcohol usage by offenders that had been missed in structured reporting practices. This approach revealed an additional 28% of cases compared to relying on police proactively flagging cases as alcohol involved. As NLP and AI technologies evolve, it will become increasingly feasible to identify target-specific forms of crime in near real time, enabling more precise prevention and faster adaptive responses, even without the need for reporting officers to check a box or for crime analysis teams to read hundreds of reports searching for nuanced details about crimes. Officers simply recording specific details in the narratives will be sufficient for agencies to identify target-specific crimes and develop a nuanced, targeted response.
Limitations and Future Directions
Although this study provides a detailed and disaggregated analysis of metal theft, several limitations warrant consideration. First, the analysis is based on officially reported incidents from a single city, Louisville, Kentucky. As with all police data, these figures are subject to underreporting, particularly for offenses such as catalytic converter or grate theft, which may be misclassified or go unreported altogether. Second, the classification of thefts into target-specific forms was based on available incident details. Great care was taken to ensure accurate coding; however, some ambiguity in narrative descriptions or reporting practices may have introduced misclassification bias. The development of automated or semi-automated coding tools could enhance future work in this area by improving reliability and scalability, and by enabling comparisons of classification strategies across jurisdictions and over time.
Third, the study’s socio-economic analysis used median housing value as a proxy for neighborhood SES. This measure was selected due to its availability at a fine spatial scale (block group level) and its relevance to the physical and economic conditions that influence target visibility and vulnerability. However, relying on a single proxy limits the ability to fully disentangle socio-economic influences from other contextual factors (e.g., land use or target accessibility) that interact with target-specific crime patterns. Future applications of the Level 4 framework would benefit from incorporating more comprehensive measures of neighborhood context where available, to sharpen further insights into how opportunity structures vary across diverse crime subtypes.
Finally, the study’s spatial analysis is cross-sectional (though aggregated across 6 years of incident reports), which limits the ability to make causal inferences. Although patterns of concentration and co-occurrence are clearly documented, longitudinal designs or natural experiments would enable researchers to assess changes over time more effectively and identify causal mechanisms, such as the effect of policy interventions or fluctuations in the scrap metal market.
Despite these limitations, this research opens promising paths for future inquiry. Comparative studies across multiple cities can assess whether observed patterns generalize to other contexts. Additional work might also apply the Level 4 framework to other crime types, such as burglary, vehicle theft, fraud, or robbery, to test its utility beyond metal theft. Adopting target-specific classifications of this kind will enable more targeted, theory-driven, and context-aware research and more effective, tailored prevention strategies.
Footnotes
Funding
The authors received no financial support for the research, authorship, and/or publication of this article.
Declaration of Conflicting Interests
The authors declared no potential conflicts of interest with respect to the research, authorship, and/or publication of this article.