
Abstract
This study examines how undocumented item-level missingness during scale construction of the Youth Psychopathic Traits Inventory (YPI) within the Pathways to Desistance dataset accessed through ICPSR can shape the measurement properties and downstream use of the measure in secondary analysis. Patterns of item absence/nonresponse in the YPI are documented and the measure is reconstructed using a prorated scoring approach. Summated and prorated versions of the YPI are compared using descriptive and correlational analyses and incorporated into mixed-effects models predicting self-reported offending. Public summated YPI scores include values that fall outside the possible range of the scale because missing items are implicitly scored as zero. However, summated and prorated measures are nearly identical in their distributions and correlated at near-perfect levels in the between- and within-person components. Mixed-effects models produce substantively equivalent estimates across scoring approaches. These findings should not be taken as evidence that scoring irregularities are trivial; rather, they demonstrate the importance of evaluating and correcting for or ruling out such concerns. This process is supported through evaluation of secondary data by secondary analysts, alongside transparent documentation practices by data curators that support validity and replicability in criminological research.
Keywords
Introduction
[T]he sparkle of these new [open-source] data sources is irresistible. They tell us so much that we did not know before; they are readily available; and they are cheap, often seemingly free. Sometimes this sparkle blinds us to the flaws of data. These problems need to be considered as they limit their ability to provide a set of agreed-upon facts. (Lynch, 2018, p. 440)
This observation motivates the study that follows. As Lynch (2018) argued, the challenge is not simply whether data are available, but whether the procedures underlying their construction, coding, and documentation are sufficiently transparent to permit meaningful analysis, evaluation, and replication. This paper illustrates one manifestation of that concern within a widely used secondary dataset.
Since the latter half of the 20th century, analysis of existing data has become a gold mine for researchers. A large portion of literature in the field of criminology and criminal justice relies on secondary data as its only source of information. Secondary data are collected by principal investigators (PIs) and made publicly or semi-publicly available for others to use in their own research. 1 Riedel (2000) first demonstrated the prevalence of secondary data in empirical studies, finding that from 1992 to 1996, 56.2% of articles in Criminology and 29.8% of articles in Justice Quarterly used secondary data. Since then, other researchers have examined the prevalence of data types in criminological research and concluded that between 41% and 60% of empirical studies use secondary data sources (Kleck et al., 2006; Nelson et al., 2014; Woodward et al., 2016). As reliance on these data has grown, scholars have highlighted the importance of examining (e.g., completeness, absolute values, and codebook), cleaning (e.g., removing duplicates and attending to missingness), and verifying (e.g., cross-checking with validated scales and previous publications) these data before using them to study issues related to crime and justice (e.g., Cheng & Phillips, 2014; Kiecolt & Nathan, 1985; Laub et al., 1990). These considerations extend beyond methodological rigor, as decisions made during the collection and preparation of primary data for public use can shape secondary analyses, theory testing, and interpretation. As such, these decisions should be carefully evaluated, rather than treated as assumptions to be overlooked.
To be clear, there is good reason to use secondary data sources. One advantage is that secondary data are often readily available at little to no cost, saving researchers valuable time and monetary resources by bypassing the lengthy process of designing and conducting primary research studies. This is especially true for longitudinal datasets, which require significant time and financial investment (e.g., Clark et al., 2025; Fahmy et al., 2019; Laub & Sampson, 2020). Many secondary data sources contain large and/or representative samples, which increases statistical power and generalizability (e.g., Gang Resistance Education and Training [GREAT]; Millennium Cohort Study; National Longitudinal Study of Adolescent to Adult Health [Add Health]; National Longitudinal Survey of Youth [NLSY]). In addition, secondary data can be linked to information from different sources, locations, or time periods to facilitate innovative research, replication, and reproduction (e.g., Nguyen et al., 2023; Pyrooz et al., 2020). Finally, when datasets are publicly shared (e.g., Global Terrorism Database, LaFree & Dugan, 2007; Project of Human Development in Chicago Neighborhoods, Earls & Visher, 1997; Sampson et al., 2022; The Violence Project, Peterson & Densley, 2019; The LoneStar Project, Mitchell et al., 2018; Pyrooz & Decker, 2019), it creates synergy by inciting interest, enabling principled open science (Nix et al., 2025; Sweeten et al., 2024), and rallying continued research within a topic, which can inform policy and practice. 2
While these are important strengths of secondary data, there are limitations to secondary data that can create vulnerabilities (Chermak et al., 2025). Secondary datasets may not always align with the theoretical, empirical, or policy questions posed by secondary analysts (Johnston, 2014). This is not a shortcoming of the data themselves, rather it reflects the fact that primary data are collected with specific goals in mind. For example, a youth-focused study may not extend into adulthood, limiting its ability to address questions about adult onset or continuity in offending. Therefore, variables of interest may be absent, conceptualized or operationalized differently than needed, or collected from populations or contexts that limit suitability or generalizability for new analytic purposes (Cheng & Phillips, 2014; Laub et al., 1990; Nelson et al., 2014). These issues arise from the misalignment between research questions and available data, emphasizing the importance of understanding upstream design decisions when evaluating whether secondary data are appropriate for answering new theoretical, empirical, or policy questions (Laub et al., 1990).
In addition, issues of accuracy, reliability, and transparency may arise when secondary analysts have limited information about how items were coded, how missing data were handled, or what procedures shaped the final constructed variables. Because the credibility of empirical findings is inextricably linked to the quality and clarity of the underlying data, it is important to understand sampling strategies, missingness patterns, the conceptualization and construction of key scales, and other upstream procedural decisions made by the PIs. Sampling methodology, for example, determines who was eligible for inclusion, representativeness, and the kinds of inferences that can be drawn from the data (Berk, 1983, 2004). Problems such as selection bias, inadequate sampling frames, and non-random selection threaten these foundations. Missing data, whether from attrition, item nonresponse, or PI-level removal for inconsistencies or confidentiality, remains a pervasive challenge (Brame et al., 2010; Brame & Paternoster, 2003). Although numerous strategies exist for addressing missingness (e.g., full information maximum likelihood [FIML], multiple imputation; Allison, 2002; Brame et al., 2010; Mitchell et al., 2022; Woods et al., 2024), their effectiveness depends on what secondary analysts know about how data were coded and processed, including whether they have access to underlying item-level responses or only preconstructed scales. Variables and scales may also be based on definitions or measurement choices that lack suitability for new analytic purposes (e.g., categorical versus continuous age), external validation, or reliability testing. Finally, as Chermak et al. (2025) stated, “the effectiveness of the coding process hinges significantly on the skill, diligence, and training of the human coders involved” (p. 155). Coding is ultimately a human endeavor. Even well-trained research teams can introduce discrepancies that affect subsequent analyses. While these issues are often unintentional and understandable in large, multi-wave projects, recognizing them strengthens validity and replicability, and highlights how critical PI-level decision-making, documentation, and transparency are for downstream research.
Against this backdrop, the present study provides a concrete illustration of how data construction decisions in secondary datasets can shape widely used measures. The goal of this study is to contribute to ongoing conversations about the responsible use of public data and to encourage PIs and secondary analysts alike to pause and take stock when submitting and seizing public datasets. In this context, continued attention to how constructed measures, coding decisions, and documentation shape the data that enter public circulation is central, as is understanding how those inherited decisions influence subsequent analytic choices. Importantly, the patterns examined here are not unique to the data at hand, but reflect complexities that can emerge in all large, multi-wave datasets where measurement may evolve over time and data must be prepared and shared for public use.
Although a range of issues can emerge within secondary datasets, potential concerns become especially clear in the context of scale construction. This study draws on the Pathways to Desistance study (hereafter “Pathways”; Mulvey, 2012), which is one of criminology’s most venerable longitudinal datasets. The analysis focuses on the Youth Psychopathic Traits Inventory (YPI; Andershed et al., 2002), a widely used measure in the Pathways dataset and one of the primary instruments for assessing psychopathy, a preeminent psychological risk factor for offending (DeLisi, 2009). 3 Three key issues are examined: (1) the prevalence of missingness within the YPI scale and its implications for the public-facing, summated YPI scores, (2) differences between the original YPI and new person-mean imputed (i.e., prorated) scores in terms of descriptive statistics and correlations, and (3) whether the two scoring approaches produce substantively different results in mixed-effects models predicting self-report offending.
These issues matter because Pathways is a cornerstone of criminological research, having contributed to hundreds of publications and garnered thousands of citations across diverse criminological and criminal justice research areas. The YPI total score, or one of its dimensions, has been used in over 75 published empirical studies as an independent, dependent, mediator, moderator, or control variable (see Supplemental Appendix A). 4 The insight this study provides is straightforward but critical: undocumented item-level missingness in a pre-constructed scale can produce scoring irregularities, but careful reconstruction can identify and account for them, clarify the validity of prior findings, and illustrate best practices for future research using secondary datasets. Rather than critiquing Pathways, this case study demonstrates how coding decisions can persist even in exemplary data sources, and why routine attention to constructed measures is essential for transparent and replicable secondary analysis.
Data and Focal Measure
Pathways to Desistance
Pathways to Desistance consists of a sample of 1,354 serious adolescent offenders adjudicated guilty in Philadelphia, Pennsylvania (n = 700) and Phoenix, Arizona (n = 654). 5 Participants were recruited between November 2000 and January 2003. All participants were convicted of a felony, specific misdemeanor property crimes, a misdemeanor weapons offense, or a misdemeanor sexual assault between the ages of 14 and 17. Information regarding the rationale and overall design of the study can be found in Mulvey et al. (2004). Pathways consisted of one baseline interview and 10 follow-up interviews. The baseline interview took place between November 2000 and March 2003. 6 The 10 follow-up interviews took place over a period of 7 years after participants’ court involvement for the enrollment eligible crime; the first 6 follow-up interviews were completed at 6-month intervals over a 3-year period, and the remaining 4 follow-up interviews were completed yearly. All interviews were conducted using computer-assisted interviewing. A complete description of the data collection procedures is provided by Schubert et al. (2004). 7 The analysis below begins with all 1,354 participants.
Focal Measure: Youth Psychopathic Traits Inventory (YPI)
The Youth Psychopathic Traits Inventory (YPI) is a self-report assessment designed to measure symptoms of psychopathic personality disturbance (Andershed et al., 2002). It was developed to identify youth ages 12 and above who display persistent and serious antisocial behavior into adulthood, with the goal of capturing the interpersonal, affective, and behavioral characteristics that define the psychopathic personality constellation. Importantly, the YPI excludes items that reference criminal behavior directly (Cooke & Michie, 2001; see Supplemental Appendix B for a complete listing of the items). The YPI was not part of the original baseline interview. It was added to the study protocol in version 01.06 of the interview instrument and is, therefore, first available at the 6-month follow-up. All subsequent waves include a YPI assessment.
The original measure of the YPI in the Pathways data consists of a sum of 50 items on a 4-point scale (1 = Does not apply at all, 2 = Does not apply well, 3 = Applies fairly well, 4 = Applies very well), which together assess core psychopathic traits among participants (absolute range = 50–200). Respondents were instructed to answer each statement as they most often think and feel, not only how they feel in the moment. Higher scores reflect a higher prevalence of psychopathic traits. In an analysis conducted by the Pathways team, the YPI total score demonstrated high levels of internal reliability within each wave (α = .93–.94).
Underlying the YPI are the grandiose manipulative, callous unemotional, and impulsive irresponsible dimensions, which reflect the interpersonal, affective, and behavioral domains, respectively, from the three-factor model of psychopathy (Cooke & Michie, 2001; Hare, 2003):
Interpersonal Domain (absolute range = 20–80)
○ Described in the YPI as the grandiose manipulative dimension ○ Represented by 20 items (e.g., “I am better than everyone on almost everything” and “I can make people believe almost anything”)
■ Subdomains: Dishonest charm, grandiosity, lying, and manipulation ○ High levels of reliability within each wave (α = .91–.92).
Affective Domain (absolute range = 15–60)
○ Described in the YPI as the callous unemotional dimension ○ Represented by 15 items (e.g., “To feel guilt and regret when you have done something wrong is a waste of time” and “I usually feel calm when other people are scared”)
■ Subdomains: Callousness, unemotionality, and remorselessness ○ Acceptable levels of reliability within each wave (α = .73–.79).
Behavioral Domain (absolute range = 15–60)
○ Described in the YPI as the impulsive irresponsible dimension ○ Represented by 15 items (e.g., “I like to be where exciting things happen” and “I have often been late to work or classes in school”)
■ Subdomains: Impulsiveness, thrill-seeking, and irresponsibility ○ Good levels of reliability within each wave (α = .82–.87).
The individual items comprising the YPI are not included in either the public or restricted Pathways data files. This is not uncommon; many large-scale secondary datasets provide composite or summated scores rather than item-level data to simplify access or protect participants’ confidentiality. Constructed scales are commonly accompanied by documentation on how missingness was handled (e.g., [multiple] imputation, proration, or list- or pair-wise deletion; Brame & Paternoster, 2003).
Pathways’ documentation for other scales illustrates this practice. For example, the documentation for the Psychopathy Checklist: Youth Version (PCL:YV; Forth et al., 2003) explicitly addresses how missing items are handled, noting:
Sometimes there is insufficient information to score a particular item. In these situations, an item can be omitted. The PCL-YV can accommodate up to five missing items without invalidating the total score. Two items can be missing without invalidating the factor scores. If items are omitted, scores are prorated using tables provided by the authors.
Similarly, the codebook entry for Pathways’ neuroticism measure [S4NTOT] provides clear documentation: it is computed as the “mean of items 13, 30, 45, 81, 17, 83, 100, 113, 5, 33, 67, 25, 56, 89, 107” where “11 items [were] required to compute the mean.” These examples reflect best practices in documenting how scale scores are derived from underlying items.
In contrast, the documentation for the YPI is less transparent about how missingness is handled. The online codebook simply states: “YPI Total score [S#ypi]; sum of all 50 items in the measure,” with no mention of how missing responses are treated (aside from a bug in the programming code, coded as -700). 8 This also holds true for the domain scores. Therefore, secondary analysts are left to investigate the data and relevant documentation for information on how missingness is incorporated into the scales. Because missingness can affect the validity of summated scales, particularly when raw sums are used without adjustment, the next section provides an examination into missingness patterns in the YPI, outlines a strategy for constructing an alternative measure, and provides the methodology for comparing the two scoring approaches.
Methods
This section outlines a four-part strategy to (1) examine the properties of the summated YPI scores provided by Pathways, (2) quantify absence and missingness in the underlying data, (3) construct prorated alternatives, and (4) compare the summated and prorated measures using mixed-effects models. Together, these steps provide a comprehensive assessment of how item absence shapes the YPI scores commonly used in secondary analyses of the Pathways data.
Stage One: Diagnostic Review of YPI Scores
The first step is reviewing the descriptive statistics of the YPI variables as they appear in the Pathways dataset. Because the overall YPI is scored as a sum of 50 items, with items scored between 1 and 4, values should not fall below the scale’s minimum of 50. However, descriptive statistics immediately reveal scores below this absolute range. Four participants have total YPI scores <50 across the panel, seven participants have interpersonal domain scores with sums <20 across the panel, four participants have affective domain scores with sums <15 across the panel, and two participants have behavioral scores with sums <15 across the panel. These scoring irregularities are not mutually exclusive; seven unique participants account for these cases, with several appearing in more than one instance. These values reflect a scoring pattern that arises from how missing items are incorporated. The summated YPI appears to operationalize missing items information as zero-valued responses, despite zero falling outside the response range of the instrument. As a result, missing item information is scored as a level of disavowal stronger than the lowest possible endorsement. In practice, this means that item absence shifts scores downward by assigning respondents values below the instrument’s minimum response category, potentially conflating item nonresponse or absence with extremely low levels of psychopathic traits. Therefore, what appears to be low-trait expression in the public data may, in some cases, reflect absent item information rather than true low endorsement.
A simple example illustrates the potential magnitude of this issue:
Respondent 1, who answered all 50 questions (i.e., 100%) with the lowest possible values, receives a nearly identical total score to Respondent 4, who answered only a fraction of items (i.e., 26%), but with the highest possible values. If Respondent 4 had answered the remaining 37 questions as 1s (i.e., the lowest possible value), their total score would have been 89, substantially exceeding Respondent 1’s score. As such, differences in item completion, not underlying traits, can meaningfully drive observed scores, potentially biasing subsequent analyses if left unexamined.
To quantify this relationship, a pooled ordinary least squares (OLS) regression with robust standard errors clustered by respondent (N = 11,972; 1,335 clusters) regresses total YPI summated score on the number of items answered, using item-level missingness counts obtained via personal correspondence (see "Stage Two: Quantifying Item-Level Missingness in the Underlying Data" section for details). The association is strong and positive (b = 1.89, p < .001). This means, on average, each additional item answered is associated with a 1.89-point increase in total YPI score. 9 This pattern is evident in the raw data. For example, one participant (ID 53461) scored 42 at Wave 1 after answering only 20 YPI items; at Wave 2, after answering all 50 items, that respondent’s score increased to 105. Importantly, scoring irregularities also occur even when totals remain within the valid range. For instance, another respondent (ID 52372) scored 74 at Wave 1 after answering 42 items, but at Wave 2, after answering all 50 items, their score increased to 110. These cases illustrate how differences in item completion can substantially change total YPI scores, consistent with the regression results.
Stage Two: Quantifying Item-Level Missingness in the Underlying Data
Stage two quantifies the extent of absent YPI item information at each wave and progressively distinguishes between overall item absence in the public summated scores and true item-level nonresponse among valid YPI administrations. Because item-level responses are not included in the public or restricted use Pathways files, non-identifiable total missing item counts were obtained from a member of the Pathways research team. No item-level responses were shared to maintain confidentiality. 10
Table 1 displays the number of absent YPI items at each wave as reflected in the public summated scores for the full Pathways sample. These counts encompass all forms of item absence, including true item nonresponse, as well as waves in which the YPI was not administered due to versioning or administrative issues, documented programming errors, and missed interviews. The majority of person-wave observations contain no missing YPI items across waves. When missingness occurs, it is often concentrated in entire waves (i.e., 50 absent items), whereas partial missingness is comparatively uncommon, but persists across the panel.
Item Missingness Present in the Youth Psychopathic Traits Inventory (YPI) Summated Variables (N = 1,354).
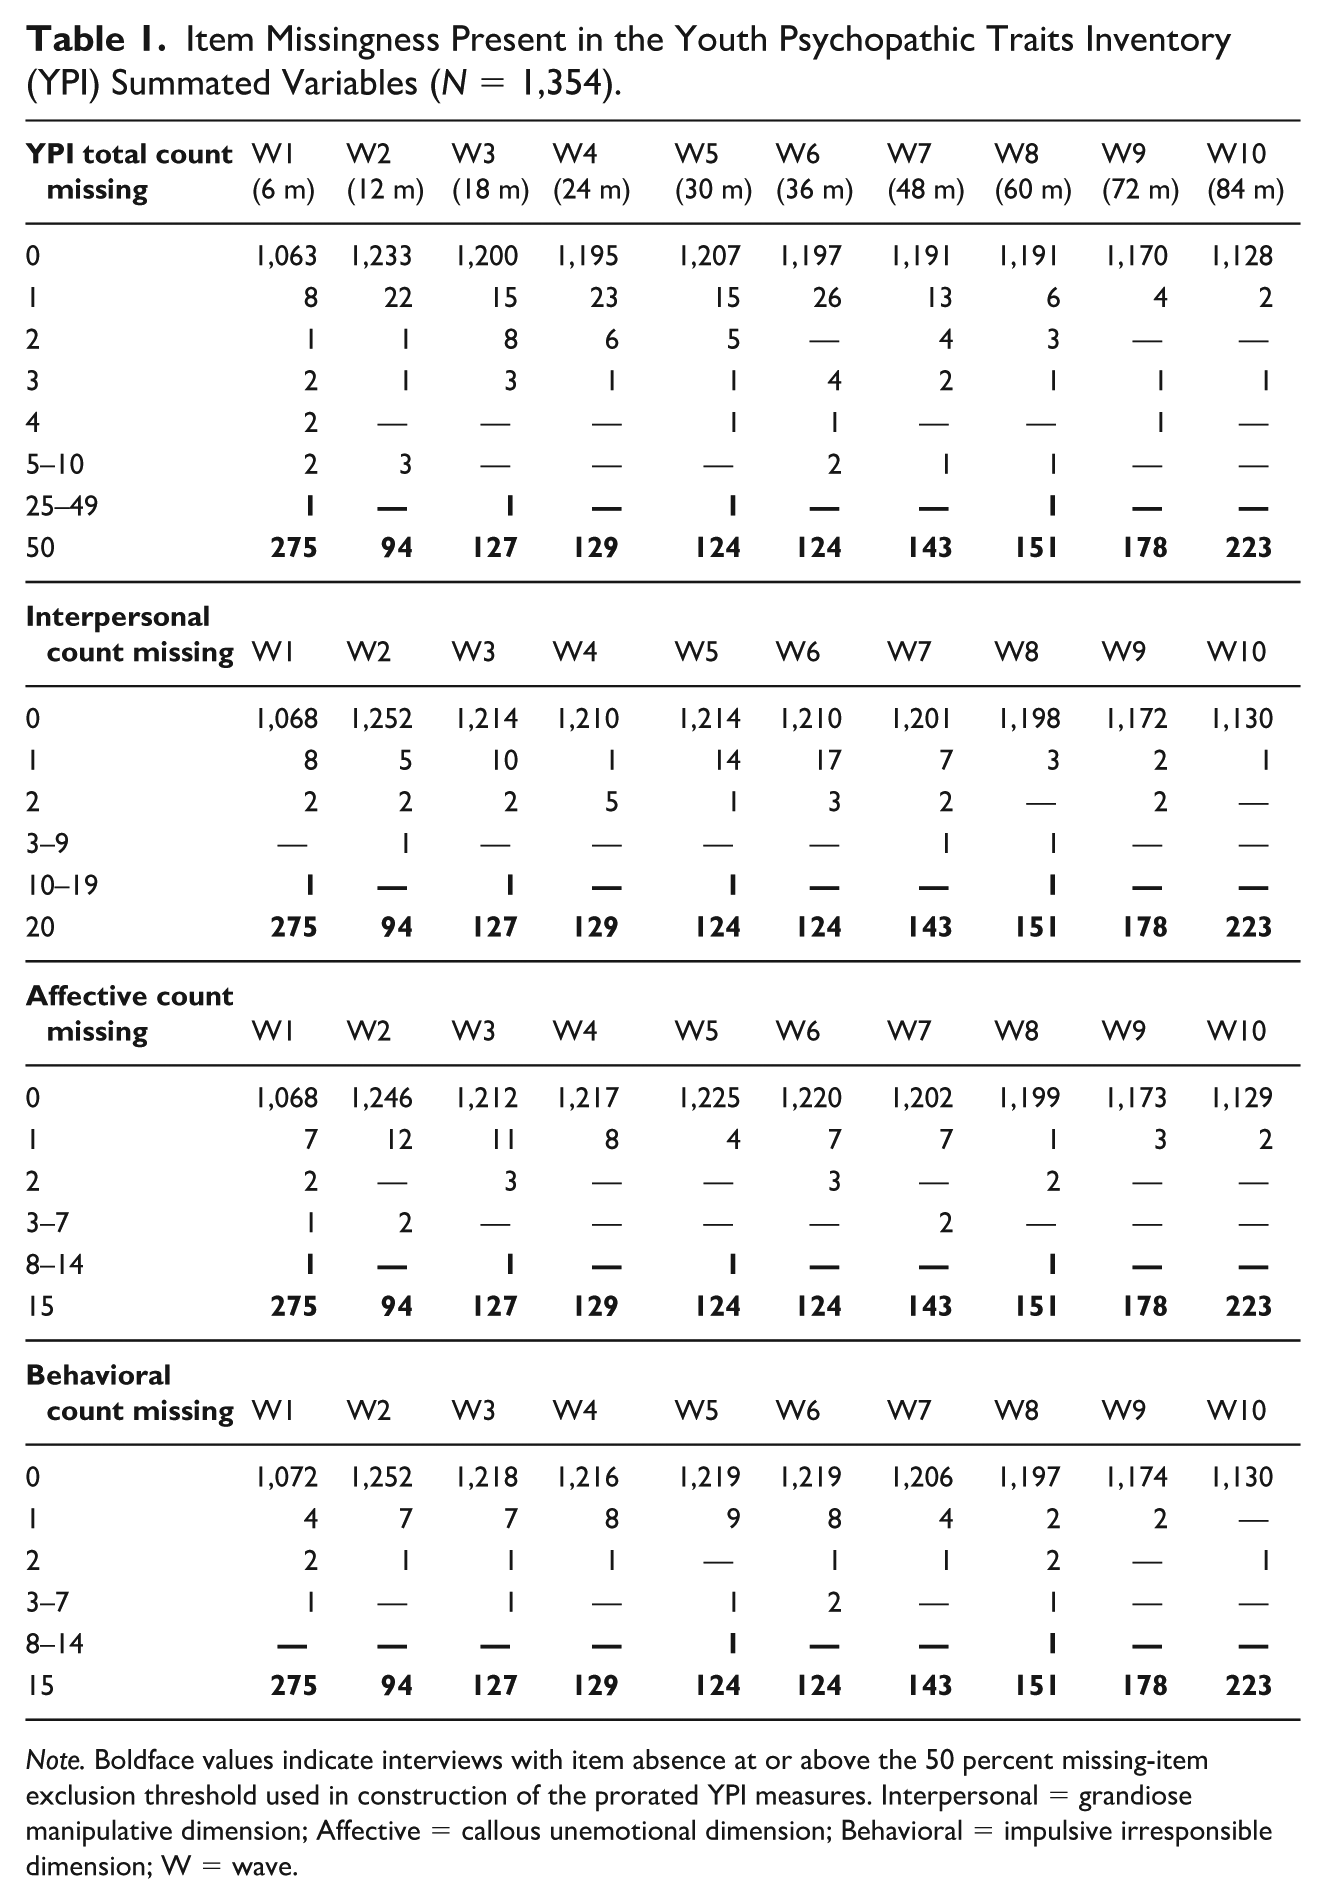
Note. Boldface values indicate interviews with item absence at or above the 50 percent missing-item exclusion threshold used in construction of the prorated YPI measures. Interpersonal = grandiose manipulative dimension; Affective = callous unemotional dimension; Behavioral = impulsive irresponsible dimension; W = wave.
Across the full panel, 11.65% of YPI psychopathic traits items are absent from the summated scores (n = 78,845/677,000 possible responses). 11 This percentage reflects all forms of item absence, including waves in which the entire interview was missed, the YPI was not validly administered, documented programming errors, and true item nonresponse. When missed interviews are removed, the percentage of absent items in the summated scores falls to 1.85% (n = 11,245 of 609,400 possible responses). 12 However, this still includes observations where the YPI was not validly administered or was excluded due to a programming error.
Aggregate percentages may mask important variation at the person and person-wave levels. Shifting to these units clarifies how item absence is distributed across respondents and interviews in the public summated data. Seventeen participants were enrolled in the study but provided no interview data at any wave and are excluded from person-wave and person-level calculations. Of the 12,188 completed interviews (across 1,337 participants who completed at least one follow-up interview), 413 (3.39%) person-wave records included at least one absent YPI item. At the person level, 320 participants (23.9%) have one or more YPI items absent during at least one completed interview (i.e., these are not cases where the participant missed the entire wave), including two participants who were interviewed but never had a valid YPI administration. Among those with any item absence, participants are associated with an average of 35 absent YPI items (SD = 23.6, range = 1–100) cumulatively across all interviewed waves. Importantly, this figure is driven primarily by interviews in which the YPI instrument or item content was structurally absent, rather than by respondents selectively skipping YPI items.
To isolate true item-level nonresponse, the quantity most relevant for assessing potential measurement bias, subsequent analyses restrict attention to waves in which the YPI was validly administered and exclude observations affected by interview nonparticipation or structural YPI absence. Among the 11,972 person-waves with valid YPI administration, 197 records (1.65%) contain one or more missing YPI items. At the item-response level, this corresponds to 445 missing items out of 598,600 possible responses across valid YPI administrations (0.074%). At the person-level, 132 participants (9.89% of those with at least one valid YPI interview) exhibit item-level nonresponse in one or more waves. Among these participants, the cumulative number of respondent-skipped YPI items across validly administered interviews averaged 3.37 items (SD = 5.85, range = 1-38). Thus, while item-level nonresponse does occur in the Pathways YPI, it is limited in scope and concentrated among a relatively small subset of respondents.
Although it would be ideal to assess whether item-level missingness follows a systematic pattern (e.g., demographic group, wave), this is not possible because individual item responses are not available in the public or restricted-use files. 13 Only item-count information was obtained, precluding direct tests of item-level missingness mechanisms. However, the available evidence suggests that missing items were limited and concentrated among a relatively small subset of respondents, rather than being broadly diffused across the sample. This pattern suggests that undocumented scoring decisions, rather than pervasive nonresponse linked to psychopathic traits, are the primary source of measurement irregularities, though the underlying causes of item nonresponse cannot be empirically evaluated.
Stage Three: Construction of Prorated YPI Measures
To address the irregularities introduced by the summated scores, prorated YPI measures were constructed for the total scale and each of the three domains (i.e., interpersonal, affective, and behavioral). In this context, prorated refers to a person-mean imputation approach, in which a respondent’s average score across completed items is used to estimate the scale score when at least half of the items in that scale were answered. Proration was applied only to person-wave observations in which the YPI was validly administered; all other observations were excluded.
Prorated scales are an appropriate solution for the YPI in the Pathways data for four main reasons. First, prorated scales are a common approach for handling missing item scores in the social sciences (e.g., Garofalo et al., 2022), including in studies of psychopathic traits (e.g., Kelley et al., 2016; Pink et al., 2023). Second, because prorated scores incorporate information from all available items for respondents with incomplete data, they provide a more accurate representation of the underlying construct compared to raw summated scores that implicitly treat missing items as zeros. Third, prior research has shown proration to be a robust strategy to deal with item-level missing data (Siddiqui, 2015), particularly when the number of items missing and the number of respondents with missing data is 20% or less (Downey & King, 1998). Fortunately, the amount of missingness in the Pathways YPI is low, both in terms of the number of items absent and the proportion of interviews affected. Finally, while alternative approaches may be better suited to addressing item-level missingness (e.g., multiple imputation, FIML), the item-level measures required for these methods are not accessible.
A series of steps are undertaken to create the prorated measures. First, Carpenter (2018) recommended that, in scale creation, “[s]cholars should consider deleting cases when the majority of responses (50 percent or more) contain missing data” (p. 35). Following this guidance, any person-wave YPI record in which 25 or more of the 50 items were absent is coded as missing and excluded. This same 50% criterion was applied to each domain-level scale, ensuring that the domain-specific measures met the same standard of measurement reliability as the total score. After applying this criterion, 1,335 participants retain at least one valid YPI interview (N×W = 11,968), all retained data meets a minimal standard of measurement reliability, and total and domain-level samples are aligned.
Prorated scores are computed as follows. Missing-item counts are converted into the total number of items answered for each scale at each wave. Then the mean value for each respondent is calculated at each wave by taking the
Stage Four: Analytic Strategy for Comparing YPI Scoring Approaches
Stage four outlines the analytic framework used to evaluate whether the newly constructed prorated YPI measures differ meaningfully from the original summated scores created by the Pathways investigators. Because the objective is to determine whether unaddressed item missingness in the summated scores affects scale properties or associations with offending, comparisons proceed in two ways. First, the summated and prorated versions of the YPI are assessed descriptively and through correlations to determine whether they differ in their distributional characteristics, conceptual validity, and within- and between-person correspondence. Second, scoring approaches are incorporated into a series of mixed-effects regression models to evaluate whether handling missingness alters statistical interpretations, coefficient magnitudes, or model fit. Descriptive comparisons and correlations are estimated using all valid YPI person-wave observations, whereas regression models are estimated on a more restricted sample (described below). Together, these analyses provide a comprehensive assessment of measurement equivalence (i.e., whether the two approaches yield comparable distributions and correlations) and analytic equivalence (i.e., whether they behave similarly in models predicting offending) across scoring methods.
Analytic Strategy: Descriptive Statistics and Correlations
The descriptive component compares means, standard deviations, and ranges across scoring approaches and examines the extent to which each scale adheres to the lowest possible values allowed by its measurement structure. Because the summated YPI treats missing items as zeros, some respondents receive scores that fall below the theoretical minimum; comparing these patterns to the prorated measures provides a first indication of whether the alternative scoring approach yields a more valid representation of psychopathic traits. Standardized versions of each scale are then used to facilitate direct visual comparison across metrics. Finally, correlations are estimated at the between- and within-person components to evaluate the degree to which each scoring approach captures the same underlying construct over time.
Analytic Strategy: Mixed-Effects Models
The second component evaluates whether summated and prorated YPI scores behave similarly when used to predict offending, as well as when they are treated as outcomes in reverse-direction models. Offending is measured using the Self-Reported Offending (SRO) scale (Huizinga et al., 1991), which was administered at each wave of data collection. For this analysis, 23 forms of self-report offending are included in a variety score (e.g., entered/broken into a building to steal something; sold marijuana; shot someone; been in a fight; a complete listing of items is in Supplemental Appendix C), 14 which is calculated by summing the number of distinct antisocial or illegal acts endorsed at each wave. 15 A variety score is used because it is highly correlated with both frequency and seriousness of offending and possesses high reliability and validity (Farrington, 1973; Sweeten, 2012). Respondents missing data on any of the 23 offending items are excluded from the analysis for that wave.
To reduce the risk of model misspecification, both time-stable and time-varying covariates are included in the models. Time-stable factors include sex, race/ethnicity, and study site; these adjust for demographic and jurisdictional differences known to correlate with both psychopathic traits and antisocial behavior. Time-varying covariates include age, perceived neighborhood disorder, and exposure time (the proportion of the recall period spent in the community rather than a secure facility). These variables capture developmental, contextual, and exposure-based sources of variation that may influence both psychopathic traits and offending. For detail on the control variables and descriptive statistics, see Supplemental Appendix D.
Mixed-effects models with random intercepts for respondents to account for repeated measures (Rabe-Hesketh & Skrondal, 2012; Raudenbush & Bryk, 2002) provide the primary test of whether the two scoring approaches produce similar results. To ensure adequate longitudinal information for estimating within-person change, participants with fewer than three valid YPI assessments or fewer than three valid measures of offending variety are excluded. This criterion ensures that each participant contributed at least two usable lagged observations, in line with recommendations for longitudinal random-effects models (e.g., Allison, 2009). Observations were further required to have valid (i.e., non-missing) information on all covariates included in the mixed-effects model. The final sample size for the mixed-effects models is 1,228 participants (90.7% of total sample), reflecting the additional restrictions required for estimation.
Time varying predictors are decomposed into between-person (person-mean) and within-person (person-centered deviation) components to distinguish stable individual differences from wave-to-wave fluctuations in psychopathic traits (Piatkowska et al., 2022). Offending variety—a count variable—serves as the main outcome and is modeled using mixed-effects Poisson regression (mepoisson) with maximum likelihood estimation. A common concern with count data is overdispersion (i.e.,
The mixed-effects modeling proceeds in two steps. First, as shown in Equation 1, a parsimonious model is estimated to examine the association between psychopathic traits and offending variety, accounting only for within- and between-person variation and time indicators:

where (
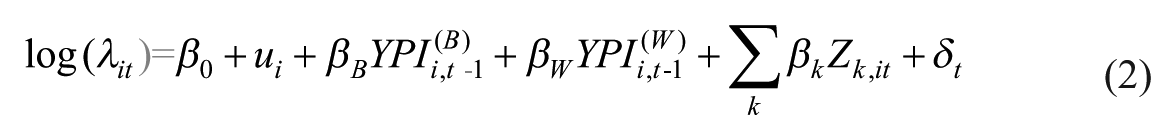
where
All models include random intercepts for persons to account for the repeated-measures structure of the data (i.e., waves nested within persons), standardized YPI measures to place the summated and prorated scales on a common metric, robust standard errors, and wave indicators to adjust for any panel-based methodological trends. Model fit is evaluated using Akaike Information Criterion (AIC) and Bayesian Information Criterion (BIC) to determine whether proration meaningfully improves explanatory accuracy. 17
Results
Descriptive and Bivariate Comparisons
Table 2 displays the mean pooled-wave descriptive information for the YPI summated scales provided by Pathways and the prorated scales created for comparison. All four summated scales contain minimum values that fall below the absolute lower bound of the instrument (total YPI min = 21; interpersonal min = 8; affective min = 4; behavioral min = 9). These values reflect the scoring pattern documented earlier: missing items contribute zeros to the summated total, resulting in values that are numerically impossible under the intended measurement structure. In contrast, the prorated scales fall at or above their absolute minimum value (total min = 1.06; interpersonal min = 1; affective min = 1; behavioral min = 1), indicating that proration eliminates these irregularities and better reflects the scales’ defined ranges.
Youth Psychopathic Traits Inventory (YPI) Summated and Prorated Scale Descriptive Comparisons.
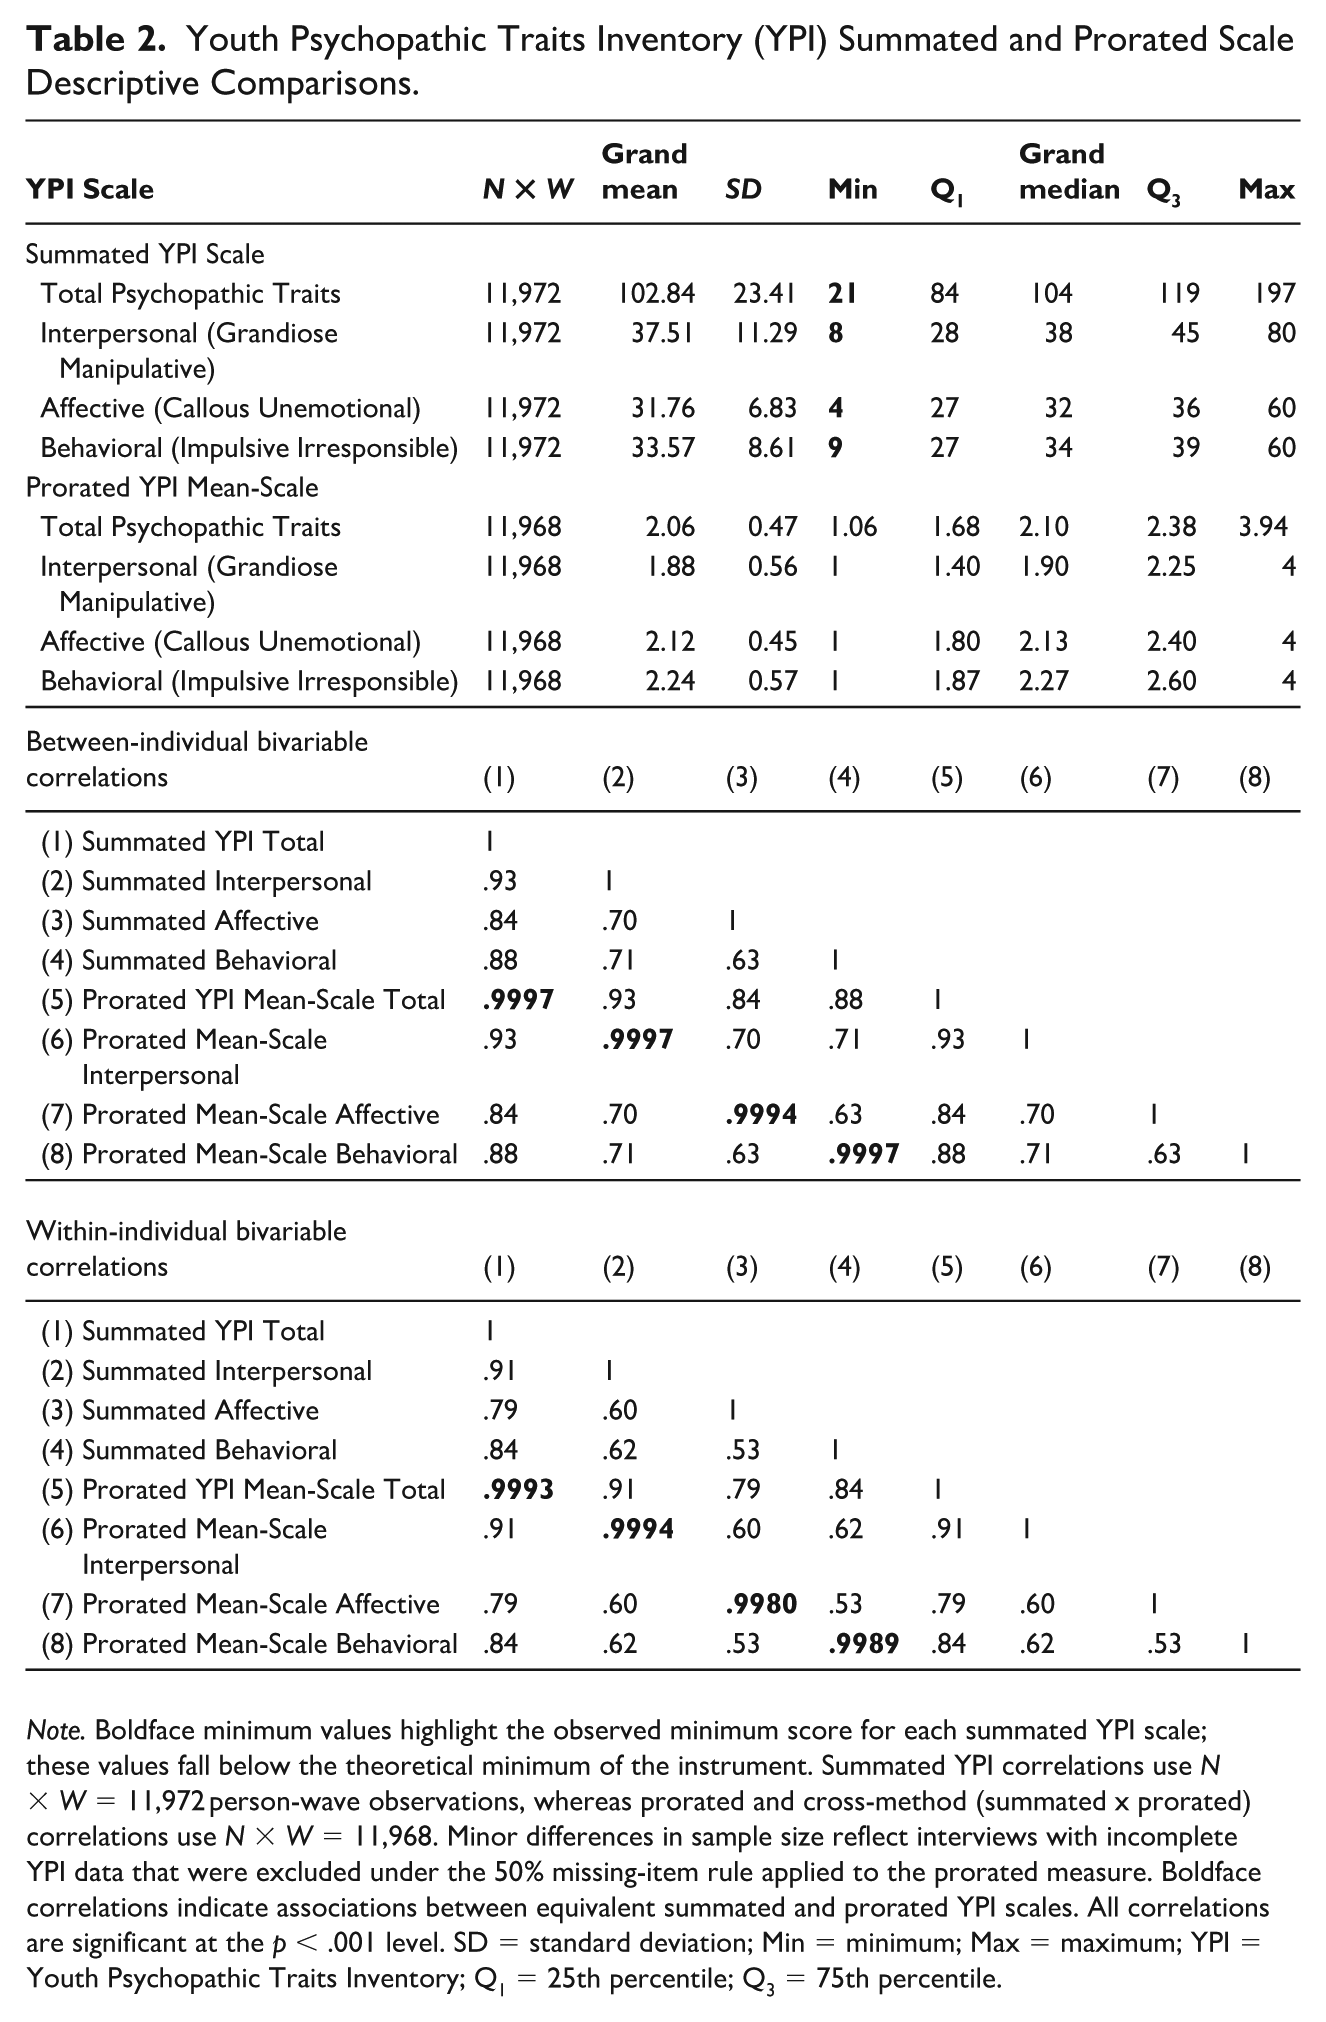
Note. Boldface minimum values highlight the observed minimum score for each summated YPI scale; these values fall below the theoretical minimum of the instrument. Summated YPI correlations use N×W = 11,972 person-wave observations, whereas prorated and cross-method (summated x prorated) correlations use N×W = 11,968. Minor differences in sample size reflect interviews with incomplete YPI data that were excluded under the 50% missing-item rule applied to the prorated measure. Boldface correlations indicate associations between equivalent summated and prorated YPI scales. All correlations are significant at the p < .001 level. SD = standard deviation; Min = minimum; Max = maximum; YPI = Youth Psychopathic Traits Inventory; Q1 = 25th percentile; Q3 = 75th percentile.
However, direct comparison of raw values between the summated and prorated YPI scales is complicated by their differing metrics. As such, both scoring approaches are standardized, and the resulting distributions are placed in boxplots to allow for visual comparison (see Figure 1). Aside from the lower end of the values, the summated and prorated scales are almost identical, with only minor differences in median and upper-percentile values.
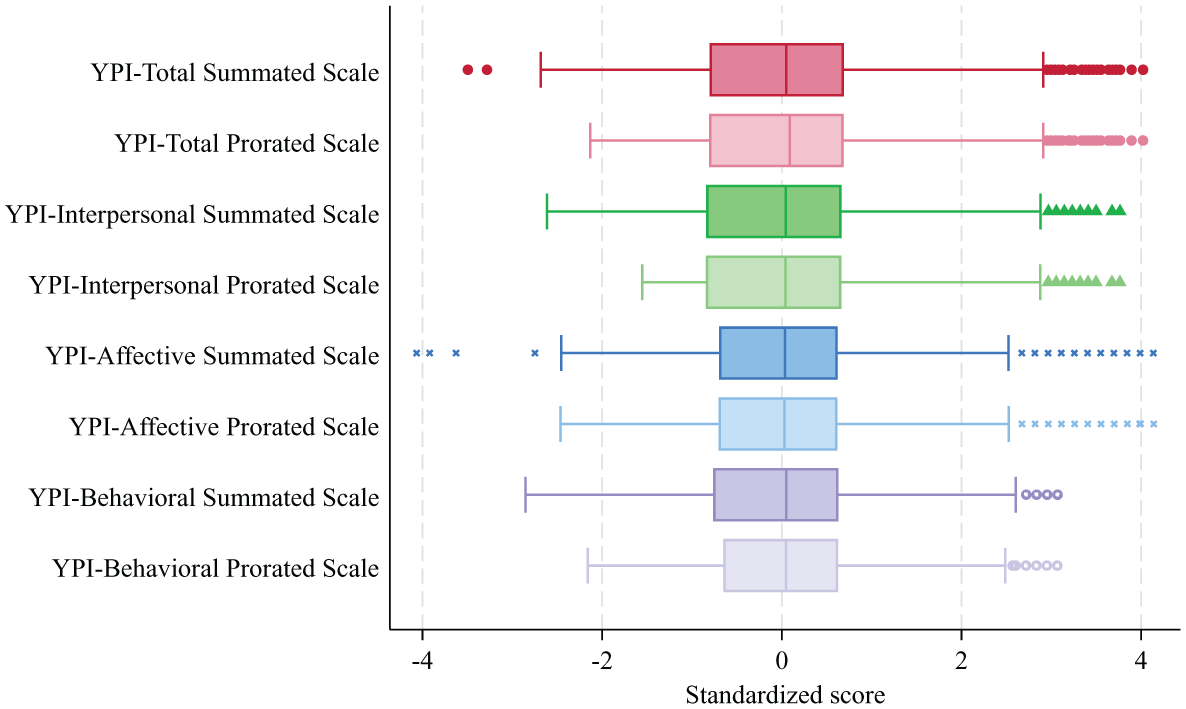
Box plot comparisons of summated and prorated Youth Psychopathic Traits (YPI) measures.
Table 2 also presents the between- and within-individual bivariable correlations across scoring methods. In both the between- and within-individual components, the associations between summated and prorated versions of each YPI scale are exceptionally strong: between-person correlations exceed .999 for all domains (total YPI r = .9997; interpersonal r = .9997; affective r = .9994; behavioral r = .9997), and within-person correlations remain at or above .9980 (total YPI r = .9993; interpersonal r = .9994; affective r = .9980; behavioral r = .9989). These near-perfect associations are unsurprising given the relatively small proportion of item-level nonresponse among valid YPI administrations. Therefore, near-perfect correlations reflect the limited scope of item-level nonresponse rather than redundancy between scoring approaches.
Despite the near-perfect correlations due to low levels of missingness, the scoring rule may produce unintended consequences in settings with greater item nonresponse, subgroup differences in skipping patterns, or analyses focused on the lower end of the distribution. Moreover, correcting even small scoring errors aligns with best practices in handling missing data, as seemingly minor measurement errors can accumulate or become consequential under different analytic conditions (Pepper et al., 2010). This reinforces the value of accounting for item nonresponse when constructing measures for longitudinal analysis.
Mixed Effects Models Comparing Summated and Prorated YPI Scores
Bivariable and Multivariable Model Results
Table 3 summarizes the mixed-effects models predicting offending variety using summated and prorated YPI scores. Across total and domain-specific scales, the two scoring approaches yield strikingly similar estimates. In the bivariable models, the between-person associations are virtually identical across scoring methods (e.g., total YPI incidence rate ratio [IRR] = 2.655 for summated vs. 2.650 for prorated) and the within-person associations are also nearly indistinguishable (e.g., total YPI IRR = 1.104 for summated vs. 1.103 for prorated). This same pattern of equivalence holds across the interpersonal, affective, and behavioral domains. These estimates suggest that youth who display higher levels of psychopathic traits commit a wider variety of offending behaviors, and this conclusion holds regardless of scoring method. For example, an IRR of 2.65 for the between-person total YPI scale indicates that a one standard deviation increase in psychopathic traits is associated with a 165% increase in the expected number of different offenses committed.
Multilevel Mixed-Effects Poisson Models Predicting Offending Variety From Psychopathic Traits, Comparing Summated and Prorated YPI Scoring Methods, Collapsed (N = 1,228).
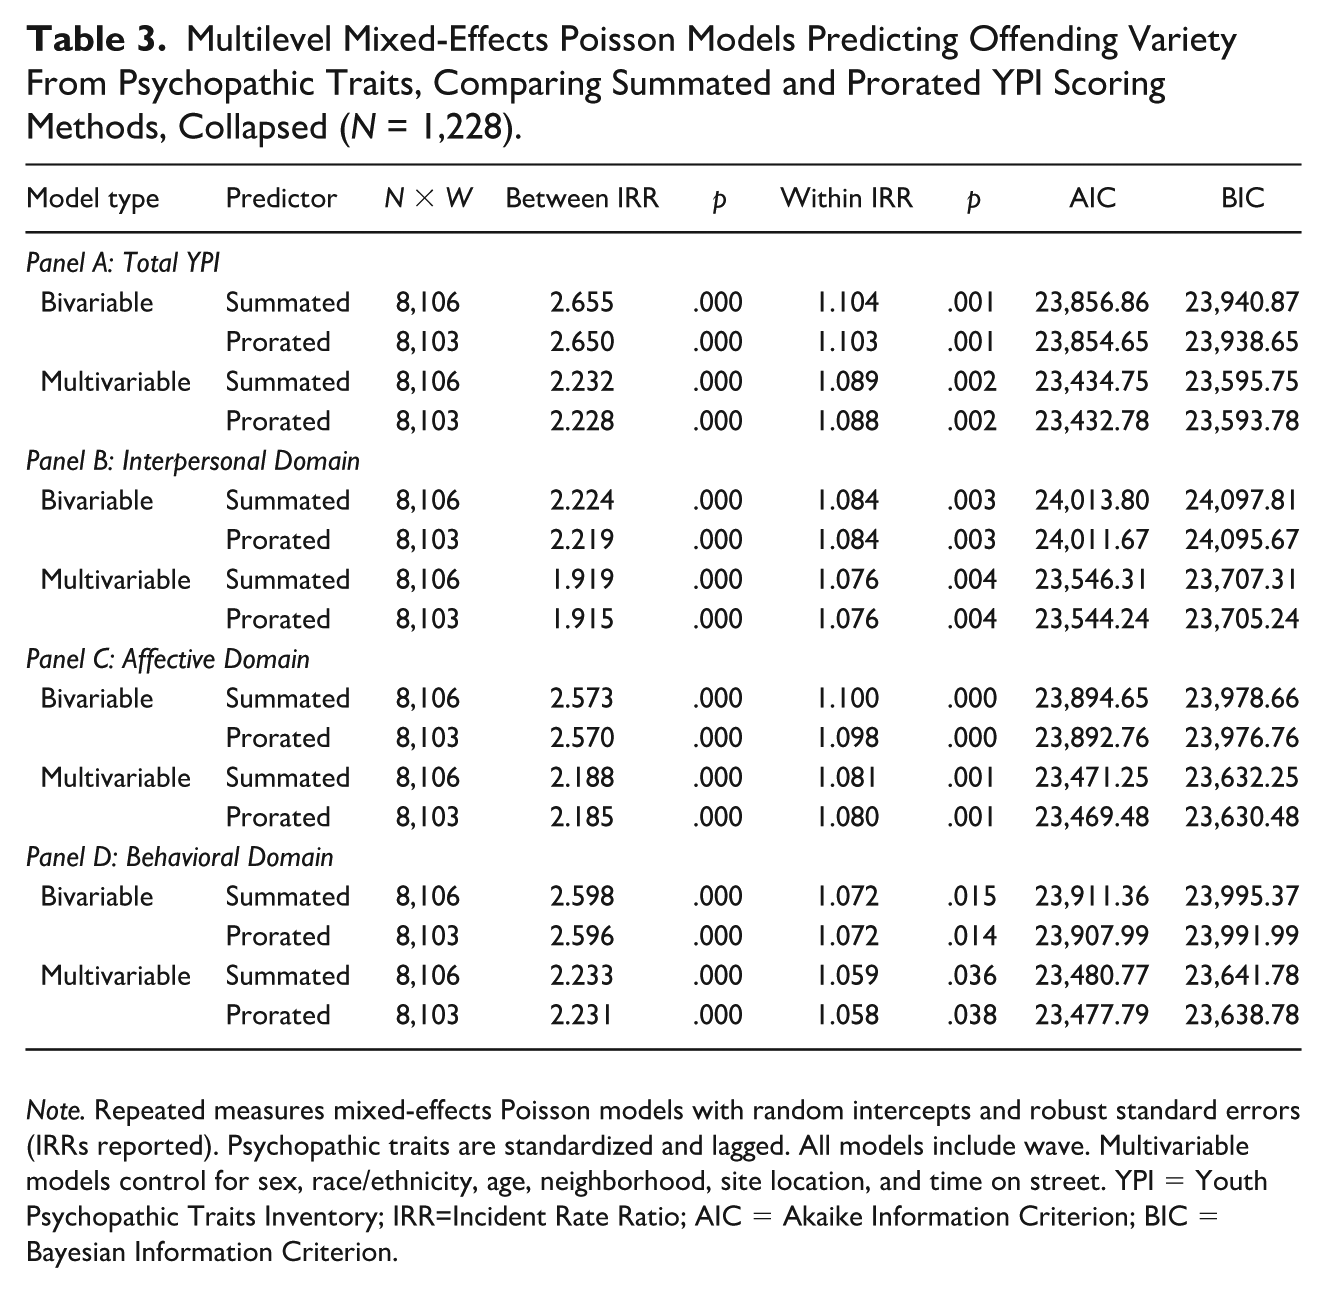
Note. Repeated measures mixed-effects Poisson models with random intercepts and robust standard errors (IRRs reported). Psychopathic traits are standardized and lagged. All models include wave. Multivariable models control for sex, race/ethnicity, age, neighborhood, site location, and time on street. YPI = Youth Psychopathic Traits Inventory; IRR=Incident Rate Ratio; AIC = Akaike Information Criterion; BIC = Bayesian Information Criterion.
After adjusting for covariates, the multivariable models continue to show close correspondence between scoring methods (see Supplemental Appendix E for fully specified YPI total models). For example, in the total YPI scale models, the between-person IRRs shift minimally between summated (IRR = 2.232) and prorated (IRR = 2.228) scores, and the within-person IRRs remain virtually identical (summated IRR = 1.089; prorated IRR = 1.088). Domain-level models follow the same pattern, producing coefficients that are relatively indistinguishable in direction, significance, and substantive magnitude. As such, accounting for demographic, contextual, and exposure-related factors does not change the conclusion; both scoring approaches suggest that higher levels of psychopathic traits are associated with a greater variety of offending.
Finally, model fit indices exhibit the same general consistency. Prorated models tend to produce slightly lower AIC and BIC values than the summated models—indicating better model fit—but the improvements are small. For example, in the multivariable total YPI model, the AIC declines from 23,434.75 to 23,432.78 (-1.97 net change) and BIC declines from 23,595.75 to 23,593.78 (-1.97 net change). While the prorated models fit slightly better, they do not meaningfully alter the substantive interpretation of the YPI-offending link.
Reverse-Direction Bivariable and Multivariable Model Results
Table 4 presents mixed-effects linear models treating psychopathic traits as the outcome and offending variety as the predictor. This reverse-direction analysis serves as a robustness check to examine whether the scoring methods differ when the analytical direction is reversed. As before, the results for summated and prorated scores are nearly identical. In the bivariable models predicting total YPI, the between-person and within-person coefficients are the same to three decimal places (β = .235 and β = .059, respectively, for both scoring methods). Multivariable models show the same consistency with the between-person coefficients identical across summated and prorated scores (β = .212), as are the within-person coefficients (β = .057). As such, both scoring methods produce essentially identical estimates, where youth who commit a greater variety of offenses tend to report higher levels of psychopathic traits (between-person), and within-person increases in offending are associated with small but significant increases in psychopathic traits over time.
Multilevel Mixed-Effects OLS Models Predicting Psychopathic Traits From Offending Variety, Comparing Summated and Prorated YPI Scoring Methods (N = 1,228).
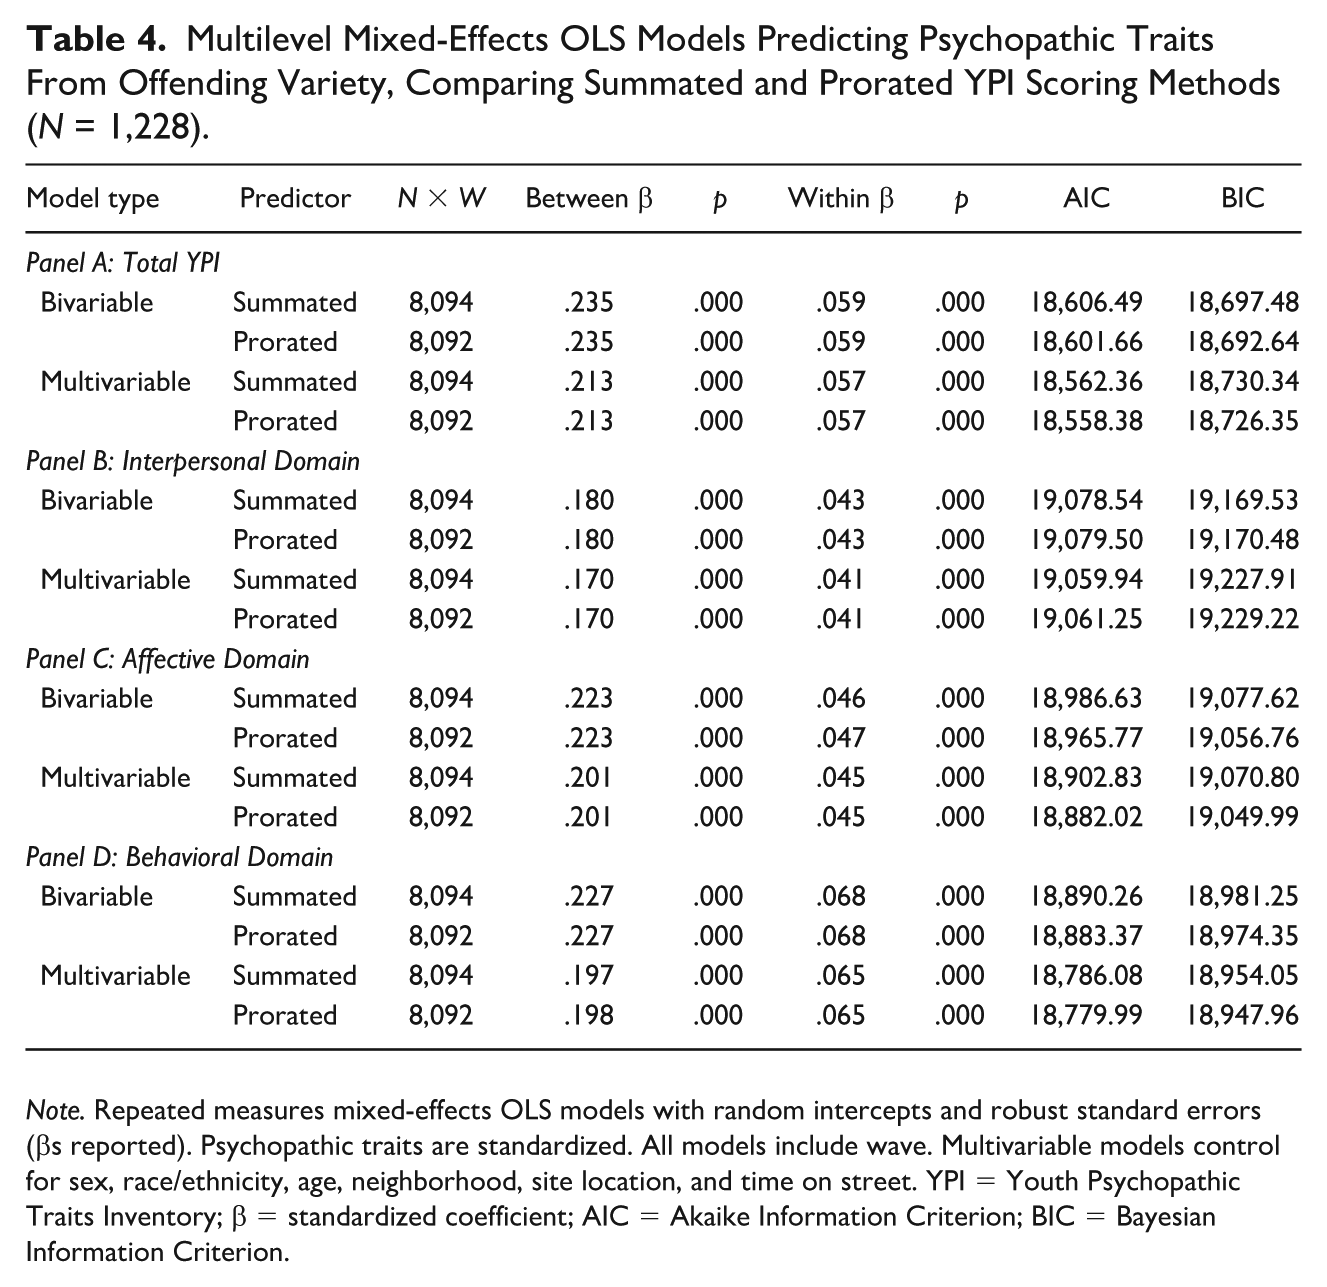
Note. Repeated measures mixed-effects OLS models with random intercepts and robust standard errors (βs reported). Psychopathic traits are standardized. All models include wave. Multivariable models control for sex, race/ethnicity, age, neighborhood, site location, and time on street. YPI = Youth Psychopathic Traits Inventory; β = standardized coefficient; AIC = Akaike Information Criterion; BIC = Bayesian Information Criterion.
Domain-level models are consistent with this pattern. In the multivariable models, for each YPI domain, the summated and prorated measures result in coefficients that match, in all but two cases, numerically to the third decimal place, and the direction and significance of effects remain unchanged. As in the offending models, prorated versions of the YPI produce slightly improved model fit, with the exception of the multivariable interpersonal model (AIC: summated = 19,059.52, prorated = 19,060.84; BIC: summated = 19,227.49, prorated = 19,228.80), but the magnitude of these changes is too small to alter substantive conclusions. Together, these results indicate that the interpersonal, affective, and behavioral domains show the same substantiative pattern as the total scale.
Discussion and Conclusion
Scholars have long discussed the importance of rigorous research methodology, particularly when it comes to addressing missing data (Brame & Paternoster, 2003; Graham, 2009) and minimizing measurement error (Pepper et al., 2010). Yet, these concerns can emerge even in some of criminology’s most popular datasets. This study used the YPI in Pathways to Desistance as a case study to examine how unaddressed item missingness, though minor in overall prevalence, can introduce measurement error into summated scale scores and, in turn, shape the analytic choices available to secondary researchers.
Across four stages of measurement-focused inquiry, I documented the presence of item absence and/or missingness in the YPI, reconstructed the measure using a prorated scoring approach, and compared the summated and prorated versions across descriptive, correlational, and mixed-effects analytic results. The outcomes were reassuring for prior research. Despite observable irregularities in the summated YPI, including scores falling below the absolute scale minimums, its substantive and statistical associations with offending remained highly stable. The summated and prorated measures were nearly perfectly correlated, and the mixed-effects models provided coefficients that were substantively indistinguishable across scoring approaches. These findings indicate that the relationship between psychopathic traits and offending variety in the Pathways data is robust to unaccounted for item-level missingness.
Yet the robustness of results does not imply that the underlying measurement irregularities are trivial or should be ignored. Instead, the findings underscore that the burden may fall on secondary researchers to identify, evaluate, and address potential coding or measurement concerns, particularly when documentation is limited or incomplete, rather than assume that such concerns are nonexistent or inconsequential. In practice, this involves inspecting variable construction, reconstructing measures when necessary, and comparing results across various specifications (e.g., cases with complete data vs. those with potential concerns) to ensure that substantive conclusions remain consistent. In this case, prorating the YPI removed structural compression at the lower end of the scale, aligned the total and domain-specific scales with their intended measurement ranges, and reduced the likelihood of misclassifying respondents who completed partial interviews. These adjustments are conceptually preferable and statistically cleaner, even when their downstream analytic impact is small. The near equivalence of results across scoring approaches therefore clarifies, rather than overturns, prior findings.
A key contribution of this study is demonstrating how different forms of item absence can accumulate in longitudinal secondary datasets. Across the Pathways panel, more than 78,000 YPI item responses were absent from the public summated scores (11.65% of 677,000 possible responses), a figure largely driven by missing interviews and waves in which the YPI was not administered or reported. When attention is restricted to completed interviews, this number reduced substantially, yet more than 11,000 item responses (1.85% of 609,400 possible item responses) remained absent among otherwise complete waves, reflecting a mix of structural absence and limited item-level nonresponse. At the person-wave level, however, true item-level nonresponse was rare: only 197 of 11,972 person-wave observations (1.65%) contained any missing YPI items, and the number of items skipped within these interviews was minimal. For most respondents, item-level nonresponse was negligible, with a relatively small subset of participants accounting for the majority of respondent-skipped items. Had item-level nonresponse been more extensive or systematically patterned across individuals or developmental periods, its effects on scale reliability and validity could have been more pronounced (Graham, 2009; Little & Rubin, 2019). The fact that the YPI-offending link remains stable despite these issues reflects the overall quality of the Pathways data, not an argument for ignoring missing data in secondary analyses.
These findings speak more broadly to the realities of working with complex, multi-wave secondary datasets. As prior work has emphasized (e.g., Cheng & Phillips, 2014; Laub et al., 1990), secondary data analysis depends not only on access to data, but on careful engagement with how those data were constructed. In studies such as Pathways, minor measurement errors are not necessarily evidence of poor data quality but instead reflect the logistical and methodological complexity of large-scale longitudinal research. Identifying and addressing such issues is not a critique of the data or the PIs, but a routine and important part of the cumulative scientific progress that ultimately strengthens validity and replicability. This perspective aligns with wider concerns about research transparency and reproducibility across the sciences (e.g., Chin et al., 2023; Open Science Collaboration, 2015; Pridemore et al., 2018), where increasing attention has been directed toward the assumptions, decisions, and practices that shape empirical analyses. This shift reflects a growing recognition that the credibility and long-term utility of research, particularly in policy and practice contexts, are tied to how transparently it is produced, evaluated, and shared (e.g., Nix & Richards, 2026).
Translating these principles into practice in the context of secondary data analysis requires sustained engagement from both secondary analysts and PIs. Secondary analysts should routinely inspect variable distributions, compare them to the codebook specifications, and evaluate whether scale construction procedures align with best practice. However, this process depends heavily on the information provided by data curators. As Fernando et al. (2021) noted, “[o]nce missing data appears in the pipeline it becomes an ugly duckling for many subsequent processes . . .” (p. 3218, emphasis in original). Even though the consequences were minor in the present study, prior research shows that missingness, if more extensive or handled improperly, can bias estimates, reduce statistical power, distort construct validity, and lead to faulty conclusions (Brame & Paternoster, 2003; Roth, 1994; Schafer & Graham, 2002). PIs should continue to support transparency by documenting missing data patterns, item inclusion rules, scoring decisions, and any imputation procedures applied (or not applied) before data release. And efforts to make data and code publicly available, when feasible, are encouraged, as they enable ongoing evaluation, replication, and the accumulation of knowledge over time. Importantly, cross-examination of data or results is most useful when it is conducted in a careful, constructive, and methodologically grounded manner that prioritizes improving the quality of the empirical record, rather than identifying errors for their own sake (Nix et al., 2025).
Future updates to the public YPI scoring protocol could enhance consistency and transparency for future users of the Pathways dataset. Although proration is widely used and an appropriate correction under the conditions observed here, it does rely on the assumption that the data are missing completely at random (MCAR) and, even under MCAR, bias can emerge if item-level means and interitem correlations differ substantially (Graham, 2009; Schafer & Graham, 2002). In settings where item-level responses are unavailable, as is the case in the public Pathways files, these assumptions cannot be empirically tested, which naturally limits the analytic options available to secondary researchers. This does not mean analysts are “out of luck,” but rather underscores the need for data providers to clearly document how missingness was handled when constructing public scales. In the present study, I was able to obtain the count of missing items for the YPI total and domain scores through direct correspondence with a member of the Pathways research team; other secondary analysts may not have access to this information. A centralized correction applied by the PIs would promote greater consistency and efficiency for all users. More robust approaches, such as multiple imputation, full information maximum likelihood (FIML), or hybrid proration-FIML strategies, could be explored if item-level data were available (Mazza et al., 2015; Wu et al., 2022); although access to item-level responses is often, and correctly, restricted for confidentiality reasons. Without access to individual item responses, secondary analysts must rely on summated or preconstructed variables, underscoring the importance of clarity at the data-curation stage.
For researchers who have previously used the YPI summated scales from Pathways, the findings here should be reassuring. Conclusions from prior work are unlikely to change in substance or significance. Yet, moving forward, the lesson is clear: researchers must remain attentive to how key variables are constructed and the assumptions embedded within them. Secondary data analysis of publicly shared data remains a powerful tool in criminological and criminal justice research. It has enormous potential for overcoming the resource-heavy cost of primary data collection; reproduction and replication studies; facilitating comparative studies across time, space, and sociodemographic characteristics; and inciting sustained inquiry into research areas, motivating policy and practice changes. But realizing this potential requires rigorous transparency and evaluation at every stage of data curation and use. As noted at the outset, the purpose of this study was not to expose flaws, but rather to encourage PIs and secondary analysts alike to take their foot off the gas when submitting and seizing public datasets, respectively, and to heed the longstanding advice to “know your data inside and out.” In an era of abundant open data, including the arrival of the big data era (Lynch, 2018), and increasingly complex measurement and statistical analysis, that advice is more essential than ever.
Supplemental Material
sj-docx-1-cad-10.1177_00111287261460006 – Supplemental material for Know Your (Secondary) Data Inside and Out: Missing Data and Measurement in the Youth Psychopathic Traits Inventory From the Pathways to Desistance Dataset
Supplemental material, sj-docx-1-cad-10.1177_00111287261460006 for Know Your (Secondary) Data Inside and Out: Missing Data and Measurement in the Youth Psychopathic Traits Inventory From the Pathways to Desistance Dataset by Jennifer J. Tostlebe in Crime & Delinquency
Footnotes
Acknowledgements
The author would like to thank Dr. Danielle Carkin and two anonymous reviewers at Crime & Delinquency, as well as David Pyrooz and Jose Sanchez for their feedback on earlier versions of this article.
Funding
The author received no financial support for the research, authorship, and/or publication of this article.
Declaration of Conflicting Interests
The author declared no potential conflicts of interest with respect to the research, authorship, and/or publication of this article.
Supplemental Material
Supplemental material for this article is available online.
Notes
Author Biography
References
Supplementary Material
Please find the following supplemental material available below.
For Open Access articles published under a Creative Commons License, all supplemental material carries the same license as the article it is associated with.
For non-Open Access articles published, all supplemental material carries a non-exclusive license, and permission requests for re-use of supplemental material or any part of supplemental material shall be sent directly to the copyright owner as specified in the copyright notice associated with the article.