
Abstract
The mainstream approach of social vulnerability to flood risk faces some challenges regarding its ability to address the complexity of its causal processes. The objective of this study was to analyse the causal processes of social vulnerability to flood impacts from a relational perspective. To this end, a social network analysis was performed that identified the conditions and causes of social vulnerability and systematically articulated the relationships between them. This analysis was tested on the specific case of flood risk on the coast of the province of Alicante (SE Spain). To ascertain the conditions and causes of social vulnerability to flood risk, a multidisciplinary group of local experts was consulted, and the resulting data processed in a relational way using Atlas.ti and Gephi softwares. The result was a social vulnerability network comprising 84 nodes and 189 edges distributed into four dimensions: the adaptive capacity of tourists, socio-economic structure, land use planning and risk management. The information was ranked for betweenness centrality, revealing the components with highest causal power of social vulnerability to social impacts in flooding events: low flood risk awareness, economic growth based on real estate boom, property speculation and lack of political interest in flood risk management. This proposal places emphasis on the driving forces of social vulnerability and not exclusively on the specific adaptive conditions of the population, which allows a strategic identification and management of generative forces that ultimately induce the social impacts of floods.
Introduction
Flood management is currently facing a new context of risks, stemming from the effects of climate change which is driving an increase in the size and frequency of potentially catastrophic events (Arnell and Gosling, 2016; Kundzewicz et al., 2014). The institutions responsible for disaster risk reduction, cognizant of these challenges, have implemented strategies aimed at comprehensively understanding and managing risk and encouraging exposed areas to adapt (Busayo et al., 2020; Orimoloye et al., 2021). We find, on one hand, a growing interest in the adaptive management approach, based on strengthening the population’s ability to adapt in order to prepare for and respond to risk (Shrubsole, 2007; Van Buuren et al., 2018), and, on the other hand, a new surge in integrated management, which advocates a combination of structural defence measures and non-structural measures such as changes in land use, early warning systems and actions of social response to risk (Brown and Damery, 2002; Grabs et al., 2007). Both these approaches represent in essence a development of the traditional paradigm in flood risk management, which is undergoing a shift from the idea of protecting and reacting (hazard control) towards adapting and preventing (risk management; Burby, 2006; Thomas and Knüppe, 2016).
Non-structural measures and the adaptive management approach, in promoting management strategies based on preparing the territory and society as a whole to deal with flooding (Kundzewicz, 2002; Schoeman et al., 2014), represent a move towards the inclusion of the social dimension in the analysis and management of flood risk (Dawson et al., 2011). So much to that extent that Díez-Herrero and Garrote (2020) were able to show, in a review of the literature on flood risk, that psycho-social analyses are currently one of the four main global tendencies in scientific production in the field, together with studies on climate change, coastal flooding and economic assessment. The social dimension of flood risk tends to be approached in the following four main ways: (1) studies of the social perception of risk (Lara et al., 2010), (2) analyses of public participation as a means of governance (Newig et al., 2014), (3) post-disaster studies aimed at assessing the social impacts of flood events (World Meteorological Organization (WMO), 2016), and (4) social vulnerability assessments (SVA from here on) aimed at analysing the adaptive conditions of local populations (Rufat et al., 2015).
A literature review by Orimoloye et al. (2021) showed that social vulnerability analysis is currently one of the main lines of research in studies of the social aspects of natural hazard risk, including flood risk. In recent years a trend of research has emerged at critically reassessing the characteristics, objectives and scope of the most commonly used SVA models for natural hazards. The dominant SVA paradigm is characterised by the following two factors: (1) it is based on methodological standardisation and (2) its analytical scope is superficial and merely descriptive. With regard to the first idea, it has been found that SVA methodological design consists in the uncritical adoption of the assessment models used in mainstream literature (Hinkel, 2011; Yoon, 2012). Most SVA, instead of adapting their methodological design to the specific characteristics of each case, start from a uniform concept of social vulnerability, assume that it is valid for methodological standardisation, and thus reproduce the assessment methods and variables that are the norm in the specialised literature (Fatemi et al., 2017; Spielman et al., 2020). Eakin and Luers (2006) warn that the methodological standardisation of social vulnerability involves technical and conceptual risks associated with the uneven availability of data among case studies and especially with lack of comparability due to the heterogeneity of social contexts. On the same topic, Kuhlicke et al. (2011) remark that it is not possible to establish a common set of measures that would explain social vulnerability in global terms since it results from the particularities of distinct territorial, social, demographic, cultural and institutional contexts.
Furthermore, SVA for natural hazards are normally designed to measure vulnerability using synthetic measures and indices (Beccari, 2016). The main sources of such indices are the databases of official census secondary data, which focus on measuring population demographics (Spielman et al., 2020). Consequently, these SVA methods tend to produce descriptive results with a superficial analytical scope, thereby limiting the measurable factors in social vulnerability. Rufat et al. (2015), analysing 67 flood risk SVA, concluded that demographic data and economic and health status were the most common variables in this type of study, while more difficult-to-measure factors such as risk awareness, knowledge of self-protection measures, institutional trust and response capacity linked to social capital featured little in SVA models. Some scholars state that SVA, since it is based on generalised demographic factors, does not enable us to identify the adaptive capacity of different populations to deal with the specific impacts of natural hazards, and that this therefore seriously limits their reliability (Beccari, 2016; Paveglio et al., 2016; Spielman et al., 2020; Tate, 2012). In other words, the mainstream SVA approach presents difficulties in explaining how the population’s demographic conditions are materialised in specific adaptive capacities and situations when facing the social impacts of a natural hazard. According to this perspective on social vulnerability, an individual’s demographic characteristics would have universal effectivity in reacting to all hazards, that is, they would be equally effective in facing a flood or an economic crisis. Ran et al. (2020), reviewing natural hazard SVA methodology, traced the reason for this misconception to the fact that most studies start from the conceptual principle that social vulnerability is a generic property of social systems.
As a result of the predominance of this paradigm based on the standardisation and superficial description of social vulnerability, SVA models have difficulty unravelling and dealing with the high degree of complexity characterising social vulnerability to natural hazards. SVA, as they offer superficial descriptions of the measurable conditions of the population (Fekete, 2019), have little capacity to explain in-depth the complete set of causes and processes underlying social vulnerability (Fatemi et al., 2017; Ivčević et al., 2019; Rufat et al., 2015). Not only does this conceptual weakness reduce the scientific quality of the dominant SVA model’s outputs, it also negatively affects risk governance (Siagian et al., 2014). In this regard, some analysts have identified a science-policy gap stemming from the problems that the dominant SVA model has in effectively transferring scientific production to the field of risk management (Hinkel, 2011; Weichselgartner and Kasperson, 2010; Wolf et al., 2015). Some of the main reasons for this gap are as follows: (1) lack of attention to causes of social vulnerability, which can represent hotspots of high strategic value for effective risk management (Ran et al., 2020); (2) scant attention to the relational view of social vulnerability and its different components, which hinders the development of management plans of adequate scope to comprehensively account for risk production (Joakim et al., 2016); and (3) lack of adjustment of SVA measures to the specific needs of risk governance frameworks due to their low level of context adaptation (Ivčević et al., 2019). In short, studies of social vulnerability to natural hazards currently face the challenge of developing new conceptual and methodological formulae that enable them to produce results that can effectively encompass risk governance, particularly in the overall context of climate change. It is for this reason that the first action priority in the Sendai Framework for Disaster Risk Reduction 2015–2030 (United Nations Office for Disaster Risk Reduction (UNISDR), 2015) was to achieve a comprehensive, in-depth understanding of social vulnerability. To put this principle into action, it is necessary to explore new approaches that will allow us to encompass all the causes and processes underlying social vulnerability to flood social impacts, to systematically trace the relational dynamics between the various components of social vulnerability, and to incorporate the specific features of social contexts into our analyses.
The analysis of the processes that generate social vulnerability to flood risk is strategic for the management of the social impacts. An in-depth knowledge of social vulnerability makes it possible to understand the adaptive reality that determines the social impacts experienced by exposed communities during these events (Adger, 2003). Social vulnerability represents the variable that determines the social distribution of the effects of floods. Likewise, social impacts may become fixed in the territory during the post-disaster phase, leading to a reconfiguration of the communities’ adaptive conditions and, consequently, to acquired social vulnerability (Climent-Gil et al., 2018). Thus, the connection between vulnerability and social impacts is bidirectional: in the pre-event phase, the existence of the impact depends on the preventive management of vulnerability, while in the post-event phase the evolution of vulnerability depends on the actual management of the impact. For this reason, vulnerability analyses represent a powerful tool to contextualise and qualify flood impacts analyses.
In order to address these challenges, the main objective of this study was to analyse, from a relational perspective, the generative processes of social vulnerability to flood impacts. To this end, a social network analysis (SNA from here on) was performed to (1) identify the conditions and causes of social vulnerability to flood risk; (2) systematically trace and analyse the relations among its various causal factors. The SNA yielded a representation of how the generative processes of social vulnerability work. On the basis of this representation, the causes and conditions of social vulnerability were ranked according to their betweenness centrality, thus enabling the identification of the factors with highest generative power. Applying policies to these social vulnerability hotspots can be more effective due to their multiplying effect on other related factors. Despite the potential advantages, the application of SNA in the field of social vulnerability studies is still scarce (Aledo et al., 2021; Frey and Ramírez, 2019; Jaja et al., 2017; Magsino, 2009). Nevertheless, its methodological adequacy affords an opportunity to address the conceptual challenges that the mainstream SVA approach is facing in the area of natural hazards. Finally, with the objective of performing a contextualised analysis of social vulnerability using SNA, we studied the case of flood risk on the coast of the Alicante province (south-east Spain).
Case study
This study analyses the causal processes of social vulnerability to flood risk on the coast of the province of Alicante, a region of south-east Spain. This region presents one of the highest levels of flood risk in Europe. According to figures from the International Disaster Database (Emergency Disasters Database (EM-DATA), 2020), the province of Alicante is, after Venice (Italy), the region which has undergone the highest number of flood disasters in the last 20 years, with a total of six events of catastrophic consequences. The area is prone to episodes of torrential rains associated with cold air pools. According to the Valencian regional government’s Special Flood Risk Plan (Plan Especial frente al Riesgo de Inundación de la Comunitat Valenciana (PERICV), 2018), of the 19 municipalities on the Alicante coast, five have high risk, eight medium risk and six low risk (Figure 1). The most recent instance of catastrophic flooding occurred on 12th to 13th September 2019 in the south of the region, in the town of Orihuela and its surrounding areas. According to figures from the Segura River Basin (Confederación Hidrográfica del Segura (CHS), 2019), this episode broke the Spanish record for accumulated rainfall in 120 hours, with a recorded volume of 521.6 l/m2. The event caused seven deaths and catastrophic social and economic impacts (EM-DATA, 2020), which have subsequently had large-scale effects on the regional development of the affected areas.
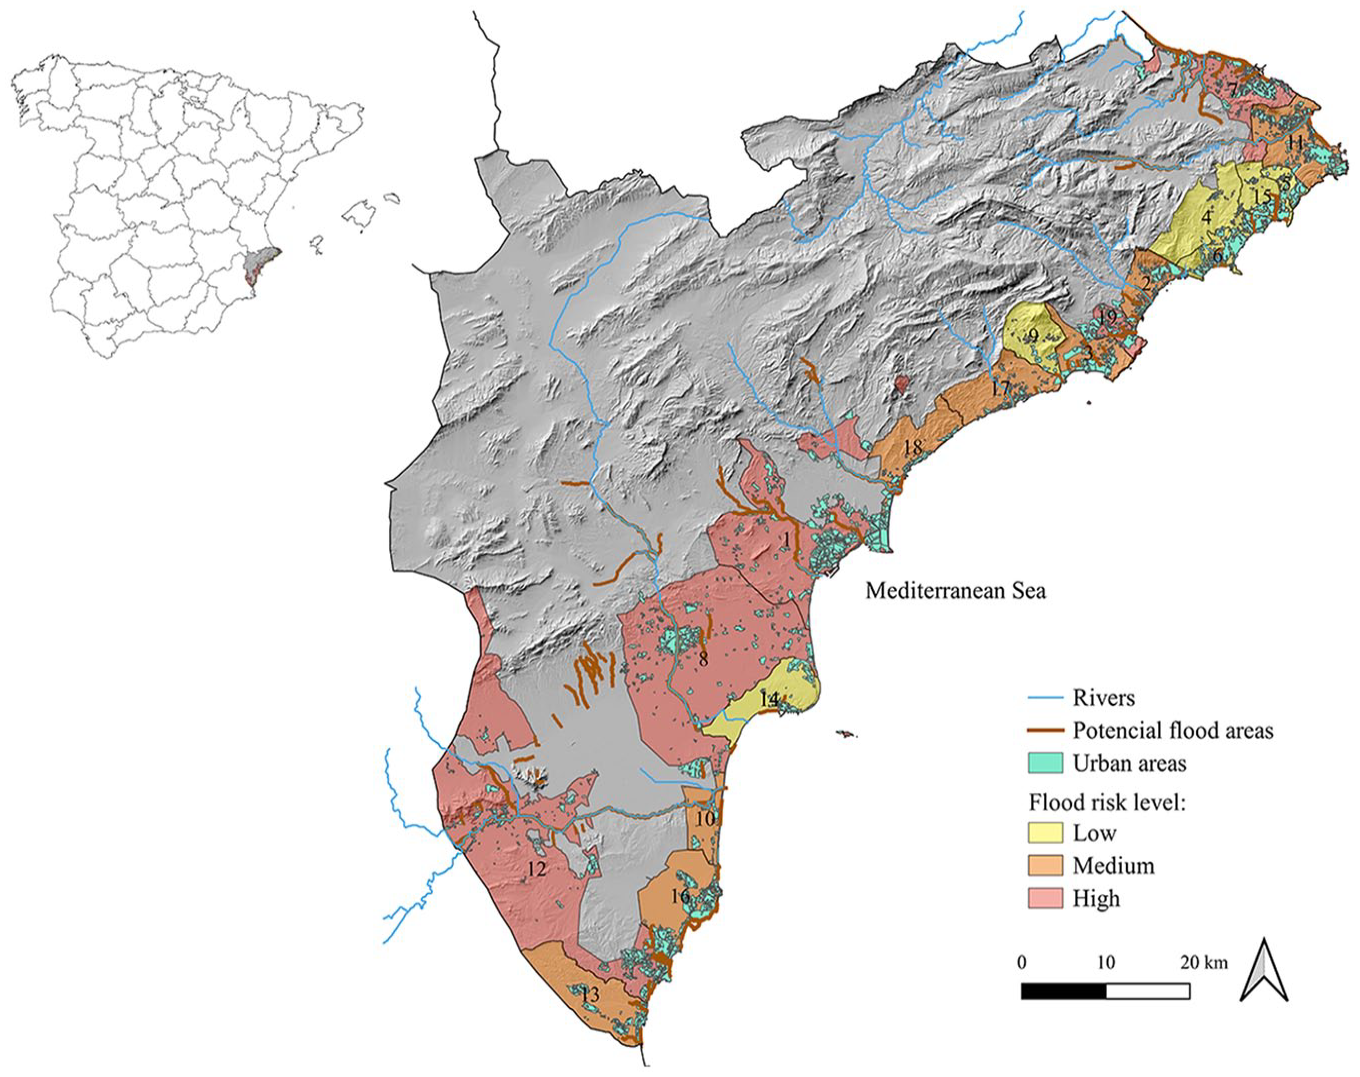
Flood risk map of the coast of the province of Alicante.
To understand flood risk in the region in an integral way, it is necessary to consider the characteristics of the socio-economic context. The region is one of the most important tourist destinations in the Mediterranean. The coastal strip of the province of Alicante is made up of 19 municipalities with a combined surface area of 1627.6 km2 along 244 km of coast and has a registered population of 1,112,387 inhabitants (Instituto Nacional de Estadística (INE), 2019b). In economic terms, 75.48% of the active population is employed in the service sector (INE, 2020), within whom the tourism services have considerable weight. The tourism sector represents around 18% of the region’s gross domestic product (GDP), generating incomes of around 6000 million euros per year (Vera-Rebollo, 2016). In 2019, the Alicante coast received 7,470,429 visitors (INE, 2019a), of which 71.75% were foreign. The region’s tourism model is based on the product ‘sun and beach’ (Ibarra, 2011), and for this reason, tourism activity is heavily concentrated in space and time. The summer months account for 54.84% of visits (INE, 2019b), and hotels and second homes are densely grouped along the coastline (Morote and Hernández, 2016).
Methodology
Analysing the causal processes of social vulnerability from a relational and contextual perspective, this study made use of SNA. From the analytical point of view, SNA breaks down the componential structure (nodes) and relational structure (edges) of a system (Butts, 2008; Otte and Rousseau, 2002; Ter-Wal and Boschma, 2009). The aim of this approach is to obtain a systematic, detailed representation of the components and relational dynamics of complex social phenomena (Scott, 1988). This representation is normally in the form of causal maps, by means of which we can understand the network functioning of a whole system or any of its specific parts in graphic form (McLinden, 2013). The application of SNA to the study of social vulnerability affords an opportunity to address the conceptual challenges to the mainstream SVA approach, since it enables us to (1) explain and represent the generative processes of social vulnerability, thus going beyond mere description of population demographics; (2) systematically articulate the relationships among the different social vulnerability components, thereby overcoming the compartmentalised view characterising the dominant approach; and (3), as a result, identify social vulnerability hotspots whose management can be key due to their potential multiplying effect on other drivers of social vulnerability.
In order to apply SNA to the study of the causal processes of social vulnerability, the methodological process was divided into two phases: (1) collection of primary data through interviews with 24 local flood risk experts; and (2) coding, processing and analysing the information obtained to create causal maps with Gephi software. Figure 2 summarises the study’s methodological procedure, explained in more detail in the following sections.
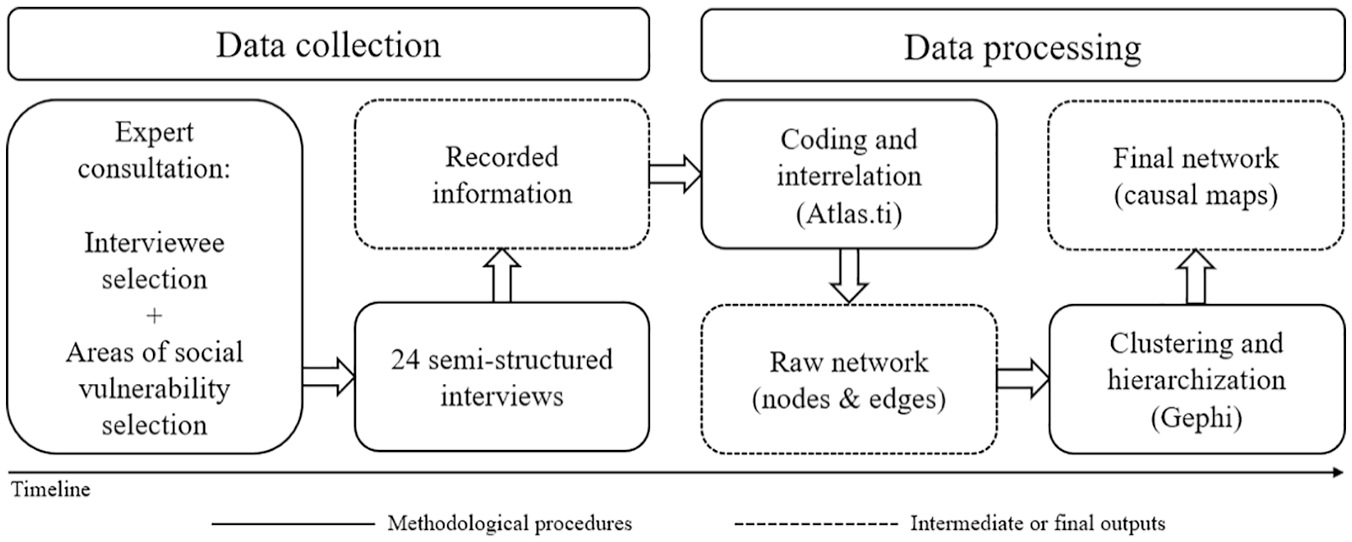
Methodological process.
Data collection
To obtain information directly related to the generative processes of social vulnerability to flood risk for the case study, we consulted a multidisciplinary group of 24 local flood experts. This specialist group was made up of sociologists, geographers, civil engineers, emergency service workers, institutional authorities responsible for risk management and non-governmental organisations (NGOs) working in disaster management (see Table 1). Expert consultation is commonly used in applied studies on social vulnerability to natural hazards (Dickin et al., 2013; Hagenlocher et al., 2018; Tucker et al., 2015), and enabled us to address the high specificity and complexity of the causal processes of social vulnerability to flood risk, in the absence of secondary data and sufficient specialised bibliography at local level. Stratified purposeful sampling (Patton, 2002) was chosen in order to select interviewees of sufficiently heterogeneous areas of expertise. This ensured the multidisciplinarity of the expert group and allowed us to maintain even weighting among the disciplines while gathering data. It was decided to interview four specialists in each field, thus reaching a total of 24 (n) experts. The sample size could have been increased at any time had information saturation not been achieved. The interviews showed considerable homogeneity among the disciplines, however, thus effectively achieving saturation and enabling closure of the consultation phase (Saunders et al., 2018).
Disciplines of the experts consulted.
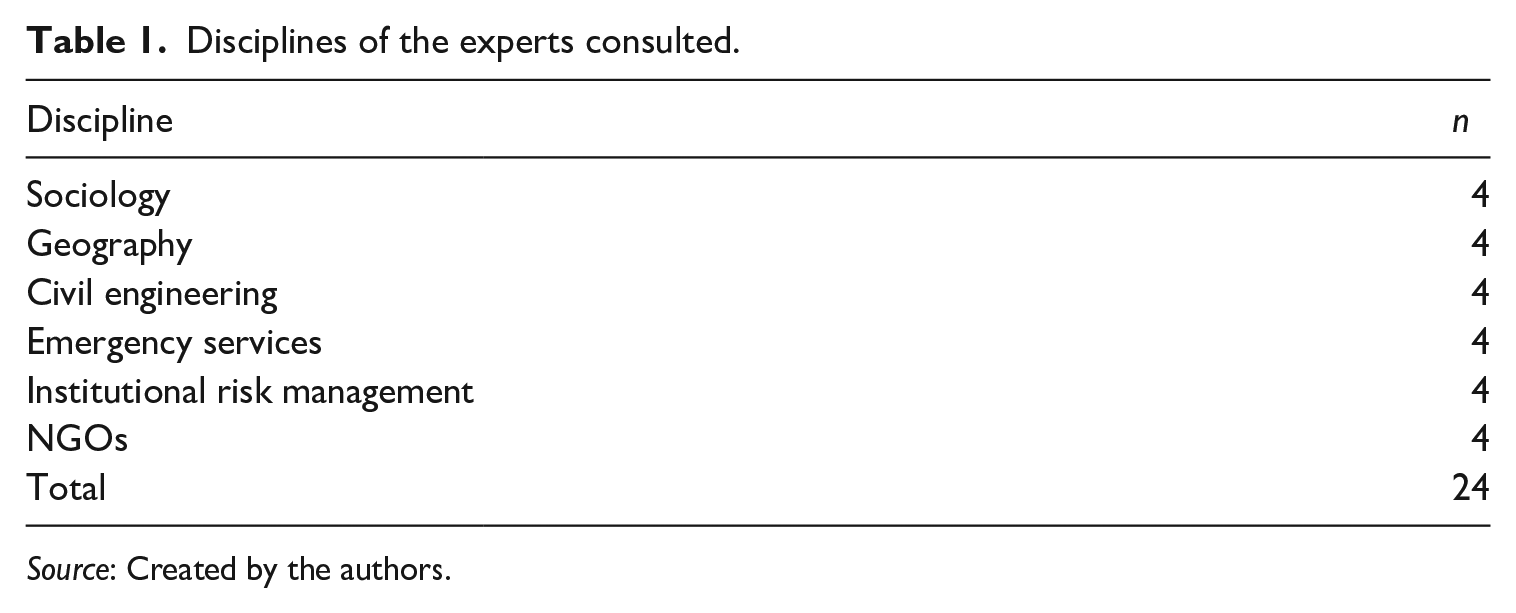
Source: Created by the authors.
The expert consultation was performed in May 2020 in the form of semi-structured interviews, carried out online due to the COVID-19 pandemic restrictions. The interviews discussed the following four dimensions of social vulnerability: (1) the adaptive capacity of tourists, (2) the socio-economic structure of tourist destinations, (3) land use planning associated with tourism sector development and (4) flood risk management by local and regional governments. These dimensions were adapted from a systematic literature review carried out by Aznar-Crespo et al. (2020), in which the authors identified and analysed the most frequently used analytical dimensions in studies on social vulnerability to natural hazards in the region studied. The four dimensions also determined the choice of disciplines for the expert group and the thematic structure of the script used to conduct the semi-structured interviews.
Semi-structured interviews were chosen as a means of gathering data due to their capacity to yield qualitative information on the generative processes of social vulnerability to flood risk, thus enabling us to uncover intangible components, root causes and relational dynamics. The experts consulted were invited to contribute information on all dimensions of social vulnerability, while it was suggested that they focus on their own areas of expertise. In order for the SNA to encompass, the processual and relational nature of social vulnerability, the interview procedure was divided into two stages. In the first, the interviewees identified specific adaptation conditions belonging to each of the four dimensions of social vulnerability. In the second, the experts explained the causes of the components identified, endeavouring to discuss them at differing degrees of depth. The Blaikie et al. (1994) model of Pressure and Release (PAR) was used to distinguish between specific conditions of adaptation and their causes. This model, commonly used in the literature on social vulnerability to natural hazards, conceptualises the causal processes of social vulnerability by distinguishing between three causal levels, namely, from greater to lesser depth: root causes, dynamic pressures and unsafe conditions. Root causes represent long-term ideological and regulatory phenomena that drive the cultural, economic, social and political systems of an entire society. Dynamic pressures refer to intermediate processes that steer the root causes towards specific forms of adaptation, thereby becoming more clearly outlined in space and time. Finally, unsafe conditions are specific adaptive states experienced by the population when facing the impacts of hazards, thus representing the final materialisation of social vulnerability causal processes. This conceptual framework was taken as a model to (1) structure the interviews in order to identify the broadest possible causal chains or generative processes of social vulnerability and (2) orient interpretation of the analytical factors emerging from the SNA towards the study of the causal processes of social vulnerability to flood risk. The PAR model has been used as a conceptual reference to organise the fieldwork and to guide the interpretation of the results, since the interrelational nature of the SNA goes beyond the categorisation of information proposed by this model. In this sense, while the PAR model categorises the generative elements into root causes, dynamic pressures or unsafe conditions, this SNA aims to capture the multidimensional nature of each element of a network by analysing its multiple interrelationships. Thus, the same node may be playing different causal roles depending on each of its individual relationships. For this reason, although the PAR model can be useful to interpret the causal nature of a node in general terms, the classification of nodes into unique causal categories can limit a deep understanding of these complex generative processes.
Data processing
The data produced by the semi-structured interviews was subsequently processed in order to systematically articulate the elements and relationships identified in the specialist consulting phase. The objective of the data processing phase was to create a causal network that would encompass the whole set of information and yield a relational reading of the causal dynamics of social vulnerability to flood risk in the region studied. To this end, the qualitative content analysis programme Atlas.ti was used to (1) code the information from the interviews and turn it into basic units or nodes, in this case, the various components at differing depths of the causal processes of social vulnerability; and (2) determine the relationships among nodes.
The information-processing phase yielded a raw network of the aggregate of nodes and relationships informing the causal processes of social vulnerability to flood risk in the case study. As a result of the volume of information and the complexity of the nodal relationships, the data were analysed with Gephi, a software often used in SNA. Due to the qualitative nature of this study, Gephi was used to improve the understanding of the information gathered (Hodgkinson and Clarkson, 2005), since it yielded a more categorised, organised and hierarchised view of the network, taking into account the large volume of information resulting from the coding phase. This software allowed the following (Cherven, 2013; Hanneman and Riddle, 2005): (1) to cluster the nodes within the network according to relational affinity criteria, thereby achieving a clearer information structure; and (2) to rank each of the nodes according to their betweenness centrality, thus obtaining sharper characterisation of the data. To this end, an adjacency matrix was constructed comprising the previously obtained nodes and edges, which was then uploaded to Gephi. Subsequently, two classification and hierarchisation parameters were applied to the information.
The first parameter was that of modularity class, which measures the strength of division of a network and groups the nodes into modules (Grandjean, 2015; Hussain et al., 2018). These modules, also called clusters or communities, represent areas of the network in which a series of nodes are closely interconnected. This parameter enabled us to delineate graphically the four dimensions of social vulnerability taken as a model for the interviews. The delineation, affording more systematic reading of the network, was represented through colours in the causal maps created by Gephi (Figures 3 to 7). The second parameter applied was betweenness centrality, a measure that quantifies the frequency with which a node bridges the shortest path between two other nodes (Aggarwal, 2011). This parameter enabled us to rank the capacity of each node to bind together the other components in the network (Sun and Tang, 2011). The degree of betweenness centrality was represented in the causal maps by the size of the nodes (the greater the betweenness centrality, the larger the node, and vice versa). Using betweenness centrality allowed us to rank the components in the causal processes of social vulnerability to flood risk in accordance with their strength of causal mediation.
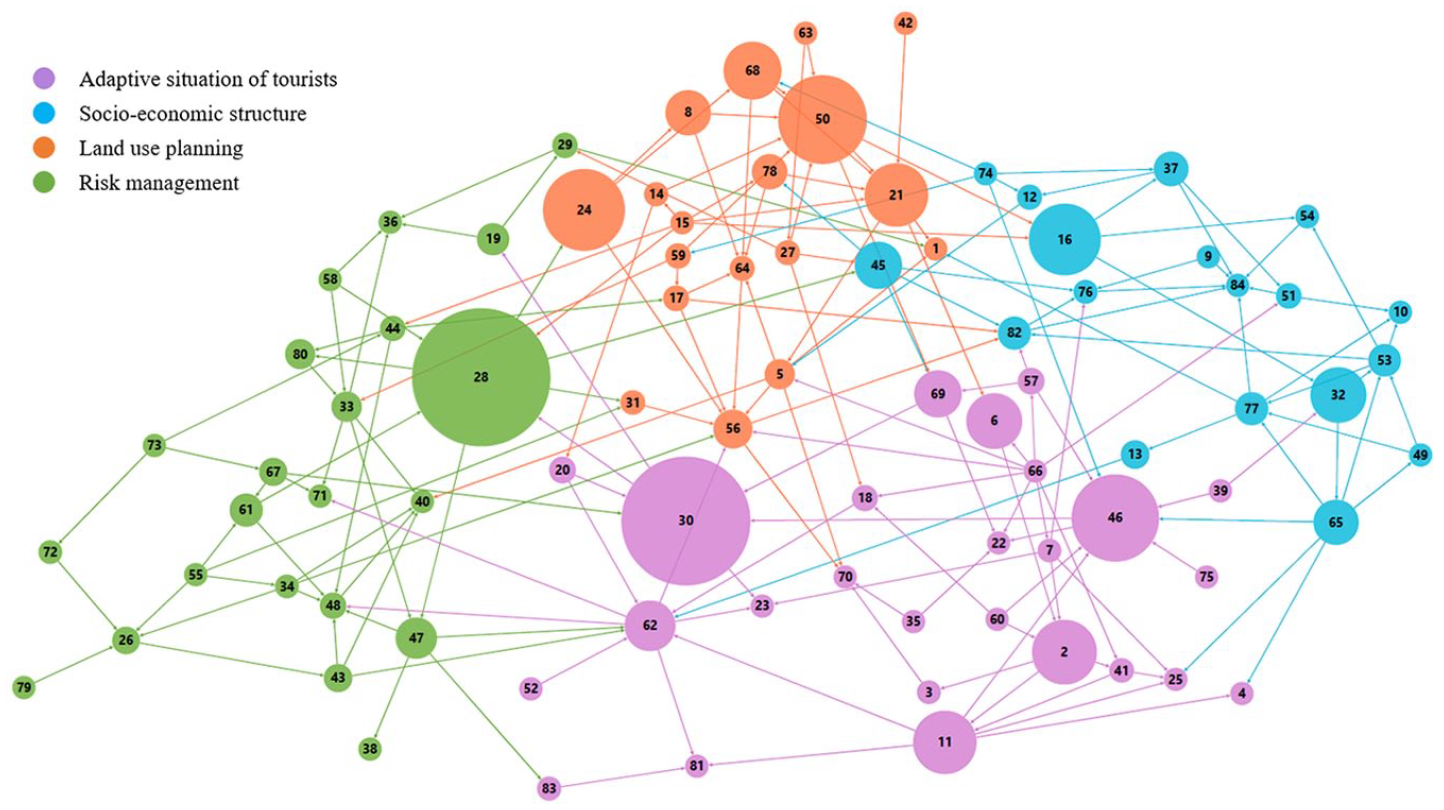
Global causal map of the causal process of social vulnerability to flood risk on the coast of the province of Alicante.
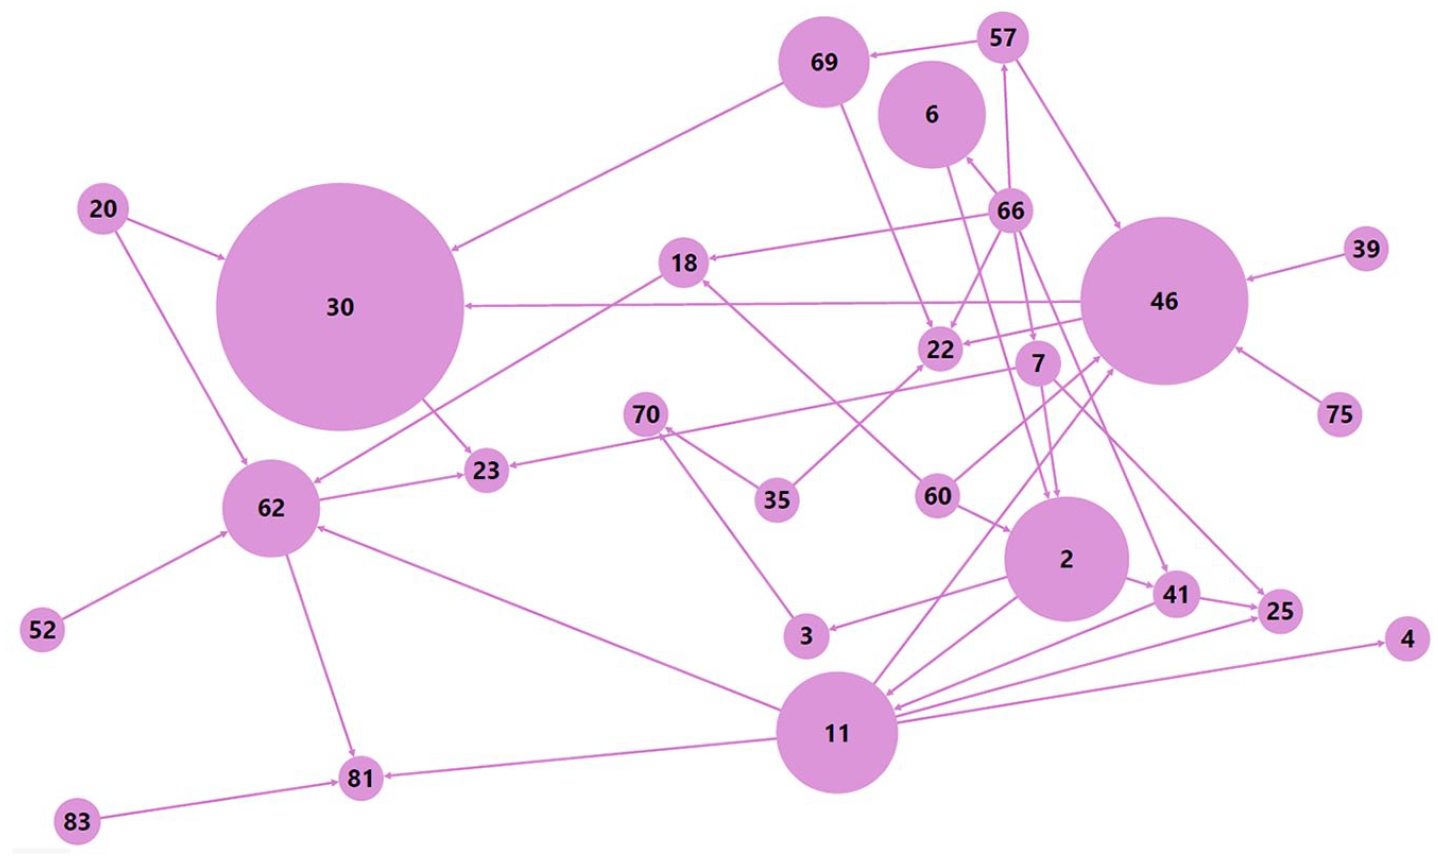
Causal map of the dimension adaptive capacity of tourists.
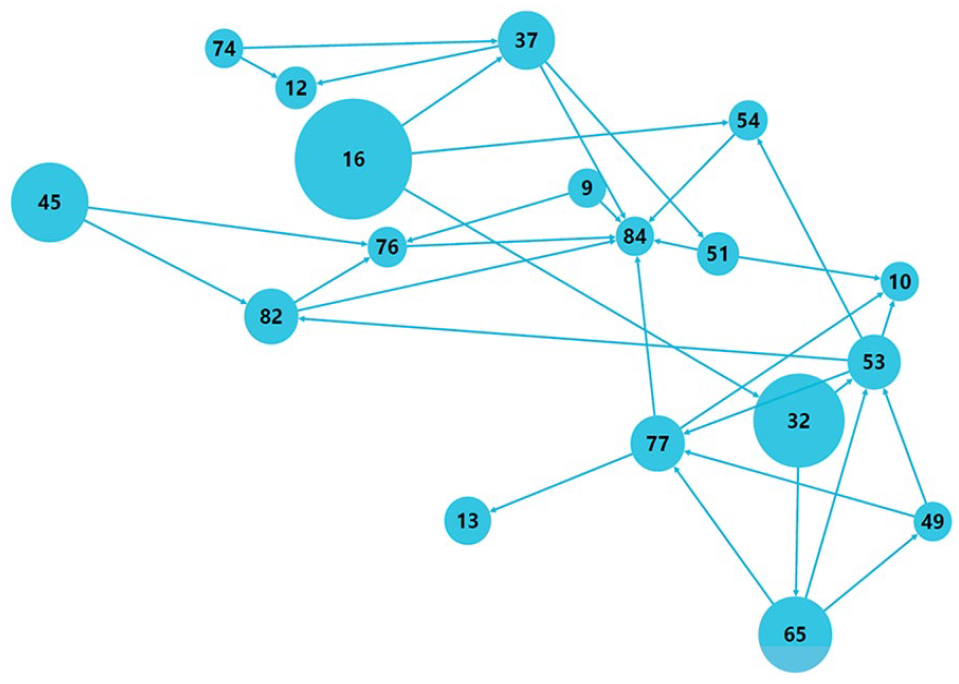
Causal map of the dimension of socio-economic structure.
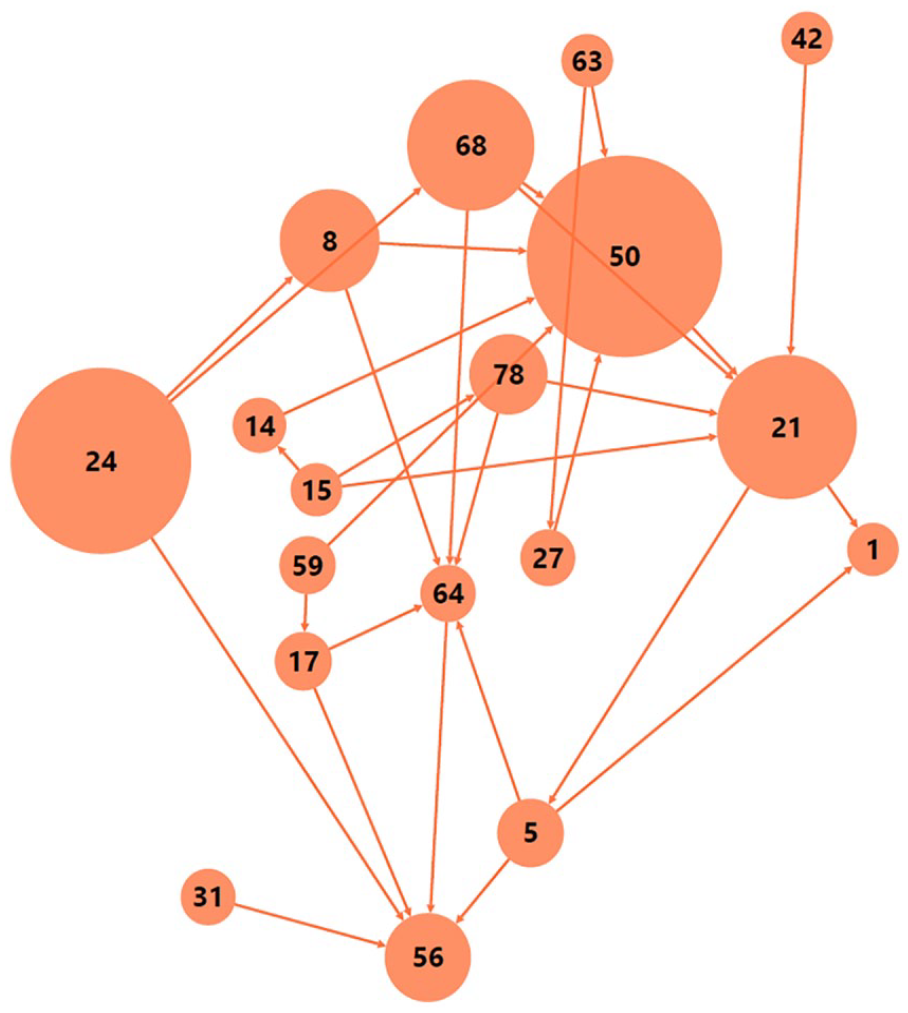
Causal map of the dimension of land use planning.
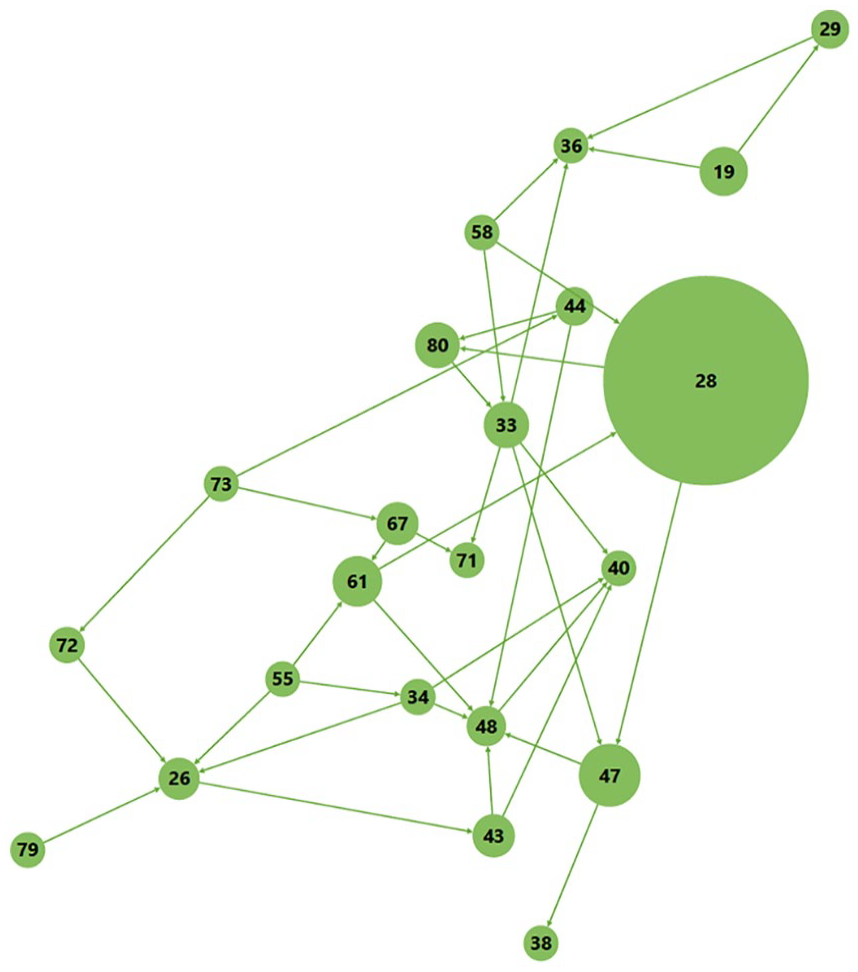
Causal map of the dimension of risk management.
Finally, when the nodes were ranked with betweenness centrality, ForceAtlas2, an algorithm that spatially distributes the information according to attraction and repulsion between nodes, was also applied, thereby facilitating visualisation of the whole network in the form of causal maps (Jacomy et al., 2014).
Results and discussion
Below, we present the outcomes of the SNA of the causal processes of social vulnerability to flood risk in the case studied. They are shown here by means of the causal maps obtained using Gephi. Our discussion of the outcomes is broken down into the four dimensions of social vulnerability taken as reference for the interviews and represented through the parameter of modularity class. Each of these dimensions is accompanied by a causal map and a table with data on the betweenness centrality of each node.
Figure 3 shows the network of the aggregate of causal processes of social vulnerability to flood risk in the case study, composed of 84 nodes and 189 edges. The four dimensions of social vulnerability are as follows: (1) the adaptive capacity of tourists (purple cluster), accounting for 30.95% of the nodes (26) and relating to tourists’ vulnerability to flood risk; (2) socio-economic structure (blue cluster), with 21.43% of the nodes (18), referring to the economic and occupational characteristics of the tourism sector; (3) land use planning (orange cluster), grouping 21.43% of the nodes (18) and relating to the urban growth stemming from tourism development; and (4) risk management (green cluster), accounting for 26.19% of the nodes (22) and referring to the characteristics of the flood risk management policies and actions undertaken in the region.
This section is presented according to the dimensions of social vulnerability in order to facilitate interpretation of the information. Nevertheless, it should be noted that the betweenness centrality of each node was calculated according to its relationships with the whole network, which means that all nodes should be interpreted in terms of the overall view. Finally, throughout the text, the nodes are labelled using a coding system indicating their identification and the dimension they belong to. For example, ‘id 30-d1’ means that the factor commented on refers to node 30 (id 30) belonging to dimension 1 (d1), that is, the adaptive capacity of tourists.
Adaptive capacity of tourists
This dimension of social vulnerability represents the greatest amount of information, as it accounts for 30.95% of the nodes in the network (26). This cluster groups social vulnerability components mainly relating to residential or long-stay tourists’ capacity to perceive, prepare for and respond to flood impacts. It occupies a central position in the network, directly linked to the other three dimensions of social vulnerability. In other words, the causal processes of social vulnerability to flood risk that affect tourists are closely related to the characteristics of the risk management model, land use planning and socio-economic structure in the region studied. For this reason, the average betweenness centrality of this dimension of social vulnerability is the second highest of the four clusters (114.010). This high degree of centrality, in addition to confirming the predominantly tourism-based social, economic and territorial fabric of the region, reveals the importance of tourism as a driver of vulnerability to flood risk.
As Table 2 shows, low flood risk awareness (id 30-d1) is the node with the highest level of betweenness centrality in this dimension of social vulnerability. This causal factor is not only strongly related to the other nodes in its own dimension, but also represents the second factor in the network that most often mediates relationships between two other nodes. This high centrality can be clearly observed in the radial position the node occupies in the whole network. Particularly notable is the closeness of this node to the risk management dimension, specifically as the most important cause of low political interest in flood risk in the region studied (id 28-d4). In other words, the population’s low-risk awareness is one of the most important causes of local government lack of interest in risk management.
List of the nodes in the dimension adaptive capacity of tourists by degree of betweenness centrality.
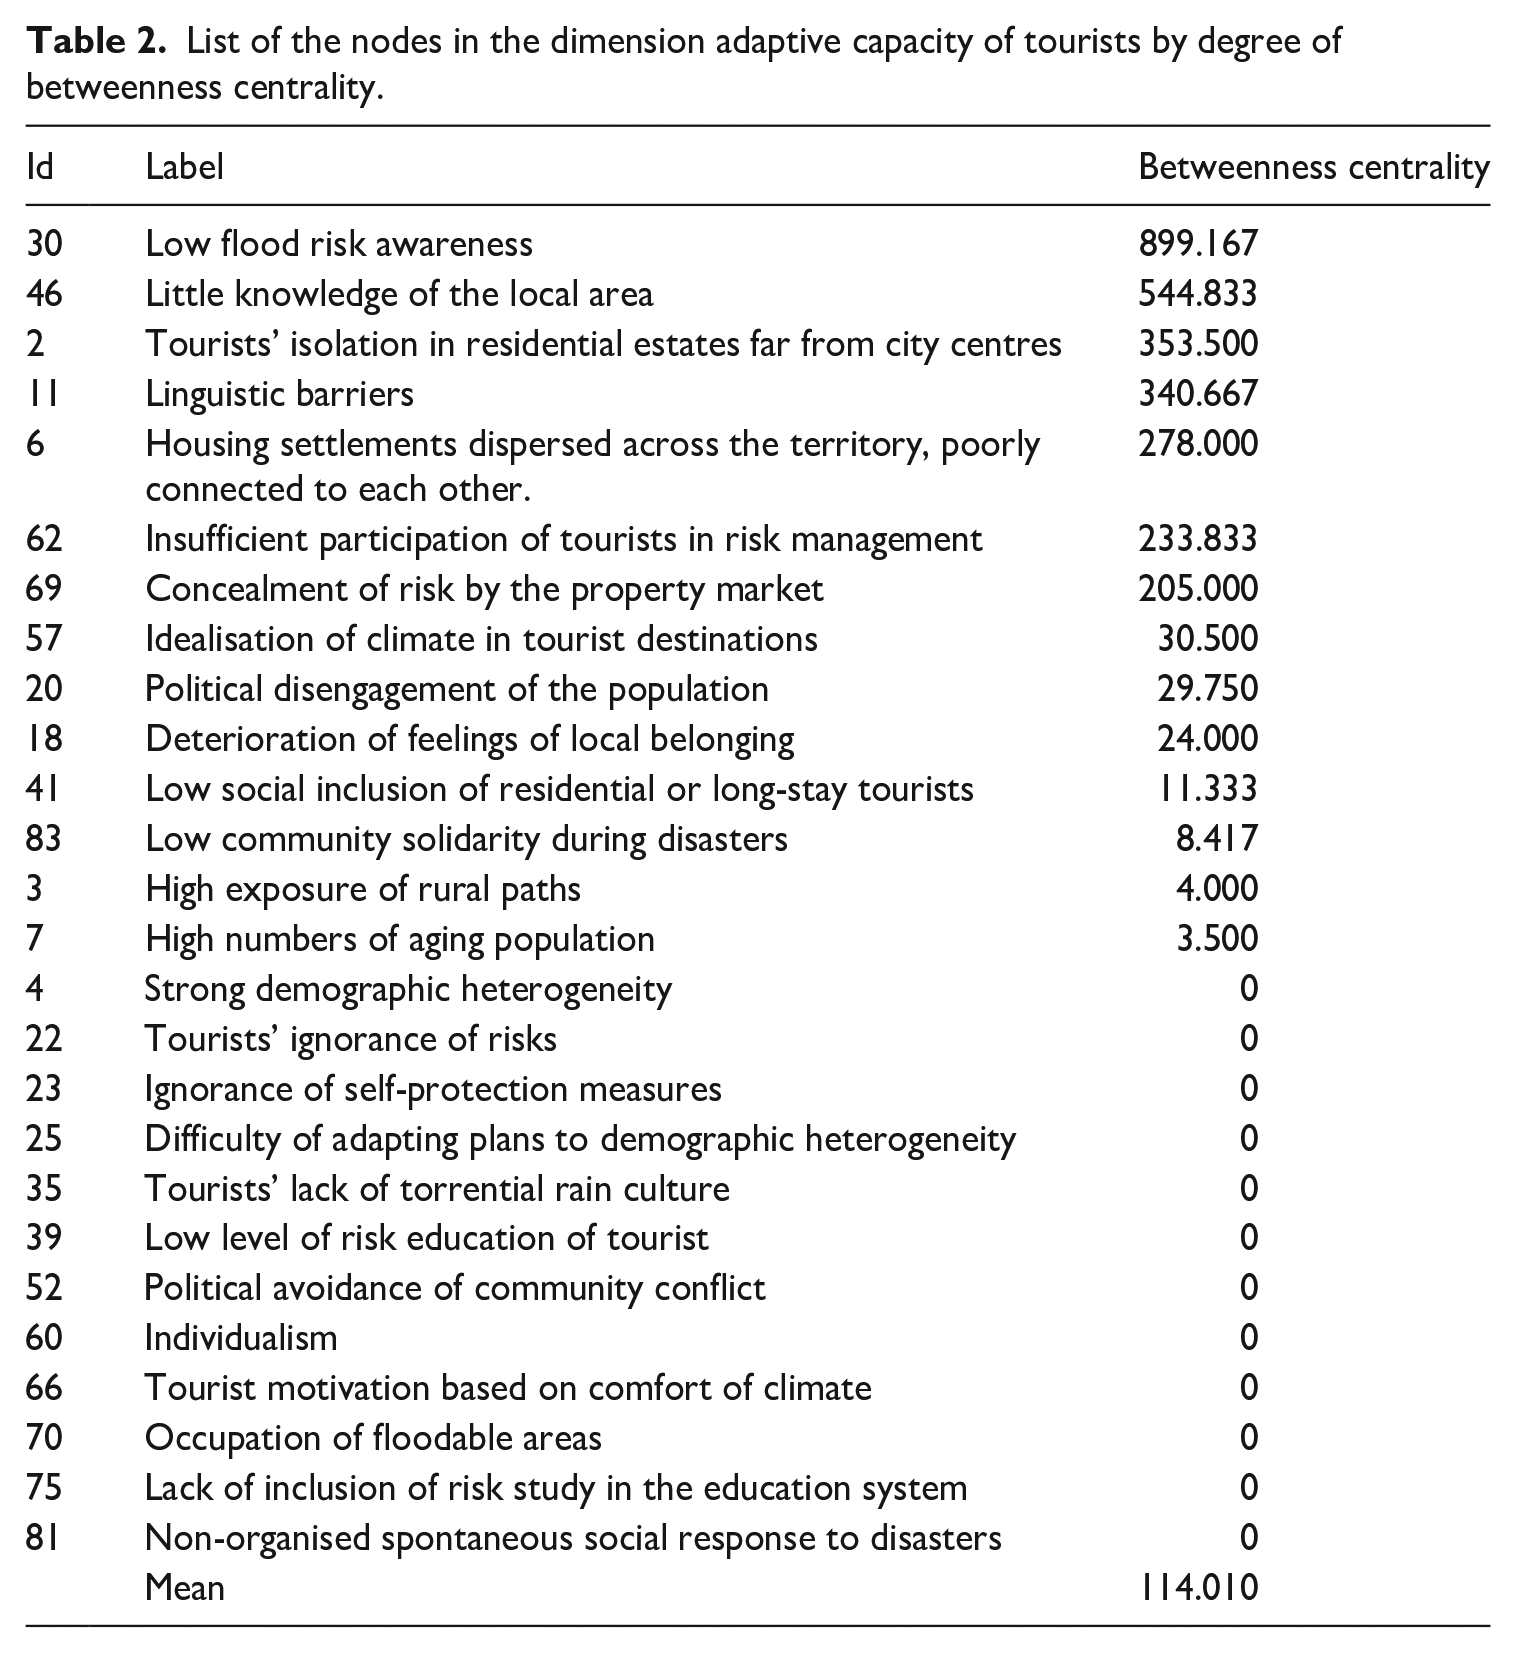
In addition, lack of knowledge of the local area (id 46-d1), isolation in residential estates far from town centres (id 2-d1) and linguistic barriers (id 11-d1) are notable, although to a lesser extent, for their centrality as components explaining the deficient adaptive situation of the tourist population on the Alicante coast. Long-stay tourists, with the comfortable climate (id 66-d1) and individual recreation (id 60-d1) among their main motivations, tend to live in gated communities far from the towns that are home to the local population (id 2-d1). These tourists also lack knowledge of the socio-environmental features of the local area (id 46-d1), which causes low development of their flood risk awareness (id 30-d1) and results in deficient knowledge of hazards and self-protection behaviours (id 23-d1). Moreover, they normally occupy outlying urban areas of high landscape value (id 6-d1), sometimes located in potentially floodable isolated areas (id 70-d1) to which emergency services do not have proper road access (id 3-d1). Finally, it should be noted that this adaptive situation is also determined by the urban development of the Alicante coast, characterised by property speculation (id 50-d3), which has involved the concealment of flood risk by the property market (id 69-d1), thus favouring low flood risk awareness among tourists (id 30-d1).
Socio-economic structure
This dimension of social vulnerability accounts for 21.43% of the nodes in the network (18) and refers to elements stemming from the economic and socio-occupational characteristics of the tourist industry and local population. This cluster is directly related to the adaptive capacity of tourists and, to a lesser extent, land use planning processes. Its peripheral position is due to its low level of betweenness centrality, the second lowest of the network’s four dimensions (84.330). Despite its low centrality, the socio-economic structure of the tourism sector represents a driver of social vulnerability, exercising an influence when facing the medium- and long-term impacts of flood disasters.
As Table 3 shows, economic growth based on property development (id 16-d2) is the node with the highest level of betweenness centrality in this dimension. The strong centrality of this driver of social vulnerability, combined with its closeness to the land use planning cluster, indicates that the property market plays an important role in shaping the economic development model of the Alicante coast. These processes are directly related to the growth of residential or long-stay tourism, based on the speculative building and sale of second residences for long-stay tourists (id 50-d3). This model of economic development, characterised by explosive growth with little long-term sustainability, has shaped a volatile economic and occupational structure giving rise to multiple factors of social vulnerability to flood risk, outlined in detail below.
List of nodes in the dimension of socio-economic structure by degree of betweenness centrality.
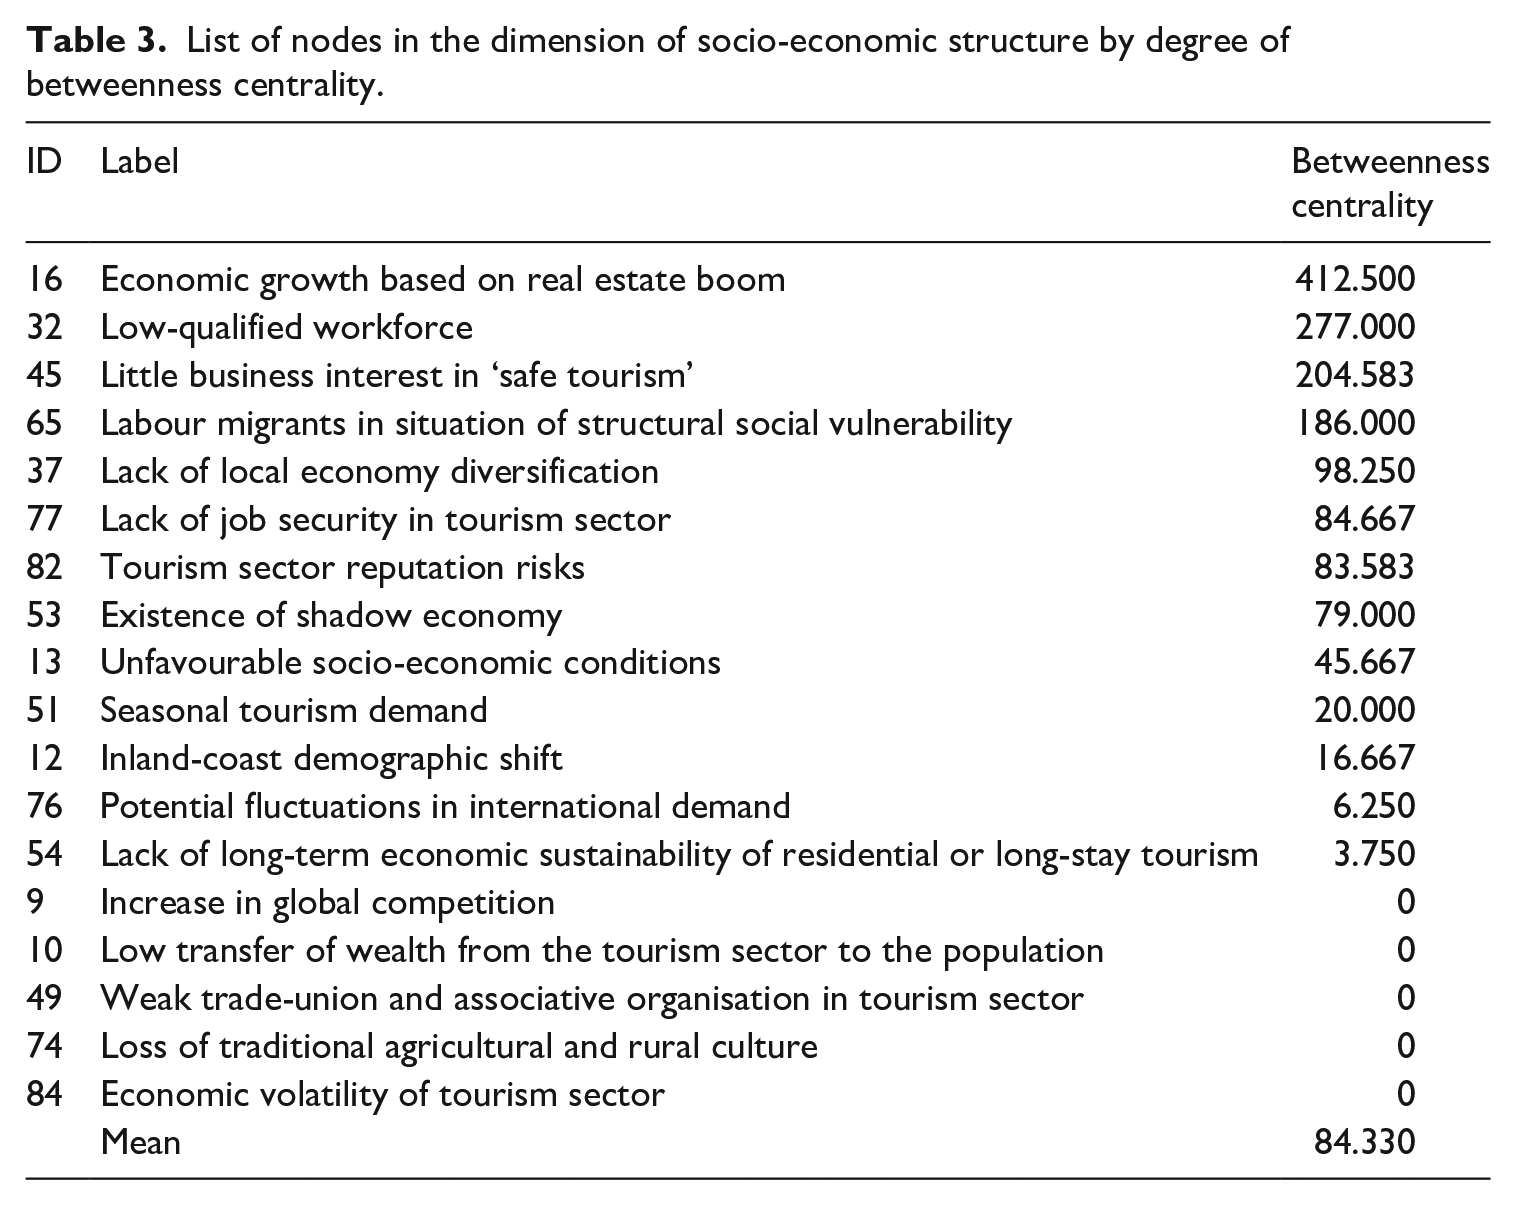
Regarding the components relating to the tourism sector’s socio-economic structure, we note features such as the lack of business interest in ‘safe tourism’ (id 45-d2), the scarce diversification of local economies (id 37-d2), the seasonal nature of tourism demand (id 51-d2) and the reputation risks faced by the sector due to flood disasters (id 82-d2), which can cause a deterioration in the security image of destinations and lead to fluctuations in tourism demand in post-event phases (id 76-d2). Turning to the components linked to occupational structure, the most important were the low level of qualification among the workforce (id 32-d2), which has resulted in a large number of labour migrants in a structural situation of social vulnerability (id 65-d2), and the lack of job security in the tourism sector (id 77-d2), often caused by the effects of the sector’s shadow economy (id 53-d2). This socio-economic situation is particularly important from the point of view of dealing with flood risk, since it shapes the conditions and adaptive capacities in the tourism industry and among local populations for responding to the economic impacts of potential flood disasters in the medium and long term.
Land use planning
This dimension of social vulnerability accounts for 21.43% of the nodes in the network (18) and includes the elements stemming from urban development processes that have caused an increase in exposure to flood risk in the region. Like the first dimension, land use planning occupies a central position in the network, forming direct relationships with nodes from other clusters. This cluster, in fact, has the highest mean betweenness centrality values in the whole network (125.680), which shows that urban development by means real state investments is the main factor in the model of social, economic and territorial development on the Alicante coast, therefore representing the principal focal point of social vulnerability to flood risk in the region.
As Table 4 shows, property speculation (id 50-d3) is the node with highest centrality in this dimension of social vulnerability. Its strong centrality is related to its mediating function between root causes such as landowners’ interests (id 63-d3) or political collusion in irregular urban growth (id 14-d3) and the rise of unplanned urban development (id 21-d3). Property speculation was the main driver of the real estate boom that consolidated residential or long-stay tourism on the Alicante coast and has decisively shaped the region’s model of socio-economic development. In spatial terms, these urban processes have given rise to a dispersed, heterogeneous landscape of residential developments spread across the territory (id 6-d1), leading in turn to the isolation of tourists from the main urban centres (id 2-d1).
List of nodes in the dimension of land use planning by degree of betweenness centrality.
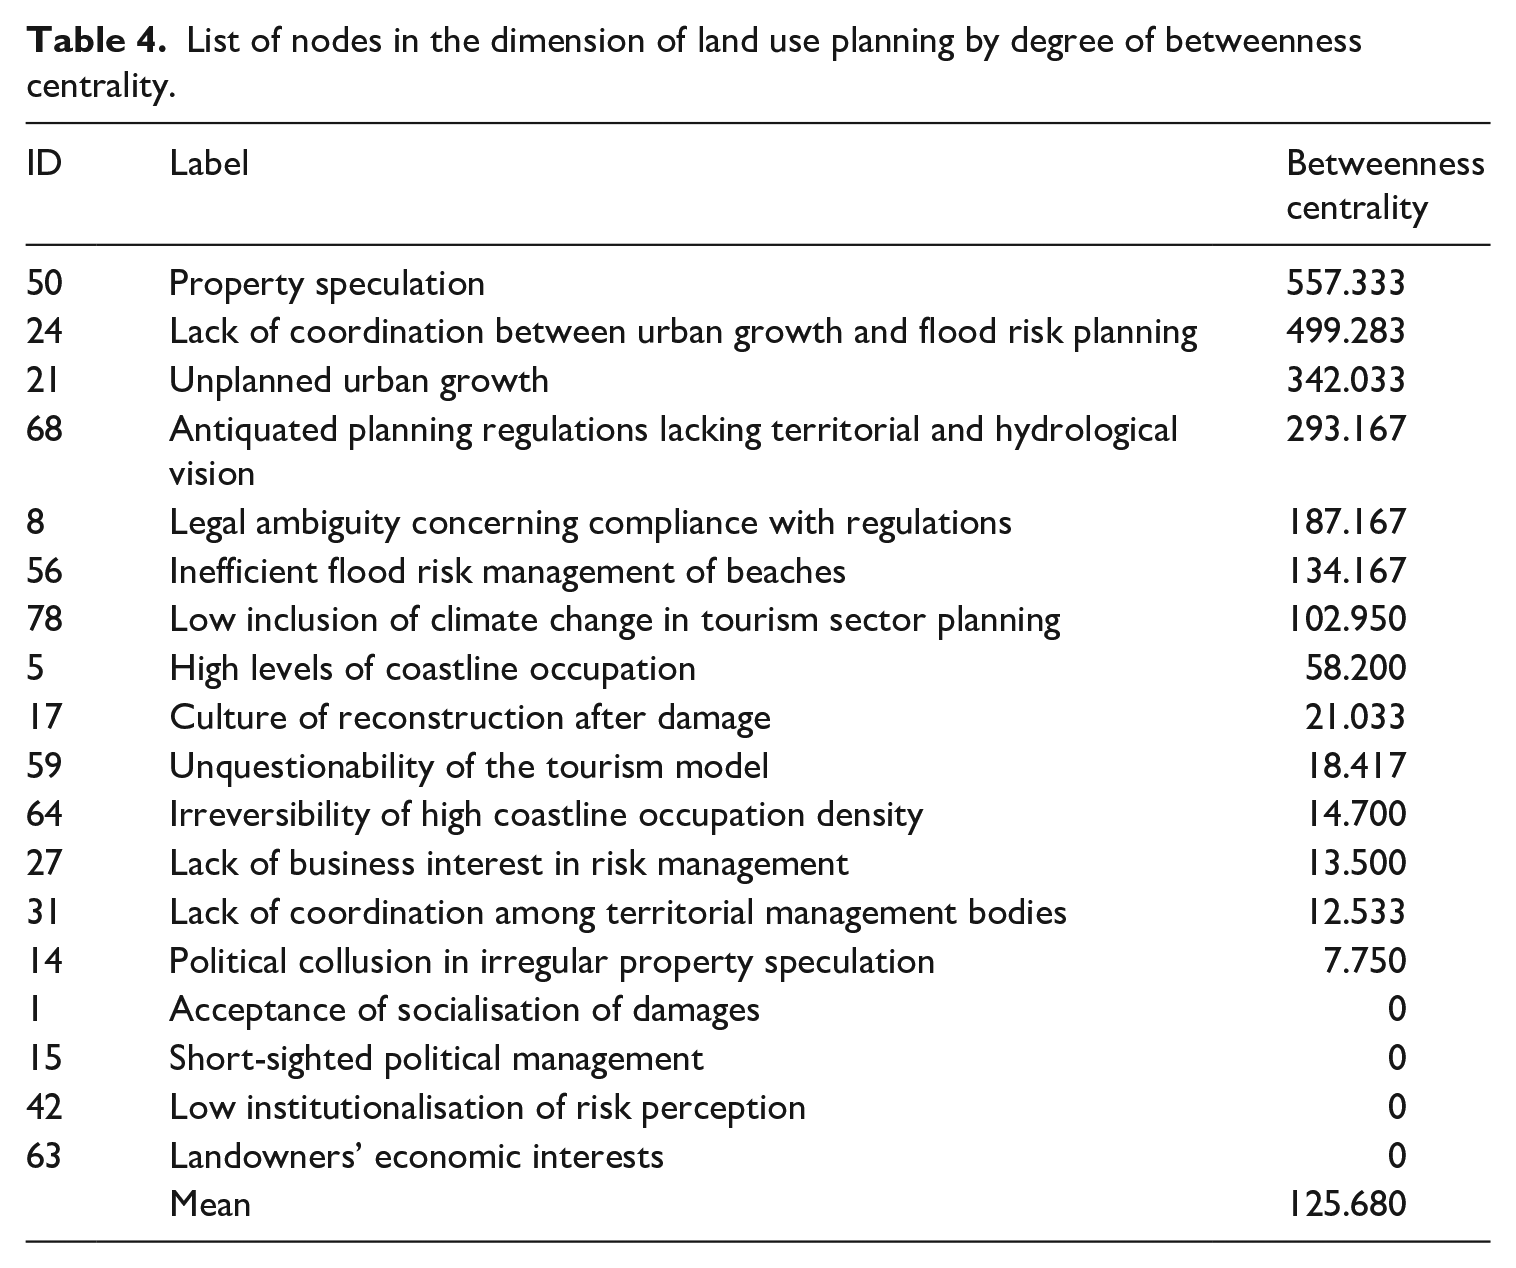
Furthermore, the lack of coordination among local development actors and government departments responsible for flood risk planning (id 24-d3) is a major cause of the absence of sensitivity to hydrological issues in planning regulations (id 68-d3). This regulatory weakness is also one of the drivers of property speculation on the Alicante coast (id 50-d3). In terms of flood risk, the main consequence of this land use planning model is that floodable areas are built on, both in outlying urban areas close to watercourses or riverbeds and on the coastline (id 5-d3). Finally, we should take into account other nodes such as the inefficient flood risk management of beaches (id 56-d3), caused by the reactive culture of damage reconstruction after coastal floods (id 17-d3), and the lack of business interest in carrying out measures of adaptation to climate change and the concurrent increase in flood risk (id 78-d3).
Risk management
This dimension of social vulnerability accounts for 26.19% of the nodes in the network (22) and includes components relating to the characteristics of flood risk management policies and actions in the Alicante coastal region. Like the second dimension, risk management is directly connected to land use planning and the adaptive capacity of tourists. As it is a dimension on the periphery of the network, its betweenness centrality (72.880) is the lowest of the four clusters in the network. Although it contains the node with the highest centrality in the network (id 28), risk management includes nodes that have little relationship to other clusters. This marginal position may be related to the strong topic specificity of this dimension of social vulnerability. Despite its low centrality, however, this dimension has strategic importance, since it affords information on flood risk management approaches and measures that have a direct influence on reducing social vulnerability.
As Table 5 shows, the lack of political interest in flood risk management (id 28-d4) is the node with the highest centrality both in this dimension of social vulnerability and in the whole network. This factor is close to other nodes with high centrality, such as the lack of flood risk awareness among the local population (id 30-d1), which is its main cause, and the lack of coordination between urban development and hydrological planning (id 24-d3), which is one of its major consequences. In other words, lack of flood risk awareness favours citizens’ passive attitudes towards the growth of social vulnerability and risk exposure, with the result that political actors do not see management of these risks as politically profitable.
List of nodes in the dimension of risk management by degree of betweenness centrality.
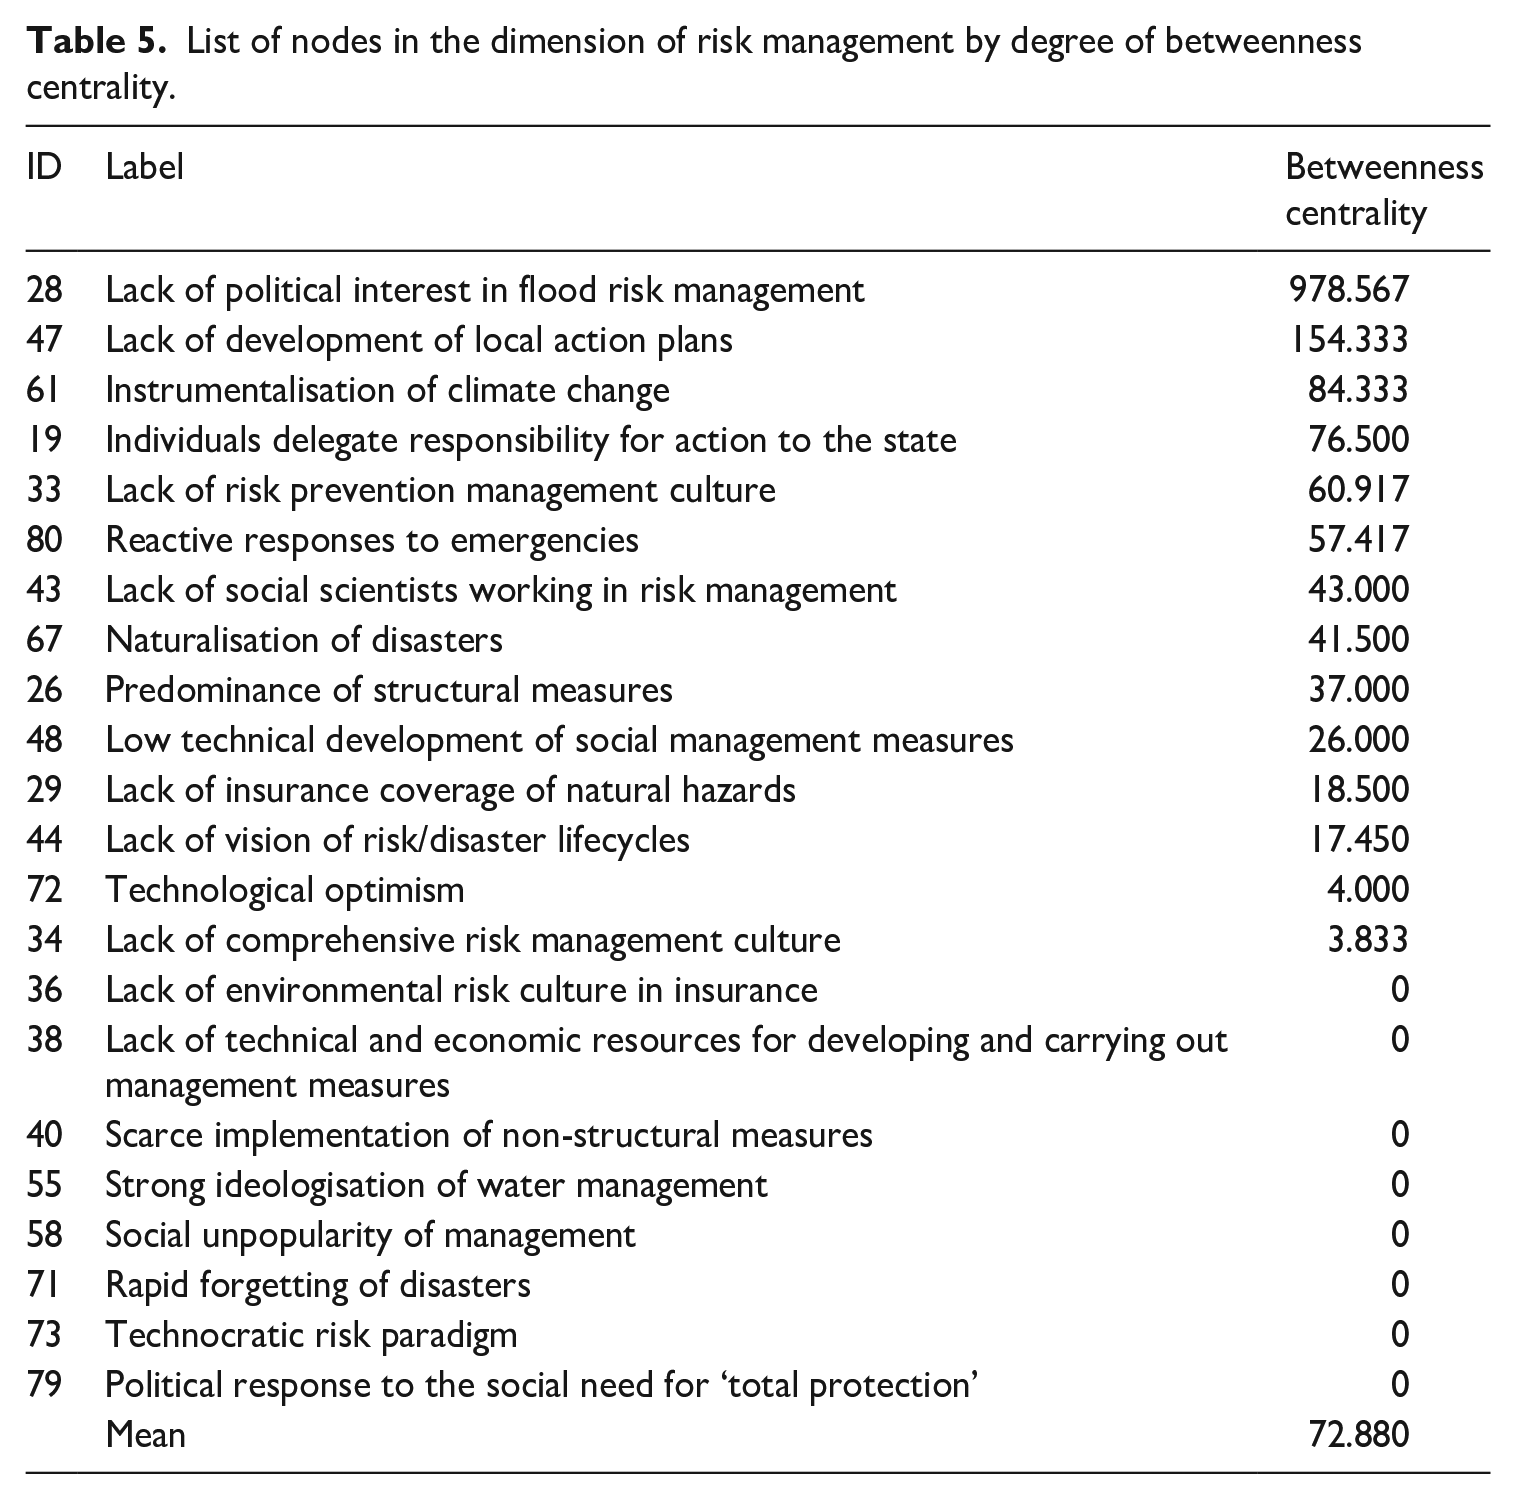
Finally, we should consider other nodes such as the insufficient development of local action plans (id 47-d4), the lack of natural hazard culture in the private insurance sector (id 29-d4) and the excessive predominance of structural measures (id 26-d4), with the correspondingly scarce development of non-structural measures aimed at strengthening the population’s social responses (id 48-d4). Most measures carried out to date have been driven by the technocratic risk management paradigm (id 73-d4), underpinned by technological optimism and the belief in human mastery of the forces of nature (id 72-d4). This paradigm negates the comprehensive vision of disaster lifecycles (id 44-d4), thus leading to the application of reactive emergency response measures (id 80-d4) and the scarce development and implementation of risk prevention actions (id 33-d4). This lack of preventive culture is one of the causes of the remarkable absence of local flood risk management plans (id 47-d4) which in turn results in technical and financial deficiencies in the design and implementation of action measures (id 38-d4).
Conclusion
We should briefly reflect on the opportunities for flood risk management afforded by the application of SNA to the study of the causal processes of social vulnerability. This type of analysis, by hierarchising the mediating power of the causal components of social vulnerability, enables us to identify the factors with high casual power, which are particularly important for risk management. From the point of view of the reduction of social vulnerability and the impacts of these disasters, it is more strategically effective to act on these forces than on the root causes or specific conditions. First, the root causes have a high level of abstraction and are deeply embedded in ideological and regulatory systems, which leave local and regional flood risk organisations little room for manoeuvre in addressing them. Second, specific conditions are the final expression of the causal processes of social vulnerability. Acting on these conditions does not affect their deep underlying causes, which means that such actions cannot normally mitigate their causes in a definitive manner. Therefore, flood risk management measures can be most effective when they are applied to causes of high relational centrality, the components connecting both root causes and specific conditions. This mediating function confers high causal power on these drivers of social vulnerability. As a consequence of their centrality, the application of measures aimed at managing them can be significantly more effective due to their multiplying effect on the other elements of social vulnerability. While acting on these forces may not result in immediate benefits, the effectiveness of such actions in the medium and long term gives them high strategic value for effectively reducing social vulnerability to flood risk. The identification of these generative forces allows at the same time to map the main areas of social impacts of floods. The driving forces of social vulnerability represent adaptive hotspots where the main social impacts of a flood disaster can take place. Therefore, vulnerability studies based on the proposal of this article can help to enhance and qualify preventive strategies aimed at the proactive management of the social impacts of these events.
Footnotes
Funding
The authors disclosed receipt of the following financial support for the research, authorship, and/or publication of this article: This research was funded by the Spanish Ministry of Science (grant number PID2021-122500OB-I00) and the Valencian Regional Government (grant number CIAICO/2021/173).