
Abstract
This article assesses the association between the Title I School Improvement Grant (SIG) program’s personnel replacement policy and teacher employment patterns within an urban school district. Hannan and Freeman’s population ecology model allowed the authors to consider schools within districts as individual organizations nested within a larger organization. The data are drawn from employment records of 2,470 teachers who worked in 19 high schools in a single school district from 2006 to 2011. The personnel replacement policy of the Title I SIG program appears to have reinforced, and in some cases intensified, existing patterns of teacher selection, retention, and migration.
Keywords
Introduction
Upon election, President Barack Obama and Secretary of Education Arne Duncan introduced an education policy agenda targeting the growing number of public schools labeled as persistently low-achieving (PLA). Consequently, prior to the 2010 school year, leaders in the U.S. Department of Education restructured the Title I School Improvement Grant (SIG) program with the stated goal of “turning around” the nation’s 5,000 lowest-performing schools between 2009 and 2014 (Duncan, 2009). Although the Institute for Education Sciences issued a warning regarding the low levels of evidence available to support valid and reliable methods of school turnaround (Herman et al., 2008), the reauthorized Title I SIG program required schools labeled as Tier I PLA, those with the lowest performance, to implement one of the four prescribed turnaround models: turnaround, restart, school closure, or transformation. According to Jambulapati (2011), within schools labeled as Tier I PLA, 73% of leaders selected and implemented the transformation model, with only 6% choosing to restart or close the school. In the remaining 21% of cases, leaders implemented the turnaround model, which required the replacement of the principal and no less than 50% of the teaching faculty.
Unfortunately, previous studies of teacher employment patterns have highlighted the difficulties associated with recruitment, selection, and retention of quality teachers in high-needs schools (Borman & Kimball, 2005; Jacob, Vidyarthi, & Carroll, 2012). Further complicating these individual challenges, interdependent and ecological relationships between schools exacerbate the difficulties associated with teacher attrition, as well as mediate the effectiveness of potential reforms. For instance, Labaree (2012) argued that interdependent relationships between schools during competition for finite resources constituted a zero-sum game, which inherently produced a “winner and loser.” Educators, policymakers, and researchers must understand how interactions within and between school populations influence teacher employment and other educational reforms (Ritchie, 2004).
To contribute to the understanding of how reforms manifest within school populations, this article maintained dual purposes. First, we extended the population ecology model described by Hannan and Freeman (1977) to the field of public education. Second, we applied the model to specifically examine teacher employment patterns and school performance within a large urban school district after the implementation of the Title I SIG personnel replacement policy. Conceiving of teachers and their associated knowledge and skills as finite resources for which individual schools competed, we analyzed longitudinal teacher employment records and school performance data to answer three research questions:
Background
We did not intend to conduct an exhaustive review of studies related to the topic of teacher movement, as others have already conducted such reviews (Borman & Dowling, 2008; Guarino, Santibañez, & Daley, 2006; Seidel & Shavelson, 2007). Instead, we attempted to broaden the research related to teacher movement beyond the focus on teachers or schools as the exclusive unit of analysis. Specifically, we used Hannan and Freeman’s (1977) organizational population ecology model to enrich the current teacher employment literature by balancing the adaptive and selective mechanisms of teacher employment, as well as widening the aperture of analysis to examine the influences of teacher movement on a population of schools.
Extending the Population Ecology Model
In 1977, Hannan and Freeman proposed their population ecology model as a conceptual framework to better account for the process of organizational change and development. Prior to their work, popular views attributed success and failure to the activities of a single organization (Carroll, 1984). In contrast, Hannan and Freeman applied the tenets of biological ecology to assume that the environment of an organization wielded greater influence than organizational adaptation. Describing the basic assumptions of population ecology, Salimath and Jones (2011) wrote, “An individual organization’s survival is then based on environmental selection of those organizations that best fit their particular localized environment” (p. 875).
Instead of focusing on the internal workings of individual organizations, population ecology research emphasized the influence of environmental factors (Wholey & Brittain, 1986). Therefore, population ecology researchers searched for explanations of organizational change among environmental factors like available resources and competition, rather than internal factors like managerial decisions and organizational operations (Carroll, 2012). For example, Lowery, Gray, Kirkland, and Harden (2012) studied the influence of limited resources on the formation of organizational specialization and niches. In another application of population ecology, MacGregor and Madsen (2013) examined organizational development after an ecological disruption.
As a result of their concentration on organizational selection rather than adaptation, Hannan and Freeman’s (1977) model focused the unit of analysis at the population, rather than the individual level. To distinguish between the individual and population level in an organizational environment Hannan and Freeman wrote, “We use the term population in a second sense: to refer to aggregates of organizations rather than members. Populations of organizations must be alike in some respect, that is, they must have some unit character” (p. 934). Researchers have used the population ecology framework to study a wide array of organizational populations, such as jewelers (Lazzeretti, 2006), computer disk drive manufacturers (Carroll, Harrison, & McKendrick, 2012), banks (Gómez, Orcos, & Palomas, 2016), and automobile manufacturers (Talay, Calantone, & Voorhees, 2014).
Beyond explicating the congruence of analytic levels, Hannan and Freeman (1977) extended the tenets of biological population ecology to develop an organizational population ecology framework. Similarly, in Table 1, we provided examples of how their population ecology framework further extended to school populations. In addition to congruent levels of analysis, we highlighted several factors that demonstrated similarities, differences, and nuances of extending the population ecology framework to school populations. The list of comparisons did not represent an exhaustive account of the extension, but instead provided critical comparisons between the three domains. For example, just as organisms hunt for food to stay alive, corporations and schools rely upon the recruitment of talented employees, and teachers to achieve success. Biologists evaluate a population of organisms by measuring the weight of individuals in the population and financial analysts discuss the growth of an industry by tracking corporate profits. Similarly, educational researchers calculate the success of a population of schools with results from school level literacy tests.
Examples of Biological, Organizational, and Educational Population Ecology Frameworks.
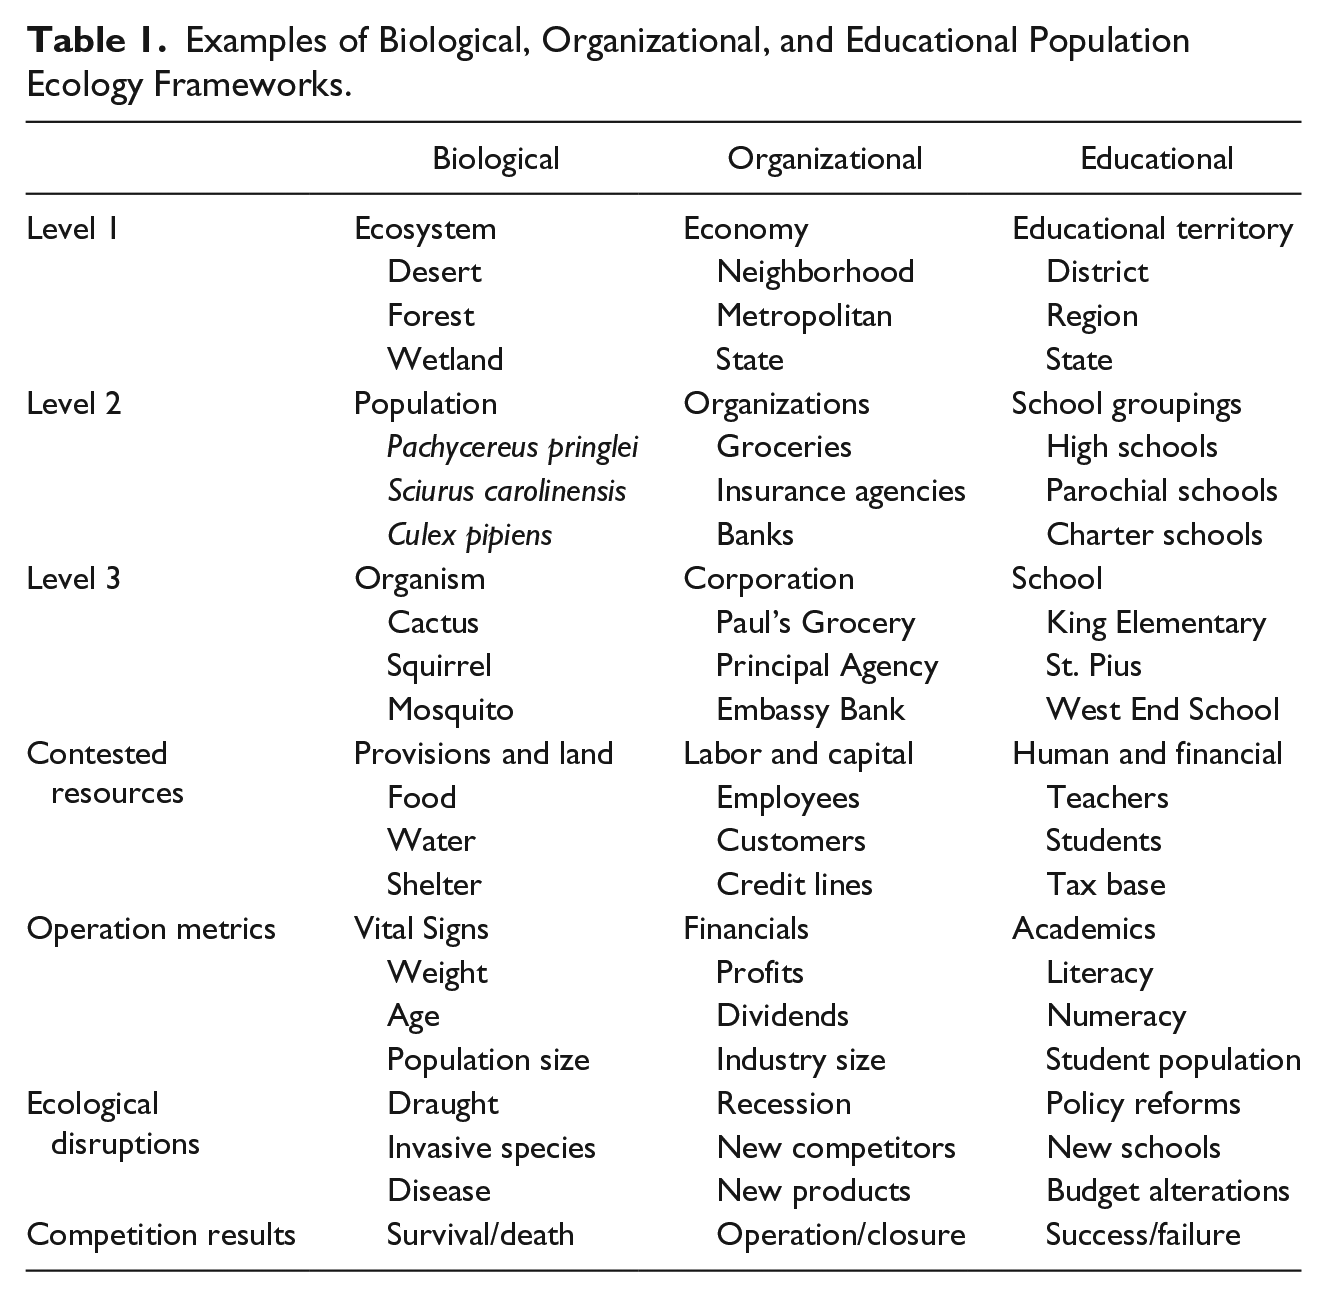
However, in Table 1, we also recognized one of the greatest discrepancies in the extension of the population ecology framework to schools. Ultimately, Hannan and Freeman (1977) extended their framework as a mechanism to account for survival. Yet, unlike individual organisms, some corporations and many schools never cease to exist. For instance, Meyer and Zucker (1989) detailed the operation of “permanently failing organizations” and Stuit (2012) illustrated the continued persistence of low-performing public and charter schools. Although policy mechanisms in the No Child Left Behind Act and the Race to the Top grant facilitated the process of closing a school, closures still did not occur with the same frequency as the death of an organism or the bankruptcy of a corporation (Jambulapati, 2011).
Rather than school closure, we contend that identification and operation as a PLA school, corresponds to organism death or corporate closure for two reasons. First, educational reform attempts often result in continued dismal performance or lack of sustained improvement in PLA schools (Matthews & Sammons, 2005). Second, a number of issues unrelated to the academic performance of schools hinder the closure of a school (Duke, 1995; Kirshner & Pozzoboni, 2011). Unlike biological or organizational ecologies, educational ecologies do not maintain an efficient mechanism to end the existence of entities that cannot or do not effectively compete for finite resources. Therefore, utilizing Labaree’s (2012) characterization of education as a zero-sum game, we extended the dichotomy of competition results in the population ecology framework from survival or death to success or failure, with avoidance of PLA identification constituting success.
Although a several authors have critiqued the population ecology framework (Amburgey & Rao, 1996; Young, 1988), researchers have continued to utilize the paradigm to study processes related to organizational change (Carroll & Hannan, 2000; Wholey & Brittain, 1986). In their review of the population ecology literature between 1996 and 2010, Salimath and Jones (2011) identified more than 100 peer reviewed articles that applied the population ecology framework to study organizations. Describing of the history, utility, and efficacy of population ecology, Carroll (2012) wrote “Organizational ecology went on to attract legions of students and supporters who pursued a variety of related but separate theoretical directions, all embedded within the framework of organizational ecology” (p. 95).
Despite this prolific use of population ecology to study organizations, only a limited number of researchers have used the framework to study educational organizations. Moreover, researchers have utilized the population ecology framework to study populations other than traditional public schools. For example, Rowan (2002) used population ecology to examine how “organizations other than schools and governing agencies” influenced the rate of school improvement (p. 285). Researchers have also applied the tenets of population ecology to examine charter school formation (Renzulli, 2005), development (Renzulli, Barr, & Paino, 2015), diffusion (Renzulli & Roscigno, 2005), and closure (Paino, Renzulli, Boylan, & Bradley, 2014). In this study, we utilized the framework to examine whether an ecological disruption was associated with access and opportunity to a critical resource of schools by studying the movement of teachers among a population of traditional public schools.
Teacher Employment and Movement
Understanding that teachers are the most important school factor associated with student achievement, researchers have devoted a considerable amount of resources to studying them. Researchers have examined characteristics that distinguish effective from ineffective teachers (Stronge, Ward, & Grant, 2011). Perceiving the need for schools to attract effective teachers, others have studied characteristics related to the selection, retention, and distribution of teachers (Boyd et al., 2011). Conceiving of teacher performance and distribution as a function of incentives, others have investigated the impact of school characteristics (Hanushek & Rivkin, 2007), as well as reward systems (Podgursky & Springer, 2007) on teacher effectiveness and employment. Still others have assumed that the options available to district and school leaders are bound by not only the teacher labor market (Kirby & Grissmer, 1991) but also the quality of the teachers’ preparation (Darling-Hammond, Berry, & Thoreson, 2001; Goldhaber & Brewer, 2000). Within these larger veins of literature developed a line of research dedicated to the examination of teacher attrition and retention (Borman & Dowling, 2008; Ingersoll, 2001).
Examining teacher attrition and retention, Keigher and Cross (2010) estimated that in the 2008-2009 academic year, roughly 500,000 teachers within the United States left their schools. Of those teachers, they labeled 255,700 as movers, or those leaving their position to seek employment at another campus. Ingersoll (2001) had previously dubbed this movement between campuses as “teacher migration.” Among studies of teacher attrition and migration, many researchers have focused analysis on identifying the individual characteristics of students, schools, and teachers that account for teacher movement (Ritchie, 2004).
Researchers have found an association between the composition of a school population and the rate of teacher attrition and retention. Prior to the implementation of the No Child Left Behind Act, Hanushek, Kain, and Rivkin (2004) identified higher rates of teacher attrition in low-achieving schools with large concentrations of disadvantaged students. Specifically focused on beginning teachers, Smith and Ingersoll (2004) discovered increased rates of teacher attrition in schools with greater concentrations of disadvantaged students. Using a variety of data sets and techniques, researchers have consistently determined that high-needs schools, those with poor test scores and large proportions of minority and disadvantaged students, confront higher rates of teacher attrition than their low-needs counterparts (DeAngelis & Presley, 2011).
Beyond the composition of a school’s student body, researchers searched for school-related contextual factors associated with teacher retention and attrition. Factors commonly investigated included perceptions of teacher and administrative support, student discipline, autonomy, compensation, and other contextual constructs (Hanushek et al., 2004; Ingersoll, 2001). In their meta-analysis of teacher attrition and retention, Borman and Dowling (2008) concluded, “The evidence reviewed in this meta-analysis suggests that there are a large number of characteristics of the environments in which teachers work that predict attrition” (p. 398).
Seeking to understand the intrinsic nature of teachers’ decisions to transfer schools or even remain in the profession, researchers have also investigated individual teacher characteristics associated with attrition and migration. Such studies have examined a wide range of teacher characteristics, including, but not limited to gender, race/ethnicity, subject specialization, route to certification, and familial obligations (Borman & Dowling, 2008; Boyd, Grossman, Lankford, Loeb, & Wyckoff, 2006; Ingersoll, 2001; Kirby, Berends, & Naftel, 1999; Stinebrickner, 2002). Young and novice teachers experience greater rates of turnover compared with their more veteran peers (Allensworth, Ponisciak, & Mazzeo, 2009; Hanushek et al., 2004; Ingersoll, 2001). In addition, teachers with greater demonstrated abilities experienced increased rates of turnover (Lankford, Loeb, & Wyckoff, 2002; Podgursky, Monroe, & Watson, 2004). Together, these findings suggested that young and seemingly talented teachers are those most likely to leave schools.
An additional school contextual factor has demonstrated an association with teacher movement and school performance. Numerous researchers have noted the importance of school leaders to school effectiveness and school improvement (Hallinger & Heck, 1998; Leithwood & Jantzi, 1999; Sammons, 2007; Teddlie & Reynolds, 2000). Recent studies of “turnaround” have also highlighted the importance of school leaders (Bryk, Sebring, Allensworth, Easton, & Luppescu, 2010; Duke, 2007; Herman et al., 2008; Matthews & Sammons, 2005; The Office for Standards in Education, 1997; Orr, Berg, Shore, & Meier, 2008). In addition to influencing school effectiveness and improvement, researchers have found that principal actions and attitudes are associated with teacher attrition and retention (Barnett & McCormick, 2004; Griffith, 2004).
Although studies of teacher movement have examined individual schools, leaders, and teachers, researchers typically detailed substantial methodological limitations related to understanding the mechanisms and influences of teacher movement. Attempting to address such issues, Jacob et al. (2012) studied the impact on schools after the loss of high-quality teachers and retention low-quality teachers. Although the authors’ estimated the likelihood of selecting another highly qualified teacher from the market of available teachers, they did not specify how these losses and gains influenced the success of other schools in the local population. Using a longitudinal data set from New Zealand, Ritchie (2004) specifically examined the movement of teachers between schools grouped by socioeconomic status. To better conceive of how teacher movement relates to the success of schools within a population, as well as educational reform, we extended the population ecology model described by Hannan and Freeman (1977), described the strengths and weaknesses of the model, and applied it to the longitudinal movement of teachers within a population of schools.
Teacher Movement via Hannan and Freeman’s (1977) Population Ecology Model
Hannan and Freeman’s (1977) conception of a population ecology perspective provides three critical applications to our study. First, utilization of population ecology framework properly focuses the unit of analysis at the population or school district level rather than the teacher or individual school level. Akin to the levels of nesting identified by Raudenbush and Bryk (2002), the population ecology perspective of Hannan and Freeman identified at least five potential levels of analysis: members, subunits, individual organizations, populations of organizations, and communities of organizations. Works like Ingersoll (2001), Borman and Dowling (2008), and Boyd et al. (2011) have utilized a variety of methodologies to study members and individual organizations, yet did not examine the relationships between schools, their organizational environment, and disruptions to their environments. Hannan and Freeman explained the benefit of the unit of analysis at the population level,
Events at one level almost always have consequences at other levels. Despite this interdependence, population events cannot be reduced to individual events (since individuals do not reflect the full genetic variability of the population) and community events cannot be simply reduced to population events. (p. 933)
Although the teacher replacement policy targeted individual PLA schools, the reform influenced the population of schools because it mandated teacher changes, thereby altering a common, critical, and finite resource of all schools.
Second, the population ecology framework balances the adaptive and selective perspectives of organizational and school development (Hannan & Freeman, 1977). Similar to Duke’s (2008) model of school decline, the population ecology framework assumes interactions between leaders’ decisions and external environmental factors influence the evolution of an organization. As Hannan and Freeman (1977) stated, “Much more is known about decision-making practices, forecasting, and the like than about selection in populations of organizations” (p. 938). Instead of focusing on adaptive decisions, such as efforts to replace, recruit, select, and retain teachers, population ecology incorporates a selective perspective, assuming some organizations maintain characteristics that allow them to better compete for finite resources.
Third, Hannan and Freeman’s (1977) population ecology model extends Hawley’s (1968) work by further examining the organizational influences of competition. Hannan and Freeman argue competition must be viewed as a primary determinant of an organization’s unique identity,
A focus on selection invites an emphasis on competition. Organizational forms presumably fail to flourish in certain environmental circumstances because other forms successfully compete with them for essential resources. As long as the resources which sustain organizations are finite and populations have unlimited capacity to expand, competition must ensue. (p. 940)
Their conception of competition emphasized the importance of recognizing the finite and fixed resources available when investigating the complexities of interdependent organizations. Instead of viewing PLA schools as isolated organizations struggling to retain quality teachers, the population ecology model allows scholars to consider the influence of disruption to the population of schools. Specifically, we explored how the personnel replacement required of PLA schools influenced the competition for teachers between PLA schools and other district schools.
Method
To examine the patterns of teacher employment, we analyzed teacher employment histories as collected and reported by the state professional standards board. The examined records spanned from the 2006 school year through the 2011 school year. The data available during these six academic years provided information about five possible transfer periods. From the employment and certification records, we categorized teachers by content area and school designation. We then plotted the longitudinal transfer patterns of teachers between schools.
Population and Sample
During the 2010 and 2011 school years, the state department of education identified and sanctioned 21 schools as PLA, requiring they implement one of four federally mandated turnaround models (Maxwell, 2009). Of the identified schools, 10 of the high schools and all three middle schools operated under the jurisdiction of Habitat School District (HSD; a pseudonym). Due to our interest in the impact of turnaround intervention requirements on the employment patterns of teachers in a given organizational environment, we limited our population to HSD high schools. This restriction conformed to Hannan and Freeman’s (1977) conception of a population, “Given a systems definition, a population of organizations consists of all the organizations within a particular boundary that have a common form” (p. 936).
The 10 PLA high schools in HSD constituted approximately half of its 21 comprehensive high schools. Of these 21 comprehensive high schools, two schools included additional grade levels beyond the 9 to 12 grades. The potentially unusual personnel needs of these schools compelled us to exclude them from the sample. Subsequently, the teacher sample consisted of all full-time teachers from the remaining 19 HSD high schools who worked between 2006 and 2011 as reported by the state professional standards board. This operational definition identified 2,474 individual teaching records. From this group, four additional teachers were eliminated from consideration because of issues pertaining to either a unique teacher or school identification code, resulting in a final sample of 2,470 teachers.
The Policy Environment of HSD
In a multitude of respects, HSD resembled many larger urban districts. Compared with other districts within the state, HSD educated a substantially larger population of students. Among the HSD students, minority and disadvantaged students constituted a greater percentage of the student population as compared with other districts within the state. In addition, academic and nonacademic performance measures of HSD often did not exceed the state mean or outpace surrounding districts. Similar to many large urban districts, these population and performance discrepancies attracted an abundance of political and media attention.
Although HSD shared many characteristics with other larger urban districts, the policy environment of HSD demonstrated several distinct characteristics that potentially decreased the external validity of findings, but increased the internal and construct validity of this study (Shadish, Cook, & Campbell, 2002). First, state laws did not permit charter school operation, which limited the scope of school competition to strictly public schools. However, HSD operated multiple application magnet schools. Second, HSD utilized state certified teachers or those undergoing alternative state certification. Unlike other urban districts, alternative suppliers of teachers, like Teach for America, did not operate within HSD. Third, HSD provided more lucrative salaries and benefits than the surrounding districts. Together, these three environmental characteristics limited external competition common to other large urban district environments and focused competition for teachers between HSD schools.
Teacher Employment Regulations in HSD
The HSD Board of Education negotiated a collective contract with the teachers’ association for all teachers in the district, which included the rights and processes related to transferring schools within HSD. According to the HSD teacher contract, the transfer process consisted of three stages. During the first stage, principals with teaching vacancies may interview the three teachers with the most seniority who have requested a transfer to their school. Voluntary teacher transfers may request consideration from five schools, whereas involuntary teacher transfers may request consideration by 10 schools. During the second phase of the transfer process, principals choosing to select a transfer must hire the most senior teacher who requested a transfer to their school. Finally, during the third and final phase of the transfer process, principals have the option of interviewing and selecting a new teacher, but the following year, the most senior teacher on the transfer list will be placed into that position.
Principals of the 2010 cohort of PLA schools did not have to abide by the transfer requirements of the teachers’ contract. To replace the number of teachers required to leave the school by the personnel replacement policy, principals in PLA schools were free to select new teachers or transfers with less seniority than previously required. However, principals in schools on the verge of identification as a PLA school still had to abide by the teachers’ contract. In addition, teachers involuntarily transferred from the four identified PLA schools could request up to 10 schools for transfer consideration, including schools on the verge of PLA identification.
School and Teacher Classification
Nine of the HSD schools avoided PLA sanctions and interventions in 2010 and 2011, and we categorized these as nonpersistently low-achieving (NPLA) schools. The remaining 10 PLA schools consisted of two cohorts. At the time of the data collection, the four members of 2010 PLA cohort had implemented the required personnel replacements. However, the 2011 PLA cohort were newly identified and had not yet implemented the required personnel replacements. Despite this difference, we coded all 10 of the identified schools as PLA schools.
Although no causal connection could be established, substantial differences between PLA and NPLA schools manifested among the nonacademic indicators of school performance (Table 2). Longitudinal mean results calculated from available data between 2006 and 2011 suggested teachers in PLA schools confronted greater challenges than their NPLA counterparts. Each of the nine indicators for all 6 years revealed more favorable results in NPLA schools. Among these differences, two factors indicated notable longitudinal trends in the student composition of the schools. First, the mean student population of NPLA schools continuously increased resulting in schools averaging approximately 90 more students, while PLA schools demonstrated a continual decrease resulting in a loss averaging nearly 115 students. Second, both PLA and NPLA schools experienced an increase in the percentage of students eligible for free and reduced lunch prices (FRL). However, the percentage of FRL students increased at a greater rate in the PLA schools, further widening the gap between NPLA and PLA schools to more than 30% by 2011.
Comparison of NPLA and PLA Schools Non-Academic Characteristics.
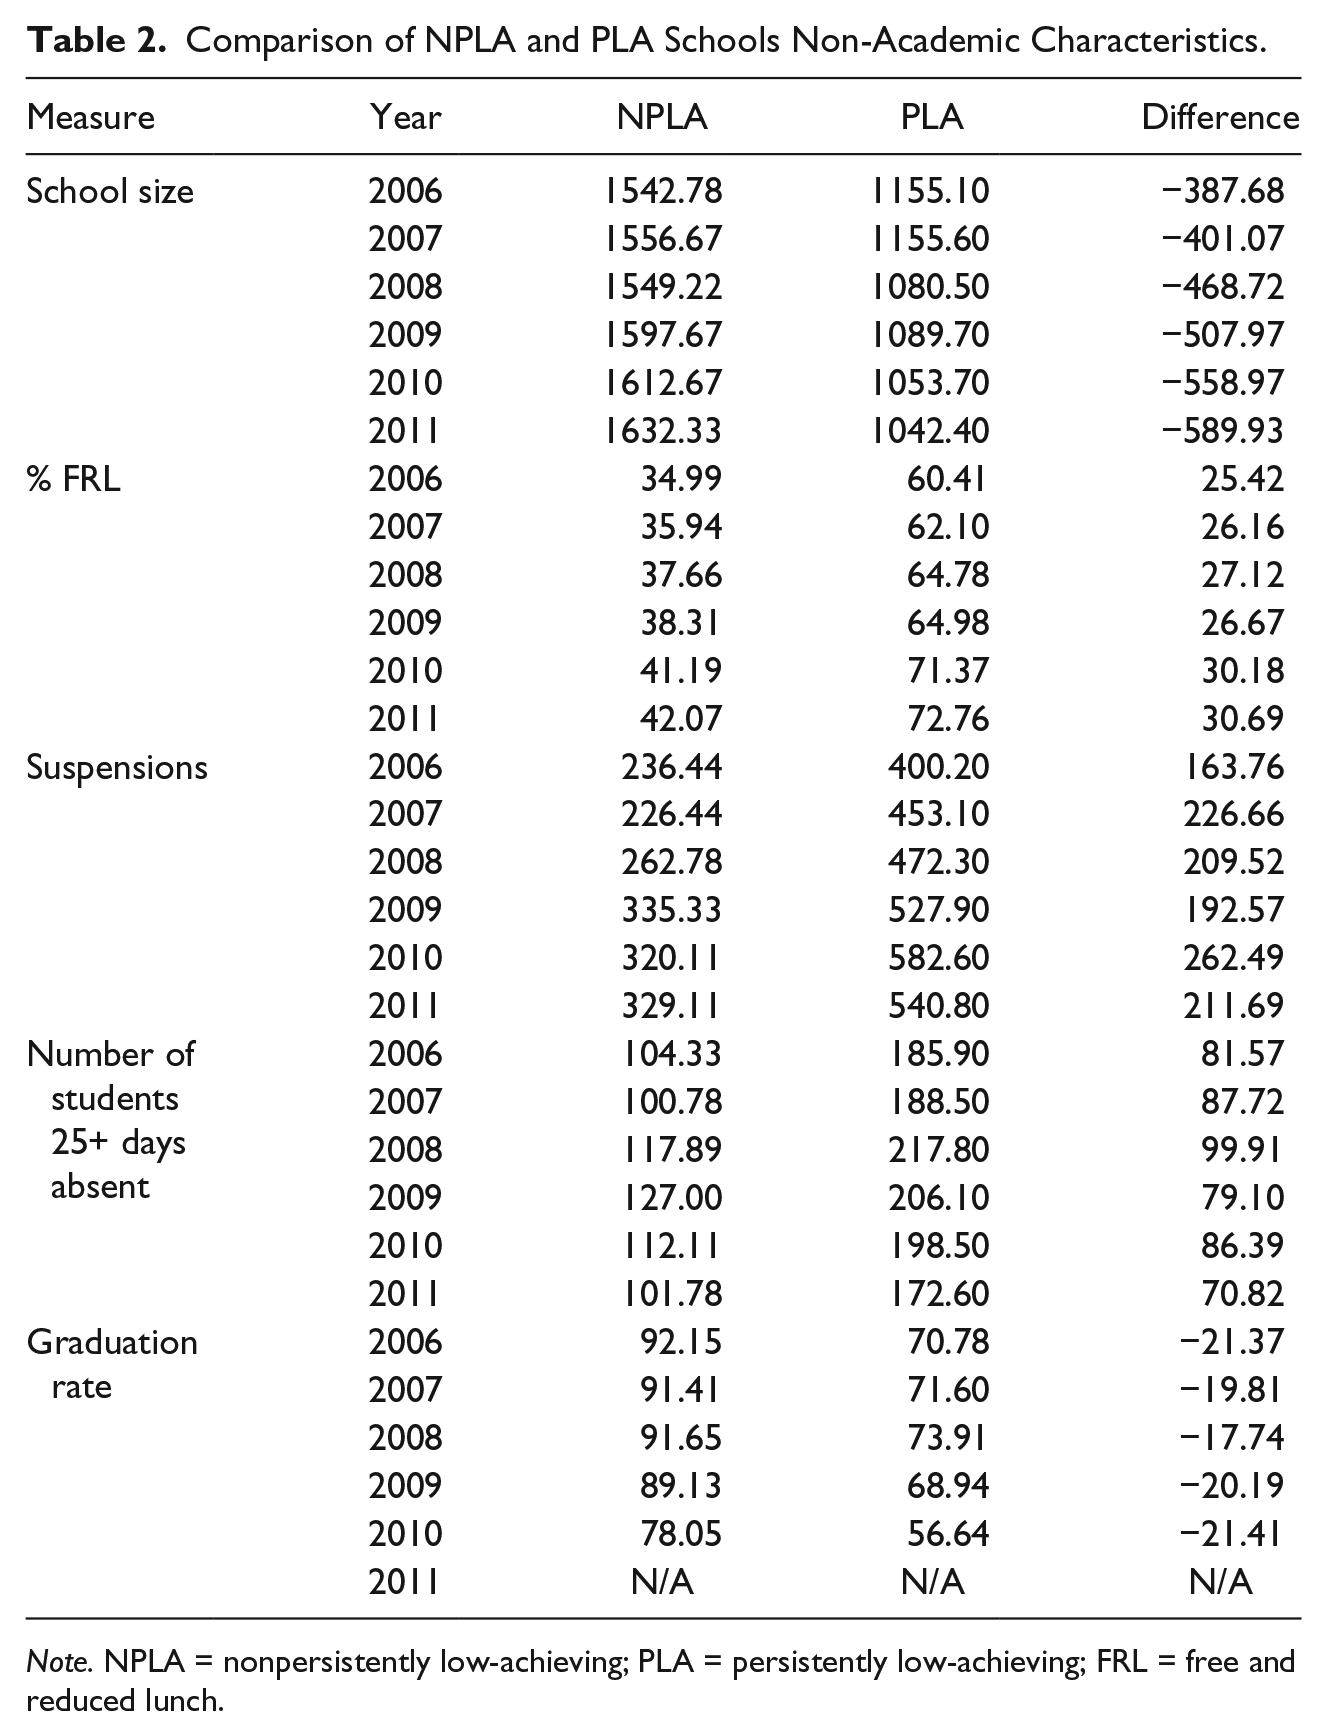
Note. NPLA = nonpersistently low-achieving; PLA = persistently low-achieving; FRL = free and reduced lunch.
Similar to the trends present in the nonacademic indicators, NPLA schools reported greater mean percentages of students earning proficiency on state administered accountability tests than PLA schools in each of the 5 reported years (Table 3). Because of a change in state accountability testing, results from 2006 were not comparable with the remaining years, and thus not reported. Despite group differences, substantial longitudinal trends did not manifest within the PLA or NPLA cohorts for either reading or math testing results. However, PLA and NPLA schools demonstrated substantial gains in reading and math scores. In addition, the PLA schools reported greater mean gains in 2011, for both reading and math, than their NPLA counterparts. Although a ceiling effect could bias these results, mean PLA schools gains exceeded NPLA gains by approximately 9% in reading and 6% in math.
The Percentage of Students Earning Proficiency in NPLA and PLA Schools by Tested Area.
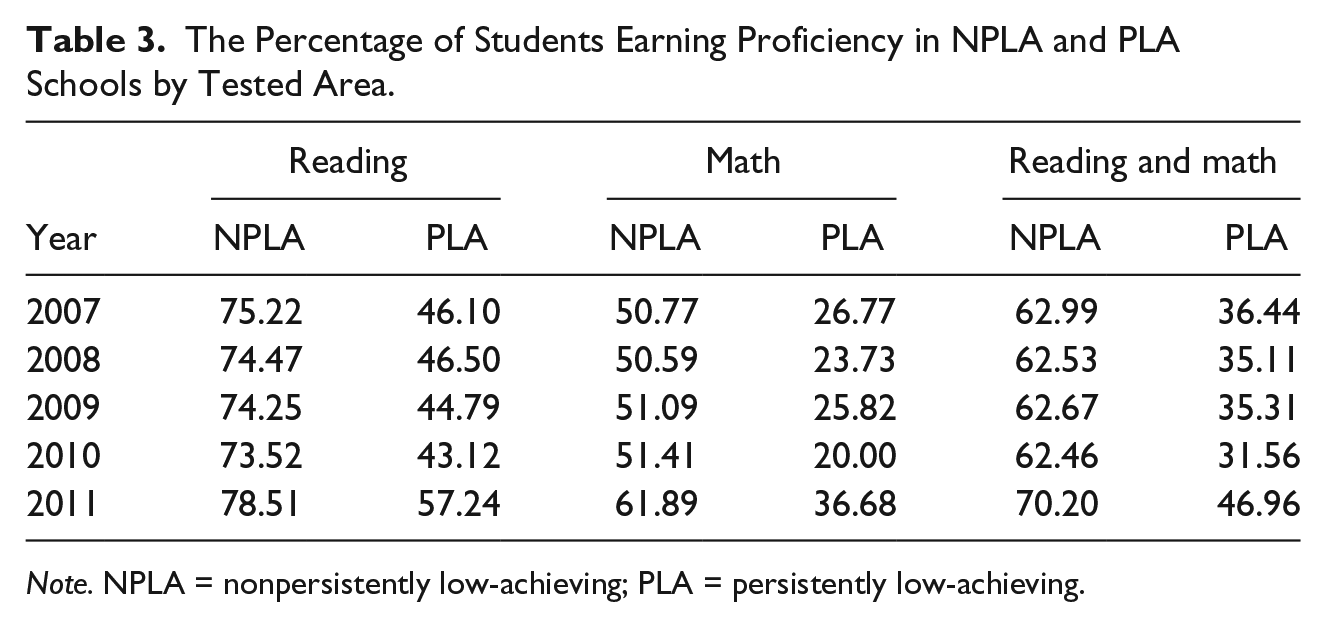
Note. NPLA = nonpersistently low-achieving; PLA = persistently low-achieving.
For teachers employed in these 19 schools, we examined their longitudinal employment records and applied four operational definitions. For each of the five potential employment change periods, we classified the movement of each HSD employed teacher as either leave, new, remain, or transfer (Table 4). From the available data, we could ascertain the status of the teacher, but not the rationale for that status. For instance, a teacher classified as a leave, could have transferred to another district, left the profession, or retired. Similarly, a new teacher designation did not necessarily mean the individual was a first-year teacher, but rather that the teacher had not previously been employed in a HSD high school between 2006 and 2011. From these codes, we ascertained the employment status of each teacher by year, individual school, and performance designation of the school.
Operational Definitions of Teacher Employment.
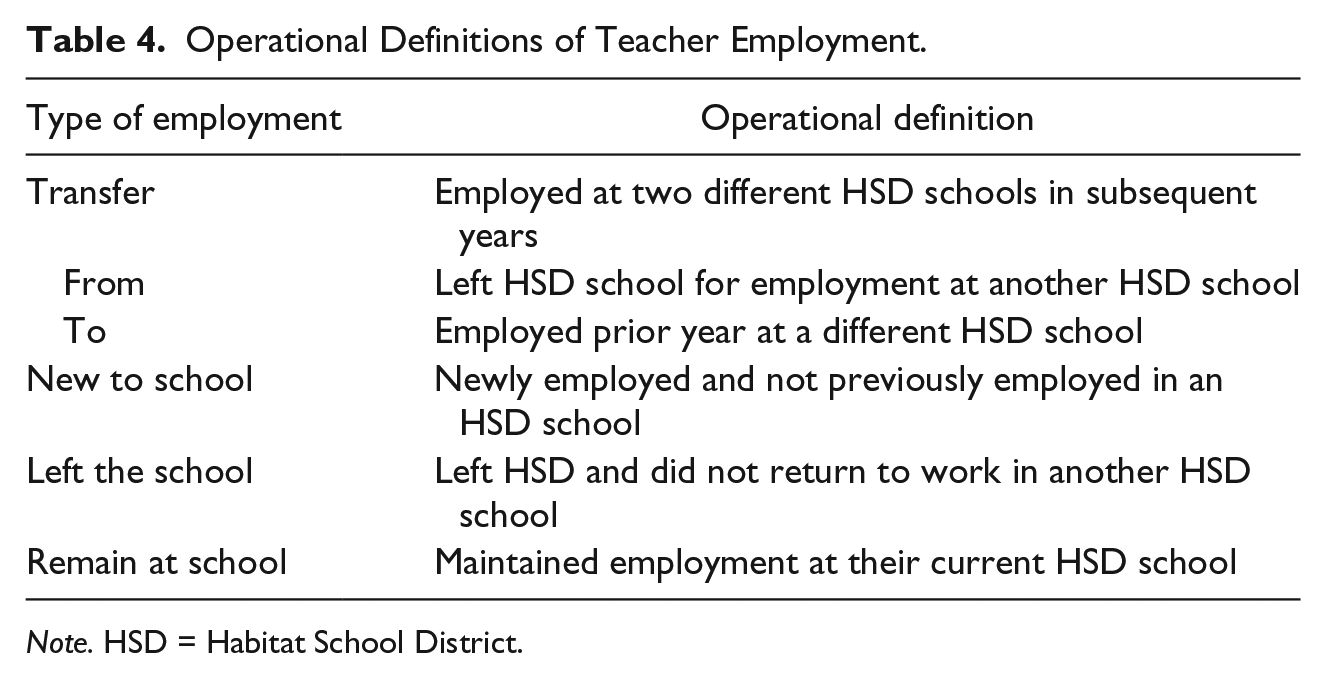
Note. HSD = Habitat School District.
For teachers classified as transfers, we added an additional coding to better understand the patterns associated with transfers. Using the certification information provided by the standards board, we further coded each transfer by their certified content area. From specific course designations, such as English III, Algebra II, U.S. History, Biology, and Orchestra, we classified each transfer as one of five content categories: literacy, math, science, social studies, and other. From this information, we determined in what year a teacher transferred, from what school they transferred (From), to what school they transferred (To), the performance designations of these schools, as well as the content area of the transferred teacher.
Research Design and Analyses
Although the number of teachers represented a moderate population size, the nominal nature of the data did not permit inferential statistical analysis of significant differences between years, schools, types of performance, or content area. However, by plotting teacher status and monitoring it over a period of 6 years, we ascertained the existence of patterns in teacher employment status by year, school achievement, and content area. The longitudinal nature of the data set enabled us to assess the disruptive influence of personnel replacements policies on the HSD teacher ecosystem. To discern such patterns, we used three analytic strategies.
We plotted teacher transfers for each school in each academic year by the academic ranking of the school. We then sorted the schools into PLA and NPLA school samples, and plotted the transfers between these two samples for each year. Finally, because PLA identification relied upon literacy and numeracy performance, we also plotted each of the five content categories: literacy, math, science, social studies, and other. Results from these three strategies enabled us to establish a baseline of teacher employment patterns to compare with teacher employment patterns after the implementation of personnel replacement policies.
Results
Individual School Comparisons
Results from the examination of teacher employment by individual school did not reveal common, nor reliable patterns of teacher employment (Table 5). The differing and evolving sizes of the faculty at each school rendered analysis of the number of teachers coded as either leave or remain pragmatically useless. Results from the analysis of the new and transferring teachers also did not establish predictable patterns among the individual schools. For instance, from 2006 through 2011, School 7 was one of the five highest performing schools in the state with an average reading and math proficiency score of approximately 90%. Yet, five lower performing HSD schools hired fewer new teachers than School 7. The results did not provide evidence that academic performance of an individual school influenced the employment patterns of teachers. Instead, this analysis suggested that a variety of factors influenced teacher employment patterns.
Average Teacher Movement (2007-2011) as a Function of Average School Proficiency (2006-2011) and Number of Teachers Remaining at the School.
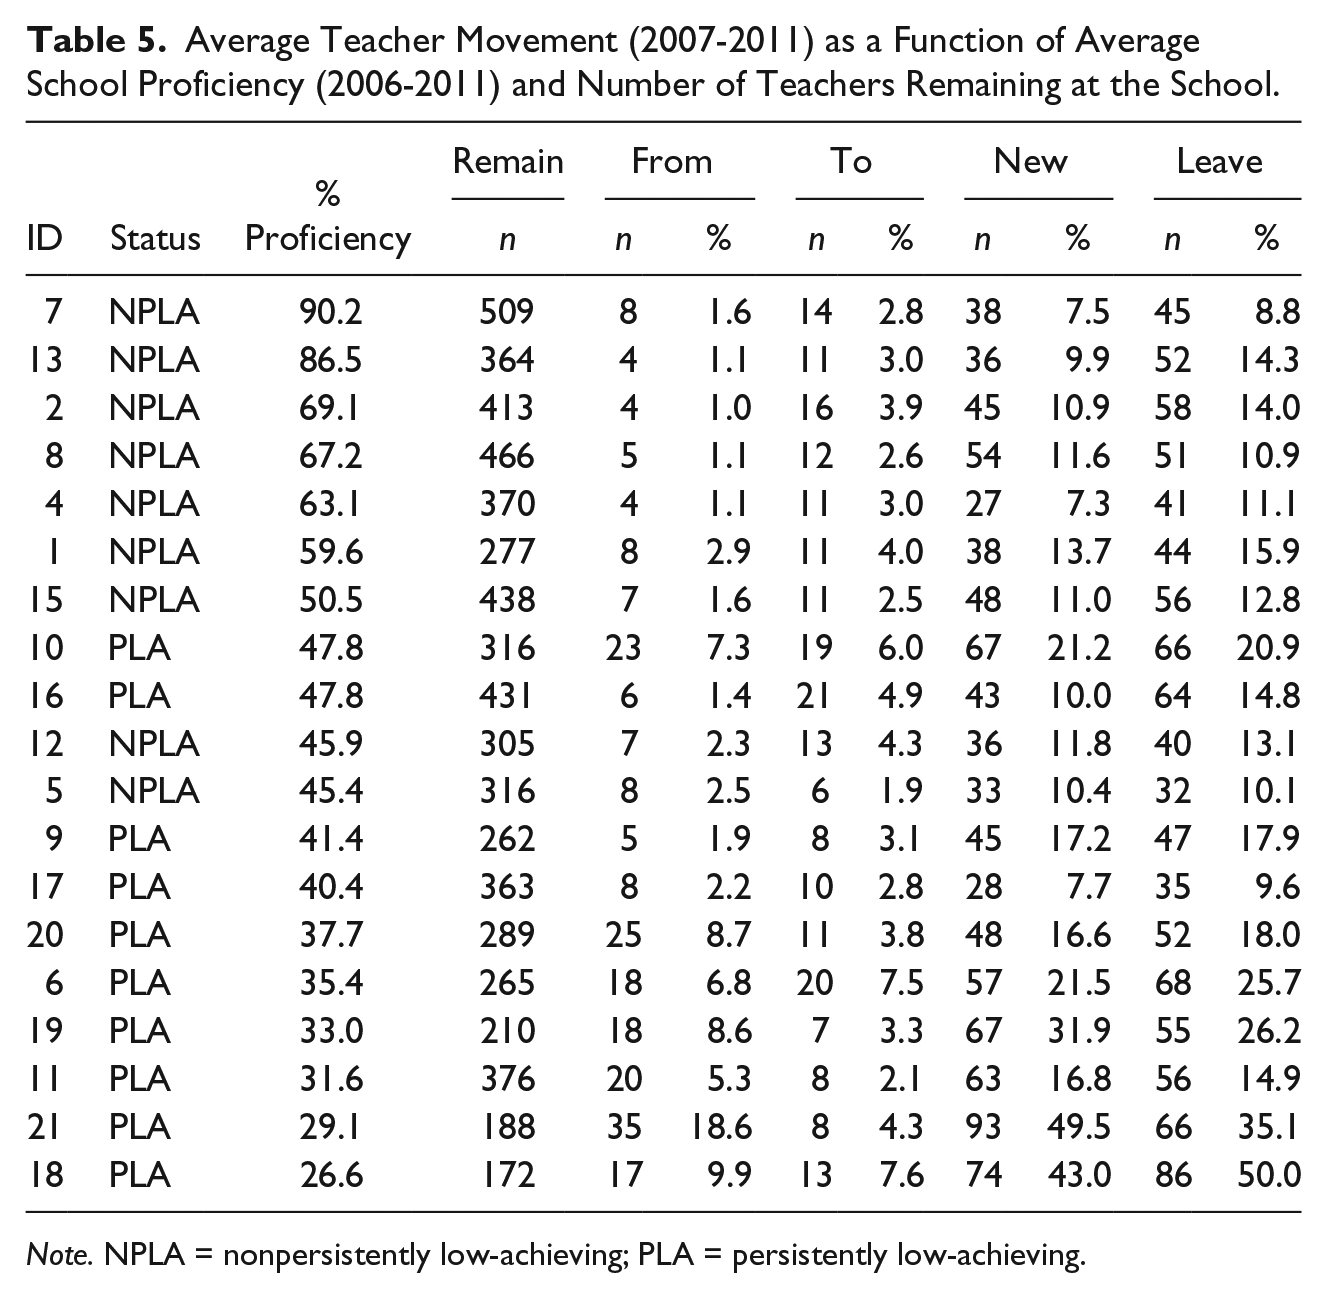
Note. NPLA = nonpersistently low-achieving; PLA = persistently low-achieving.
Teacher Employment by PLA Status
As with the academic and nonacademic indicators, NPLA schools exhibited more desirable teacher employment indicators than PLA schools. Of the teachers who remained at their schools for each of the examined years, a greater percentage taught in NPLA schools (Table 6). Although the PLA cohort includes one more school, the larger student populations of the NPLA schools could explain the NPLA advantage. However, PLA schools accounted 59% of the teachers who left the district. Finally, PLA schools hired 62% of the teachers new to HSD.
Annual Comparisons of Teacher Employment Status in NPLA and PLA Schools.
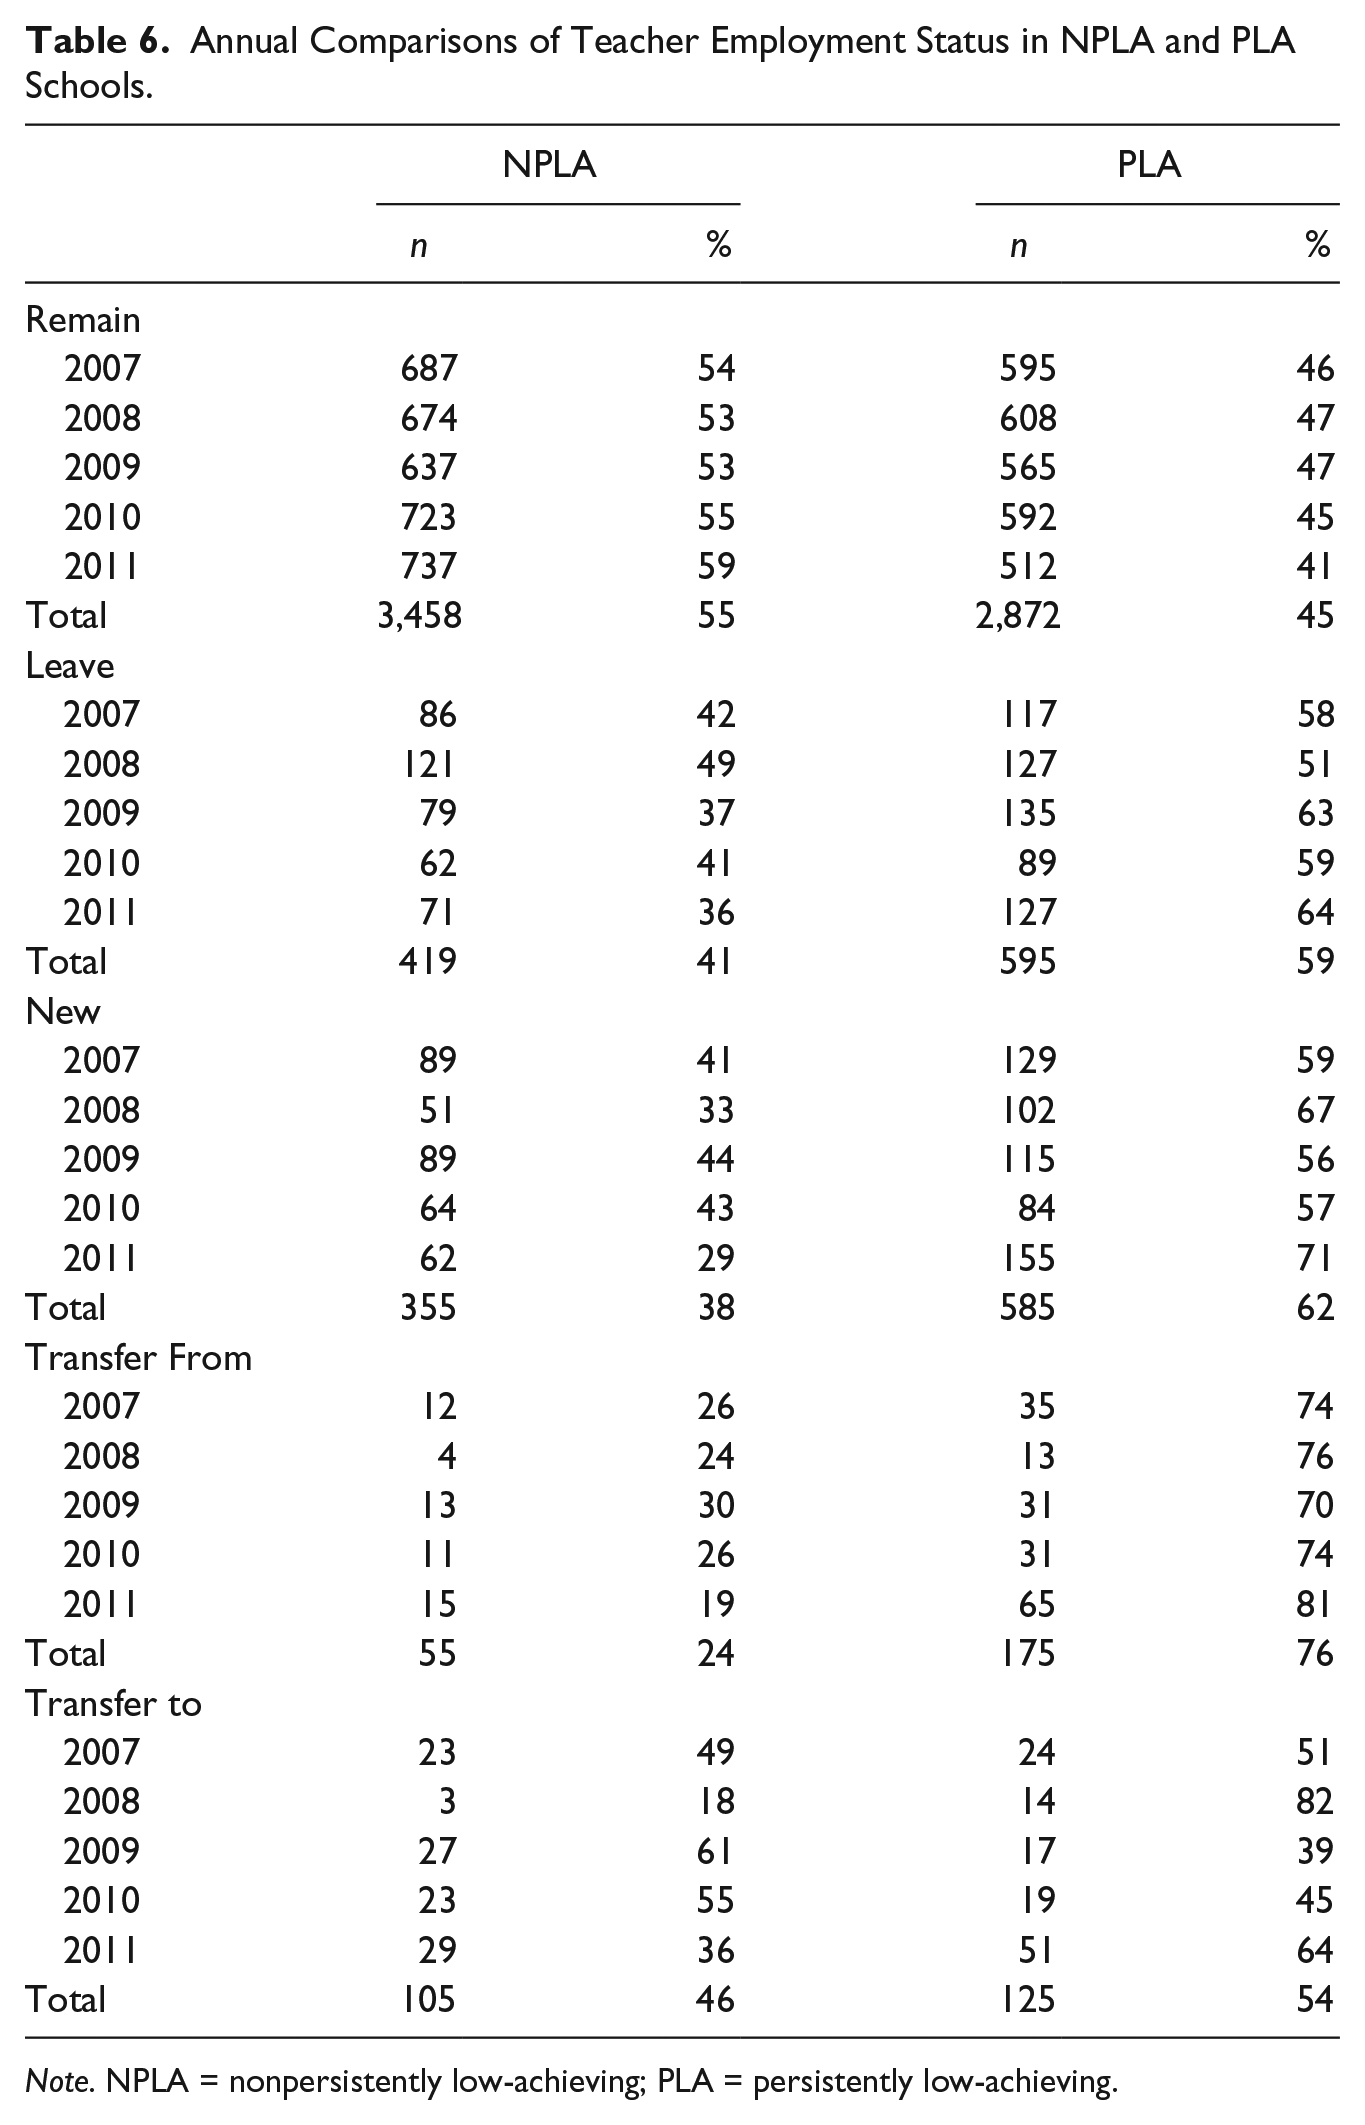
Note. NPLA = nonpersistently low-achieving; PLA = persistently low-achieving.
Further examination of the 230 teacher transfers between 2007 and 2011 revealed additional discrepancies between the NPLA and PLA cohorts (Table 7). For instance, more than 75% of transfers originated from a PLA school. Among the 175 teachers who transferred from a PLA school between 2007 and 2011, 56% transferred to a PLA school. In contrast, the 55 teachers who transferred from NPLA schools during the same time period were equally distributed between NPLA (28) and PLA (27) schools.
Annual Number and Percentage of Transfers Between NPLA and PLA Schools.
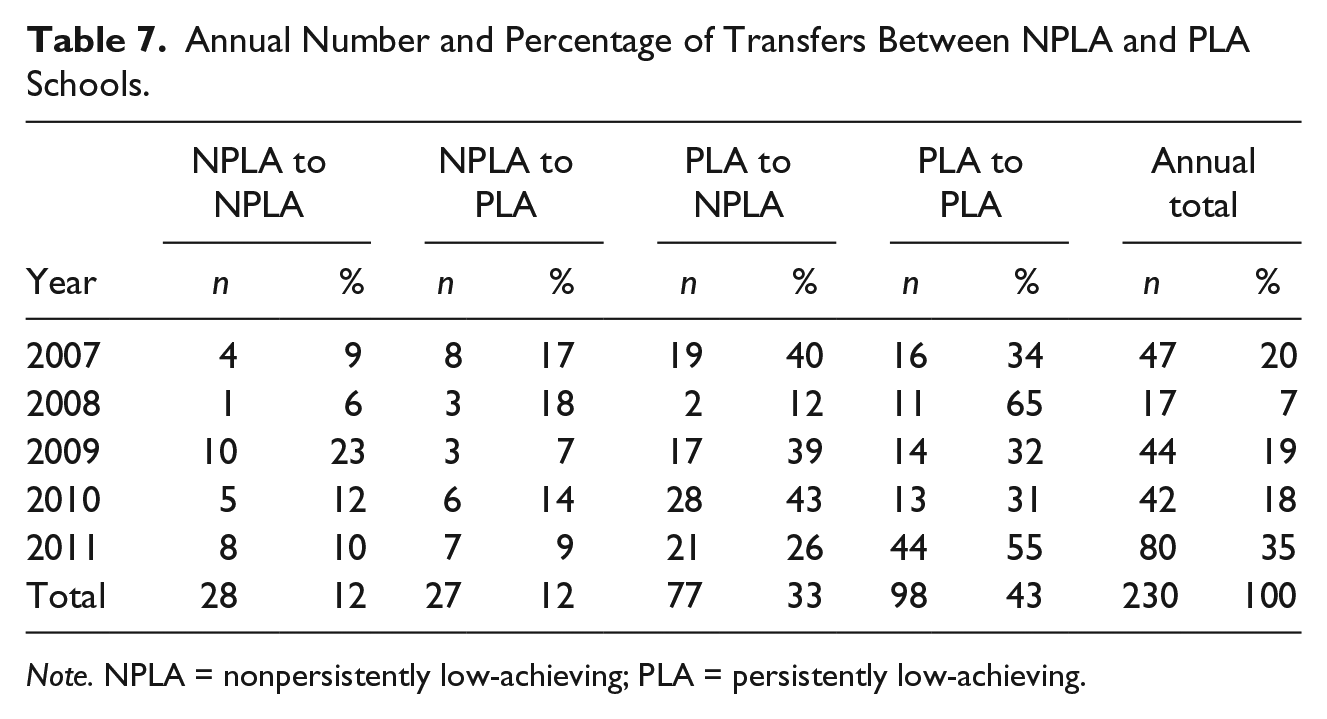
Note. NPLA = nonpersistently low-achieving; PLA = persistently low-achieving.
Teacher Employment and the Turnaround Model Mandates
Although comparisons of total teacher employment indicators revealed differences between NPLA and PLA schools, the implementation of turnaround model mandates could bias the results. Transfer rates at PLA schools should exceed those at NPLA schools during this time period due to sanctions requiring PLA schools to replace 50% of teaching faculty working in the 2010 PLA cohort schools. However, it is important to discern whether and how the personnel requirements of the turnaround model influenced teacher employment patterns in the ecosystem of schools. To investigate how personnel requirements altered teacher employment patterns in the HSD population of schools, we further examined teacher employment patterns by the longitudinal distribution in NPLA and PLA schools.
Examination of the teacher transfers in 2011 revealed differences with prior years in both the origin and destination (Table 8). As a result of the personnel replacement policy, teacher transfers from PLA schools in 2011 demonstrated a dramatic increase, accounting for 37% of all teachers who transferred from a PLA school between 2007 and 2011. Although not as large as PLA schools, NPLA schools also demonstrated an increase in the percentage of teachers transferring from their schools in 2011. The rate of transfers to both NPLA and PLA schools increased in 2011, garnering 27.6% and 40.8% of the totals, respectively. For NPLA schools, this rate demonstrated a modest increase over prior years, whereas PLA schools experienced a gain of more than 20% over any prior year.
Comparison of Annual Percentages of Teacher Employment Status in NPLA and PLA Schools.
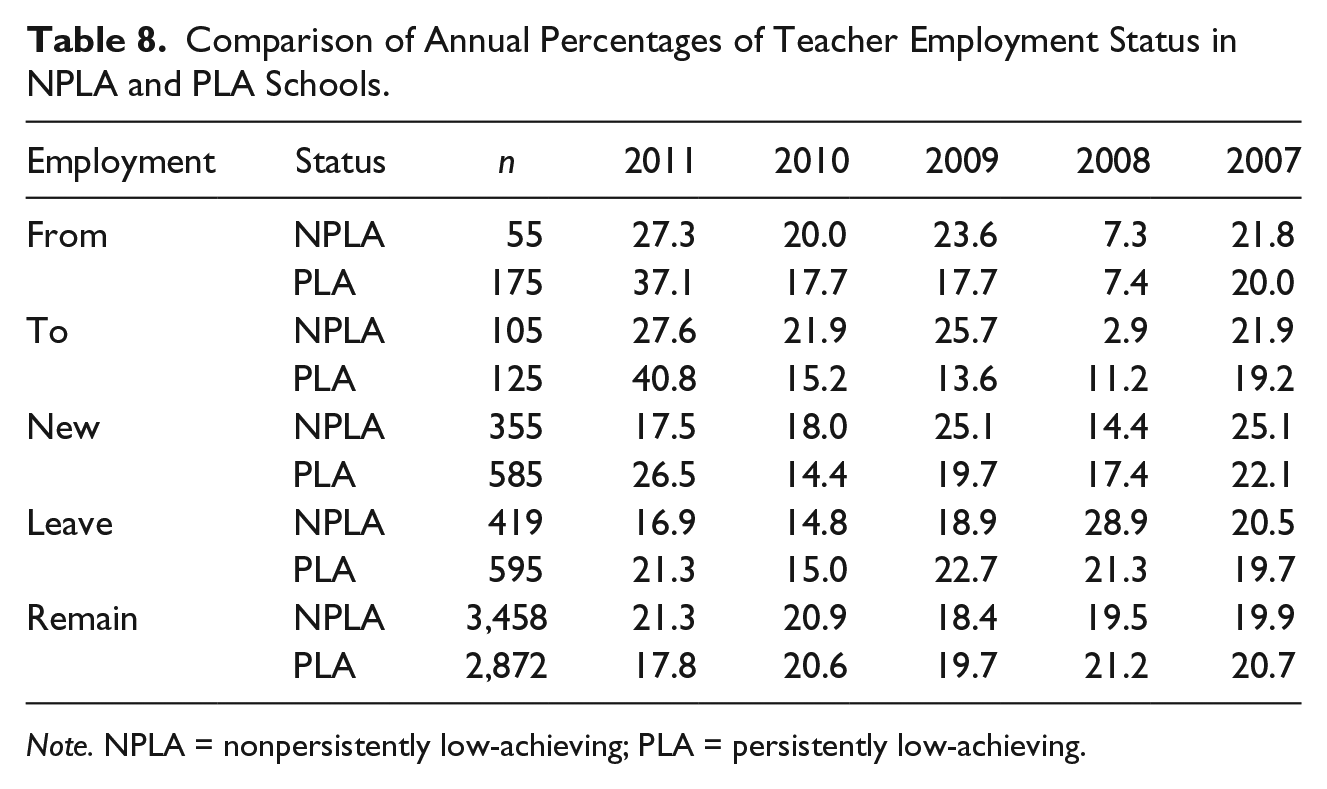
Note. NPLA = nonpersistently low-achieving; PLA = persistently low-achieving.
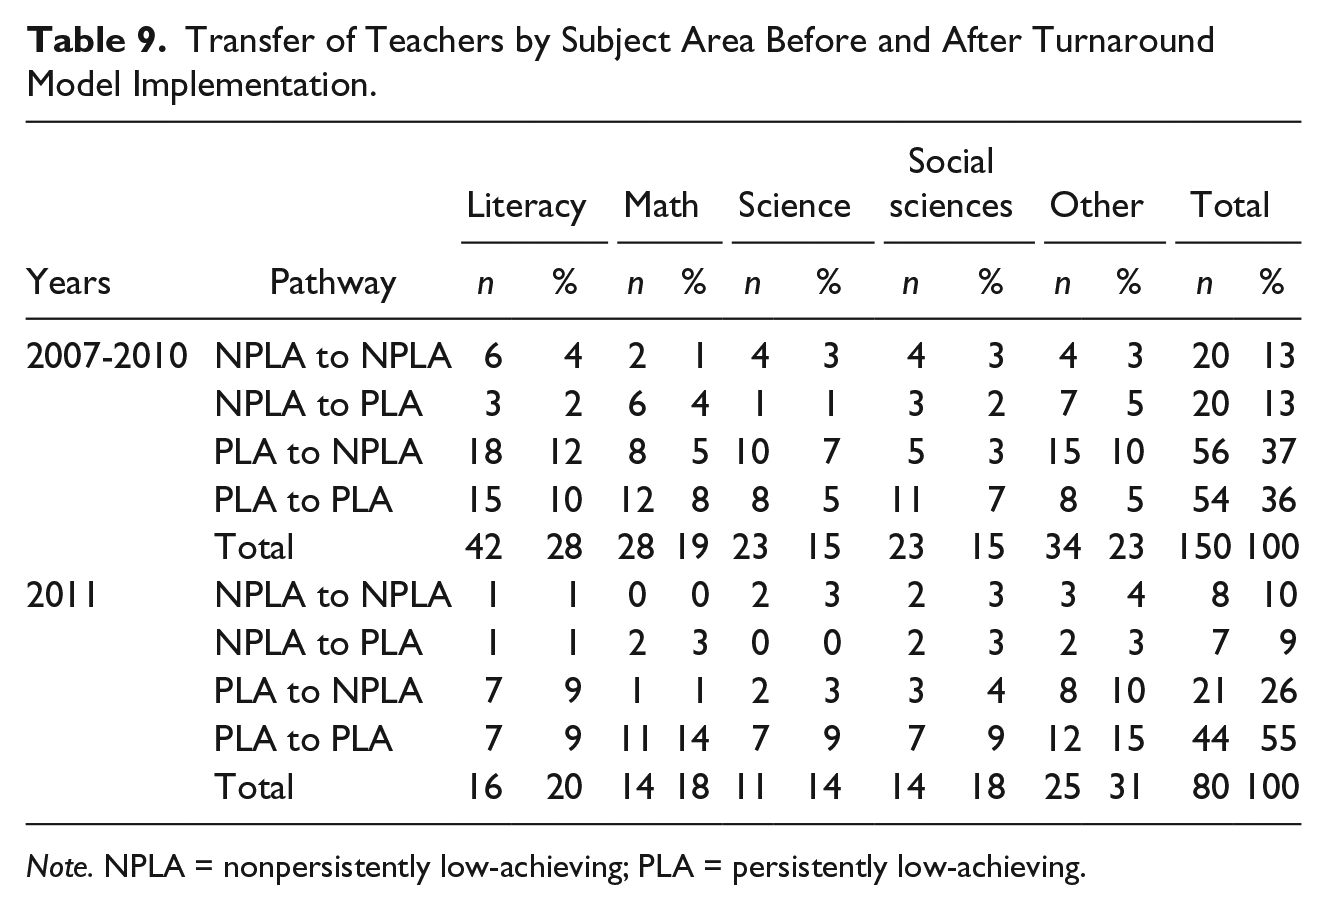
Comparison of the subject areas of teacher transfers also demonstrated differences before and after the implementation of the personnel replacement policies. Between 2007 and 2010, literacy teachers transferred the most often, constituting 28% of the 150 transferring teachers (Table 9). During this same time period, teachers in nontested subject areas ranked second and math teachers third, accounting for 23% and 19% of the sample, respectively. In contrast, the largest group of teacher transfers in 2011 specialized in nontested subject areas, constituting 31% of the 80 transfers. Literacy teachers ranked second, accounting for 20% of the 2011 transfers, with math and social science teachers both at 18%, with science constituting just 15%.
Transfer of Teachers by Subject Area Before and After Turnaround Model Implementation.
Note. NPLA = nonpersistently low-achieving; PLA = persistently low-achieving.
Discussion and Conclusion
Before discussing our conclusions, we caution against the possible overinterpretation of the available data. First, we cannot make any pejorative statements about the patterns of teacher employment. The available data did not indicate the reasons for departures or selections, nor did the data provide any evidence as to the quality of the teaching sample. For instance, we did not know whether a departure was voluntary nor the leaving teacher was effective. Thus, we attempt to limit our conclusions and implications to evidence provided by the patterns of teachers.
Assessing the results with disparate assumptions proves a useful exercise because of the lack of qualitative data pertaining to teachers in the sample. For instance, consider whether all of the teachers who migrated after the turnaround model and personnel replacement policy were low-quality teachers who received involuntary transfers. The extensive movement of teachers perceived to be ineffective from PLA schools to other PLA schools would seem to contradict the purpose of the policy, as well as put high-needs schools at further risk. However, consider the converse of the prior assumption: All transfers were high-quality teachers who voluntarily transferred. The loss of high-quality teachers in PLA schools is possibly offset by the migration of the majority of these teachers to other PLA schools. Unfortunately, even a modest migration of teachers to NPLA schools again seems to contradict the purpose of the policy and jeopardize the future of PLA schools. Yet, even if we make an assumption of normal distribution of the teacher characteristics in the sample, the unequal migration of teachers still challenges the effectiveness of the personnel replacement policy embedded within the turnaround reform.
A further challenge to the policy emerged from the 2011 reading and math results. The PLA schools’ 2011 gains in the percentages of students earning proficient marks on state administered accountability tests exceeded the gains of their NPLA counterparts, yet the mean of the PLA schools remained below that of NPLA schools. However, the transfers to PLA schools in 2011 consisted of 44 from PLA schools and only seven from a NPLA schools. Again, these reading and math gains challenge the influence of the personnel replacement policy because they occurred with teacher rosters composed of teachers who previously worked in a PLA school.
Adaptation of the population ecology model of Hannan and Freeman (1977) to a population of schools enabled us to explore how resources (teachers), organizations (schools), and the population (district) were associated with ecological disruption (personnel replacement policy). The personnel replacement policies appeared to reinforce, and in some cases intensify existing patterns in teacher selection, retention, and matriculation. Obviously, the mandates of the personnel increased the rates of teacher transfers from PLA schools in 2011. Despite the identification of PLA schools relying upon reading and math performance, teachers in nontested subject areas accounted for the greatest number of transfers in 2011. The educational reform might have created a disruption that altered the supply and composition of teacher transfers but did not necessarily satisfy the needs or create an advantage for PLA schools.
At the population level, the evidence suggested that disruption of the teacher supply and the differential migration of teachers expanded the competitive and performance gaps between PLA and NPLA schools. Hannan and Freeman’s (1977) extension of Gause’s (1934) “principle of competitive exclusion” helps explain how the dynamics of organizational niches possibly accounted for the ways in which personnel replacement requirements reinforced, rather than altered, detrimental teacher employment patterns in NPLA and PLA schools. The authors wrote,
According to this principle, no two populations can continuously occupy the same niche. Populations are said to occupy the same niche to the extent that they depend on identical environmental resources. . . . The broad conclusion is that the greater the similarity of two resource-limited competitors, the less feasible is it that a single environment can support both of them in equilibrium. (Hannan & Freeman, 1977, p. 943)
NPLA and PLA schools relied on and competed for the limited resource of quality teachers. In addition, the discrepancies among the academic and nonacademic indicators suggested that PLA schools maintained a greater set of needs, which possibly made them more vulnerable during environmental challenges or disruptions than their NPLA counterparts.
Implications and Recommendations
Results and conclusions drawn from this analysis provide a basis for recommendations to educators, researchers, and policymakers. Yet, three limitations of this study require consideration prior to implementation of these recommendations. First, the limited time frame and sample size challenge the external validity of the study. However, the continuation of the Title I SIG policies enables researchers to further explore whether the discovered patterns manifest in different areas and at different points of time. Second, limitations in the collection of teacher employment data hinder our understanding about the quality of the teachers who remained, left, and transferred. As Guarino et al. (2006) suggested, future research on teacher attrition and retention might follow the lead of Jacob et al. (2012) to collect a richer data set on teacher employment patterns. Third, the lack of a fully specified ecological model increases chances that observed differences in teacher migration between PLA and NPLA schools resulted from unobserved ecological differences. To enhance such studies, researchers might include a wider range of ecological factors, such as school climate, funding, and others.
Given the limitations and findings, we recommend state and district administrators and policymakers consider the ecological impact of school reforms prior to implementation. By conceiving of districts, cooperatives, and regions as bounded ecologies, leaders and policymakers might prevent certain unintended consequences for schools not facing sanctions or reforms, or those vulnerable to disruptions caused by the reforms. Because the principles of population ecology predict that a single environment cannot support two groups of competitors for the same resources, leaders and policymakers might artificially manufacture distinct niches based upon the needs of schools. For instance, teaching loads and other such incentives might be differentiated by schools. Thoughtful construction of the teacher incentives offered by each niche could lead to a more equitable distribution of teacher quality, attrition, and retention.
For researchers interested in policy effects, we suggest they utilize the population ecology framework to further investigate how reforms affect populations of schools and not just individual schools. For instance, we limited this study to teacher transfers within a single district, but future researchers might utilize the framework to follow a larger region or the movement of other types of educators. In addition to collecting richer quantitative data sets, we suggest researchers conduct qualitative studies of teachers and principals affected by such policies. Knowledge about how administrators and teachers formed decisions could inform understanding of the development of teacher migration patterns. Finally, as reforms likely affect more than just the targeted schools, we encourage researchers to conceive of research questions and methods that extend beyond the effects of individual students and schools at a single moment of time. For instance, do the effects of elementary school turnarounds efforts benefit middle and high schools? Do dramatic school improvements on state administered tests translate into more students better prepared to enter the collegiate or workforce ranks? By conceiving and conducting such studies, researchers might better identify reforms that benefit all students and schools.
Footnotes
Declaration of Conflicting Interests
The author(s) declared no potential conflicts of interest with respect to the research, authorship, and/or publication of this article.
Funding
The author(s) received no financial support for the research, authorship, and/or publication of this article.