
Abstract
In the United States, researchers have documented persistent racial disparities in school funding for decades. Drawing on evidence from a recent policy change in Pennsylvania, this article contributes to research on the role of state governments in limiting or expanding racial disparities in K-12 education funding by examining differences in the racial composition of school districts positively and negatively impacted by a technical provision lawmakers inserted into a newly created formula for distributing state equalization aid. We find that negatively-impacted districts enroll a substantially higher number of Black and Latinx students, receive less state aid, have lower levels of state and local funding, and have lower spending levels than positively-impacted districts with otherwise similar financial needs. These findings suggest how state lawmakers can exacerbate racial inequities when pursuing reforms ostensibly focused on equity, and these results have implications for both policymakers and educational leaders focused on racial justice.
Federal, state, and local governments do not explicitly consider the race of students when they distribute funds for elementary and secondary education. This does not mean education funding is racially neutral, however. A number of studies have documented disparities in education funding between majority-non-student of color and majority-student of color school districts (Baker & Green, 2005; Baker et al., 2020; Carey, 2004; EdBuild, 2019; Stiefel et al., 2005). According to one estimate, predominately non-student of color, high-poverty school districts received, on average, $23 billion more in education funding than predominately student of color, high-poverty districts during the 2015 to 2016 school year (EdBuild, 2019). Examining trends between 1999 and 2013, Weathers and Sosina (2019) and Sosina and Weathers (2019) found that increases in racial segregation are associated with increases in racial disparities in school district revenue and expenditures.
Increases in state education aid to school districts can help address these disparities. One recent study found that changes to state education funding systems precipitated by school finance litigation between 1996 and 2011 helped reduce racial disparities in funding (Rothbart, 2020). Several national studies have found that court-ordered school finance reforms have positively impacted a range of educational outcomes as well, including graduation rates (Candelaria & Shores, 2019; Jackson et al., 2016), standardized test scores (Lafortune et al., 2018), and future adult earnings (Jackson et al., 2016).
Yet, not all changes to state education funding policies promote equity. Researchers have shown that policies enacted by state legislatures can actually exacerbate funding inequities, even when these policies are ostensibly designed to equalize resources (Baker & Corcoran, 2012; Baker & Green, 2005; Chellman, 2008; Stiefel et al., 2005). Even with court-mandated school finance reforms, the context of how each state legislature reacts to a court ruling can shape its effects. As Baker and Welner (2011) explained, “Each state legislature is going to respond differently to a court order. Some will act in good faith; others will balk. Some may respond by raising the overall level of funding but forgoing improvements to equity across different groups of children” (p. 2380).
This article provides a case study of a recent school funding policy change described by lawmakers as an effort to make education funding more equitable. Case studies are particularly useful for analyses of school funding given wide variation in education funding policies across states and inconsistencies that can emerge in federal reporting of state data (Hornbeck & Malin, 2019; Knight & Mendoza, 2019). Specifically, this article investigates a 2015 change to Pennsylvania’s school funding policies that accompanied the adoption of a new formula for distributing state equalization aid to school districts based on student and district need. 1 When lawmakers created this new formula, they also included a technical provision (called a “hold harmless” provision) limiting the amount of state equalization aid actually distributed according to the new formula’s weights and multipliers. In 2017 to 2018, less than 10% of the state’s equalization subsidy was distributed through this new formula as a result of this provision.
We use a counterfactual approach to investigate differences in the racial composition of school districts positively and negatively impacted by the limit lawmakers placed on their new funding formula. To complete our analysis, we first compared the amount of equalization aid each district received in 2016 to 2017 with the amount of equalization aid districts would have received if lawmakers had not added this hold harmless provision. From this process, we identified negatively-impacted districts that are receiving less equalization aid because of the limits placed on the new formula and positively-impacted districts that are receiving more equalization aid because of the limits placed on this formula. Next, we examined the racial composition of these negatively-impacted districts, relative to positively-impacted districts with otherwise equivalent levels of financial need according to the new formula. Empirically, our main model used entropy balancing to compare the racial composition of these districts, a multivariate reweighting technique that allows us to avoid problems of multicollinearity and common support that can emerge with a regression-based approach (Hainmueller, 2012).
Our results suggest that districts negatively impacted by the limits placed on Pennsylvania’s new funding formula educate a disproportionately high share of Black and Latinx students in the Commonwealth of Pennsylvania, relative to positively-impacted districts with otherwise equivalent financial needs. To further contextualize this finding, we also consider patterns in total per pupil revenues and expenditures. Not only do our results suggest that negatively-impacted districts educate a disproportionate share of Black and Latinx students, we also estimate that these districts had lower per pupil revenues and expenditures than positively-impacted control districts. Across models, these results are statistically significant and cannot be explained by factors shaping the fiscal need of school districts, such as student poverty, the capacity of districts to generate local revenue from property values, or taxing effort by district residents. These results are robust to alternative estimation techniques.
The article begins by discussing existing research on racial inequities in school funding and state educational policies. Next, we discuss the Pennsylvania policy context. We then discuss our methods and results, and we conclude by discussing the implication of our results for both the design of school finance reforms and the role school leaders can play in shaping their impact.
Background on Racial Disparities in School Funding
This study contributes to research on racial inequities in school funding, school funding reform, and the role of state policymakers in shaping racial disparities in American public schools.
Racial Inequities in School Funding
K-12 education finance policies in the United States are ostensibly “colorblind”—school funding is a responsibility of state governments, and none of the funding policies adopted by these governments explicitly considers race. However, for decades researchers have documented racial disparities in school funding (Baker & Green, 2005; Baker et al., 2020; Carey, 2004; EdBuild, 2019; Sosina & Weathers, 2019; Stiefel et al., 2005; Weathers & Sosina, 2019). To explain this pattern, scholars often focus on the way racial and economic segregation between school districts can impact inequities in local education funding (e.g., EdBuild, 2019).
The prominent role of local taxation in school funding may explain some of these disparities. A number of federal, state, and local policies facilitated residential segregation in the past and continue to shape segregation in the present (Erickson, 2016; Rothstein, 2018). Indeed, Black and Latinx children live in poorer neighborhoods than White students, on average, even after controlling for family income (Reardon et al., 2015). Further, the relationship between race and residence may impact the ability of local districts to generate revenue through taxation. Biases among local voters also shape the amount of local revenue districts serving large numbers of Black and Latinx students can generate. Past research has shown that districts with voters who are predominately White and elderly will favor less spending on public schools when students in their district are predominately Black (e.g., Ladd & Murray, 2001).
State Policymakers and School Finance Reform
Understanding how state policy changes in Pennsylvania may or may not impact racial disparities in funding can enrich our understanding of the role state policymakers play in mitigating or exacerbating racial inequities in education more broadly. The role of state governments in public education has increased over time, while the role of local school boards has decreased (Fowler, 2000; Henig, 2013; Kirst & Wirt, 2009; Malen, 2003). In some cases, this shift is associated with equity. Fusarelli (2009) argued, for example, that the growing involvement of state governments in education can reduce “inequities in student outcomes” (p. 264). Similarly, increased state support for education is often framed as a solution to inequities in public school funding (Baker & Corcoran, 2012). Indeed, reformers have long insisted that increases in state education funding will promote equity (e.g., Johns, 1973). As Baker and Green (2005) pointed out in relation to racial disparities in school funding, increased state aid is often framed as the implicit solution to funding inequities (p. 375).
Recent work on the relationship between education spending and student outcomes illustrates that previous state-level school finance reforms have, on average, helped to narrow inequities, and improve outcomes. In some states, these reforms were implemented by state legislatures in response to high court rulings. In other states, they were the result of legislative activity alone (Lafortune et al., 2018). Studies of these reforms have found that they narrowed racial funding gaps (Rothbart, 2020), improved graduation rates (Candelaria & Shores, 2019; Jackson et al., 2016), increased standardized test scores (Lafortune et al., 2018), and even positively impacted long-term outcomes such as future adult earnings (Jackson et al., 2016).
Not every state-level education policy change represents an equity-promoting reform, however. A number of studies have also shown that the increased role of state governments in education can exacerbate and entrench existing inequalities. This pattern has been identified, for example, in studies of state policies impacting students of color with a disability (e.g., Tabron & Ramlackhan, 2019), students with an English learner designation (e.g., Sampson, 2019), and the school closure process (e.g., Wilson, Bentley et al., 2019). Similarly, researchers have shown that state policies can create or exacerbate existing funding inequities (Alemán, 2007; Baker & Corcoran, 2012). Indeed, a handful of studies have even documented racial disparities in the distribution of state aid that is ostensibly designed to equalize education funding (Baker & Green, 2005; Chellman, 2008; Stiefel et al., 2005). These inequities can be created through what Baker and Green (2005) call “tricks of the trade” (p. 375). This study builds on this work by exploring how policymakers can implement one of these tricks of the trade. Given the potential for state funding policy changes to both ameliorate and create inequities, it is important for researchers to explore detailed examples from specific states to help inform the work of policymakers and school leaders who aim to reduce racial inequities in the distribution of educational resources.
Pennsylvania’s Fair Funding Formula
In 2016, the Pennsylvania General Assembly passed legislation that was subsequently signed by Governor Tom Wolf creating a new funding formula for the distribution of state equalization aid to school districts. The creation of the new formula was accompanied by an infusion of state funding—a $1.9 billion increase in state appropriations for education over a 4-year period. 2 State equalization aid in Pennsylvania, once called the Equalized Subsidy for Basic Education and now referred to as Basic Education Funding, is the largest source of state support for school districts and “the largest single line-item appropriation in the entire state budget” (Pennsylvania School Boards Association, 2015, p. 6). Historically, the funds have been used to help equalize funding between school districts (Cronk & Johnson, 1983; Harris, 1978). In recent years, however, policymakers stopped using a systematic need-based formula to distribute these funds (Galbally, 2016).
Branded the Fair Funding Formula by state policymakers, this new formula for distributing equalization aid has been described as an equity-based reform by members of both political parties in Pennsylvania (Rodgers, 2016). One state official, for example, described it as a “fair, equitable formula for allocating state funds” that, along with increased state funding, would “help to ensure that all students are getting equitable access to a quality public education—regardless of their zip code” (Galbally, 2016, para. 7). The passage of the reform was subsequently cited by the legislature in an effort to justify the dismissal of an ongoing school funding lawsuit in the state, fitting a pattern for legislative school finance reforms described in the school finance reform literature (Lafortune et al., 2018).
The new formula includes weighted adjustments and multipliers for costs outside the control of local officials. Weighted adjustments for the following student characteristics were incorporated into the formula: student poverty, English language learner status, and charter school enrollment. Local districts make tuition payments to each charter school enrolling students from the district, hence the inclusion of the charter weight in the formula (24 P.S. § 25-2502.53). District-specific factors included in the formula are derived from three indices designed to capture diseconomies of scale, differences in the income of district residents, differences in the property wealth of districts, and differences in taxing effort (24 P.S. § 25-2502.53). In addition, lawmakers in Pennsylvania also included a “hold harmless” provision in the new formula. The provision stipulates that only money appropriated by the General Assembly above and beyond 2015 levels would be distributed through the formula. In other words, every district would continue to receive at least the same amount of money they received before the passage of the formula, without regard to their financial needs (24 P.S. § 25-2502.53). During the 2017 to 2018 school year, this meant that only 7.6% of state equalization aid was distributed through this new funding formula. The remainder of state equalization aid was not distributed in relation to need but historical precedent.
Methods
Data
We used publicly-available, district-level data from the Pennsylvania Department of Education (PDE) for the 2016 to 2017 school year. Our data are from three files available on Commonwealth websites: historical subsidy files, annual financial report files, and district fast facts files. The historical subsidy files provide data on how the state’s equalization subsidy was distributed and the student and district characteristics considered by the state when adjusting the distribution of aid through the new funding formula. This file provides the covariate data described below. Annual financial report files provide data on total revenues and expenditures for each school district in 2016 to 2017. The district fast facts files provide data on the racial composition of each school district in the state.
Analytic Approach
As a result of the limits placed on the amount of funding distributed through the state’s new funding formula, some Pennsylvania districts are receiving less state equalization aid than they would have if lawmakers had not included a hold harmless provision. To investigate racial disparities in the way districts have been impacted by the decision to incorporate this feature into the state’s new formula, our analysis compares the racial composition of districts receiving less aid because of the limits placed on the new formula with control districts that have similar levels of financial need but have not been negatively impacted by the limits placed on the state’s new formula.
Identifying Districts Receiving More or Less Equalization Aid Because of Hold Harmless Provision
We first identified districts negatively impacted by the limits placed on the state’s new formula by comparing each district’s actual equalization subsidy (AES) with the equalization subsidy they would have received if lawmakers had not placed limits on their new funding formula through a hold harmless provision. We call the latter amount each district’s formula-adjusted subsidy (FAS).
Actual equalization subsidy
Under the new funding formula, each district’s actual state equalization aid is split between aid distributed through the new formula and aid not distributed through the new formula because of the hold harmless provision. The equalization aid that is not distributed through the formula is called the base allocation (BA). The equalization aid that is distributed through the state’s new formula is called the student-weighted distribution (SWD).
Base allocation
Each district’s BA is equivalent to the 2014 to 2015 equalization subsidy they received from the state. This amount was not necessarily based on 2014 to 2015 enrollments, student characteristics, or district characteristics. Large portions of the state’s equalization subsidy have been subject to hold harmless provisions since the 1990s, and the 2014 to 2015 appropriation was not distributed through a formula (McCorry, 2016).
Student weighted distribution
The equalization aid that is distributed through the state’s new funding formula is called the student-weighted distribution. These funds are distributed to districts on a per need-adjusted pupil basis (NP). To calculate each district’s student weighted distribution, the state first generates each district’s NP based on weights and multipliers from the new formula. These weights and multipliers adjust each district’s pupil count to account for need. Each district’s NP is calculated by applying an adjustment for:
district size and sparsity (through a sparsity size index that serves as a multiplier)
student poverty (through three poverty weights for poverty, acute poverty, and concentrated poverty within a district)
charter school enrollments for which districts are financially responsible for (through a weight)
enrollments of students with an English learner designation (through a weight)
the income of district residents (through a Median Household Income Index that serves a multiplier)
local taxing effort (through a Local Capacity Index that serves as a multiplier).
Each district’s NP is reported in state files. After calculating each district’s NP, the state determines how much equalization aid to distribute per NP statewide. The state determines this amount by dividing the total appropriation of equalization aid not subject to hold harmless by the total NP of the entire state. In 2016 to 2017, this amount was approximately $120.52 per NP.
Formula-adjusted subsidy
If the hold harmless provision did not limit the use of the new funding formula, the state would divide the entire appropriation for equalization aid (not just the amount not subject to hold harmless) by the total NP of the state. In 2016 to 2017, this amount would have been $2,015.95 per NP. District i’s formula-adjusted subsidy can then be calculated as:

Identifying positively and negatively impacted districts
Using AES values reported for each district and FAS values calculated using the formula above, we can identify districts that receive less equalization aid than they would without the hold harmless provision. If district i is negatively impacted, then:

Similarly, we can identify districts receiving more equalization aid than they would without the hold harmless provision. If district i is positively impacted, then:

Entropy Balancing
Districts are not randomly assigned to receive more or less equalization aid because of the limits placed on the state’s new funding formula. To compare the racial composition of negatively impacted districts with positively impacted districts that have similar levels of financial need, we used a multivariate reweighting technique from the matching literature. Specifically, our main model uses entropy balancing (Hainmueller, 2012). Entropy balancing uses a maximum entropy algorithm to generate weights that satisfy a set of predetermined balance conditions. These weights are created to produce “control” cases balanced along sample moments (mean, variance, skew) for all covariates prespecified by researchers. Some researchers describe entropy balancing as a doubly-robust improvement of traditional propensity score matching techniques (Zhao & Percival, 2017). Since propensity scores are generated through regression techniques, they can be sensitive to model specification. In some cases, propensity score matching can increase imbalance and produce biased estimates (King & Nielsen, 2019). Entropy balancing, in contrast, reduces model dependence and has been proposed as a desirable alternative to propensity score matching (Hainmueller, 2012; Zhao & Percival, 2017). By using a reweighting scheme, entropy balancing does not require researchers to discard cases to achieve balance. Further, the estimation of treatment effects through entropy balancing can alleviate concerns about multicollinearity since the reweighting procedure orthogonalizes the covariates in relation to the treatment indicator (Neuenkirch & Neumeier, 2016).
Covariate selection
To compare the racial composition of negatively-impacted districts with positively-impacted control districts with similar levels of need, we use entropy balancing to reweight our control districts along all student and district characteristics included in the state’s new funding formula. These characteristics impact the financial needs of school districts and the capacity districts possess to generate revenue through local taxes. These characteristics include:
the enrollment size of each district and the sparsity of the district, as captured in the state’s Sparsity-Size Index described in further detail in the Appendix;
each district’s property values, the income of its residents, and the effort local residents put into raising local tax revenue to pay for education, as measured in the state’s Local Effort Capacity Index and Median Household Income Index described in detail in the Appendix;
the proportion of students in poverty enrolled in a district, as reported by the state for each district and used in the new formula;
the proportion of students with an English learner designation in each district as reported by the state;
and the proportion of students enrolled in charter schools for which the district is financially responsible as reported by the state.
All of these variables are from the same file used by the state to determine each district’s final need-adjusted pupil count for the 2016 to 2017 distribution of equalization aid not subject to hold harmless. In using the state’s version of these student and district characteristic variables as our covariates, we prevented differences between the way the state’s formula measures certain characteristics and the way other data sources might measure these characteristics from impacting our results. For parsimony, all measures are described in greater detail in Appendix Table 1.
Conceptually, this approach allows us to compare the racial composition of negatively-impacted districts with a control group of positively-impacted districts that, according to the new formula adopted by lawmakers, have equivalent financial needs. These covariates also reflect generally accepted factors school finance scholars typically control for when examining the equitable distribution of education funding (e.g., Baker, 2018). We also included robustness tests to account for remaining factors identified by scholars that may impact cost differences between districts but were not included as adjustments in Pennsylvania’s new formula. The covariates used in these analyses are described in our discussion of robustness tests.
Assessing covariate balance
To confirm that we created a control group of positively-impacted districts sufficiently similar to negatively-impacted districts, we examined the absolute standardized differences in means. While there are multiple standards that exist within the causal inference literature for establishing when two groups are sufficiently similar to warrant comparison (Stuart, 2010), we use the definition for baseline equivalence without statistical adjustment (absolute standardized mean difference < .05) for quasi-experiments adopted by the Institute of Educational Sciences (IES) in Procedures Handbook Version 4.0 from the What Works Clearinghouse (WWC, 2017).
Examining differences in racial composition
After achieving equivalence along all covariates, we compared differences in the racial composition of negatively-impacted districts and our control group of reweighted positively-impacted districts with otherwise equivalent levels of need. In making this comparison, we calculated an average treatment effect on the treated (ATT) using the proportion of students in each district identified as Black or Latinx by the state as our effect variable. We performed all calculations in R using the ebal, WeightIt, and Survey packages to generate balancing weights, incorporate those weights into the calculation of an ATT in a generalized linear model, and calculated robust standard errors to account for the use of those weights (Hainmueller, 2012; Robins et al., 2000).
To further contextualize these results, we also calculated ATT estimates to compare differences in total per pupil state revenues, combined per pupil state and local revenues, and total per pupil expenditures between the otherwise equivalent districts in our balanced sample. As a robustness check, we recalculated these ATT estimates using weights from covariate balancing propensity scores (Imai & Ratkovic, 2014) and weights from propensity scores generated through generalized boosted models (McCaffrey et al., 2004).
Results
Descriptive Results
We begin by reporting descriptive statistics quantifying the fiscal impact of the limits placed on the state’s new funding formula. Table 1 displays these results. In total, 149 school districts received fewer dollars in state equalization aid as a result of the hold harmless policy than they would have received had the formula been fully implemented (“negatively-impacted districts”). These districts received $1.1 billion less in state equalization aid because of the policy. These negatively-impacted districts enrolled 51% of all students in Pennsylvania public schools in 2016 to 2017. The other 49% of students enrolled in Pennsylvania public schools in 2016 to 2017 attended school districts that were not negatively impacted by the decision to limit use of the new formula.
Characteristics of Districts Positively and Negatively Impacted by Limits Placed on New Funding Formula.
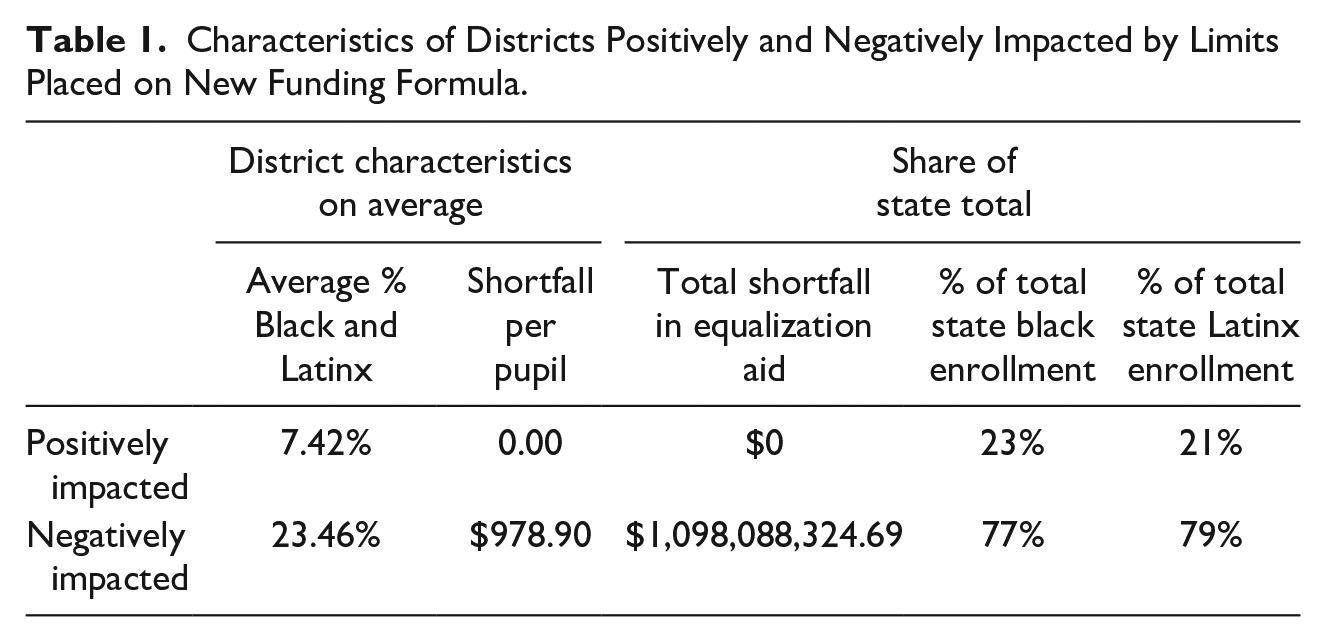
Although school districts that were negatively impacted by the limits placed on the state’s new funding formula enrolled a similar share of the state’s total student population, the students enrolled in negatively-impacted districts were disproportionately Black and Latinx. Indeed, 77% of all Black students enrolled in public schools in Pennsylvania attended school in a negatively-impacted district in 2016 to 2017. In addition, 82% of all Latinx children in the state attended a district that received less equalization aid because of the limits incorporated into the state’s new formula. In total, negatively-impacted districts enrolled 79% of all Black and Latinx Pennsylvania public school students in 2016 to 2017.
Entropy Balancing Results
We achieved balance along all covariates and met the requirements for baseline equivalence without statistical adjustment proposed by IES. The absolute standardized mean difference for all covariates was <0.001, far below the proposed 0.05 threshold from IES.
Table 2 reports ATT estimates from the main model investigating differences in the racial composition of negatively-impacted districts, relative to our positively-impacted control districts. Row 1 reports ATT estimates for Black and Latinx enrollment differences between negatively-impacted and control districts with equivalent fiscal needs according to the new formula. These results reveal large differences in the racial composition of districts negatively impacted by lawmakers’ policy limiting the state’s new funding formula. On average, Black and Latinx enrollments are 18.53 percentage points higher in districts negatively impacted by this policy, relative to otherwise equivalent districts that have not been negatively impacted by the hold harmless provision.
ATT Estimates for Positively and Negatively Impacted Districts.
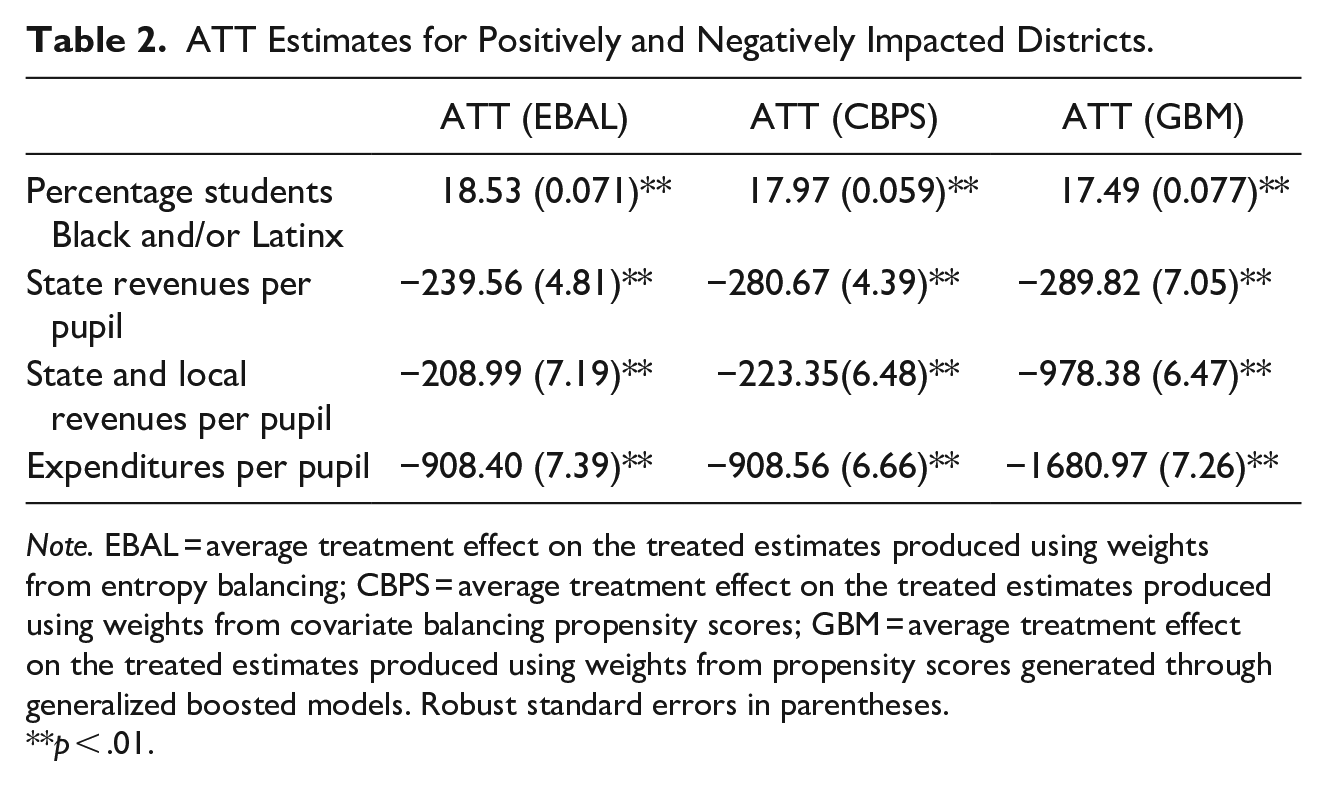
Note. EBAL = average treatment effect on the treated estimates produced using weights from entropy balancing; CBPS = average treatment effect on the treated estimates produced using weights from covariate balancing propensity scores; GBM = average treatment effect on the treated estimates produced using weights from propensity scores generated through generalized boosted models. Robust standard errors in parentheses.
p < .01.
To help further contextualize these results, row 2 reports ATT estimates for total per pupil state revenues. Unsurprisingly, we estimate that districts negatively impacted by the limits placed on the state’s new funding formula receive $239.56 fewer dollars in state revenue per pupil than otherwise similar districts. Similarly, row 3 reports ATT estimates for total per pupil state and local revenues. Following customary practice among school finance scholars, we focused on total state and local funding rather than total state, local, and federal funding since federal funding is compensatory and typically excluded from equity analyses of school funding distributions (e.g., Verstegen, 2015). Here, we estimate that negatively impacted districts received $208.99 fewer dollars in combined state and local revenues per pupil. These negatively-impacted districts enroll, on average, about 5,400 students. From the perspective of the budget of the average negatively-impacted school district, then, an effect of this size would translate into approximately $1.1 million in combined state and local revenue.
The negative impact of the limits placed on the new formula for these disproportionately Black and Latinx school districts is clearest in ATT estimates for expenditures. Here, we estimate that negatively-impacted districts spent $908.40 fewer dollars per pupil in 2016 to 2017, relative to otherwise equivalent districts that have not been adversely impacted by the limits placed on the state’s new funding formula. The magnitude of these effect estimates, relative to effect estimates for revenue, may partially reflect the difficult financial situation already facing underfunded school districts in Pennsylvania. For many districts in the state, costs have grown much faster than revenues (Pennsylvania Association of School Administrators & Pennsylvania Association of School Business Officials, 2017). While some districts have been able to cover these costs by increasing local tax revenues or reducing spending in other areas, other districts have had to draw on reserve funds and, in some cases, borrow money to balance their budgets (Pennsylvania Association of School Administrators & Pennsylvania Association of School Business Officials, 2017). As a school district leader from Bethlehem Area School District explained in a survey during the 2016 to 2017 school year, “There’s nothing left to cut” (Pennsylvania Association of School Administrators & Pennsylvania Association of School Business Officials, 2017, p. 7). The district received $19,038,496.51 less in state equalization aid during the 2016 to 2017 school year because of the limits placed on the state’s new funding formula.
Additional Robustness Checks
As a robustness check, we recalculated all ATT estimates using two alternate methods. Specifically, we used weights from covariate balancing propensity scores and weights from generalized boosted modeling propensity scores to produce ATT estimates while using the same treatment, outcome, and control variables. Results from these analyses are reported in Table 2 and are consistent with the ATT estimates derived from the main model using entropy balancing.
We also generated ATT estimates using alternative revenue and expenditure figures to account for additional factors that can impact educational costs but were not included in Pennsylvania’s new formula for distributing equalization aid. Specifically, we removed revenue and expenditures connected to special education, construction, and transportation in accordance with methods utilized in other studies of funding distributions (e.g., Verstegen, 2015) and recalculated ATT per pupil expenditure and revenue figures using entropy balancing. These results were again substantively similar—the predominately Black and Latinx school districts negatively impacted by the limits placed on the state’s new funding formula had lower per pupil expenditures and lower per pupil state and local revenues than otherwise equivalent districts that were not negatively impacted.
Discussion
Racial disparities in education funding have been repeatedly documented by researchers, and these disparities can have serious consequences for existing opportunity gaps. Results from this study of a recent school funding policy change suggest that the limits placed on Pennsylvania’s funding formula produced racial disparities in state equalization aid and may have contributed to broader racial disparities in the distribution of education funding in the state as a result. First, our analysis found that the limits policymakers placed on the state’s new funding formula resulted in 149 school districts receiving $1.1 billion less in state equalization aid. We found that 77% of all Black students enrolled in public schools in the state and 82% of all Latinx students enrolled in public schools in the state attend these 149 districts. Second, ATT estimates from our entropy-balanced analysis found that enrollments of Black and Latinx students are 18.53% points higher in districts negatively impacted by this policy, relative to the enrollments of Black and Latinx students in otherwise equivalent districts who have not been negatively impacted by the way lawmakers limited the use of the state’s new funding formula. Based on the covariates used to create our control districts, these disparities cannot be explained by factors that might provide an explanation that is not related to race. These factors include: (a) the sparsity of a school district, (b) the school district’s size, (c) the income of a district’s residents, (d) the property values of a district, (e) the local taxing effort of district residents, (f) student poverty, (g) the enrollment of students with an English learner designation, and (h) the proportion of students enrolled in charter schools for which a district is financially responsible due to the way charter school tuition payments are structured in Pennsylvania. Put differently, these patterns exist after controlling for all the factors lawmakers have deemed acceptable justifications for providing some district more or less state aid based on the weights and multipliers adopted in their new funding formula. Third, we estimate that the predominately Black and Latinx districts negatively impacted by the limits placed on the state’s new funding formula had lower levels of per pupil state funding and lower levels of combined state and local revenues per pupil than otherwise equivalent districts that have not been negatively impacted by this policy. Finally, we estimate that per pupil spending was $908.40 lower in negatively-impacted districts. None of these disparities can be explained by factors lawmakers have deemed legitimate for differential allocations of state funding in their new funding formula. All of these results are robust compared to alternative specifications.
Results from this study have implications for policymakers and school leaders who aim to reduce racial inequities in the distribution of educational resources. Historically, education reformers have advocated for increased state aid as a solution to inequities in school funding (Johns, 1973; Wise, 1972). Recent work on school finance reforms show that state-level reforms of education funding can help to counter the inequitable distribution of education funding and narrow racial funding gaps. At the same time, however, researchers have pointed out how funding inequities can be created and exacerbated by the way state funds are distributed (e.g., Baker & Corcoran, 2012). This study reports results from a state where the reform process resulted in the creation of a new funding formula with a provision that exacerbated racial inequities.
Results from the study suggest how important it is for policymakers to consider carefully the mechanics of aid formulas—in their entirety—when designing and implementing policy changes that purport to make education funding more equitable. In addition, these results suggest the importance of scrutinizing existing policies like those described in this analysis for their differential impact on Black and Latinx students. Although few states have hold harmless policies that apply to as large a portion of state aid as Pennsylvania, these policies are common across states. According to one estimate, 12 states had a hold harmless provisions in 2013 to 2014 while another 22 states had declining enrollment provisions that were conceptually quite similar (Atherton & Rubado, 2014). These policies can support equity for districts experiencing declining enrollments. As Pennsylvania’s case makes clear, however, they can also produce racial disparities. Further investigation by researchers to identify the impacts of these policies in other states is important so that policy changes such as court mandated school finance reforms can help narrow rather than widen racial disparities in education funding.
Finally, this analysis suggests how the policy winners and losers that can be created by changes to state education funding policies can become racialized. In Pennsylvania, some state leaders have acknowledged that the limits placed on the state’s new funding formula are unfair but have maintained that removing the provision would harm the school districts that currently receive more funding because of it (e.g., LNP Editorial Board, 2018). These results suggest that this claim is premised on an indefensible idea: that students of color should receive less funding, on average, than the State’s own funding formula deems fair because closing racial gaps would prevent White students from continuing to receive more funding, on average, than the state’s own funding formula deems fair. For critically responsive leaders who advocate for minoritized communities and students, challenging these kinds of claims can help support policy change and promote equity.
Footnotes
Appendix
Appendix Notes
Declaration of Conflicting Interests
The author declared no potential conflicts of interest with respect to the research, authorship, and/or publication of this article.
Funding
The author received no financial support for the research, authorship, and/or publication of this article.