
Abstract
The National School Lunch Program (NSLP) is a federal program that provides free and reduced priced lunch to millions of low-income children in urban schools. Empirical research shows mixed results on the physical and nutritional health of urban students participating in the program. However, a considerable limitation of this literature is that it focuses on student participation in the NSLP rather than what students consume when they receive a school lunch. By directly collecting a random of sample of school lunches, we analyze the nutritional content of both selected and consumed school lunches (n = 141) at a Title I middle school in a large US city. Results indicated that the food items that students select for school lunch are low in nutrients and high in sugar. Furthermore, food that students ultimately consumed during lunch had even lower nutritional value while consumption of sugar remained high. Future research is needed to investigate school-based interventions that leaders can deploy to foster healthy eating in urban schools.
Introduction
Poor physical health in children is a concerning problem in the United States. Over the past 50 years, obesity rates among children and adolescents have skyrocketed by nearly 300% (Hales et al., 2017; Ogden & Caroll, 2010). The United States has the highest rate of obese and overweight children among industrialized nations (OECD, 2017). American children also tend to consume a considerable amount of food that is deficient in nutrients (Chang & Nayga, 2009; Larson & Story, 2015; Marks, 2015). The potential consequences of these dietary trends appear to be severe. Poor dietary habits during childhood are associated with lower academic achievement (Datar et al., 2004; Gurley-Calvez & Higginbotham, 2010); increased likelihood of disease and physical health problems (Pulgarón, 2013; Ward et al., 2017); and reduced economic productivity in adulthood (Jurgen et al., 2012).
In US cities, schools serving low-income students are considered to have an important role in supporting the physical and nutritional health of children (Ward et al., 2017). Meals provided in schools can offer a consistent source of nutrition and create conditions for students to thrive academically (T. C. Anderson, 2020; Belot & James, 2011; Thompson et al., 2020). The largest school-based nutrition intervention in US cities is the National School Lunch Program (US Department of Agriculture Food and Nutrition Service, 2018). The National School Lunch Program (NSLP) serves nearly 30 million low-income students (i.e., approximately 60% of all students in the public education system), and it represents one of the main federal expenditures on K-12 public education. When the NSLP was enacted in 1946, it emphasized the alleviation of hunger in children. The program has since evolved, undergoing revisions that have placed a stronger concentration on childhood obesity and healthy eating behaviors. In 2010, the Healthy, Hunger-free Kids Act updated the NSLP’s nutritional standards and meal patterns with the aim of reducing childhood obesity and fostering healthy eating habits in children (Johnson et al., 2016; Ralston & Newman, 2015). District and school site leaders are tasked with meeting these nutritional standards to receive reimbursement from the federal government for lunches that they provide (Joyce et al., 2018). Nonetheless, scholars assert that additional work is needed to provide guidance for school leaders on how to maximize the nutritional value of the NSLP (Joyce et al., 2018).
Empirical research is inconclusive on the effects of the NSLP on children’s physical and nutritional health. A number of studies analyzing national data find that participation in the NSLP is related to increased BMI and weight gain in students (Capogrossi & You, 2017; Hernandez et al., 2011; Millimet et al., 2010; Schanzenbach, 2009). Other researchers report reduced obesity (Gundersen et al., 2012) or no association with obesity from participation in the NSLP (Alfonso et al., 2019; Gleason & Dodd, 2009; Smith, 2017). A limitation of this literature is that it focuses on student participation in the NSLP rather than what students consume when they receive a school lunch. A small body of work exploring food intakes finds that NSLP participants consume more sodium and cholesterol than non-participants and that NSLP lunches are lower in nutrients (Campbell et al., 2011; Cohen et al., 2013; Gleason & Suitor, 2003). However, these studies are generally comprised of self-reports of food eaten over a 24-hour period or before-and-after photos of school lunches that may produce imprecise estimates of what students consume at lunch. They also often analyze types of food items that are consumed rather than intakes of nutrients and vitamins. Few studies investigate results for NSLP participants in urban schools (Adams et al., 2022).
This study analyzes the nutritional content that students both select and consume at a Title I middle school in a large city where all students receive free school lunch through the National School Lunch Program. By exploring what students select for lunch, the analyses provide information on the nutritional value of lunches offered to NSLP students in urban schools. The analyses then take an additional step to determine what students actually consume from these lunches, which is critical to understanding the nutritional benefits of school lunches. For the data collection, we randomly chose students’ school lunches (n = 141) for analysis. From these randomly selected lunches, we directly analyzed and recorded consumed food at the close of the lunch period. This direct, real-time approach to data collection allowed for precise recording of food consumed during lunch that is uncommon in the literature. Prior analyses are mostly derived from self-reports and photographs of student lunches. Furthermore, our analyses examine both consumption of specific food items (e.g., pizza, fruit, and vegetables) as well as consumption of nutritional content that the US Department of Agriculture Food and Nutrition Service (2018) deems as essential to track. As a result, this study’s precise analysis of school lunches in an urban Title I school may advance understanding of the actual nutritional intakes students participating in the NSLP. In doing so, it can support school leaders in devising strategies that optimize school lunch for low-income children in urban schools and possibly inform the design of healthy-eating interventions.
Literature Review
Childhood Obesity and Nutritional Health
A healthy diet during childhood is linked to positive physical development (Edwards & Cheeley, 2016), cognitive functioning (DiGirolamo et al., 2020), and behavioral outcomes (Lozoff, 1989). Trends suggest that poor diets and nutrition have become major problems in the United States. In 1970, only 5% of children and adolescents were obese, but since that time, the percentage of children and adolescents that are obese has dramatically risen to approximately 19% (P. M. Anderson et al., 2019). Nearly one-third of American children 2 to 19 years of age are overweight or obese (Ogden et al., 2012). Early reports indicate that childhood obesity worsened during the COVID-19 pandemic (Storz, 2020). Childhood obesity rates vary across subgroups. Boys are more likely to be obese than girls (Govindan et al., 2013). For low-income youth, the obesity rate is 19% and 20% for middle income youth but plummets to 11% for youth of high income backgrounds (Ogden et al., 2018). American children tend to exhibit poor nutritional intakes as well, consuming food that is low in nutrient density (Larson & Story, 2015). Research has further demonstrated that when compared to previous generations, American youth today consume more foods that are low in nutrients and high in saturated fat, trans fats, cholesterol, and added sugar (Marks, 2015). The problems of obesity and poor nutrition are reported to be most severe in urban and rural locales (Johnson & Johnson, 2015).
Scholars have offered different theoretical accounts for the high prevalence of childhood obesity and poor nutrition in the United States (Lang & Rayner, 2007; Lerma-Cabrera et al.,2015; McFerran & Mukhopadhyay, 2013). Researchers have reasoned that genetic factors, such as metabolic defects or fat cell counts, are responsible for high obesity and poor health. Others argue that genetic factors fail to explain rapidly rising rates of obesity and poor nutrition, theorizing that environmental norms and individual behaviors are the primary drivers of growing childhood obesity (Kassem et al., 2003; Sallis & Glanz, 2009). In empirical analyses, studies have identified a combination of genetic, behavioral, and environmental influences although the literature is inconclusive on which of these factors is most prominent (Gurnani et al., 2015). Investigations of twins adopted into different families suggests a link between heritable genes and predisposition to obesity (Loos & Bouchard, 2003). Individual behavioral characteristics, such as self-regulation and the ability to delay gratification, are closely connected to childhood obesity and consumption of food that is low in nutrients (Kassem et al., 2003; Tan & Holub, 2011). Lack of self-control, sedentary behavior, addiction to technology and gaming, and low physical activity also coincide with obesity and poor physical health in youth (Turel et al., 2016).
Among environmental influences, many studies have tied household conditions to childhood obesity (Courtemanche, 2009. Time spent between children and their parents appears to be a significant contributing factor (You & Davis, 2010). P. M. Anderson and Butcher (2006) report that children are more likely to consume snacks, soft drinks, and unhealthy restaurant meals in families with two working parents. Family meals at home tend to have less saturated fat and added sugar and have been found to contain more fresh fruit and vegetables when contrasted with meals eaten outside of the home (Ayala et al., 2008). As a result, some researchers contend that the steady increase in double-income families that has occurred over several decades is associated with obesity and poor nutritional health in children (P. M. Anderson et al., 2003; Courtemanche, 2009). The strength of the association between a parent and child’s body mass index has been shown to have increased over time, offering evidence that environmental factors play a role in explaining the dietary health of children (P. M. Anderson et al., 2007). Broader changes in American food consumption may be affecting childhood obesity and nutritional habits. High-calorie snacks and soft drinks are readily available to youth at a relatively low price (Chang & Nayga, 2009). Fast food now comprises the highest percentage of food consumed for youth when they are outside of their homes while portion sizes for fast food have substantially increased (Chang & Nayga, 2009; Nielsen & Popkin, 2003).
School Nutrition and Healthy Eating Initiatives
Government agencies, national organizations, and community groups have led efforts to reverse poor dietary trends observed in American youth (Goh et al., 2009; Finkelstein et al., 2004). In US cities, school leaders have attempted varying interventions with mixed results, including mentoring programs, information campaigns, health education, and healthy zone initiatives (D’Adamo, 2016; Lent et al., 2014; Moore et al., 2013; Sato et al., 2016). Urban schools are arguably an important setting to cultivate healthy eating among low-income children in US cities (Gonzalez-Suarez et al., 2009; Gortmaker et al., 1999; Lytle et al., 2004). The norms, practices, and programs that school leaders cultivate may serve as significant environmental influences on the dietary health of children. Children spend a large share of their waking hours in school and school policies related to lunch, vending machines, health education, and physical fitness may shape children’s eating behaviors (Fletcher et al., 2010). In the literature on school-based interventions, cafeteria menu changes and alterations to water fountains are associated with small positive reductions in body weight whereas health education has tended to exhibit no effects on students’ physical health (Kerr et al., 2019). In a behavioral-focused intervention in Baltimore, Gortmaker et al. (1999) observed a reduction in fat and saturated fat intakes among low-income African American and Hispanic children. One general finding is that consistent intervention seems to be more effective than short-term efforts (Gonzalez-Suarez et al., 2009).
The National School Lunch Program
In urban schools, the National School Lunch Program is the most widespread initiative aiming to foster healthy eating among low-income youth (US Department of Agriculture Food and Nutrition Service, 2018). To be eligible for free lunch, a student’s household income may be up to 130% of the poverty line; reduced price lunch recipients may be up to 185% of the poverty line (US Department of Agriculture Food and Nutrition Service, 2018). With the passage of the Healthy, Hunger-free Kids Act in 2010, the NSLP program revised school meal standards to place greater emphasis on healthy eating practices and obesity reduction (Ralston & Newman, 2015). The revised 2010 standards require school leaders to increase the availability of fruit, vegetables, whole grains, and fat-free and low-fat milk while simultaneously reducing sodium, saturated fat, trans-fat in school lunches). The effect of these standards on healthy eating during school lunch is unclear.
Empirical analyses of the National School Lunch Program tend to examine associations between program participation and student outcomes (Bhattacharya et al., 2004). Some studies have observed a relationship between NSLP program participation and poorer health outcomes (Capogrossi & You, 2017; Hernandez et al., 2011; Millimet et al., 2010; Schanzenbach, 2009). Two studies examining nationally representative panel data from the Early Childhood Longitudinal Study find that NSLP program participation is related to increased weight gain and higher BMI (Millimet et al., 2010; Schanzenbach, 2009). In one of these studies, Schanzenbach (2009) performs a credible regression discontinuity analysis that uses income-cutoffs to compare NSLP participants to non-participants and finds negative health outcomes for NSLP participants. Other analyses report that program participation is associated with lower obesity (Gundersen et al., 2012) or no change in obesity (Alfonso et al., 2019; Gleason & Dodd, 2009; Smith, 2017). One critical limitation to this prior work is that it focuses on NSLP program participation rather than on what students actually consume when they receive a lunch. Previous research suggests that what is offered at lunch and what ends up being consumed can differ substantially (Buzby & Guthrie, 2002; Cohen et al., 2013).
To derive more adequate estimates of the nutritional value of school lunch, a small body of work has attempted to measure food consumption for NSLP participants. This research is mostly limited by data collection approaches that rely on 24-hour dietary recalls, self-report surveys, and photo analyses that can be prone to social desirability bias and response error (Adams et al., 2022; Cassar, 2018; Cohen et al., 2013). Bergman et al. (2013) used before-and-after photos to compare food consumed between NSLP participants and students bringing lunch from home, observing that NSLP participants consumed healthier lunches than their peers. However, estimates of consumed food can be difficult to discern from photographs alone. Existing studies on student consumption largely investigate food items instead of intakes of vitamins and nutrients. In Boston, Cohen et al. (2013) weighed lunches before and after consumption to estimate food intakes for middle school students receiving lunches designed by professional chefs. The authors reported that inadequate amounts of fiber, vitamins, and calories were consumed during lunch, attributing this result to students being more likely to discard nutrient-dense food items. In spite of improvements in research designs, there is a need for more precise measurement of food items and nutrients consumed by NSLP students.
Methods
Research Design and Setting
In this study, we investigate the nutritional content of selected and consumed food at lunch for students participating in the National School Lunch Program in a Title I middle school located in a large US city. The following question is addressed in this study:
For the analyses, data were collected from a random sample of lunches of sixth-grade students (n = 141) over a period of 10 days in the spring of 2020. The focus on the first year of middle school also marks a key transitional year that is critical to forming healthy eating behaviors (Haerens et al., 2007). At the school site where lunches were collected, all students receive free lunch through the NSLP. Student enrollment in the study setting consists of 722 students (272 students in sixth grade) who are 48% Black, 28% Hispanic, 8% White, 3% Asian, and 13% other race.
Data Collection
Before the start of each lunch period, the nutritional content of each menu item offered to students on that day was recorded. These items included milk, juice, main entrees, and side dishes. The School Lunch Measurement Record, which is an official dietary chart, was used to determine the nutritional content offered to students for each item offered to students. To examine selected and consumed nutritional content in school lunches, 141 school lunches were randomly selected for analysis from a lunchroom of 90 sixth-grade students on 10 school days in early spring of 2020. Prior to collecting information on selected and consumed lunches, an outline of the school cafeteria was created and all available seats within the cafeteria were numbered. A random number generator was used to select the seats that would be observed on a given day. If a student was not sitting at a randomly selected seat, an alternate would be selected by moving to the right one seat or to the left one seat. The first author directly analyzed selected and consumed food by collecting lunch trays and refuse for all students at the close of the lunch period. Because of the short period of time available at the end of lunch, only data from the randomly selected seats were recorded. For randomly selected seats, the first author made note of each item selected, and then, recorded what was consumed and not consumed by the student (e.g., not consumed, one-fourth consumed, half consumed, three-fourths consumed, and completely consumed). While disposing of lunch trays, content in milk and juice containers were checked and a record of the extent that main entrees and side dishes were eaten was also made. The number of lunches that could be observed during a single lunch period was contingent on how long it took to analyze a single plate, which meant that observations varied between 10 and 15 lunches analyzed for each lunch period. Unlike before-and-after photos of lunch trays and 24-hour recalls of consumed food that previous researchers have used to evaluate selected and consumed school lunches, this study’s approach allowed the researchers to inspect directly what was consumed, generating a relatively precise estimate of what was actually consumed by a student.
Measures
School lunch offerings consist of a main meal, juice, milk, and side options. We measured vitamins, nutrients, and other nutritional content emphasized by the Institute of Medicine (2010) and used to generate nutritional standards by the US Department of Agriculture Food and Nutrition Service (2018). These measures of nutritional content are commonly used in child nutrition studies (Adams et al., 2022; Cohen et al., 2013). By drawing on the School Lunch Measurement Record, calories, protein, carbohydrates, fiber, sugar, saturated fat, sodium, cholesterol, total fat, vitamin A, vitamin C, iron, and calcium were recorded for each food and drink item that students selected and consumed (US Department of Agriculture Food and Nutrition Service, 2021). Recorded amounts for sugar are more complex than other nutritional items since sugar is consumed in different forms (e.g., sucrose, glucose, and fructose) and there are debates in the literature about the relative effects of varying forms of sugar on physical health (Te Morenga et al., 2013). Many school food suppliers also do not distinguish between naturally-occurring and added sugar in food items. As a result, total sugar was recorded and compared to the World Health Organization’s (2015) recommended amount for total sugar for children. All sixth-grade students in the study were certified as being from low-families that receive federal assistance through the supplemental nutrition program (SNAP).
Analysis
For each of the randomly selected school lunches, each food item selected by students was recorded. The percentage of students fully consuming, partially consuming, and not consuming the item at all was documented. Subsequently, standard USDA daily requirements for lunch for milk, meat, vegetables, and fruit (US Department of Agriculture Food and Nutrition Service, 2021) were compared to the percentage of students in the sample who consumed any amount of milk, meat, vegetables, and fruit. To analyze the nutritional content of selected food items, total calories, protein, carbohydrates, fiber, sugar, saturated fat, sodium, cholesterol, total fat, vitamin A, vitamin C, iron, and calcium present in each selected food item were noted. The nutritional content of selected food items was then compared to the nutritional content consumed for each food item based on whether the food was fully consumed, partially consumed, or not consumed at all. To examine the total amount of nutritional content selected and consumed, total calories, protein, carbohydrates, fiber, sugar, saturated fat, sodium, cholesterol, total fat, vitamin A, vitamin C, iron, and calcium were added together across different food items. The total nutritional content selected was then subtracted from the total amount consumed for calories, protein, carbohydrates, fiber, sugar, saturated fat, sodium, cholesterol, total fat, vitamin A, vitamin C, iron, and calcium. In the final phase of the analysis, the nutritional content for selected and consumed nutrition was contrasted with recommended nutritional targets for school lunch for middle school students. The percentage of students in the sample meeting these targets for selected and consumed nutrition was also assessed.
Results
Table 1 presents a descriptive breakdown of food and drink items that were selected and consumed for 141 lunches of sixth-grade students. Among milk selections, chocolate milk is selected most, comprising 60% of all milk selections, but it goes completely unconsumed 55% of the time that students select it. White milk is wasted at a higher rate, being selected only 18% of the time and going completely unconsumed 85% of the time that it is selected. These descriptive patterns suggest that even though milk is often selected with a student’s school lunch, most students do not benefit from the vitamins and nutrients in milk because they do not consume it. By contrast, students show a higher intake rate for juice, fully consuming juice 89% of the time. For main meal items, students choose chicken sandwiches or chicken strips most frequently, followed by nachos, pizza, and cheeseburgers/hamburgers. These four items represent approximately 93% of students’ main meal selections during the period of analysis. Students also have the option of selecting two side items with their main meals. The most popular selections are fresh fruit and French fries. Students opt for these two items 18% and 16% of the time, respectively. The USDA (2021) recommends one cup of milk, one ounce of meat/meat alternative, a half cup of fruit, and three-fourths of a cup of vegetables at lunch for middle school students. Yet, 60% of students did not consume any milk. Only 8% of school lunches resulted in the consumption of vegetables and a mere 16% exhibited consumption of any fruit. Only 7% of students’ lunches were fully consumed.
Descriptive Analysis of Meal Selection and Consumption (n = 141).
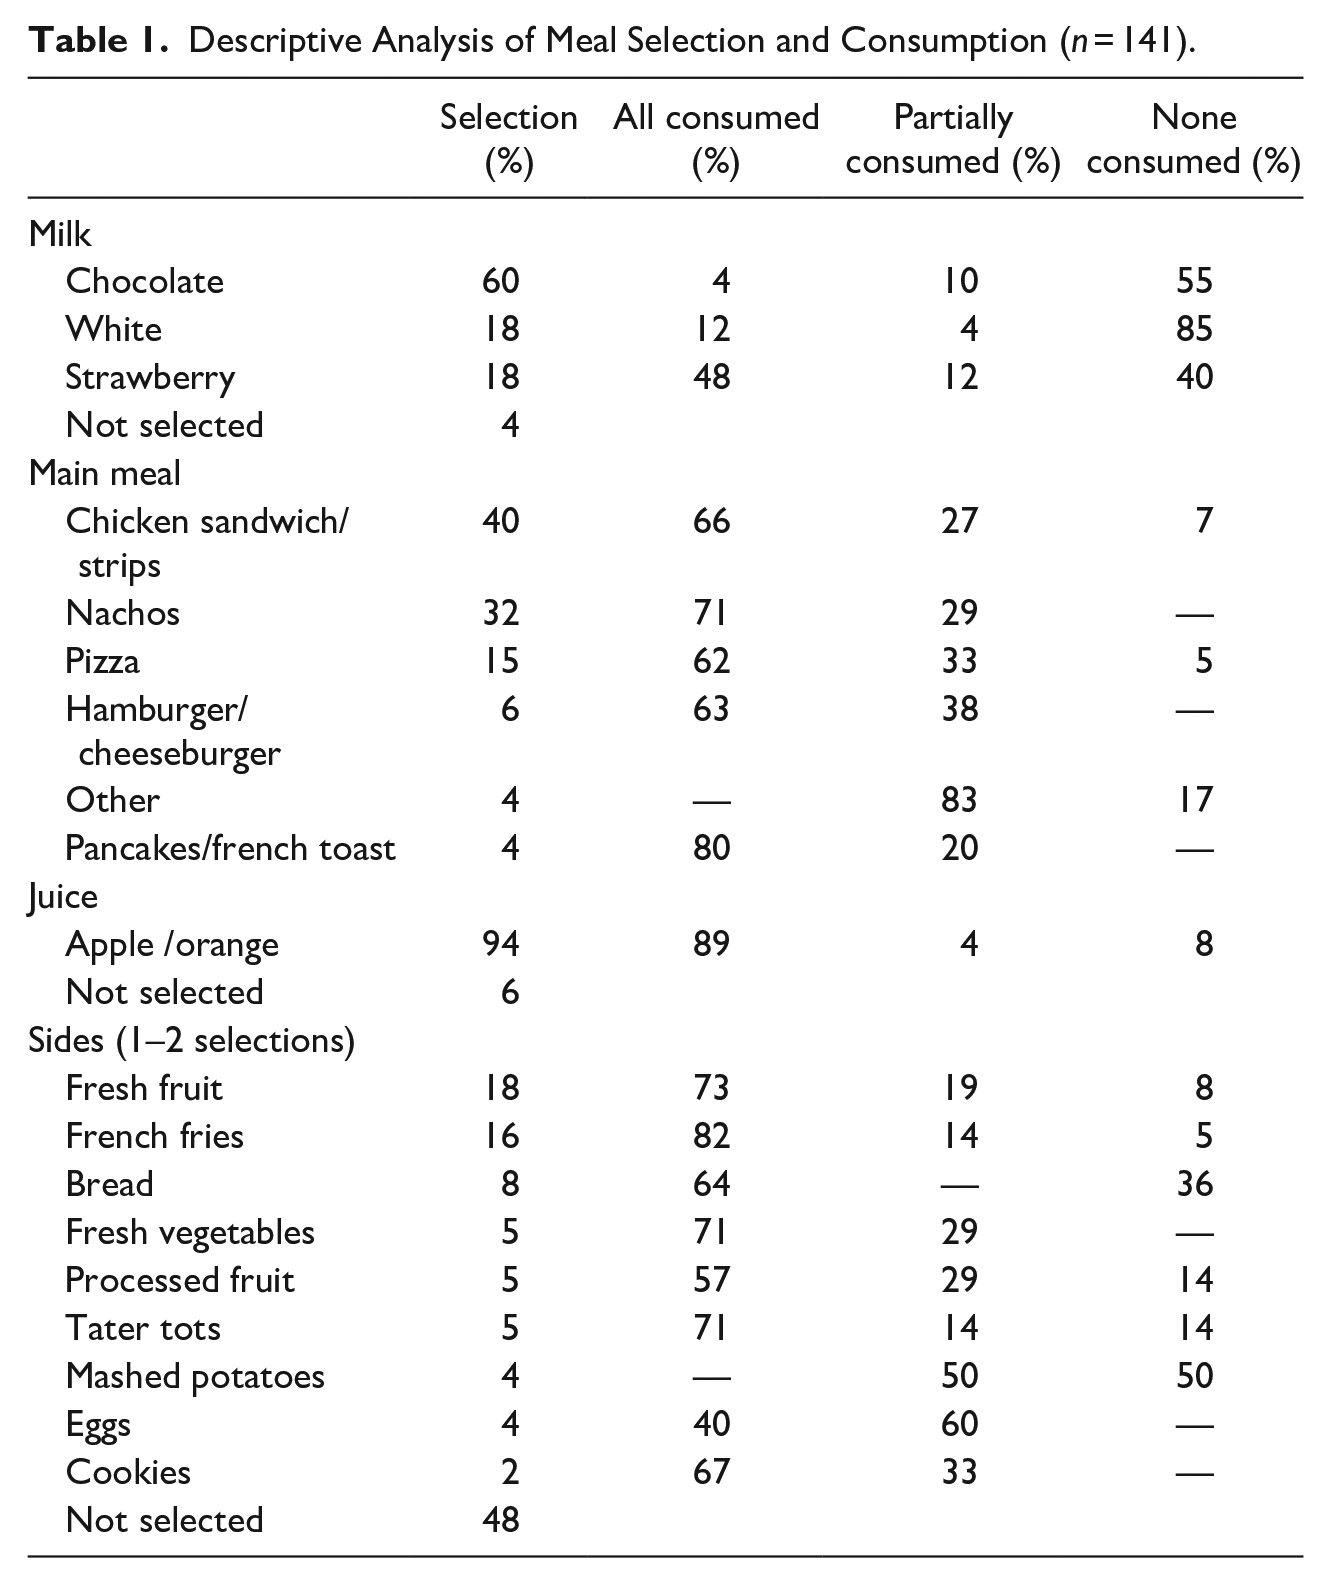
Table 2 presents the percentage of selected nutritional content that students ended up consuming. The USDA (2018) assumes an 85% level of consumption at lunch. However, unconsumed food tends to be much greater than this benchmark, and particularly so for certain types of nutritional content. For instance, school lunches selected in this study are within the USDA’s recommended window (600–700 calories) for average calories, but the actual number of consumed calories is much lower at 443 calories on average. Consumed protein ends up being only 68% of what students initially selected while intakes of vitamin A, calcium, and iron are lower than the 85% consumption level assumed by the USDA (2018). As a positive finding, lower consumption of overall calories translates to lower intakes of sugar, cholesterol, sodium, and saturated fat relative to the amounts present in selected school lunches, but at the same time, the nutritional content in selected food is higher than what students ultimately consume.
Selected and Consumed Nutrition (n = 141).
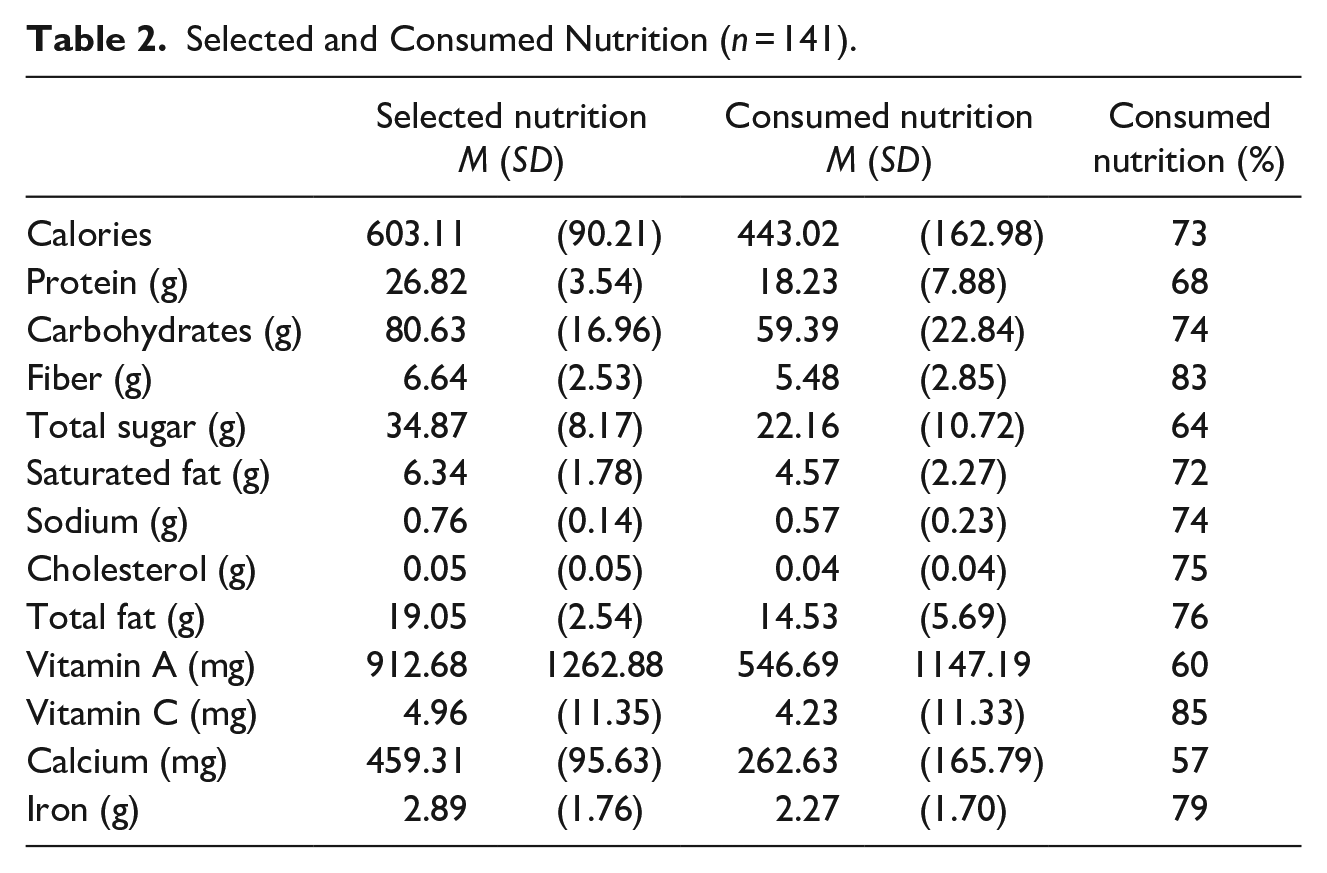
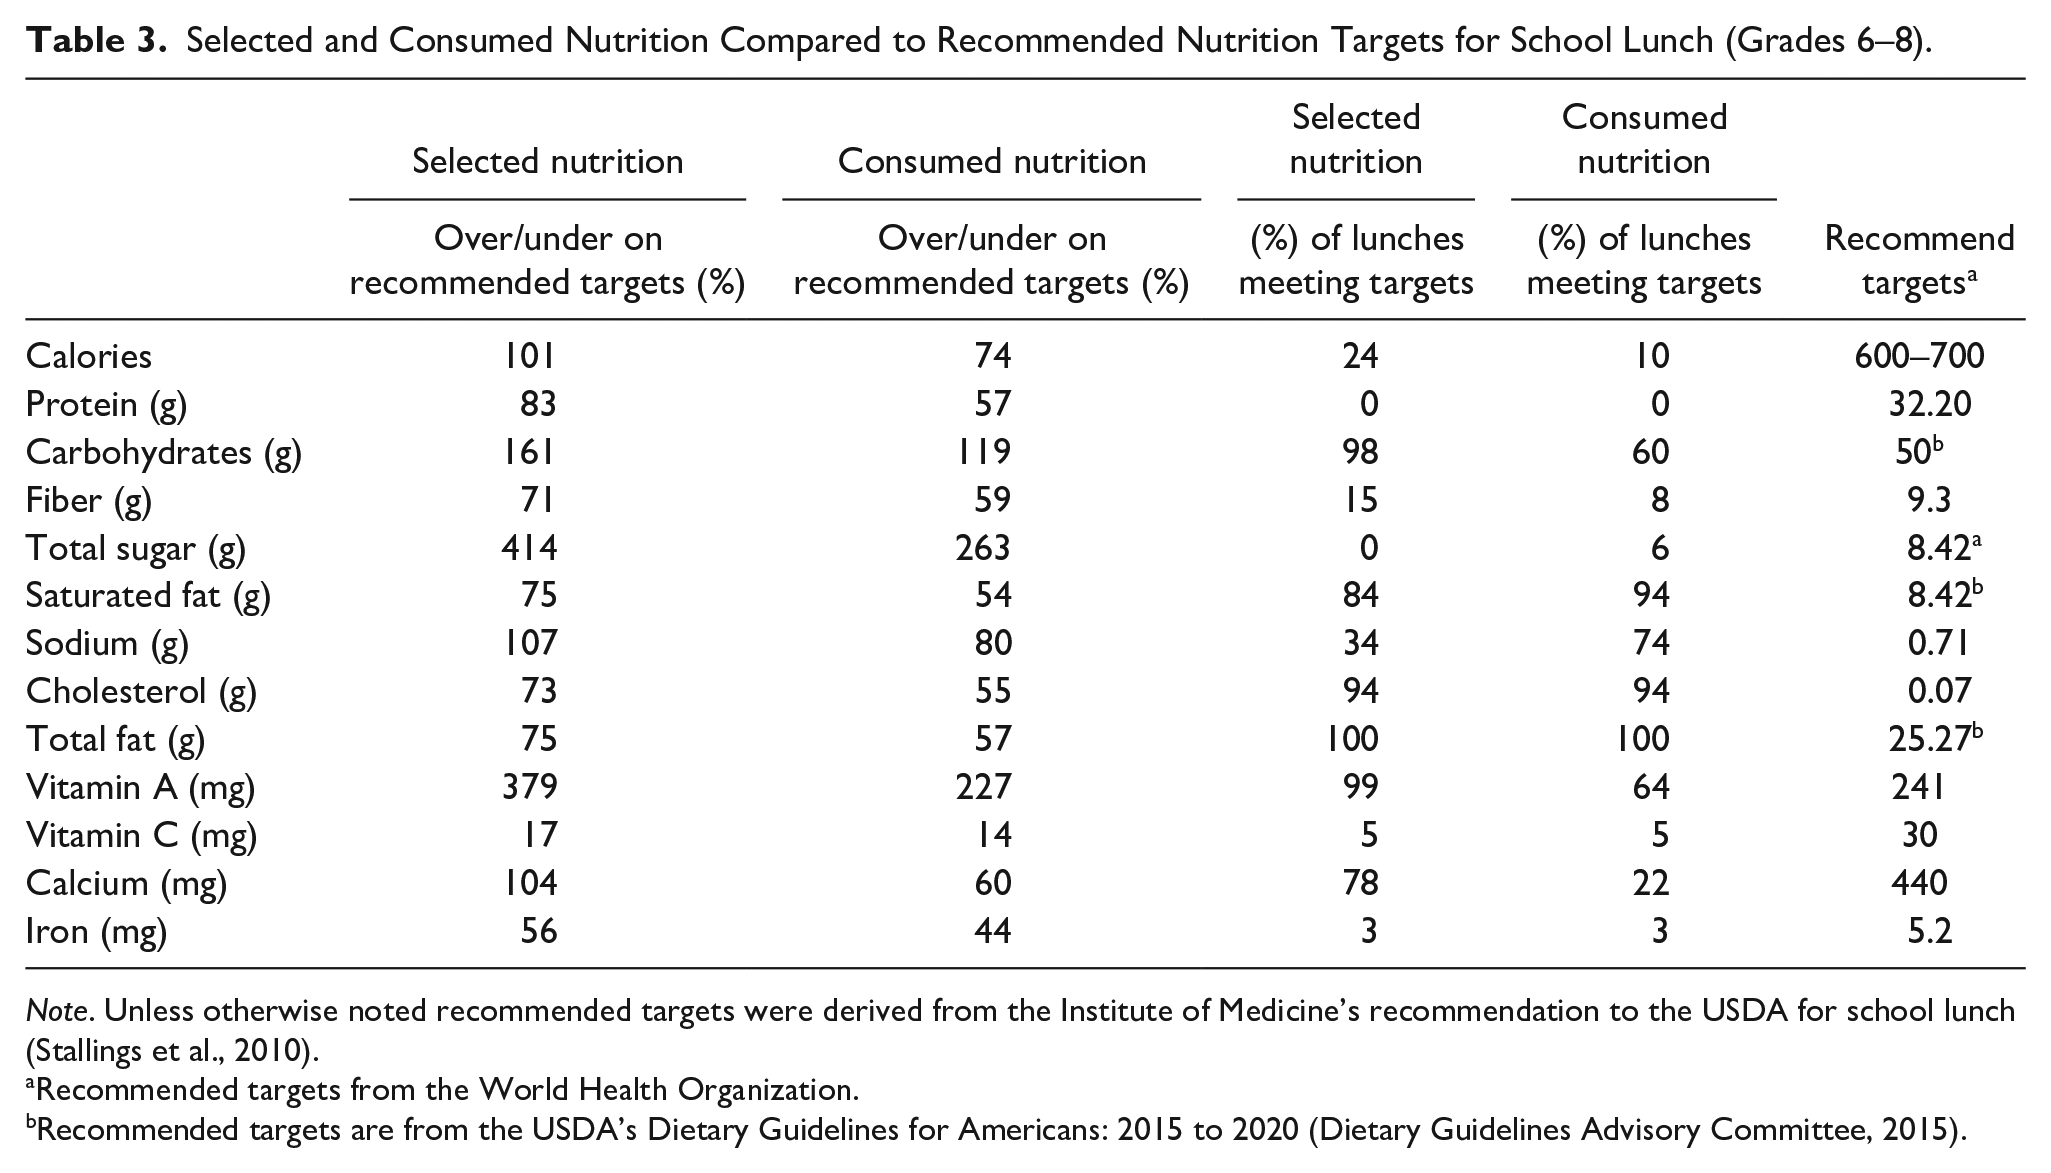
Table 3 presents selected and consumed nutrition compared to USDA recommended targets for nutritional content for lunch for middle school students (Dietary Guidelines Advisory Committee, 2015). For selected food, total calories align with recommended targets while selected protein, fiber, Vitamin C, and iron are below recommended targets. The selected amount of total sugar is 414% above the recommended target for lunch but saturated fat, cholesterol, and total fat are under the recommended amounts. In the second column, for food that is actually consumed by students, calories drop to 74% of the recommended target for school lunch. Consumed protein and fiber meet a little over half of the recommended amounts. Vitamin C is only 14% of the suggested amount. A relatively high wastage rate appears to reduce intakes of sodium, cholesterol, saturated fat, and total fat substantially. However, sugar intakes remain considerably high at 263% of recommended targets. These consumption patterns indicate that consumed lunches tend to be high in sugar and low in important nutrients.
Selected and Consumed Nutrition Compared to Recommended Nutrition Targets for School Lunch (Grades 6–8).
Note. Unless otherwise noted recommended targets were derived from the Institute of Medicine’s recommendation to the USDA for school lunch (Stallings et al., 2010).
Recommended targets from the World Health Organization.
Recommended targets are from the USDA’s Dietary Guidelines for Americans: 2015 to 2020 (Dietary Guidelines Advisory Committee, 2015).
Table 3 presents the percentage of lunches in the sample that meet USDA nutrition targets for both selected and consumed school lunches in columns 3 and 4. Only small percentages of students are selecting food items that allow them to meet recommended targets across different types of nutritional content. Only 24% of students’ lunch selections meet recommended targets for calories while none meet recommendations for protein. Only 15% of selected lunches meet recommendations for fiber and between 3% and 5% meet recommendations for vitamin C and iron. No lunches meet recommendations for sugar because students in the sample initially select lunches higher in sugar than what is recommended. However, 84% of selected lunches meet recommendations for saturated fat, 94% for cholesterol, and 100% for total fat. When examining actual consumption patterns, amounts for vitamins and key nutrients decrease. In column 4 of Table 3, only 10% of consumed lunches meet recommendations for calories. Consumption of recommended amounts of carbohydrates drop from 98% to 60%. Very small percentages of consumed lunches lead to meeting recommendations for fiber (8%), vitamin C (5%), iron (3%), and calcium (22%). For sodium (74%), cholesterol (94%), and total fat (100%), much higher percentages of students meet recommendations, which is partly attributable to portions of selected food going unconsumed. Approximately 94% of lunches lead to consumption of sugar at levels that are above recommended targets.
Discussion
Healthy eating at school lunch may provide a consistent source of quality nutrition that helps to create a foundation for student success in urban schools. The nation’s largest school food program, the National School Lunch Program, seeks to counteract problems of poor nutrition and high rates of obesity in American children. Previous empirical studies show mixed results on the health outcomes of students participating in the program, but these analyses are confounded by many factors that coincide with student participation in the program. Little work has examined what students in urban schools actually consume when they receive lunch under the NSLP. This information may be indispensable to school leaders seeking to maximize the health benefits of school lunch for low-income children in urban schools. In this study, we directly collected 141 school lunches in a Title I middle school in a large US city. Analyses of both selected and consumed nutrition in these lunches demonstrated that lunch selections were low in nutrients and high in sugar, and that consumed lunches ended up having even lower levels of key nutritional content but remained high in sugar.
In the literature, a mixed body of research on student participation in the NSLP reports associations between NSLP participation and increased weight gain (Capogrossi & You, 2017; Hernandez et al., 2011; Millimet et al., 2010; Schanzenbach, 2009), no change in weight, and positive health changes in students (Alfonso et al., 2019; Gleason & Dodd, 2009; Gundersen et al., 2012; Smith, 2017). In this study, students’ food selections offer some support for the link between NSLP participation and poor health outcomes. The lunch items that students selected were generally high in sugar and low in vitamins and nutrients. Food selection and food consumption also differed. The federal government assumes an 85% food wastage rate (USDA, 2018), but results from this study suggest that this rate is greater and that healthy food items tend to go unconsumed at considerably higher rates compared to less healthy items. As one example, most students receive milk with their lunch, but the majority of students in the sample did not drink any of the milk that they selected. In the limited research on school food consumption among urban students, scholars have weighed lunch trays and used before/after photos, generally finding high levels of food waste and low nutrient density in school lunches (Cohen et al., 2013). This study contributes to this literature by using a direct, real-time method of data collection, in which consumed food items were physically checked and recorded at the close of lunch. Similar to the findings of Adams et al. (2022) and Briefel et al. (2009), this study reports low amounts of consumed nutrients, such as vitamins C, iron, calcium, fiber, and protein. The analyses in this work indicate that high levels of sugar were consumed at lunch, potentially reducing health benefits of lunches provided through the NSLP in urban schools.
There are limitations to this study that require mention. First, even though this study undertook a direct, real-time approach to recording food consumption during school lunch, these data were confined to one school that may not be generalizable. Future research is needed to understand actual nutritional intakes of NSLP students across a larger number of school sites. Second, when directly checking individual food items at the close of school lunch, food was marked as unconsumed, one-fourth consumed, half consumed, three-fourths consumed, or fully consumed, so this analytical approach does not provide the exact amount consumed, but it remains a major improvement on prior research that evaluates nutritional intakes at lunch based on before-an-after photos, weighing of trays, and student self-reports.
Conclusion
The National School Lunch Program is a significant investment in student health and nutrition in urban schools. As rates of childhood obesity have climbed in the United States, the NSLP has become more focused on fostering healthy eating. Yet, a high percentage of students in this study selected food items that were low in vitamins and nutrients and high in sugar. Not only do the food items that students select tend to lack healthy nutritional content but also student consumption patterns seem to result in even poorer nutritional outcomes. School lunches meet federal guidelines in certain ways, but students tended to avoid selecting and consuming healthy food items in many cases. For urban school leaders aiming to optimize healthy eating at lunch, school-based healthy eating interventions, nutrition education, food presentation, and added sugar restrictions could be needed. It would seem that urban schools offer lunches that generally meet USDA nutrition standards, but it is what students consume that truly matters rather than what they are offered. The literature on school-based dietary interventions is largely inconclusive, providing limited direction on how urban school leaders might take action to improve healthy eating during school lunch. Future research is thus needed to understand what types of educational interventions, school meal configurations, and other school-based strategies can support healthy eating among NSLP participants in urban schools.
In addition, the effects of changes to the NSLP nutritional standards might be explored in future research. In 2010, policymakers revised nutritional standards for the National School Lunch Program with the goals of reducing childhood obesity and encouraging healthy eating among children. It is uncertain what new federal policy changes might support healthier consumption patterns for students receiving lunch through the NSLP in urban schools. One option may be to reduce food items that are high-sugar and low in nutrients on daily menus, but these items tend to be most popular and have the highest rates of consumption. Whether offering fewer low-nutrient options could be a means of consumption of higher nutrient food items is unknown. Finding ways to improve the health benefits of school lunch for NSLP participants in urban schools is of considerable importance as high levels of childhood obesity and poor nutritional health in American children may be greatly restricting students’ performance at school as well as their ability to lead healthy and productive lives.
Footnotes
Declaration of Conflicting Interests
The author(s) declared no potential conflicts of interest with respect to the research, authorship, and/or publication of this article.
Funding
The author(s) received no financial support for the research, authorship, and/or publication of this article.