






Abstract
Considerable amounts of evidence now indicate that school leadership matters a good deal to students’ learning (e.g., Hallinger, 2011; Leithwood & Sun, 2012; Robinson, Lloyd, & Rowe, 2008; Witziers, Bosker, & Krüger, 2003) and that its contributions to such learning are largely indirect (e.g., Bossert, Dwyer, Roan, & Lee, 1982; Hallinger & Heck, 1996). Evidence also suggests that school leadership is almost always distributed throughout the organization (Day et al., 2011; Spillane, Diamond, & Jita, 2003) and is most effective when it is needed most (Leithwood, Harris, & Strauss, 2010).
The contribution of school leadership to student learning is now sufficiently well-documented that one of the most important questions now facing practicing leaders and leadership scholars is about “how.” How does school leadership influence student learning? (e.g., Bryk, Harding, & Greenburg, 2012; Heck & Hallinger, 2014; Hallinger & Heck, 1996; Pietsch & Tulowitzki, 2017; Robinson et al., 2008). This study is the third in a series of studies testing one approach to answering this question. Labeled the “four paths” model, this approach proposes an integrated model of school leadership practices influencing student learning through four categories (paths) of school, classroom, and family mediators. Using data provided by teachers and students in six Texas school districts, this study aimed to answer three questions about the four paths model:
What is the contribution to student achievement of variables populating each of the four paths and which variables make the greatest contribution?
What is the contribution to student achievement of each of the four paths, in aggregate, and which path(s), in aggregate, make the greatest contribution?
What are the direct and indirect effects of school leadership on student achievement and which features of leaders’ schools and communities offer the greatest leverage for their school improvement efforts?
This model, developed and continuously refined over a dozen years, has served as a “theory of action” to help guide decision making in a large-scale, long-term leadership development program (Leithwood, 2018). The most extended exploration of the four paths model, to date, can be found in Leithwood, Sun, and Pollock (2017) and the first empirical test of the model (Study 1) was published almost a decade ago (Leithwood, Patten, & Jantzi, 2010), A second test (Study 2) was included as part of a recent study which had a district focus but incorporated all the four path variables (Leithwood, Sun, & McCullough, 2019). This study is a replication and extension of Studies 1 and 2.
Framework
According to the four paths model, school leaderships’ influence, from whatever source, “flows” along four “paths to reach students—rational, emotions, organizational, and family paths. Each of these paths is populated by a conceptually related set of variables selected because of substantial evidence indicating that (a) they have relatively direct and significant effects on students and (b) they can be influenced by those exercising leadership (other variables not included in the framework might also meet these two criteria). Selecting the most promising of these variables, a task requiring knowledge of relevant research, as well as local context, and improving their status are among the central challenges facing leaders intending to improve student learning in their schools, according to the model.
As the status of variables on each path improves through influences from leadership and other sources, the quality of students’ school and classroom experiences is enriched, resulting in greater learning for students. Over an extended period of time, leaders are urged to attend to variables in their schools in need of strengthening on all paths. The need for alignment across paths seems to hugely complicate leaders’ work. But, picking only one or two powerful variables on a path, and planning for the most likely interactions makes the leadership task much more manageable. This way of thinking about the leadership task, however, does add weight to the argument that leaders’ success will typically depends on devoting one’s attention to a small number of priorities.
School Leadership
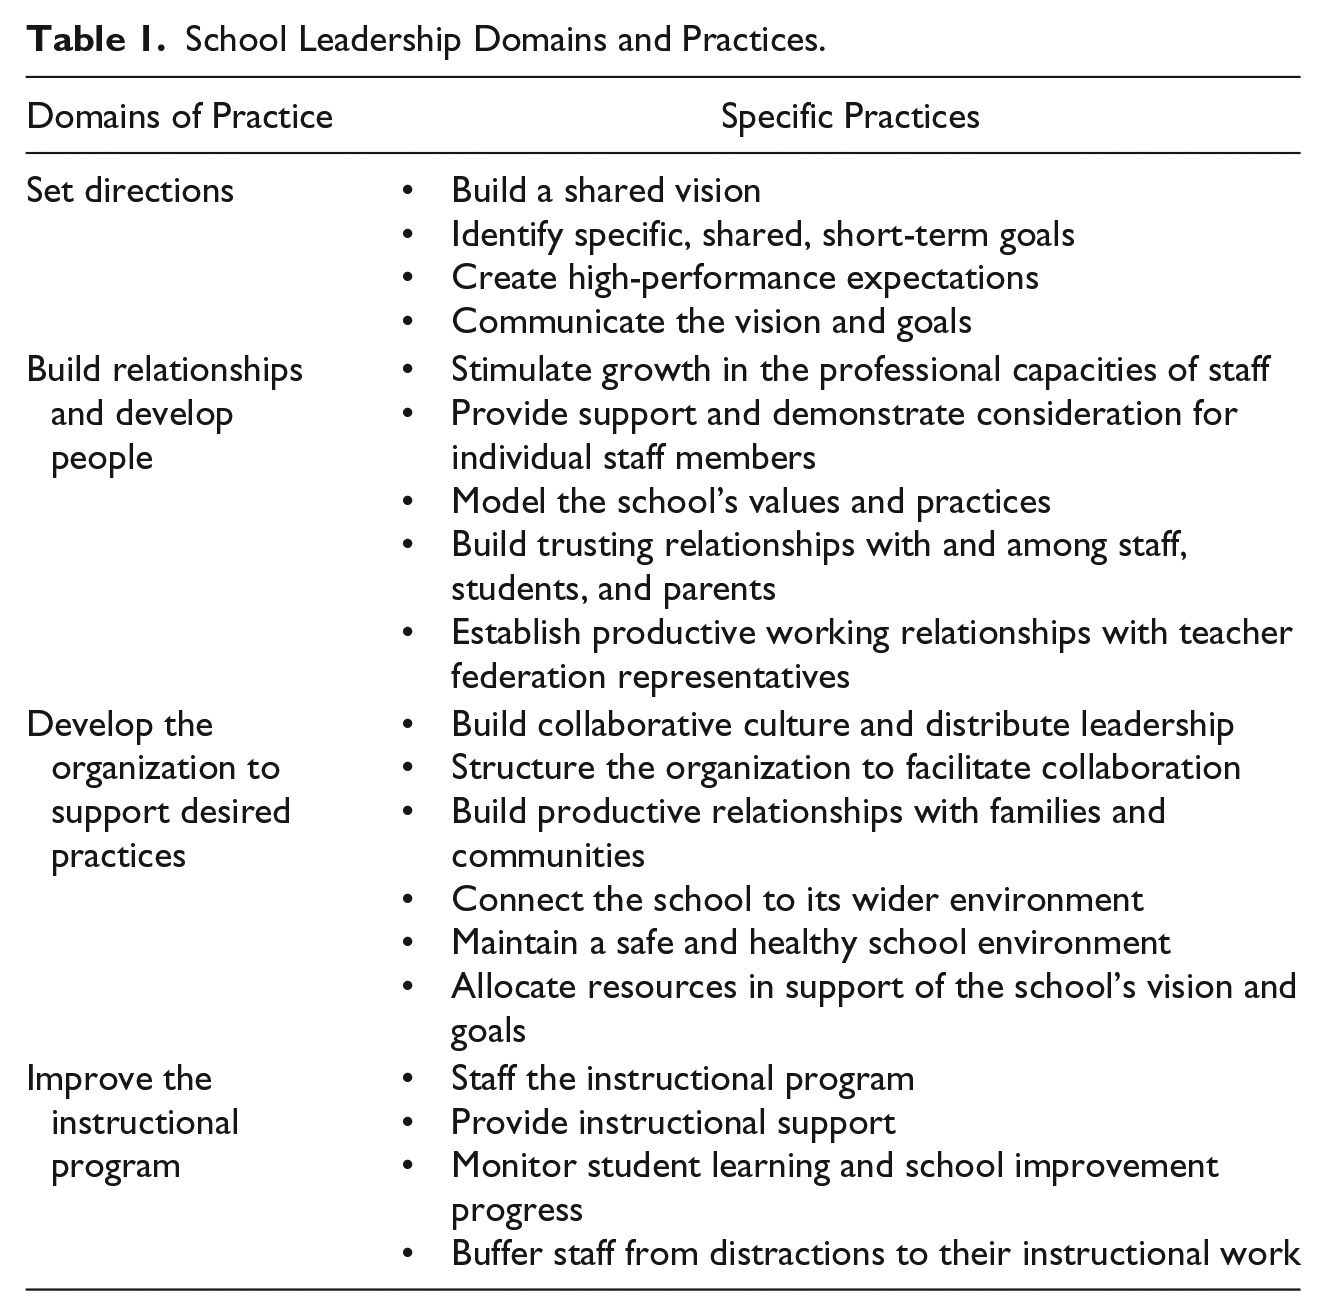
A considerable body of research supports the conception of school leadership included in this framework (e.g., Day et al., 2011; Leithwood & Jantzi, 2006, 2008; Leithwood & Louis, 2012; Leithwood & Riehl, 2005). The most detailed account of this “integrated model” (Printy, Marks, & Bower, 2009) and it’s theoretical roots is found in the Ontario Leadership Framework (Leithwood, 2012) recently judged to be the most comprehensive, evidence-based account of effective school leaders practices available (Hitt & Tucker, 2016). This conception of leadership consists of four domains and a total of 19 specific practices within those domains. Table 1 identifies the four domains of leadership practice—setting directions, building relationships and developing people, developing the organization to support desired practices, and improving the instructional program; the table also lists the specific practices included in each domain. Although not included in this study, this leadership model also includes three types of “personal leadership resources” (capacities and dispositions), cognitive, social and psychological resources (see Leithwood, 2012).
School Leadership Domains and Practices.
Variables on the Rational Path
The four variables associated with the rational path are rooted in the knowledge and skills of school staff members about curriculum, teaching, and learning.
Classroom instruction (CI)
As conceptualized and measured in this study, CI incorporated general, rather than domain-specific, teaching practices that research from three bodies of literature indicate are effective in enhancing student learning: high-yield instructional strategies (e.g., Hattie, 2009; Marzano, Waters, & McNulty, 2005), the use of student data to inform instructional decisions (e.g., Dalton, 2009; Gates, 2008; Palucci, 2010; Rayor, 2010; J. Williams, 2011) and technology use to facilitate face-to-face instruction (Means, Toyama, Murphy, Bakia, & Jones, 2010).
Academic press (AP)
Academic press or emphasis is a key feature of high performing schools (Cannata, Smith, & Haynes, 2017). Hoy, Hannum, and Tschannen-Moran (1998) define academic emphasis as “a combination of teachers setting high, but reasonable goals, students responding positively to the challenge of these goals, and the principal supplying the resources and exerting influence to attain these goals” (p. 342). Academic press has been positively related to achievement in all types of schools including schools serving poor and minority students (Goddard, Hoy, & Hoy, 2000; Hoy, Tarter, & Hoy, 2006; Smith & Kearney, 2013), with its effect stronger in low-socioeconomic status (SES) high schools (Shouse, 1996).
Disciplinary climate (DC)
School DC includes students’ discipline concerns; class disruptions; student absenteeism and tardiness; students counseling about discipline; students’ discipline experience; the rules for behavior, race, or cultural conflicts at the school; students’ behaviors and the punishments for misbehaviors at the school; teachers’ behavior; and teacher–student relations (Ma & Willms, 2004). Disciplinary climate has a significant relationship with student learning (Hattie, 2009; Ning, Damme, Noortgate, Yang, & Gielen, 2015; Sortkaer & Reimer, 2018) and strongly influences the equitable treatment of students when it is approached through principles of “restorative justice” (Wiley et al., 2018). Its effects are larger than the effects of student SES (Ma & Crocker, 2007; Ma & Willms, 2004).
Teachers’ use of instructional time (UIT)
Evidence indicates that total instructional time matters less than how the time is spent (Bellei, 2009), the subjects on which time is spent, and the strength of the curriculum (OECD, 2013). The content of the curriculum in which students spend time studying, “opportunity to learn,” has quite strong effects on learning (Tornroos, 2005; Wang, 1998). Teachers’ UIT includes teachers’ efforts to maximize teaching and learning time, create classroom conditions that allow for an appropriate pace of instruction, and help students take charge of their own learning in age-appropriate ways.
Variables on the Emotions Path
The emotions path includes those feelings, dispositions, or affective states of staff members, both individual and collective, shaping the nature of their work.
Collective teacher efficacy (CTE)
This variable is defined as the level of confidence a group exudes in its capacity to organize and execute the tasks required to reach desired goals (Bandura, 1993; Goddard, Hoy, & Hoy, 2004). Correlations between measures of CTE and student learning range from 0.38 to 0.99, with an average r = 0.69 (e.g., Tschannen-Moran & Barr, 2004). Angelle and Teague (2014) report a strong relationship between CTE and the likelihood of them taking on leadership role in their schools. One recent study reported modest but significant relationships between CTE and the improvement of math instruction in middle schools (Berebitsky & Salloum, 2017).
Teacher trust in others (TTO)
Common to most concepts of trust is one party’s willingness to be vulnerable to another party based on the belief that the latter party is competent, reliable, open, and concerned (Handford & Leithwood, 2013). Teacher trust in others in this study included teacher trust in colleagues, students, and parents. This variable has been linked positively to school effectiveness (Goddard, Tschannen-Moran, & Hoy, 2001), school climate (Hoy, Sabo, & Barnes, 1996; Tarter, Sabo, & Hoy, 1995), and student achievement (Leithwood, Anderson, Mascall, & Strauss 2010), even when SES and other student demographics (e.g., Goddard et al., 2001).
Teacher commitment (TC)
Evidence has accumulated about at least four types of TC: commitment to teaching, students, to the school organization, and to change. This study measured only TC to the school organization. Such commitment is about an individual’s strong belief in the organization, identification and involvement in the organization, and a strong desire to remain part of the organization (Freeston, 1987; Leithwood, Jantzi, & Steinbach, 1999; Porter, Steers, Mowday, & Boulian, 1974). This type of commitment is positively associated with important organizational conditions such as teachers’ instruction (Granger, Morbey, Lotherington, Owston, & Wideman, 2002; Hendel, 1995) and student outcomes including moral growth (M. M. Williams,1993), and academic achievements (Gill & Reynolds, 1999; Harvey, Sirna, & Houlihan, 1988; Housego, 1999; Janisch & Johnson, 2003). Many factors giving rise to this form of commitment are responsive to leadership influence (Dannetta, 2002).
Variables on the Organizational Path
Variables on the organizational path include features of schools that structure the relationships and interactions among organizational members.
Safe and orderly environment (SOE)
Assuming a holistic approach to school safety and orderliness, this variable relies on the coordination of school, parents, community and community services, efficient provision of mental health services for those students who need it, threat assessment rather than violence surveys, emphasis on prevention versus suspension (on safe school vs. school violence), and increasing the use of restorative justice practices in progressive discipline (Astor, Guerra, & Acker, 2010; Borum, Cornell, Modzeleski, & Jimerson, 2010; Cornell & Mayer, 2010; Mayer & Furlong, 2010; Jimerson, Swearer, & Espelage, 2010; Swearer, Espelage, Vaillancourt, & Hymel, 2010). This variable captures the features of both an orderly, safe environment, and an inclusive environment.
Collaborative structures and culture (CSC)
This variable captures key elements of teachers’ collaborative instructional knowledge sharing, creation, and experimentation based on student progress data. This variable is especially prominent in schools making significant progress with their students’ achievement (e.g., Hill, 2010; Lomos, Hofman, & Bosker, 2011). One review of data-use research (Sun, Przybylski, & Johnson, 2016) revealed that teachers felt the opportunity to work with their colleagues, using common assessment to monitor student academic progress, engage in shared instructional decision making, and sharing best practices was an integral part of the process leading to increased academic scores. Collaborative school culture and structures are significantly correlated with teacher-perceived effectiveness in specialized programs for students with disabilities (Kristoff, 2003).
Organization of planning and instructional time (OPIT)
This variable includes two components providing time and structure for teachers’ common planning and maximizing instruction time at the school level. Common planning time is probably the support teachers need most from school administration for collaboration and professional development (Deike, 2009; Gallagher, Means, Padilla, & SRI International, 2008; Quezada, 2012). Teachers’ developing common assessment tools, sharing effective assessments and teaching strategies, identifying students’ need, and developing interventions during common planning times has been reported as one prominent feature of successful schools—a typical way to improve “social capital” in schools (DuFour & Fullan, 2013; Hargreaves & Fullan, 2012), and an effective way to move students forward (Leithwood, Aitken, & Jantzi, 2006; Sun, Johnson, & Przybylski, 2016).
Variables on the Family Path
Family path variables included those features of the home that are both alterable and have demonstrated significant contributions to students’ success at school.
Parent expectations for children’s success at school and beyond (PE)
This variable was defined as “The degree to which a student’s parents [hold] high expectations of the student’s promise of achieving at high levels” (Jeynes, 2005, p. 246). Jeynes’s (2005) meta-analysis identified “parental expectations,” among all forms of parental involvement in school, as having the greatest impact on student achievement by a large margin; a significant effect size of .58 (p. 253).
Forms of communication between parents and children (FC)
Schools typically spend considerable effort on creating meaningful ways of communicating with parents (Epstein et al., 2002) such as school newsletters, curriculum nights at school, online messaging systems and the like. However, it is the FC in the home that has by far the largest effect on student success at school. Underlying most such communication is what the literature refers to as “parenting styles” (e.g., Jeynes, 2005). Creating effective parent/child communications necessarily entails clarifying with parents the advantages of adopting a supportive yet firm approach to interacting with their children, as compared with more extreme forms of either autocratic or laissez-faire approaches. Creating effective parent/child communications about school-related matters requires school staff to focus on how productive parenting styles are applied to obviously school-relevant issues (Leithwood & Patrician, 2015).
Parents’ social and intellectual capital about schooling (PSC)
This variable includes the power and information present in parents’ social relationships that can be used to leverage additional resources helpful in furthering their children’s success at school (Leithwood & Patrician, 2015). “The more people do for themselves, the larger community social capital will become, and the greater will be the dividends upon the social investment” (Ferlazzo, 2011, p.11). Parents’ Intellectual Capital has been defined as the knowledge and capabilities of parents with the potential for collaborative action. Taken together, PSC encompass parent engagement, involvement, and assistance in student learning and school activities. Parent engagement is nurtured when parents believe they should be involved in their children’s education and schooling and have a positive sense of efficacy about the usefulness of their involvement (Hoover-Dempsey & Sandler, 1997).
Method
Sample
During the winter and spring of 2016, two surveys were administered to teachers and school leaders in all elementary schools in six Texas districts whose school leaders were participating in a leadership development program, the Rice University Education Entrepreneurship Program, delivered jointly by the University’s faculty of education and business school. Teacher data were used for this study. Responses sufficient for analysis at the school level were received from 81 schools. Of the 4,523 teachers in those schools, 2017 valid responses were received, a 44.6% response rate.
Respondents were located in districts that varied widely in size and student demographic. One district among the six was a significant outlier with more than 260 schools, 11,000 teachers, and a student population of over 200,000. More than 70% of students in this district were economically disadvantaged and more than 30% had English as a second language. The remaining 5 districts, on average, had about 60 schools, 3,900 teachers, and 65,000 students. On average, about 50% of students in these five districts were economically disadvantaged and more than 15% were English language learners.
Sources of Evidence
Using 5-point Likert-type scales, responses from teachers were collected using a survey that measured perceptions of the nature and quality of school leadership in each school, as well the status of all variables included on the four paths described above. This section describes the origins of the scales, the number of items in each scale, and the reliability of each scale reported in our recent Study 2. The number of items making up the scales used to measure each variable ranged from 4 to 22. While the origin of each of these scales is identified below, modifications were made to eight of them as a result of their annual use (eight times) in a 13-year evaluation of a large-scale leadership development program (Leithwood, 2018). After each administration of the scales, items identified as reducing the reliability of each scale were eliminated. The remaining scales (OPIT, SOE, CSC, PE, PSC, and PC) were used as part of the evaluation only several times and so subject to much less modification.
School leadership (SL)
The 22-item scale measuring SL reflected each of the four domains of the integrated leadership model described earlier: Set Directions (e.g., “To what extent do your school leaders provide useful assistance to you in setting short-term goals for teaching and learning”); Develop People (e.g., “To what extend do your school leaders give you individual support to help you improve your teaching practices”); Develop the Organization (e.g., “To what extent do your schools leaders build community support for the school’s improvement efforts”); and Improve the Instructional Program (e.g., “To what extent do your school leaders encourage teachers to use data effectively to improve their instruction”). Previous uses of this measure reported relatively high reliability .94 in the prior study and .93 in Leithwood and Louis (2012).
Variable on the rational path
Four variables represented the rational path. The eight-item scale measuring CI was constructed for this study from the review of literature summarized in the framework (above). In Study 2, this scale had an alpha coefficient of .93. A sample item from the scale measuring this variable is “I provide prompt, specific scaffolding or remedial feedback to provide more precise instruction to each of the students.”
The four-item scale measuring AP was adapted from a scale used by Hoy and Tarter (1997) with an alpha coefficient of .94. In Study 2 this scale had an alpha coefficient of .84. Sample item from this scale includes “My school sets high standards for academic success” and “Students respect others who get good grades.” Disciplinary climate was measured with four items adapted from earlier research by Ma and Willms (2004), for example, “Students do not start working for a long time after my lessons begin.” The reliability of this scale used in previous research ranged from 0.45 to 0.71 (e.g., Ma & Willms, 2004). Six items developed specifically for this study were used to measure teachers’ UIT (e.g., “My classroom timetable includes large uninterrupted blocks of learning time”). Our prior study reported an alpha coefficient of .87 for this scale.
Variables on the emotions path
This path is populated by three variables. The eight-item scale for measuring CTE, with an alpha coefficient of .88 in our prior study, was originally based on a scale reported by McGuigan and Hoy (2006). A sample item is “Teachers in this school are confident they will be able to motivate their students.” The four-item scale measuring teachers’ trust in parents, students, and colleagues was adapted from a Faculty Trust scale used by Tschannen-Moran and Hoy (1998), expanded to include other stakeholders but not school administrators. This four-item scale included, for example, “Teachers can count on support from most students’ families.” The alpha coefficient for this scale in our prior study was .82. The six-item scale measuring TC was created from our own synthesis of literature on this topic and includes, for example, “I am willing to go the extra mile to help students.” The reliability of this scale in Study 2 was 0.94.
Variables on the organizational path
On this path are SOE, CSC, and OPIT all measured using items based on our own review of prior evidence. Use of the nine-item CSC scale in our Study 2 resulted in an alpha coefficient of .92. An example from that scale is “We collaborate with one another to develop common assessment tools for measuring students’ progress.” The six-item scale measuring SOE included, for example, “The learning environment in this school is safe and orderly.” Our prior study using this scale reported an alpha coefficient of .77. Finally, an example of the four-item OPIT scale is “Teachers in our school have common planning times to discuss teaching and learning.” As used in Study 2 the scale had an alpha coefficient of .80.
Family path variables
The three variables representing the family path included PE, FC, and PSC relevant to schools. The three scales measuring these variables originated in a previous study by the first author (Leithwood & Patrician, 2015). By way of example, one item from the five-item PE scale is “Most of my students’ parents or guardians make sure their children finish their homework.” One item from the five-item scale measuring FC is “Most of my students’ parents or guardians listen to their children’s ideas,” and one item from the eight-item PSC scale is “Most of my students’ parents or guardians ensure that their kids have healthy diets and enough sleeps.” The reliability of these scales (aggregated) in Study 2 was 0.83.
Student achievement
State of Texas Assessments of Academic Readiness (STAAR) program results was the source of student achievement data for the study. This program was implemented in spring 2012 and includes tests of reading and mathematics at Grades 3 and 8; writing at Grades 4 and 7; science at Grades 5 and 8; social studies at Grade 8; end-of-course assessments for English I, English II, Algebra I, biology, and U.S history. The study used results aggregated at the school level of the Texas STAAR Percentage at Phase-in Satisfactory Standard or Above, combining all subjects and all grades.
Socioeconomic status
Students’ SES, measured by EcoDis was based on the count and percentage of students eligible for free or reduced-price lunch or eligible for other public assistance (PEIMS [Public Education Information Management System], October 2013, October 2014; and TEA [Texas Education Agency] Student Assessment Division). While free or reduced-price lunch is an indirect, school-wide measure of SES, recent evidence suggests that it predicts student achievement better than family income measures alone even after controlling for such income (Domina et al., 2018).
Analyses
Means, standard deviations, and scale reliabilities (Cronbach’s alpha) were computed for all variables and bivariate correlations were computed between all variables measured by the teacher survey. Intraclass correlations (ICC) were calculated using SPSS 24 ANOVA (analysis of variance) random effects for all path variables and SL to examine whether individual teacher measures of these clustered significantly at the school level.
Four confirmatory factor analyses (CFAs) were conducted using LISREL 9.3. These CFAs aimed to determine whether each of the four paths could be considered a latent variable consisting of the three observed variables representing each path. Five multiple regression analyses were then used to determine the contribution of each of the four paths to student achievement under SL controlling for student SES.
Finally, structural equation modeling (SEM) using LISREL 9.3 (Schumacker & Lomax, 2016) was performed to examine the indirect effect of SL on student learning mediated by the four paths, controlling for student SES 1 .
Results and Discussion
The report of results in this section includes comparisons with results of Studies 1 and 2 when variables, measures, and forms of analysis permit.
Descriptive Statistics
Table 2 reports mean responses to items measuring each of the four path variables (using a 5-point scale; 5 = strongly agree, 1 = strongly disagree), the standard deviation of these responses, reliability of the multi-item scales measuring each variable and the number of items included in each scale. As this table indicates, all scales exceed widely accepted minimum standards of reliability (.70; Nunnery & Bernstein, 1994) by a large margin, except for OPIT (.73).
Mean, Standard Deviation, and Scale Reliability for Variables.
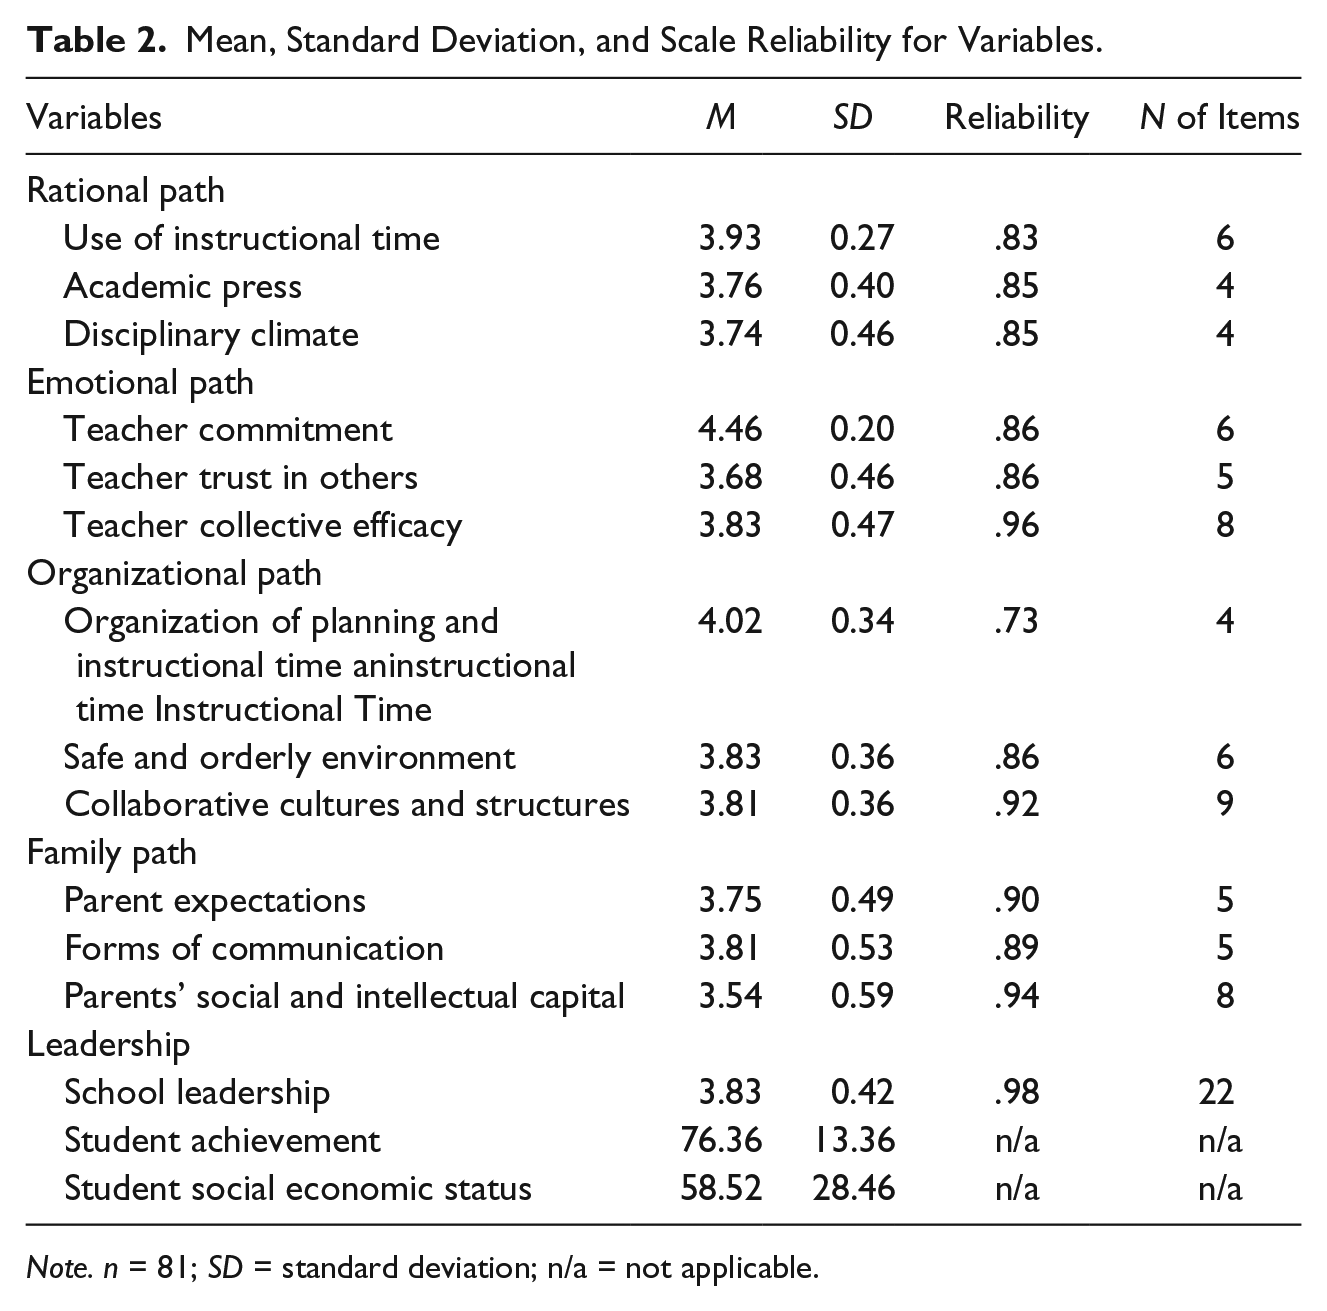
Note. n = 81; SD = standard deviation; n/a = not applicable.
Mean responses to scales ranged from lows of 3.54 and 3.75 for PSC and PEs for student success, respectively, to a high of 4.46 and 4.31 for TC and CI, respectively. The standard deviations of responses were all relatively low (0.20 to 0.49), indicating substantial agreement among respondents’ ratings. These descriptive results also indicate considerable variation in the status of the four path variables in schools.
To test whether the 13 path variables represent four latent constructs (the four paths), four CFAs were conducted (not tabled). Factor loadings for variables on the rational path ranged from .74 to .91, on the emotions path from .76 to .97, on the organizational path from .79 to .94, and on the family path from .86 to .97. All major fit indices confirmed acceptable model fit.
Intraclass correlation analysis ICC(1) is commonly interpreted as the proportion of variance in a target variable that is accounted for by group membership (Bliese, 2000; McGraw & Wong, 1996; Snijders & Bosker, 1999). ICC(2) represents the reliability of the group mean scores and varies as a function of ICC(1) and group size; it tests for homogeneity of perceptions among teachers within school. For a group-level construct to be reliable, ICC(1) values should be significant and the acceptable ICC(2) values should be larger than 0.60 (Cohen, Cohen, West, & Aiken, 2003).
Thirteen random effect ANOVAs (not tabled) were run for the 13 path variables and SL (n =2,017). The F test of significance for each of the variables was statistically significant (p < .001). This confirmed the school-level variability in the 13 observed variables and suggested that individual-level analyses would be inappropriate. The ICC(1) values for all the variables were small (from .10 for UIT to .30 for CTE), The ICC(2) values for the 13 variables were large (from .61 for OPIT to .89 for SL) except UIT, which was .56 (see Table 3). These results indicated reliable within-group (school) agreement supporting the aggregation of data to the group level. Although the within-group agreement for teachers’ UIT did not exceed the 0.60 threshold recommended by Cohen et al. (2003), these results taken together indicated the appropriateness of aggregating the data to school level for data analysis.
Intraclass Correlation Coefficients (ICC) for Path Variables and School Leadership (SL).
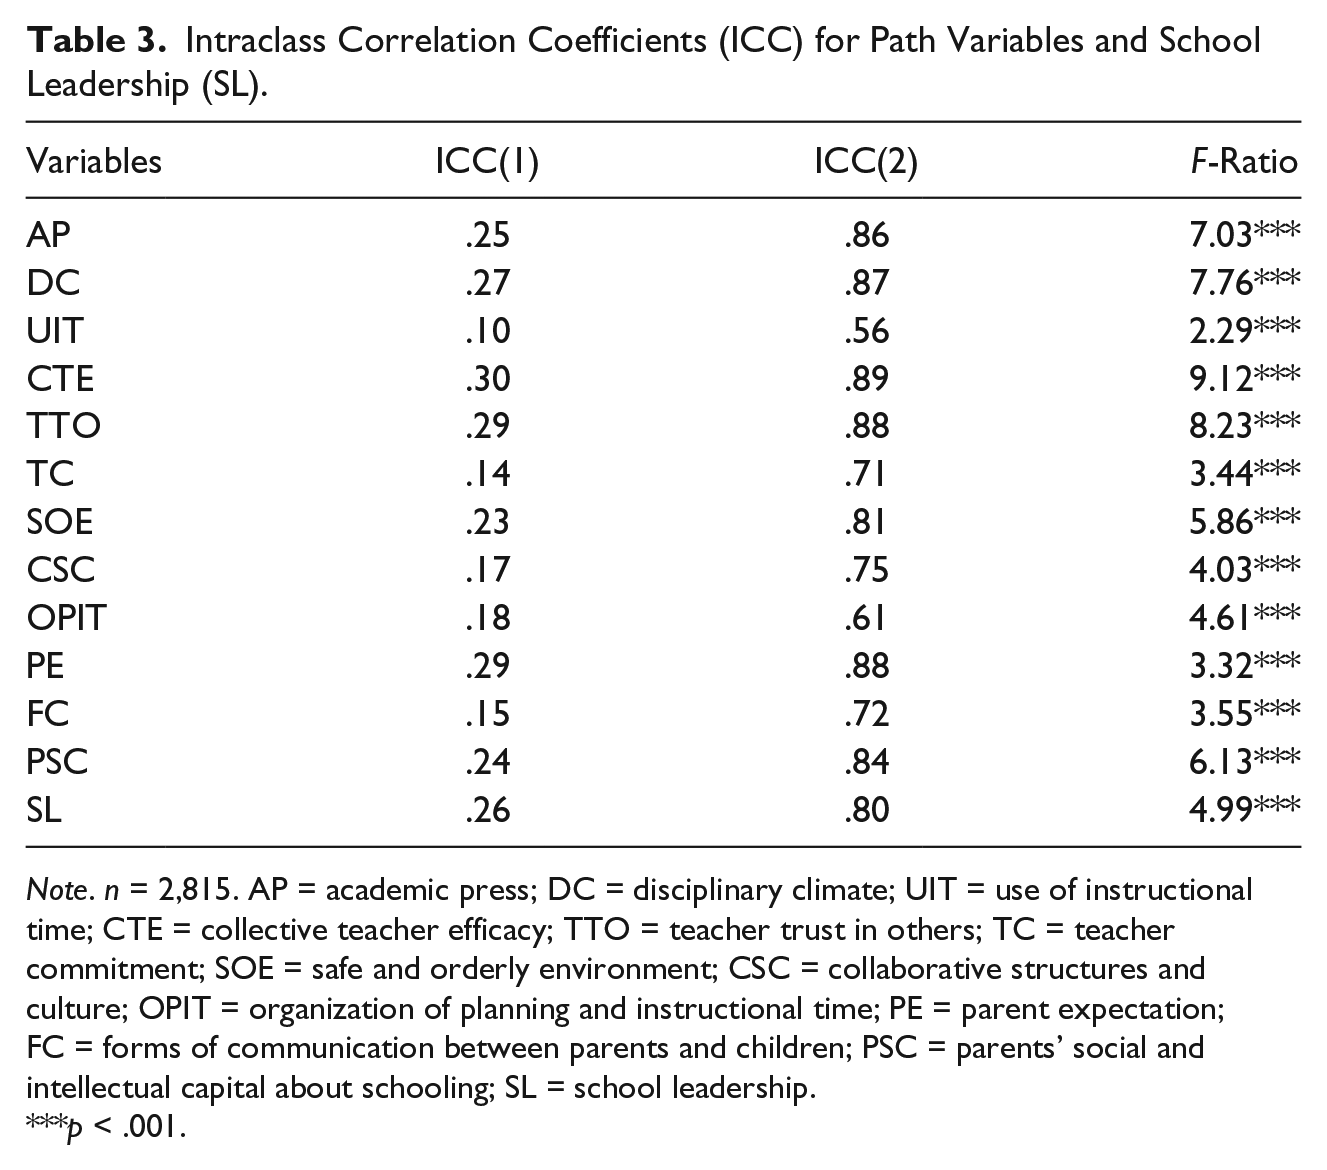
Note. n = 2,815. AP = academic press; DC = disciplinary climate; UIT = use of instructional time; CTE = collective teacher efficacy; TTO = teacher trust in others; TC = teacher commitment; SOE = safe and orderly environment; CSC = collaborative structures and culture; OPIT = organization of planning and instructional time; PE = parent expectation; FC = forms of communication between parents and children; PSC = parents’ social and intellectual capital about schooling; SL = school leadership.
p < .001.
Four regression analyses were conducted to estimate the contribution of each of the four paths (resulting from the CFA factor loadings) to student achievement. As well, as the overall contribution of each of the four paths, controlling for student SES, was estimated first using multiple regressions. Then using stepwise regression, variables with the most influence on student learning were identified among all the variables populated on each path (see findings for Research Question 1). A structural equations model was tested to determine the contribution to student achievement of each of the aggregate four paths, as well as the indirect effects of SL on achievement through the four paths (see findings for Research Questions 2 and 3).
Rational path variables
Classroom instruction was eliminated from the regression analysis because of a .02 correlation with achievement. Regression analysis indicated that, among the remaining three variables on the rational path, DC was the primary influence on student achievement (counteracting the negative impact of students’ economic status) followed by UIT. These results largely replicate results of Study 2, whereas Study 1 found that AP and DC had similar effects but UIT had no effect
Results of this study, as well as Study 2, endorse the promise of a composite or latent variable labelled academic culture (Leithwood & Sun, 2018). This composite variable, combining AP, DC, and UIT makes significantly greater contributions to student learning than any of the three composite variables alone; it is also a powerful mediator of SL effects on student learning. “Focus and opportunity” are the theoretical grounds on which attention to academic culture is justified. AP and DC focus both teachers and students on the academic goals of the curriculum and help minimize distractions from pursing those goals. Using most of the instructional time in the classroom for teaching and learning without many other distractions, provides students with opportunities to be meaningfully engaged in acquiring those academic goals.
While the .02 correlation of CI with achievement resulted in this variable being dropped from additional analyses, it does warrant further attention. The most plausible explanation for these results, in our view, is the difficulty teacher respondents often have articulating the nature of their own instruction. Louis et al. (2010), for example, reported substantial differences between teachers’ interview accounts of their CI and subsequent classroom observations of those practices. Furthermore, using school leader ratings of CI based on the same scale slightly adapted so school leaders rated their teachers’ CI, Study 2 found a significant correlation (.59) between student achievement and CI. These results are consistent with self-rater halo effects reported in much of the literature on performance appraisal (Bass & Yammarino, 1991), as well as recent evidence about the superior predictive validity of teacher versus principal ratings of principal leadership (Zheng, Li, Chen, & Loeb, 2017). These results suggest that ratings of CI included in future research should not likely depend solely on teacher respondents.
Emotions path variables
Results of regression analysis indicated that CTE was the primary influence on student learning on this Path (β = .18). This result adds to considerable amounts of evidence confirming the important contributions to student achievement of CTE. Both individual and collective efficacy make impressive contributions to performance, whether the performance of students (e.g., Pajares, 1996), teachers (Goddard et al., 2000) or school leaders (Leithwood & Jantzi, 2008). CTE is nurtured by school leaders when they help clarify school goals, provide meaningful capacity-building and collaborative opportunities for staff, such as participation in a professional learning community (Voelkel & Chrispeels, 2017), and engage staff authentically in school decisions (Brinson & Steiner, 2007).
Organization path variables
Regression analysis indicated, as in Study 2, that SOE had a larger impact on student learning (β = .18) than either CSC (β = .06) or OPIT (β = −.11), although none of these effects were significant, when student SES was entered into the equation. These results provide only weak support for OPIT and seem inconsistent with the considerable weight of evidence about the value of collaboration in schools (e.g., Hill, 2010; Lomos et al., 2011). Indeed, all three studies in our series report relatively strong effects of SL on the organization path but relatively weak effects of this path on student achievement. One plausible reason for this inconsistency may be competition from other four path variables in accounting for variation in student achievement, thus supporting the value of multivariable research rather than the typically single-variable research about influences on student achievement, in the future. All things equal, these results imply that School Leaders should not expect large payoffs in student achievement for time spent improving the status of variables on this path.
Family path variables
The regression analysis indicated that PSC had a larger impact on student learning (β = .26) than either PE (β = −.08) or FC (β = −.04), however, student learning was not significant when students’ SES was entered into the equation, possibly due to multicollinearity or suppressor variable effects. The data measuring the variables on this path reflecting parents–student relationships were provided by teachers’ estimates. This may have affected the accuracy of results. Neither Studies 1 or 2 provided evidence allowing for comparisons. The prominence of PSC in this study differs from the results of Jeynes’s meta analyses (2005) awarding largest effects to PE (an effect size of .58). But the most important practical implication of these results is to recommend Family Path variables to the attention of school leaders as part of their improvement efforts.
While viewed as lying outside the legitimate boundaries of their responsibility by many school leaders and staffs (Hornby & Lafaele, 2011), parent involvement in their children’s learning is widely acknowledged to have large positive effect on students’ academic success (Henderson & Mapp, 2002). Furthermore, while all students benefit from family involvement in education, the influence of parent engagement can mitigate differences in SES and family background (Jeynes, 2011). Evidence now indicates that those features of the home that contribute most to student success at school can be enhanced by the intentional and sustained efforts of school leaders and their staffs (Bolivar & Chrispeels, 2011; Jeynes, 2018; Leithwood & Patrician, 2015). Future research should aim to extend what is known about successful strategies school leaders and their staff can use to nurture important features of the home that contribute to student success at school.
A final regression model used two approaches. The first approach included only variables with the greatest influence on student learning as identified by the previous four regression analyses (i.e., DC, CTE, SOE, PSC). These variables were entered into the equation together with SES and SL. The regression equation yielded from this approach indicated that, including SES, the four paths accounted for 69% of the variance in student achievement, F (6, 68) = 24.91, p < .001. Of this variance, SES accounted for 62%. The only significant predictor of student learning among all path variables in this model was DC; this was the result even when DC was entered as the last path variable.
It would be difficult to predict the relative effects of the variables included on the four paths from a reading of most of the research about each of these variables. A large proportion of that research has been single-variable research as, for example, studies of academic emphasis (e.g., Hoy, Tarter, & Hoy, 2006), DC (e.g., Ma & Willms, 2004) TTO (e.g., Goddard et al., 2001), CTE (e.g., Angelle & Teague (2014), and TC (e.g., Janisch & Johnson, 2003).
In multivariable studies such as this one, each variable has to share the total explained variation with other variables and take its chances on the order in which variables are entered into regression equations. Focusing more future effort on multivariable research would help build an evidence base about explanations for variation in student achievement that reflect a much broader horizon than does most of the current evidence base.
Multivariable research of this type would have considerable practical value, as well, allowing for “optimizing” rather than “satisficing” forms of school improvement decision making. As we have argued elsewhere (e.g., Sun & Leithwood, 2016), school leaders’ improvement work entails making choices about the small number of variables in their schools on which they are able to focus their energies at any point in time. So, studies that examine the relative contribution to student success of several or more variables of interest at the same time seem to produce better estimates of the real-world effects of any one variable.
A structural equation model was tested to assess the direct and indirect effects on student achievement of the aggregate four paths variables as well as the indirect effects of SL on such achievement through each of the paths. SES, the exogenous control variable, was hypothesized to have a direct effect on student achievement and an indirect effect on student achievement through the four paths. Results (Figure 1) indicate that the rational path had a significant direct effect on student achievement (λ = .42; p < .05). The effects of the emotions, organization and family paths on student achievement were not statistically significant. While these results are consistent with Study 2 results, they are at odds with the results of Study 1 which found similar significant positive effects of the rational, emotional and family paths (b = .21 to .26; p < .05) on student achievement. Considering significant correlations between the three family path variables and SES, and the nonsignificant impact of the family path on student learning may be due to multicollinearity or suppressor variable effects between SES and the three family path variables.
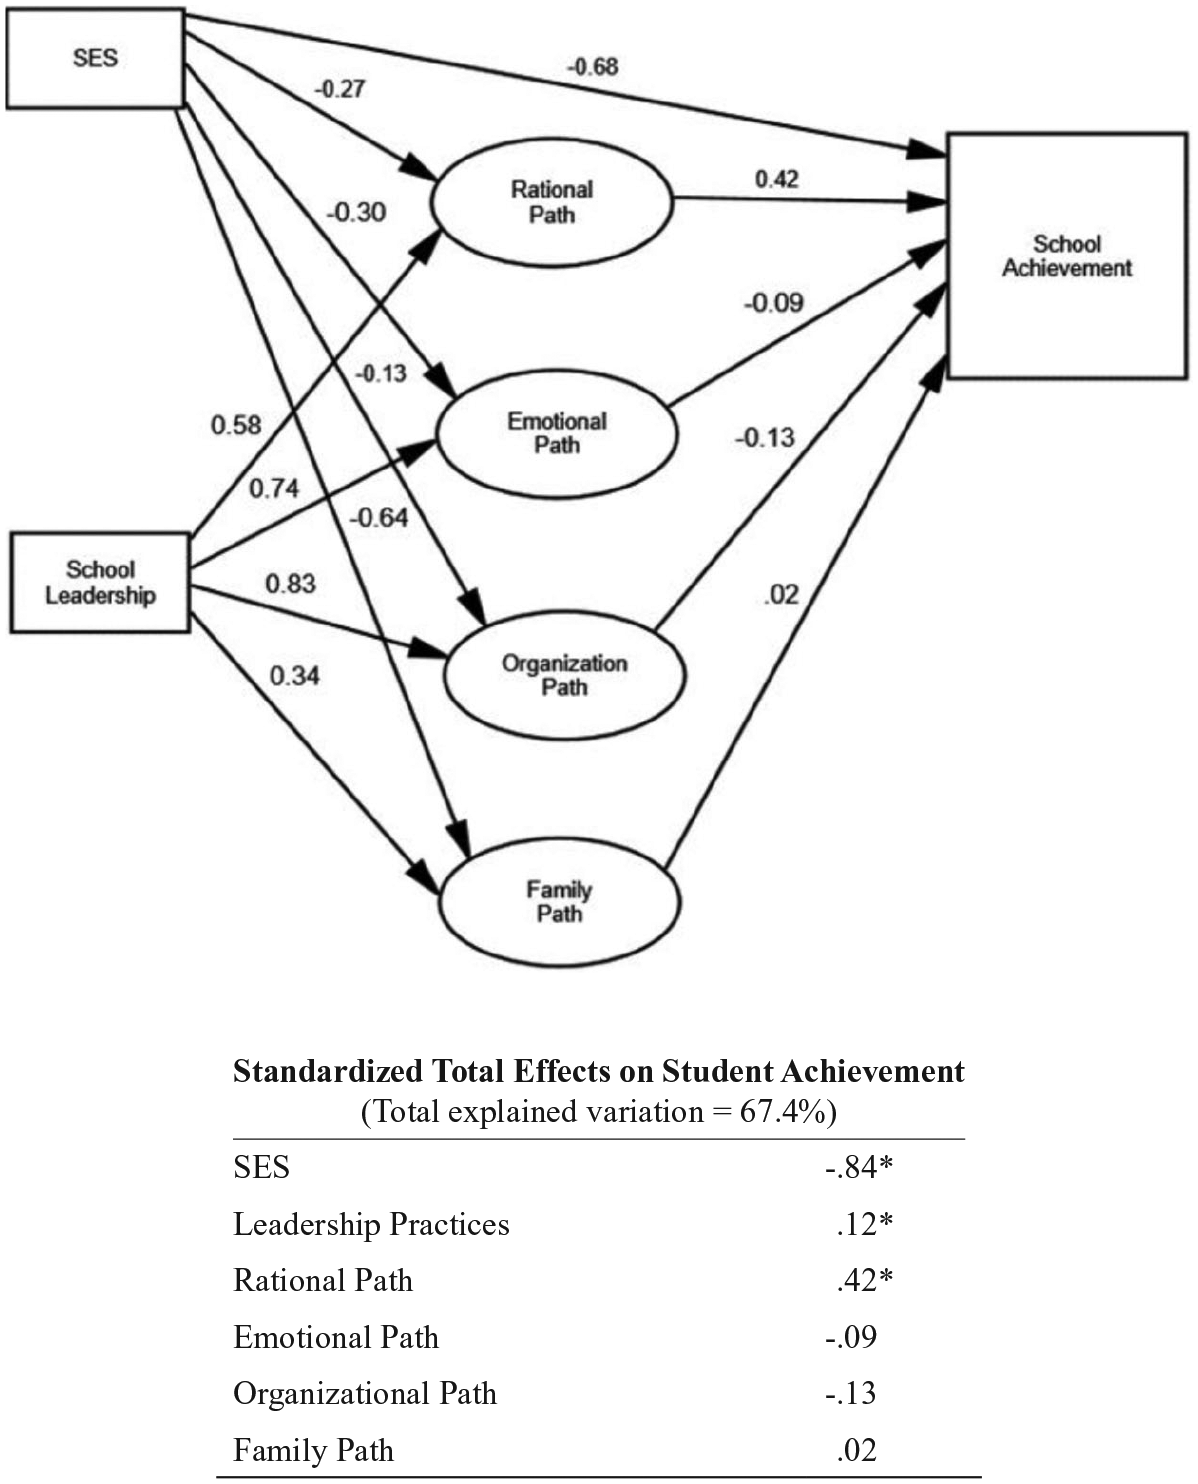
The impact of school leadership on student achievement through the four paths (N = 81).
A significant modification of the relations among the four path variables in the theoretical model is called for by these results. While the version of the four paths model tested in this study assumed significant direct effects on achievement of all four paths, along with unspecified interactions among paths, results indicated that only the rational path had significant direct effect on student achievement (Study 1 found such results for both the rational and family paths). The other paths influenced achievement through their influence on the rational path. These results raise questions about whether and how specific variables on the emotions, organizational, and family paths influence DC, AP, and UIT. For example, do changes in CTE have an influence on AP and if they do what are the mechanisms connecting the two? Logically, there are many such questions (27—a total of nine variables on the emotions, organizational and family paths and three variables on the rational path).
A careful analysis of existing research reveals fairly robust answers to some of those questions but certainly not the majority. Studies of teacher trust typically test the direct effect of such trust on achievement, sometimes speculating on mediating conditions without actually testing them (e.g., Goodard, Tschannen-Moran, & Hoy, 2001). So, one important direction for future theory and research would entail unpacking the complex relationships between variables on the rational path and variables on the other three paths.
SEM analysis (Figure 1) indicates significant direct effects of SL on all four paths—the rational (λ =.58), emotions (λ = .74), organizational (λ = .83), and family (λ = .34) paths. However, the indirect effects of SL on student achievement were achieved mainly through the rational path. School leadership explained 35.8% of the variance in student achievement through the rational path, controlling for SES. SES had a significant direct effect on student achievement (β = −.68; p < .05). The path model had an acceptable model fit (χ2 = 0.13, df = 1; p = .72; root mean square error of approximation < .05; goodness of fit index = .99).
The size of the indirect effects of SL on student achievement is remarkably similar to estimates reported in Study 1 (β = .12; p < .05), as well as by others (e.g., Heck & Hallinger, 2014) These results suggest that whatever school leaders do to influence variables on the other paths, the goal should be to ensure improvement of variables on the rational path (AP, DC, and UIT).).
Conclusion
The main limitation of the study is its use of a cross-sectional design to inquire about a problem involving change over time. The generalizability of the study is also limited because of its exclusive focus on elementary schools, even though some of the variables included in the study (e.g., family-related variables, SOE) are likely to present themselves quite differently in secondary schools. As is the case in almost all educational research, the location of the study (Texas) provides an at-least partly unique policy context with difficult to detect consequences for the results. In addition, evidence about all independent and mediating variable were provided only by teachers, likely a very knowledgeable source of evidence about SL and most of the variables on three of the four paths, for example, but not the three variables on the family path. Individual variation among students was not addressed by the study. Finally, the analyses undertaken in this study were appropriate for the sample size (81 schools) but data from at least 100 schools would have allowed the use of more powerful statistical techniques. 2
The central purpose of this study was to help unpack how school leaders contribute to improved student achievement in their schools. By testing the indirect effects of an integrated model of SL, mediated by four categories of variables, this study provided a partial answer to one of at least three questions needing answers in order to accomplish this broad purpose—What features of schools and classrooms make a significant contribution to student achievement and can be influenced by school leaders? Of course, mediating variables in addition to those included in this study might well qualify for attention in subsequent research. So, this question warrants considerable additional inquiry.
At least two additional questions need to be addressed, however, before the broader “how” question can be considered adequately answered. One of these questions is about the more specific leadership practices (or personal leadership resources) that are likely to be successful in improving the status of each of those key features mediating SL effects. The leadership model tested in this study included a relatively broad set of practices; more in-depth qualitative research would be useful in adding greater specificity to those practices for each of the most promising mediating variables. While the discussion of results (above) cited some research aimed at identifying variable-specific leadership practices, much less is known about how leaders might effectively improve the status of those variables than is known about the effects of those variables on student achievement.
Finally, the contexts in which practicing leaders work requires them to make choices about where to focus the limited time and attention available to them in the short term. Existing research has little to offer school leaders about the strategies and/ or measures they might use to diagnose the status of those key features in their schools and decide on which to focus their improvement efforts. Providing guidelines to assist with such diagnosis would a research and development project of considerable practical value.
This study was intended as a replication and extension of two previous studies referred to above as Study 1 and Study 2. Replication studies are relatively rare in the educational sciences, in general, and educational leadership studies, in particular (Makel & Plucker, 2014). Chhin, Taylor, and Wei (2018) cite evidence about replication rates across disciplines and journals typically below 1%, with comparably low rates of reproducibility. But the importance of replication has long been acknowledged (Nosek, 2015) and not all replications are equally useful. Unlike studies evaluating the effects of some sort of intervention, such as those Chinn et al. (2018) had in mind, most leadership studies are conducted in field settings with many uncontrolled variables. So, Schmidt’s (2009) distinction, cited by Chinn et al. (2018), between literal or direct and conceptual replication may not provide much guidance in interpreting the comparability of two studies. First of all, the distinction is a matter of degree since studies may differ along many dimensions (e.g., population, setting, research design, analytic techniques) and identifying the point on the continuum of each dimension where differences become too substantial to justify comparisons defies ready codification.
By way of illustration, the current study and Study 2 included the same research design, model of leadership, sets of mediating variables, variable measures and data analytic techniques. Both SES and achievement were estimated differently, the studies were conducted in different settings and respondent providing data in the two studies represented two different roles—administrators versus teachers. But the two studies produced remarkably similar result. Study 1 differed from Studies 3 in terms of setting and population and from both Studies 2 and 3 in terms of some variables and some variable measures. Studies 1 and 2 were conducted in the same settings but respondents were from different roles almost a decade apart. Results produced by Study 1 were more different from either Study 2 or the current study than were results produced by Studies 2 and 3. These findings suggest that, at minimum, replication studies about effective leadership practices and how they influence student achievement ought to include the same or very similar variables and measures. Studies that do not share those features ought likely to be called adaptations or extensions not replications.
Footnotes
Declaration of Conflicting Interests
The authors declared no potential conflicts of interest with respect to the research, authorship, and/or publication of this article.
Funding
The authors received no financial support for the research, authorship, and/or publication of this article.
