
Abstract
Introduction
One of the most dramatic curricular trends in recent years has been the expansion of policies promoting K-12 computer science (CS) education (Code.org Advocacy Coalition, 2019). Advocates of this expansion cite a range of benefits from CS education. Developing students’ CS skills is thought to give them access to high-paying and high-status jobs while improving overall economic output (e.g., Rothwell, 2014). CS curricula are also often promoted as developing abilities – such as “computational thinking” – that can help students across domains (Grover & Pea, 2013; Wing, 2006). The frequency with which K-12 schools offer and K-12 students participate in CS education has increased dramatically, with approximately half of high schools now offering CS courses (Code.org Advocacy Coalition, 2020; Scott et al., 2019).
However, researchers, policymakers, and school leaders have raised numerous concerns about expanding CS education, including ensuring equitable access (e.g., Martin et al., 2015), selecting effective curricula (e.g., Weintrop and Wilensky, 2017), and acquiring funding (e.g., Scott et al., 2019). Among these concerns are three broad administrative challenges that are the focus of this paper. First, it may be difficult to hire staff who have adequate CS knowledge and sufficient teaching skill to teach CS effectively (e.g., Delyser et al., 2018). Second, schools are under pressures to provide curricular offerings that could be crowded out by expanded CS offerings (e.g., Century et al., 2013). Third, and relatedly, schools and their leaders face accountability pressures to maximize certain student outcomes – especially in terms of math and reading proficiency – that may be harmed by diverting resources to CS (e.g., Wang et al., 2016). 1
These concerns raise pressing questions in light of continuing K-12 CS expansion: how have school systems and school leaders navigated them, and do they point to likely detrimental impacts on schools and students? Or are the concerns overstated? Answering those questions is important for understanding whether expansions of K-12 CS education are ultimately effective for students, schools, and society. Studying how schools have been affected by challenges and trade-offs related to staffing, curriculum, and accountability may also highlight which constraints on CS expansion are truly binding and help to explain why CS has expanded more for some students than others, variation that appears highly inequitable (Bruno & Lewis, forthcoming; Code.org Advocacy Coalition, 2019, 2020; Scott et al., 2019). These issues are likely to become only more salient as administrators and policymakers face continuing pressure to expand K-12 CS education.
To explore these issues at the secondary level, we use longitudinal data from California on schools, course taking, and achievement to answer three questions corresponding to the three concerns highlighted above (and discussed further below):
How have CS teachers’ experience and qualifications changed as CS course offerings have expanded? Which other courses do CS courses replace? Do coursework trade-offs have implications for student scores on statewide standardized math or English/language arts (ELA) tests?
We find that CS course expansions have not been associated with decrements to CS teachers’ experience, certification, or education. This is likely due in part to flexible subject-area authorization requirements for CS teachers, though these may mean many CS teachers lack sufficient preparation to teach CS specifically. Within schools over time, CS enrollments are associated with lower enrollment rates in social studies, ELA, arts, and other miscellaneous elective courses, suggesting those may be the courses CS courses are replacing. However, we find no evidence that CS course taking has significant effects on students’ math or ELA test scores, at least at currently observed levels of CS participation. California’s scale and diversity make understanding the trade-offs observed in the California policy context important for policy makers and administrators across the country.
Background
The High-School CS Context in California
California’s high schools have seen substantial growth in CS course availability driven by advocacy throughout the state. For example, the Los Angeles Unified School District was the home of the original Exploring Computer Science course offerings in 2008 (Goode et al., 2012; Goode & Margolis, 2011). California has also adopted K-12 standards for CS (Lambert, 2018) and more recently a strategic plan to guide CS expansion (Lambert, 2019). The curricular effects of these and similar initiatives can be illustrated using publicly reported data on courses offered in California’s public schools each fall. These data are a primary component of our analyses, so we describe them in greater detail below. As shown in Figure 1, 57% of the state’s high schools offered at least one CS course in the fall of 2018, up from 31% in 2003. Moreover, in our sample, schools that offer CS tend to be larger than those that do not. Consequently, the share of high-school students in California attending a school offering CS is even higher: 79%. That latter figure is 34 percentage points higher than in 2003 and is more than double the analogous figure in 2010.
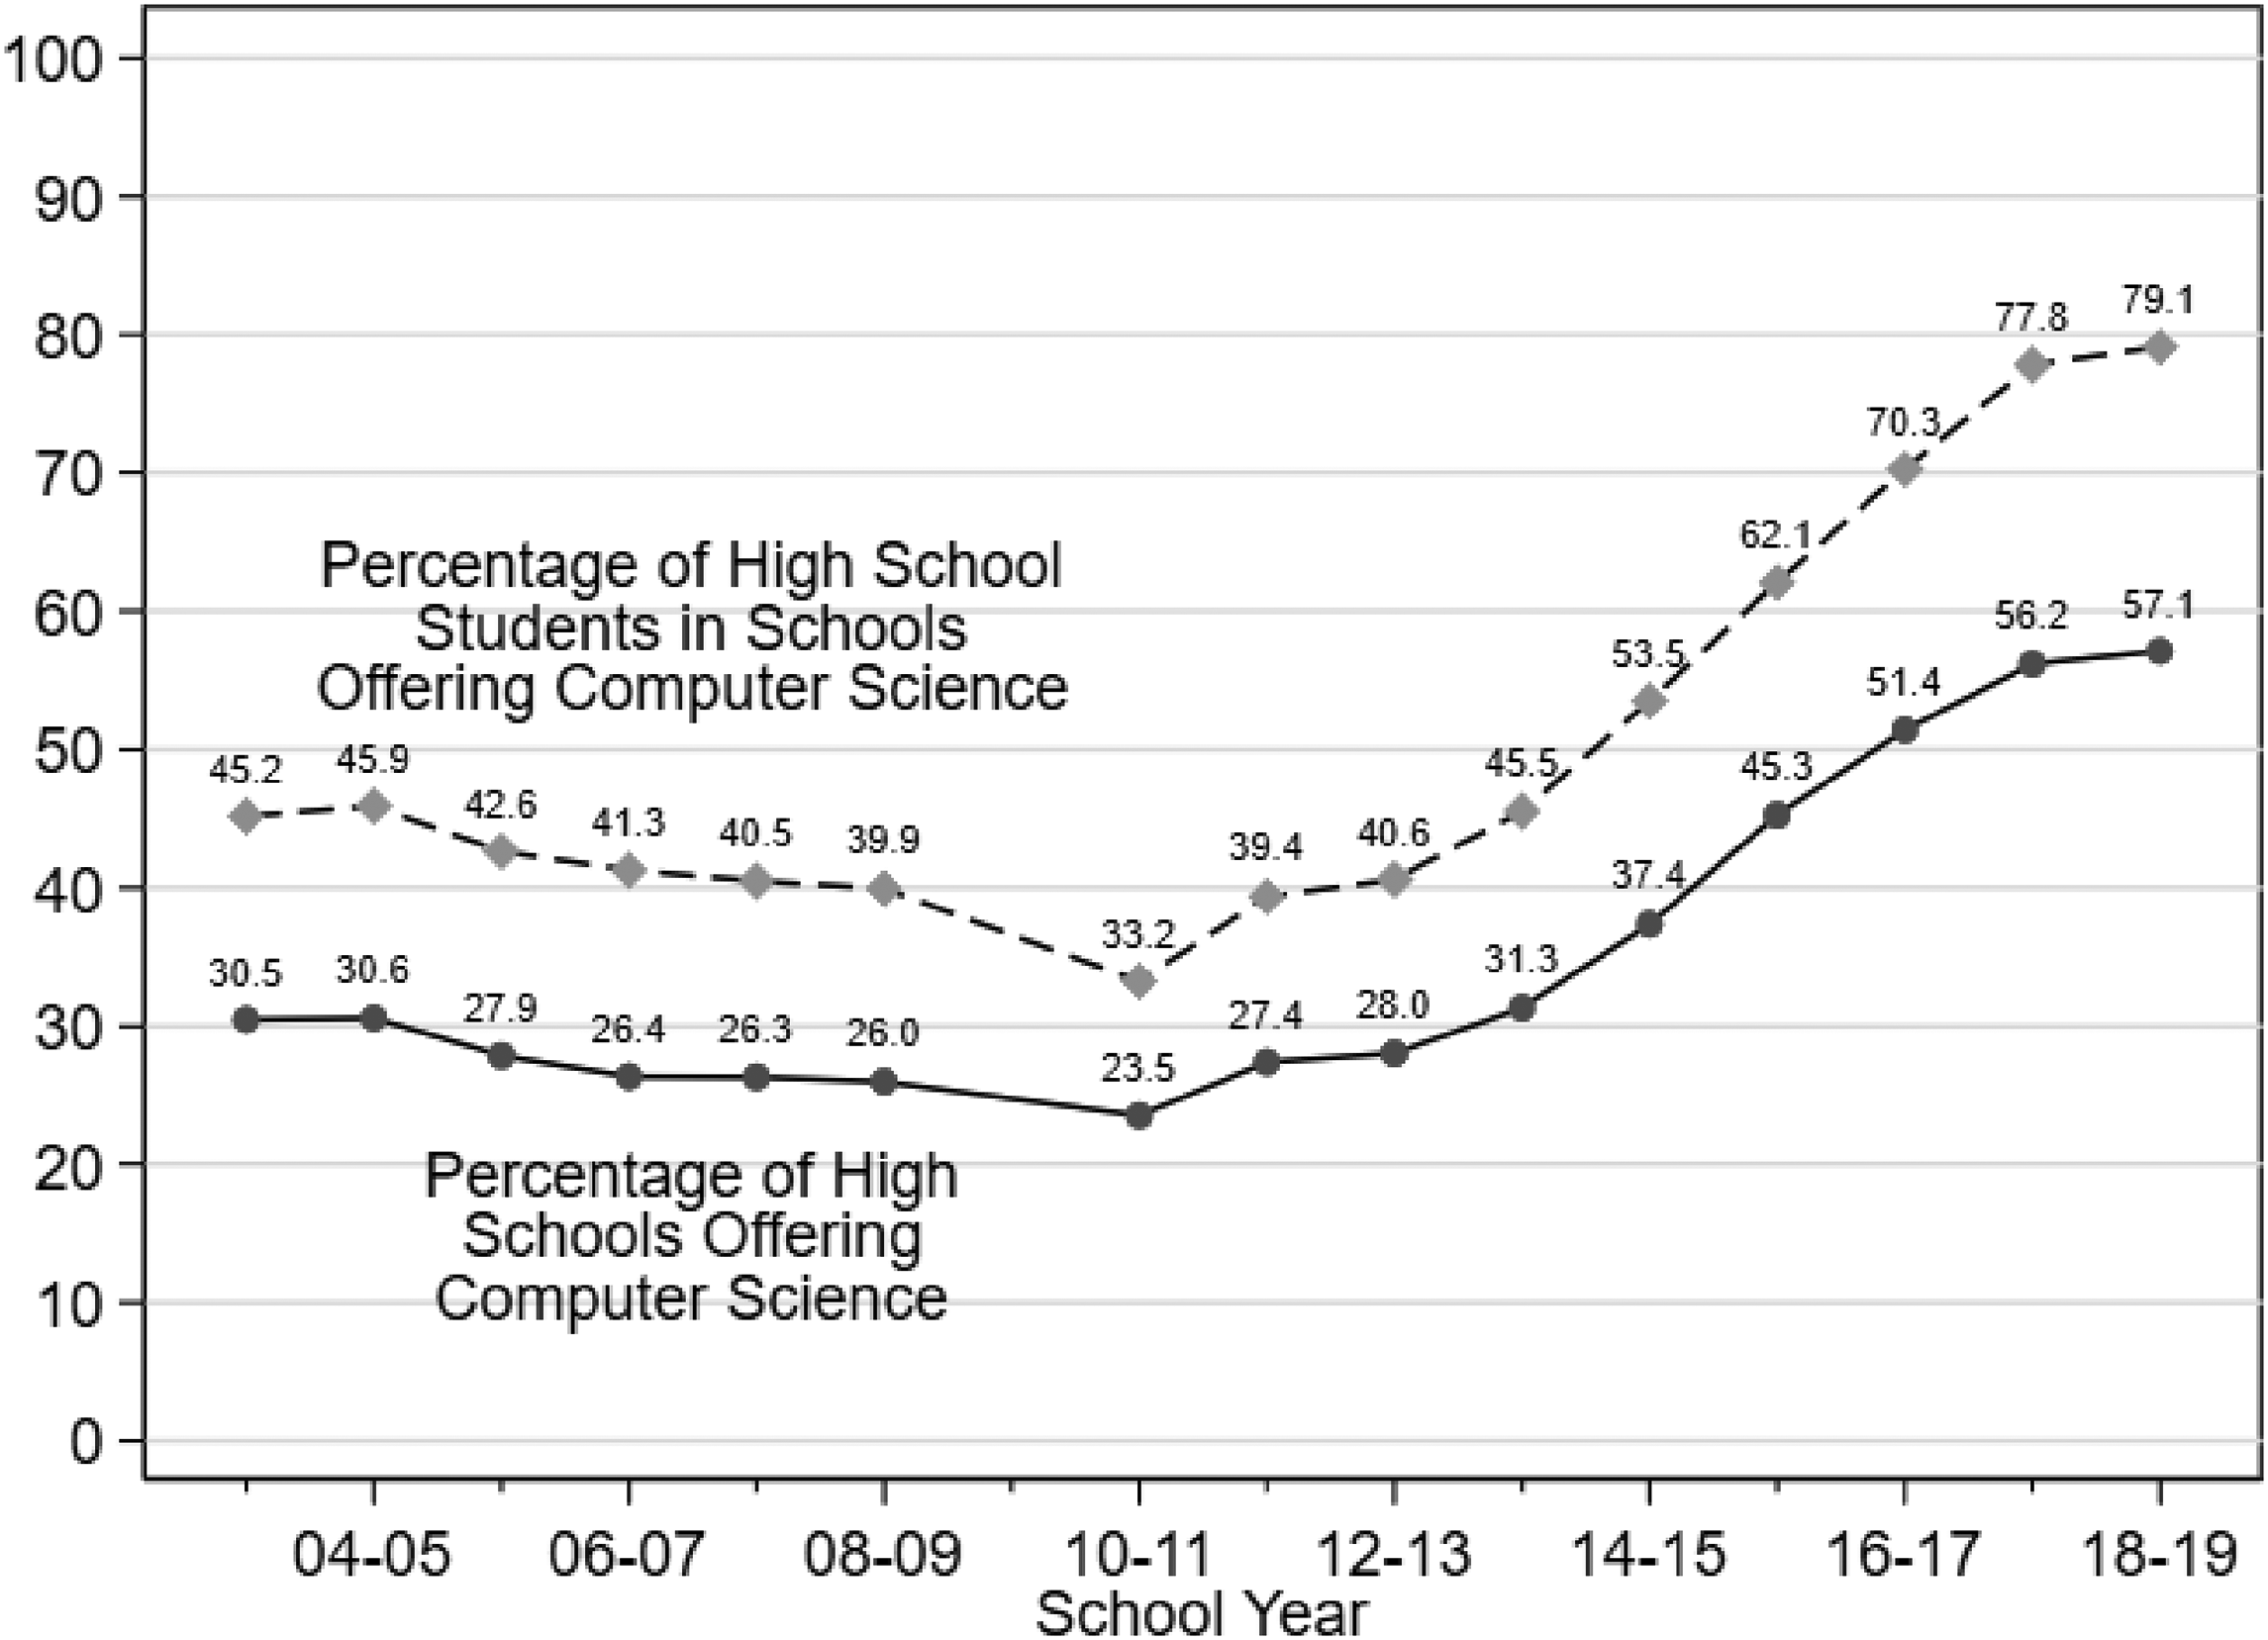
Computer science availability in California high schools. Authors’ calculations from course data reported each fall by the California Department of Education.
Unsurprisingly, this proliferation of CS courses has been accompanied by substantial increases in student enrollment in CS courses. As discussed in more detail in the data section below, because we do not observe individual student data we cannot describe how many unique students enroll in CS classes. However, we can observe how many enrollments are in each course, and therefore in all CS courses combined. As Figure 2 illustrates, in the fall of 2018, CS courses in California’s high schools accounted for more than 100,000 student enrollments, a more than four-fold increase from 2003. Similarly, by 2018, those CS course enrollments accounted for 0.82% of all high-school course enrollments, up from 0.24% in 2003.
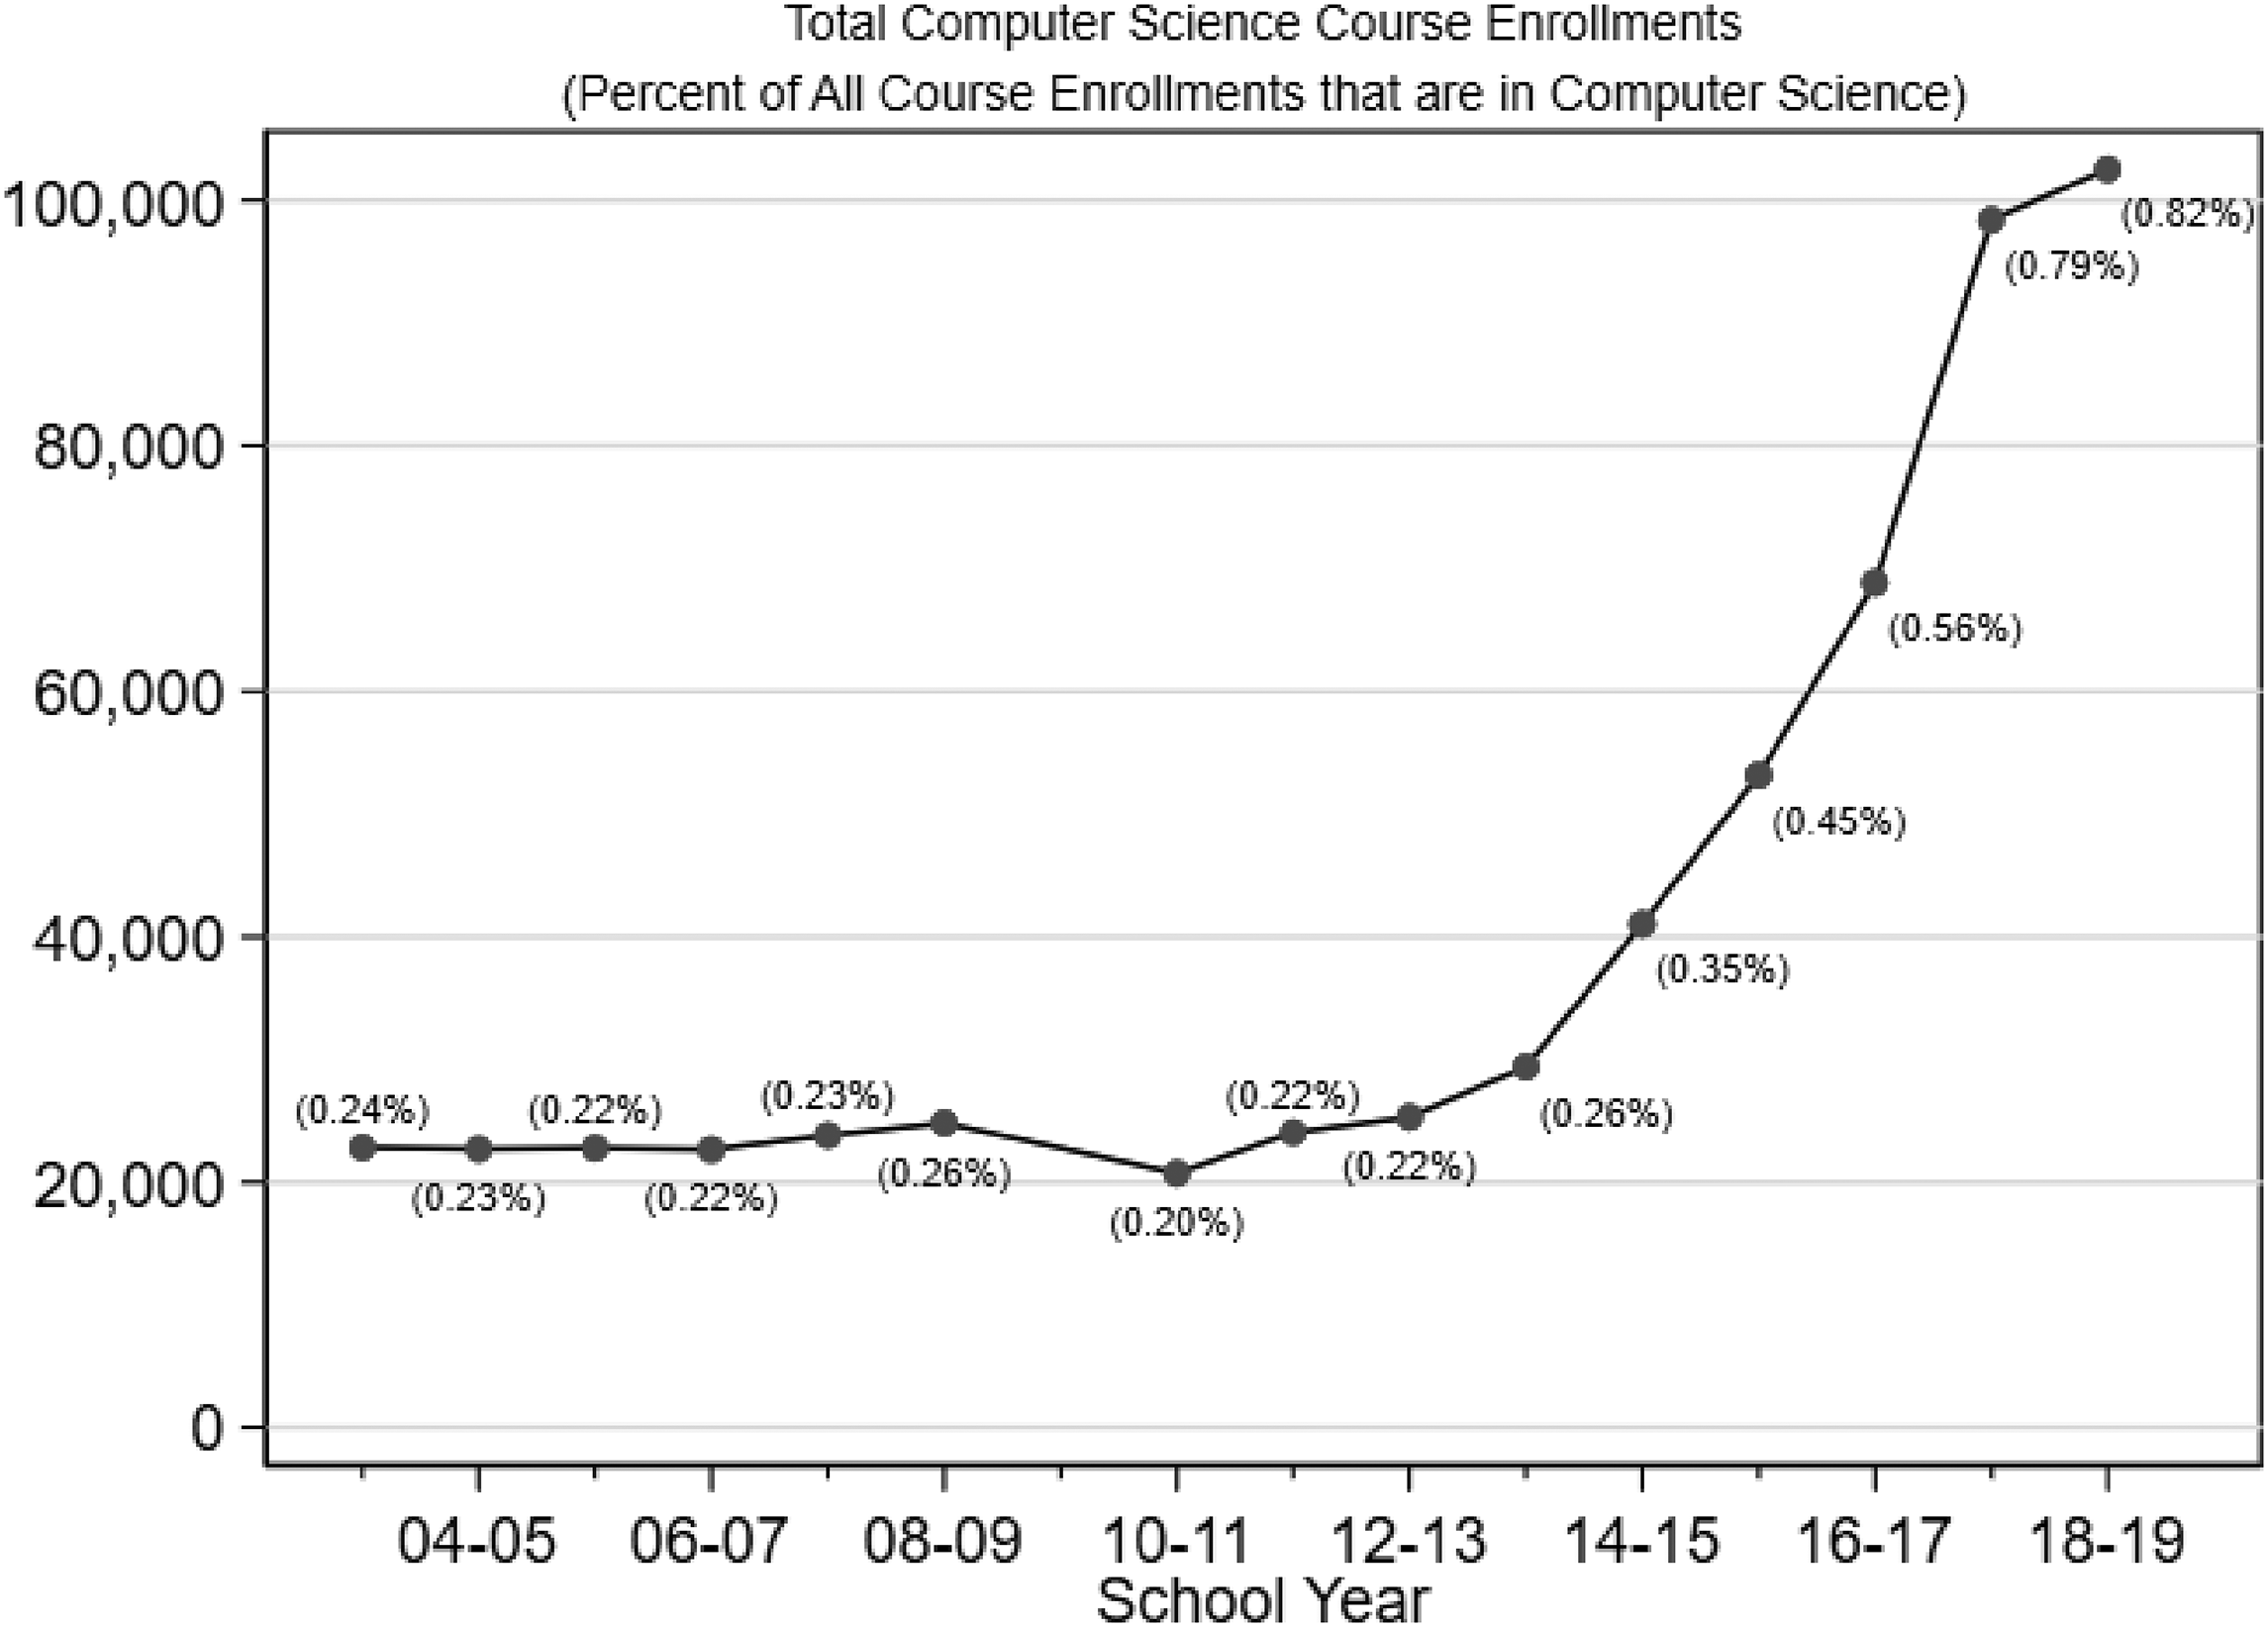
Computer science (CS) course enrollments in California high schools. Authors’ calculations from course data reported each fall by the California Department of Education. Values on the y-axis indicate the total number of enrollments in CS courses each fall. Labels in parentheses indicate the percentage of all course enrollments those CS enrollments represent.
Importantly, California’s high-school CS expansions have not been equitable (Scott et al., 2019). For example, Bruno and Lewis (forthcoming) find that Black, Hispanic, and Native American students are less likely than students of other races to be enrolled in CS, and this can be explained in large part by the lack of availability of CS courses at their schools. They also find that women are less likely to be enrolled in a high-school CS class despite having similar access to CS courses at their high schools as men on average, though they do not consider women of color specifically.
Framework and Motivation
As discussed above, the expansion of high-school CS raises questions about how schools have managed this expansion. And, as noted above, the potential challenges facing the expansion of CS education are numerous. It is therefore useful to begin with a framework to organize these challenges, and to do so we adapt a framework proposed by Fletcher and Warner (2021) to facilitate thinking about the preconditions for equitable CS expansion, as these preconditions are similarly salient for CS expansion generally. In their CAPE framework, schools must first have the capacity to offer CS (e.g., qualified instructors). The existence of capacity allows attention to turn to whether and how students will have access to CS (e.g., as determined by course offerings and prerequisites), which in turn raises questions about the extent to which students participate in CS (e.g., enrollment levels and disparities). Only once students are participating in CS education can attention be turned to the quality of students’ experiences in CS education.
The CAPE framework has two advantages for our purposes. First, because it was developed for CS education specifically, it highlights challenges that are particularly salient in CS contexts (e.g., because capacity issues may be greater in a newer, more technical domain like CS). Second, the CAPE framework shifts attention from “end-of-the-line measure[s] of success” for CS expansions “to the entire ecosystem of CS education” (Fletcher & Warner, 2021, p. 23). This is appropriate for thinking about the policy and administrative challenges that we’re most directly concerned with, which are important for – but one or more steps removed from – the student and social objectives CS expansions are intended to achieve. Specifically, our research questions focus on two aspects of schools’ capacity for CS education. First, what teachers do schools have to teach CS courses? And second, given that schools have limited time and are accountable for delivering specific content to students, do schools have the time and curricular space to offer CS courses? As the CAPE framework emphasizes, these kinds of capacity issues are foundational for other educational CS objectives school systems might have.
We operationalize these capacity issues by considering three factors, corresponding to our three research questions above, that are likely to be salient for school leaders and policymakers considering expanding CS coursework: (1) teacher qualifications; (2) curricular trade-offs; and (3) accountability for test scores. We now briefly summarize what prior research tells us about why each of those factors is likely to be important to administrators, policymakers, and the general public when weighing and navigating expansions of K-12 CS.
Teachers’ experience and qualifications (RQ1) – background
The overall benefits of offering additional CS courses will depend in part on who administrators can find to teach them. Teacher preparation programs in California generally do not prepare a dedicated supply of CS teachers. Rather, under state guidelines, authorizations to teach math, business, industrial and technology education, or career technical education (CTE, i.e., vocational education) also each authorize teachers to teach at least some CS courses. Additionally, administrators can receive temporary waivers of authorization requirements if they are unable to find teachers who meet them.
Because they allow a variety of entrance points into CS classrooms, these authorization requirements may make it possible for administrators to staff any CS courses they choose to offer. However, without a corresponding pipeline of teachers prepared to teach CS specifically, expanding course offerings in CS could produce shortages of highly skilled CS teachers even if teachers with strong general (i.e., not CS-specific) qualifications are authorized and available.
Work dating back to the 1970s has recommended certification programs for CS teachers and emphasized the need to ensure CS teachers have both CS content knowledge and knowledge about how to teach CS (Poirot & Early, 1975; Statz & Miller, 1975). Yet even recent work finds that “inconsistent teacher certification requirements have led teachers from other content areas to teach computer science with limited training” (Delyser et al., 2018, p. 14), and that CS teachers continue to be challenged by both CS content and CS pedagogy (Sentance & Csizmadia, 2017; Yadav et al., 2016). At the same time, the Computer Science Teachers Association (CSTA) Curriculum Improvement Taskforce drew attention to the possibility of overly restrictive authorization requirements contributing to teacher shortages by discouraging applicants (The CSTA Curriculum Improvement Task Force, 2005).
Nevertheless, evidence on the actual qualifications of CS teachers is scarce. A 2012–2013 survey of CS teachers affiliated with the CSTA collected information about CS teachers’ college-level CS coursework and years of CS teaching experience (Century et al., 2013), but similar data are not available for current teachers in California. That survey found that CS teachers often have a range of subject area backgrounds and teach primarily other subjects, especially mathematics. At the time of this writing, CS authorization programs are just launching in California and have produced relatively few teachers with CS-specific authorizations. Regardless, teachers with the CS authorization will still hold a primary credential in a different area and CS teachers must necessarily still be recruited primarily from subject areas already facing teacher shortages (Darling-Hammond et al., 2018; Goldhaber, Strunk, et al., 2018).
If administrators are concerned with the CS-specific qualifications and skills of their CS teachers, they may also face a trade-off between those qualifications and teachers’ general qualifications. For example, the relative newness of CS courses may mean that CS teachers are relatively inexperienced, and teachers’ years of experience have been shown to be important contributors to their effectiveness (Papay & Kraft, 2015; Wiswall, 2013). And though most educational credentials appear to have at most modest associations with teacher effectiveness (Buddin & Zamarro, 2009; Chingos & Peterson, 2011; Clotfelter et al., 2007; Goldhaber & Brewer, 2000; Kane et al., 2008), administrators may nevertheless be concerned about being able to find teachers prepared to teach CS who also have credentials comparable to their other teachers (e.g., because fully-certified teachers are less likely to turn over; Redding and Smith, 2016). How administrators navigate or should navigate these staffing trade-offs is not well understood, but they are likely to pose substantial barriers for school leaders considering CS expansions in addition to having potentially important implications for students.
Course replacements (RQ2) – background
Enrolling in a CS course will generally prevent a student from enrolling in some other course. 2 The implications of taking CS rather than another course are perhaps most salient for students. Not only do different courses offer opportunities to acquire different knowledge or skills, they may also serve different roles as prerequisites for later opportunities. Perhaps most notably, California has statewide minimum coursework requirements for high-school graduation, and districts vary in whether they impose additional requirements of their own and in whether they allow CS courses to meet those requirements. CS courses also vary in whether and how they are approved to satisfy admissions requirements to schools in the University of California (UC) and California State University (CSU) systems (Regents of the University of California, n.d.). Whatever the advantages of taking CS courses, students must balance them against the opportunity costs associated with not taking alternatives. Not surprisingly, then, administrators report that “no room in the timetable” and CS electives being “less important” than other courses as leading reasons students choose not to participate in CS courses (Computer Science Teachers Association, n.d.).
There is evidence that school leaders care about these trade-offs as well (Israel et al., 2015). Century et al. (2013) find in interviews that administrators see CS courses as competing with other elective courses. One administrator reported that “students are choosing from music, the arts, some of the athletic stuff” (p. 19), while another commented that students have few elective slots, making them “scarce real estate” (p. 19). Similarly, Wang et al. (2016) find in a survey that 22% of principals and 39% of superintendents agreed with the statement “There are too many other courses that students have to take in order to prepare for college.” Thus, even when there is demand from students for CS courses, administrators may be deterred from offering them due to countervailing concerns about the importance of other courses.
To date, there is no large-scale empirical evidence about which courses are crowded out by CS courses in practice. Suggestive evidence is provided by Darolia et al. (2020). They find that among high-school graduates matriculating to 4-year public universities in Missouri, the availability of additional science, technology, engineering, or math (STEM) courses in high school does not meaningfully increase STEM course participation because they substitute almost entirely for existing STEM courses. This may indicate that CS courses, qua STEM courses, draw enrollment from relatively similar (e.g., other STEM) courses, potentially mitigating concerns about curriculum narrowing. However, they do not consider CS courses specifically, and course substitution effects may be different for all students than for college-going graduates.
Student test scores (RQ3) – background
Closely related to curricular trade-offs are the implications of CS coursework for student achievement. This may be particularly salient for school leaders because if students substitute CS for other courses, this may reduce student learning – and thus test scores – in other subjects. Perhaps most salient are the subjects for which students are assessed on statewide standardized tests, most commonly math and ELA. If CS coursework prevents students from taking math or ELA coursework, this could reduce their performance on these tests, lowering their schools’ aggregate performance and subjecting their administrators to heightened accountability pressure. There is evidence that test score concerns matter for school leaders considering CS expansions specifically (Israel et al., 2015). Wang et al. (2016) report from their survey that 47% of principals and 52% of superintendents agreed with the statement “We have to devote most of our time to other courses related to testing requirements, and CS is not one of them.”
Implicit in these concerns is the assumption CS coursework will not improve students’ performance in other areas. If learning CS has spillover benefits to other subject areas for students, CS courses could potentially be a “win-win” for administrators by giving students the opportunity to learn important CS skills while also improving their performance on the standardized tests often used to evaluate schools.
The possibility that CS curricula can improve students’ non-CS outcomes has been a common focus in both CS education advocacy and previous research, though the empirical evidence is somewhat mixed. A meta-analysis found that learning computer programming is associated with improvements in students’ creative thinking, mathematical skills, metacognitive skills, reasoning skills, spatial skills, and school achievement (Scherer et al., 2019). However, relationships with achievement were smaller than with other domains, many studies were dated, and the authors note evidence that methodological weaknesses and publication bias may be inflating estimates of benefits to other domains. Moreover, only 21% of the studies they consider involved students in secondary schools, and there may be important differences in transfer based upon age. For example, Lewis and Shah (2012) identified overlapping skills like multiplication and angle measurement likely explain the correlation they found between students’ fourth-grade math performance on a standardized test and their performance on CS quizzes.
In sum, while students may learn valuable skills in CS courses, it is not clear to what extent that will improve their performance in other domains. Even if learning CS has spillover benefits for other subjects, school leaders are nevertheless concerned in at least some cases that providing students with additional CS learning opportunities will hurt their standardized test scores. In addition to mattering for the students themselves, this may inform administrators’ decisions about whether to allow or encourage students to take more CS coursework.
Data from the California Department of Education (CDE)
Our analyses use public school- and staff-level data from the California Department of Education (CDE), released annually between the 2003–2004 and 2018–2019 school years. We restrict our school sample in two ways based on CDE school classifications. First, because detailed course data are generally not available from the CDE for earlier grade levels, we keep in our sample schools classified as high schools or as offering high-school-level instruction (e.g., K-12 schools). Second, we include only schools classified as traditional schools (a category that includes charter schools), alternative schools of choice (e.g., magnet schools), or state special schools serving students who are deaf or blind. This retains schools serving the large majority of high-school students in the state and excludes primarily schools for which detailed course data may not be available or reliable (e.g., continuation or community day schools).
The CDE data files include each course offered by each school every fall, except during the 2009–2010 school year, when course data were not released. Each course is assigned a code indicating its name and content (e.g., music theory or United States history) and course codes are further grouped into subject areas (e.g., music or social science). 3 We classify courses into 11 mutually exclusive categories based on their content: (1) computer science, (2) art, (3) business, (4) engineering, (5) ELA, (6) languages, (7) math, (8) physical education (P.E.), (9) science, (10) social science, and (11) other. These categories roughly correspond to the “subject” (or departmental) classifications used by the CDE. The most significant departure from the CDE subject classification is that we include CS courses as their own category, while for the CDE they are indicated as either “computer education,” “information and communication technology,” or “manufacturing and product development” courses; we classify non-CS courses in those subject areas as “other” courses. The courses we classify as CS are shown in Table 1. 4 A limitation of these data is that we do not observe course taking for individual students. Rather, the CDE provides information not only on each (fall) course’s content, but also on the number of students enrolled. Additionally, each course is linked to a teacher’s staff identifier.
Courses Classified as Computer Science (CS).
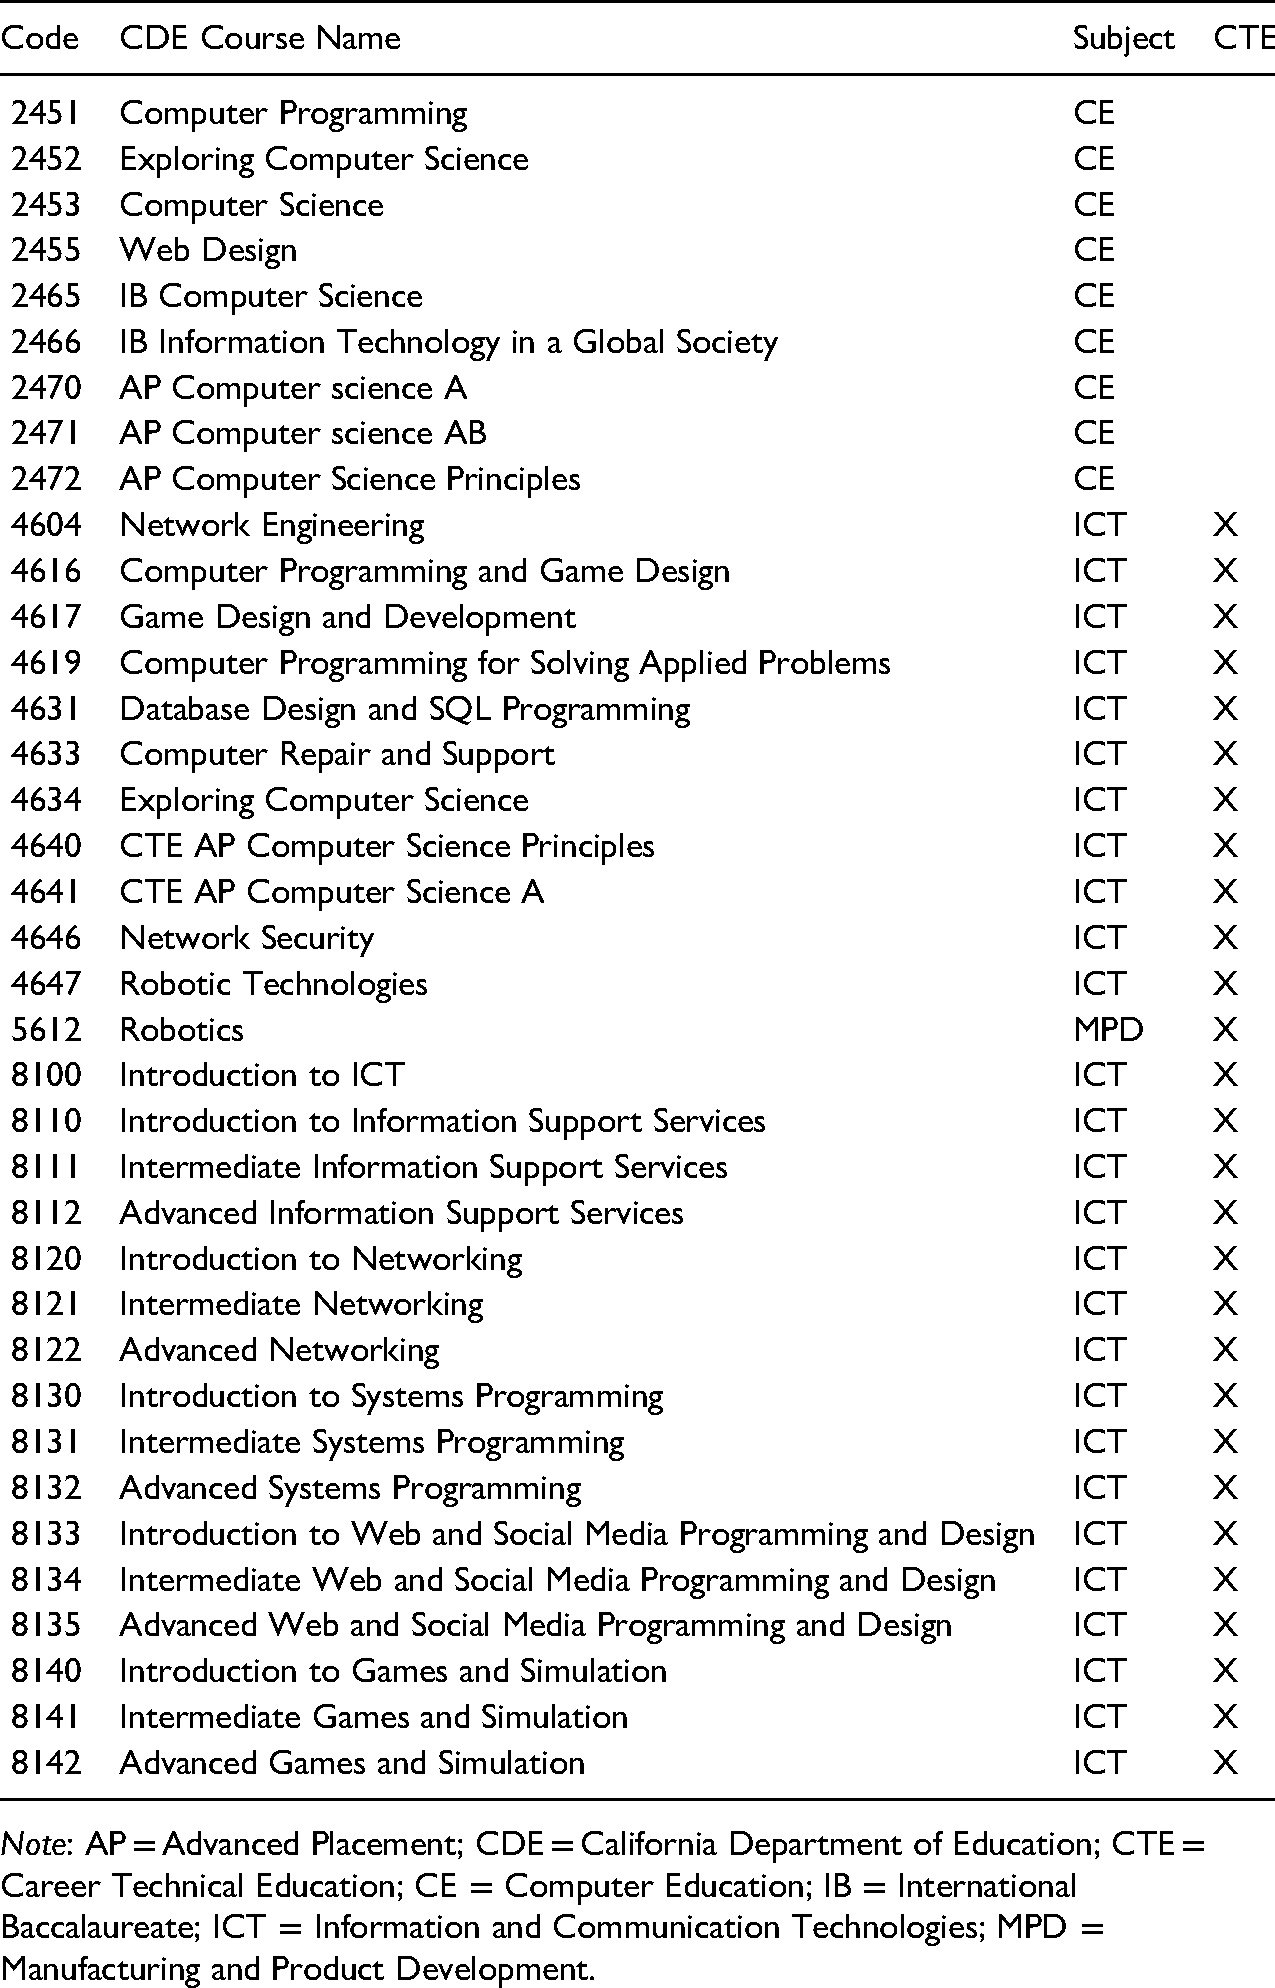
Note: AP = Advanced Placement; CDE = California Department of Education; CTE = Career Technical Education; CE = Computer Education; IB = International Baccalaureate; ICT = Information and Communication Technologies; MPD = Manufacturing and Product Development.
The staff identifiers in the course data allow us to link each course to staff-level data files that include information about teacher characteristics commonly used to measure teacher quality, including years of prior experience and highest level of education (Goldhaber, Quince, et al., 2018; Nguyen & Redding, 2018). We also observe whether the teacher is working with a certification that indicates that they have completed a traditional preparation program, as opposed to being enrolled in an alternative certification program or having some kind of emergency authorization to teach. In addition to sometimes serving as indicators of teacher quality, these certification measures can shed light on whether school leaders are navigating teacher shortages (Carver-Thomas & Darling-Hammond, 2017). Finally, these staff data also include the specific subjects that teachers have been authorized to teach. Though no authorization is available to teach CS specifically during the period we study, these authorization data provide some information about the academic and professional backgrounds of CS teachers.
Finally, we incorporate other school-level data made public by the CDE. These data include both the total number of students enrolled in the school and the number of enrolled students by race or who are English language learners or eligible for free or reduced-price lunch. As school outcome data, we use the CDE’s public files documenting students’ performance (aggregated to the school level) on statewide standardized tests in math and ELA. This is complicated by the fact that in the 2013–2014 school year the state transitioned from the Standardized Testing and Reporting (STAR) testing regime to a new set of math and ELA tests aligned to the Common Core State Standards, the California Assessment of Student Performance and Progress (CAASPP). To facilitate comparisons across these testing regimes, we focus on students’ scores in eleventh grade, when students were tested in both subjects under both regimes. We consider both the percentage of students who are considered at least proficient in each subject and students’ mean scale scores. We standardize school-level mean scale scores to have a mean of zero and standard deviation of one across all schools in our sample in each year. 5 Summary statistics are presented in Table 2. Because schools in some cases have no students in tested grades, the CDE frequently does not report school-level test scores when the number of tested students in the school is small, and no CAASPP scores were reported publicly in the first year of implementation (2013–2014), roughly 20% of our overall sample lacks test score data. 6
Summary Statistics.
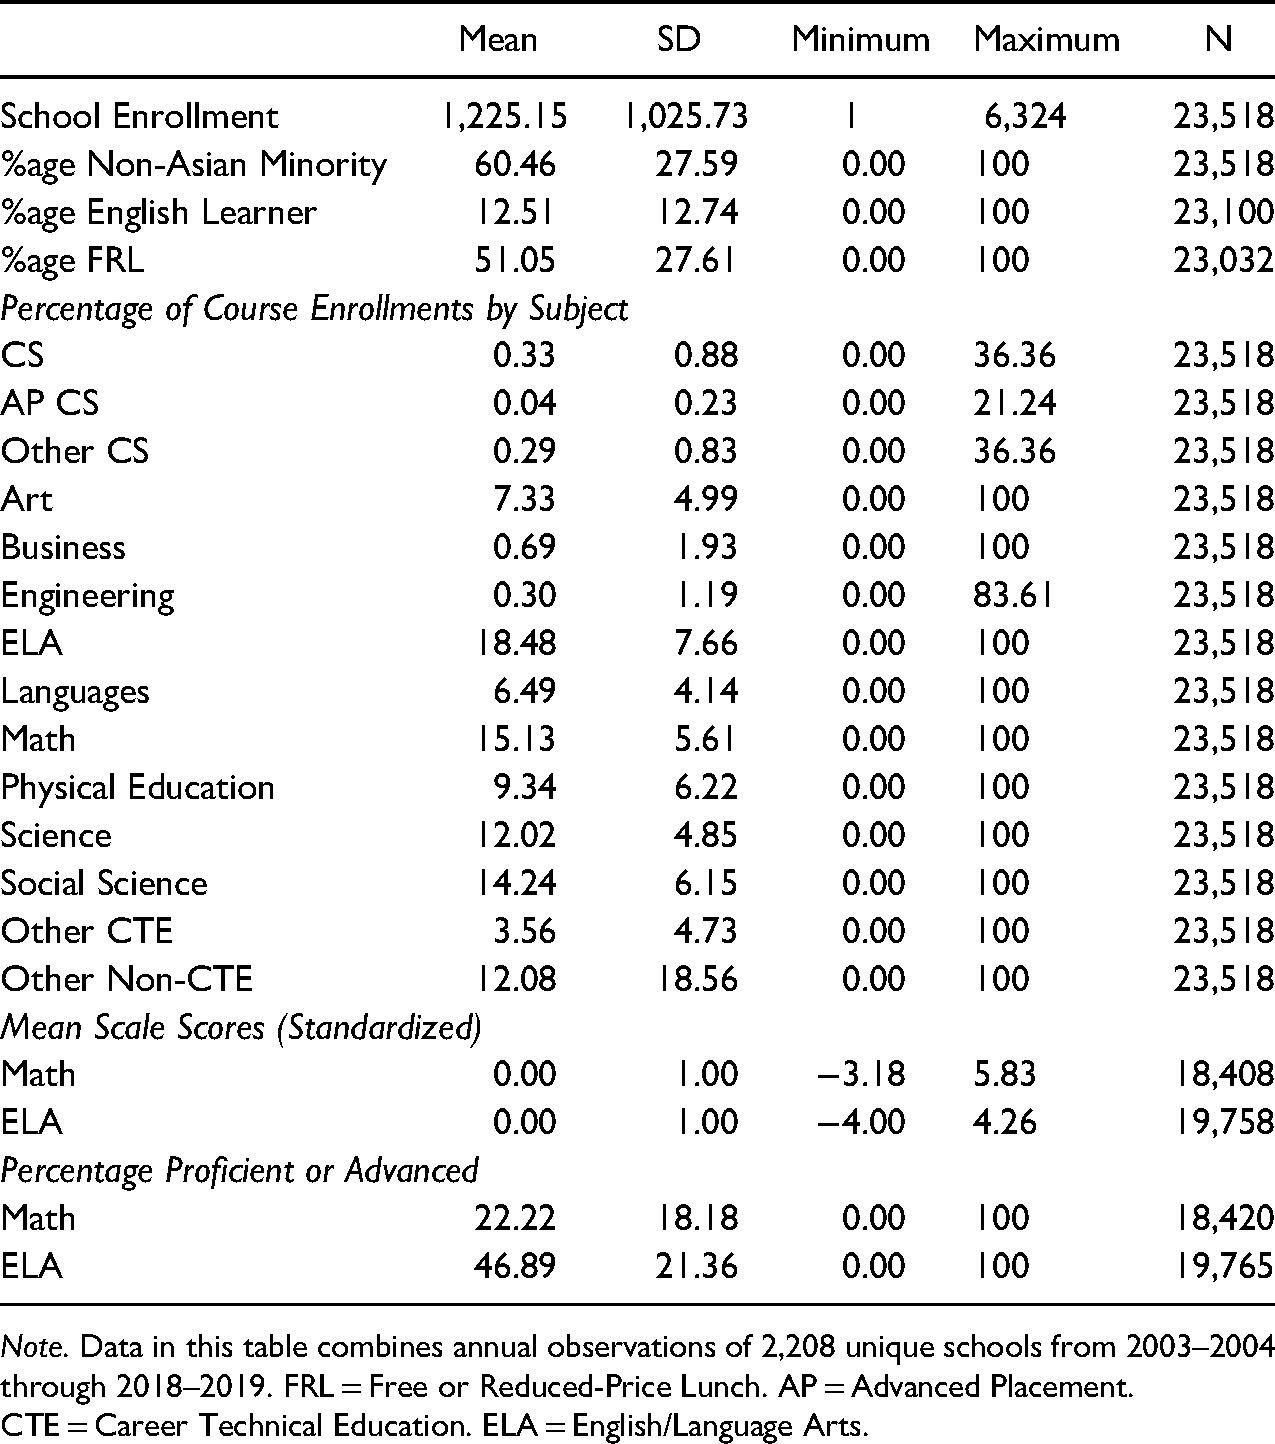
Note. Data in this table combines annual observations of 2,208 unique schools from 2003–2004 through 2018–2019. FRL = Free or Reduced-Price Lunch. AP = Advanced Placement. CTE = Career Technical Education. ELA = English/Language Arts.
Empirical Strategy
Teachers’ Experience and Qualifications (RQ1) – Empirical Strategy
To answer our first research question – How have CS teachers’ experience and qualifications changed as CS course offerings have expanded? – we use descriptive statistics considering teachers’ years of experience, credentials, and subject area authorizations.
Course Replacements (RQ2) – Empirical Strategy
To answer our second research question – Which other courses do CS courses replace? – we estimate variations of the following model:
Within-school changes in course taking may not be driven by CS enrollment changes, but other factors like state-mandated changes in course accounting or changes to statewide content standards. For example, during the period covered by our data, California adopted the Common Core State Standards (describing math and ELA content standards) and the Next Generation Science Standards (doing the same for science). To better isolate changes in course taking driven by CS enrollment as such, we include year fixed effects (γt) to control for average year to year statewide variation in course taking. To assess whether relationships between CS course taking and course taking in other subjects are driven by changing characteristics of the student body or other unobserved factors, we also estimate variations of model 1 that control for observable time-varying school characteristics (described below) and school-specific time trends. We allow these time trends to vary cubically to flexibly accommodate fluctuating (e.g., economic) conditions during the years spanned by our data. We cluster our standard errors on schools.
Student Test Scores (RQ3) – Empirical Strategy
Our final research question asks about the relationship between CS course taking and student test scores on annual statewide standardized tests of math and ELA proficiency. We explore this in two ways. First, we estimate variations of model 2:
Interpreting β1 as the causal effect of CS enrollments on student test scores is complicated by the fact that student course taking is likely to be driven by factors that are also predictive of student achievement, and this is true even net of the various controls in model 2. This motivates our use of an instrumental variables (IV) approach, which follows a similar analysis by Darolia et al. (2020). Specifically, we use the availability of CS courses as an instrument for CS course taking to produce a two-stage least squares (2SLS) estimator. In the first stage, we estimate model 3, predicting CS course enrollment shares among majority-11th grade courses (%CS11) as a function of the number of CS courses offered per 1,500 students (roughly the mean size of schools with achievement data in our sample; CS_offered) and the other controls in model 2:

Results
Teachers’ Experience and Qualifications (RQ1) – Results
Growth in CS participation has not been accompanied by decrements to CS teacher experience or qualifications, which may alleviate some concerns about the CS teacher supply. Figure 3 shows the characteristics of high-school teachers of CS and non-CS courses, weighted by the number of students enrolled in their courses. While we do not observe direct measures of teacher quality, the observable characteristics of CS teachers have not deteriorated over time, either in absolute terms or relative to the characteristics of non-CS teachers. For example, in 2018–2019, 98.7% of CS enrollments were taught by a fully credentialed teacher, an increase of 6.5 percentage points from 2003–2004, compared to 96.5% of non-CS enrollments. Similarly, between 2003–2004 and 2018–2019, the share of CS enrollments taught by a teacher with at least a master’s degree increased by almost 10 percentage points (from 43.9% to 53.8%). For non-CS courses, the increase was only 8.7 percentage points (from 36.9% to 45.6%). And during this time, teachers’ mean years of experience fell only slightly for CS enrollments (from 13.3 years to 13.1 years) and fell slightly more for non-CS enrollments (from 13.6 years to 13.0 years).
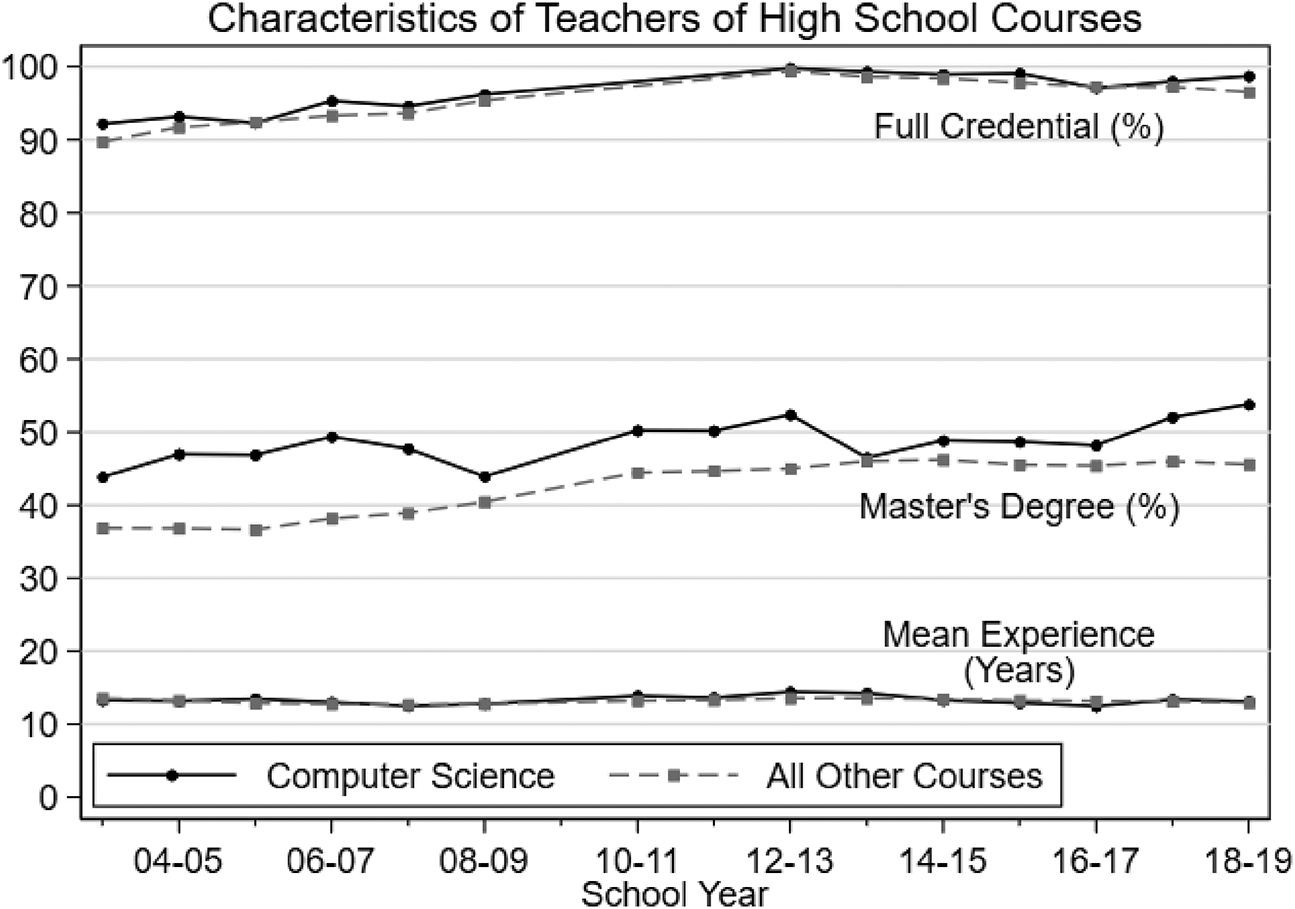
Experience and qualifications of teachers of high-school courses. Units are indicated in parentheses. Values are weighted by the number of students enrolled in each course.
Why would the credential status, educational attainment, and experience of CS teachers not decline as the demand for CS teachers increased? School districts in California generally do not differentiate compensation on the basis of subject area, and average teacher salaries were largely unchanged during this period after adjusting for inflation (Bruno, 2019). The ability of districts to staff their multiplying CS classrooms with well-credentialed teachers is thus unlikely to reflect more aggressive or successful teacher recruitment on the basis of compensation. Rather, one explanation may be California’s flexible requirements for the subject area preparation of CS teachers. As discussed above, in California, teachers are authorized to teach CS if they hold any subject area authorizations in mathematics, business, industrial and technology education (ITE), or CTE. Moreover, teachers with other authorizations can earn supplemental authorizations to teach CS if they have a related degree or with a relatively small quantity of additional related coursework (e.g., 10 upper division semester credits).
Perhaps as a result of these flexible authorization standards, CS teachers hold a wide variety of subject authorizations. Figure 4 shows the percentage of CS enrollments taught by teachers with the five most common subject area authorizations among CS teachers. Values in a year can sum to more than 100% because individual teachers can hold multiple subject authorizations. The most common authorization for CS teachers is math, and in some years, most CS enrollments are taught by teachers with math authorizations, but other authorizations are also common. Business authorizations were roughly as common as math authorizations through the 2012–2013 school year, though they have since become less common and have been overtaken in recent years by CTE authorizations. The share of CS enrollments taught by teachers with a science authorization has held mostly steady (between 12.6% and 18.7%) during this time, as has the share taught by teachers with ITE authorizations (between 8.7% and 18.1%).
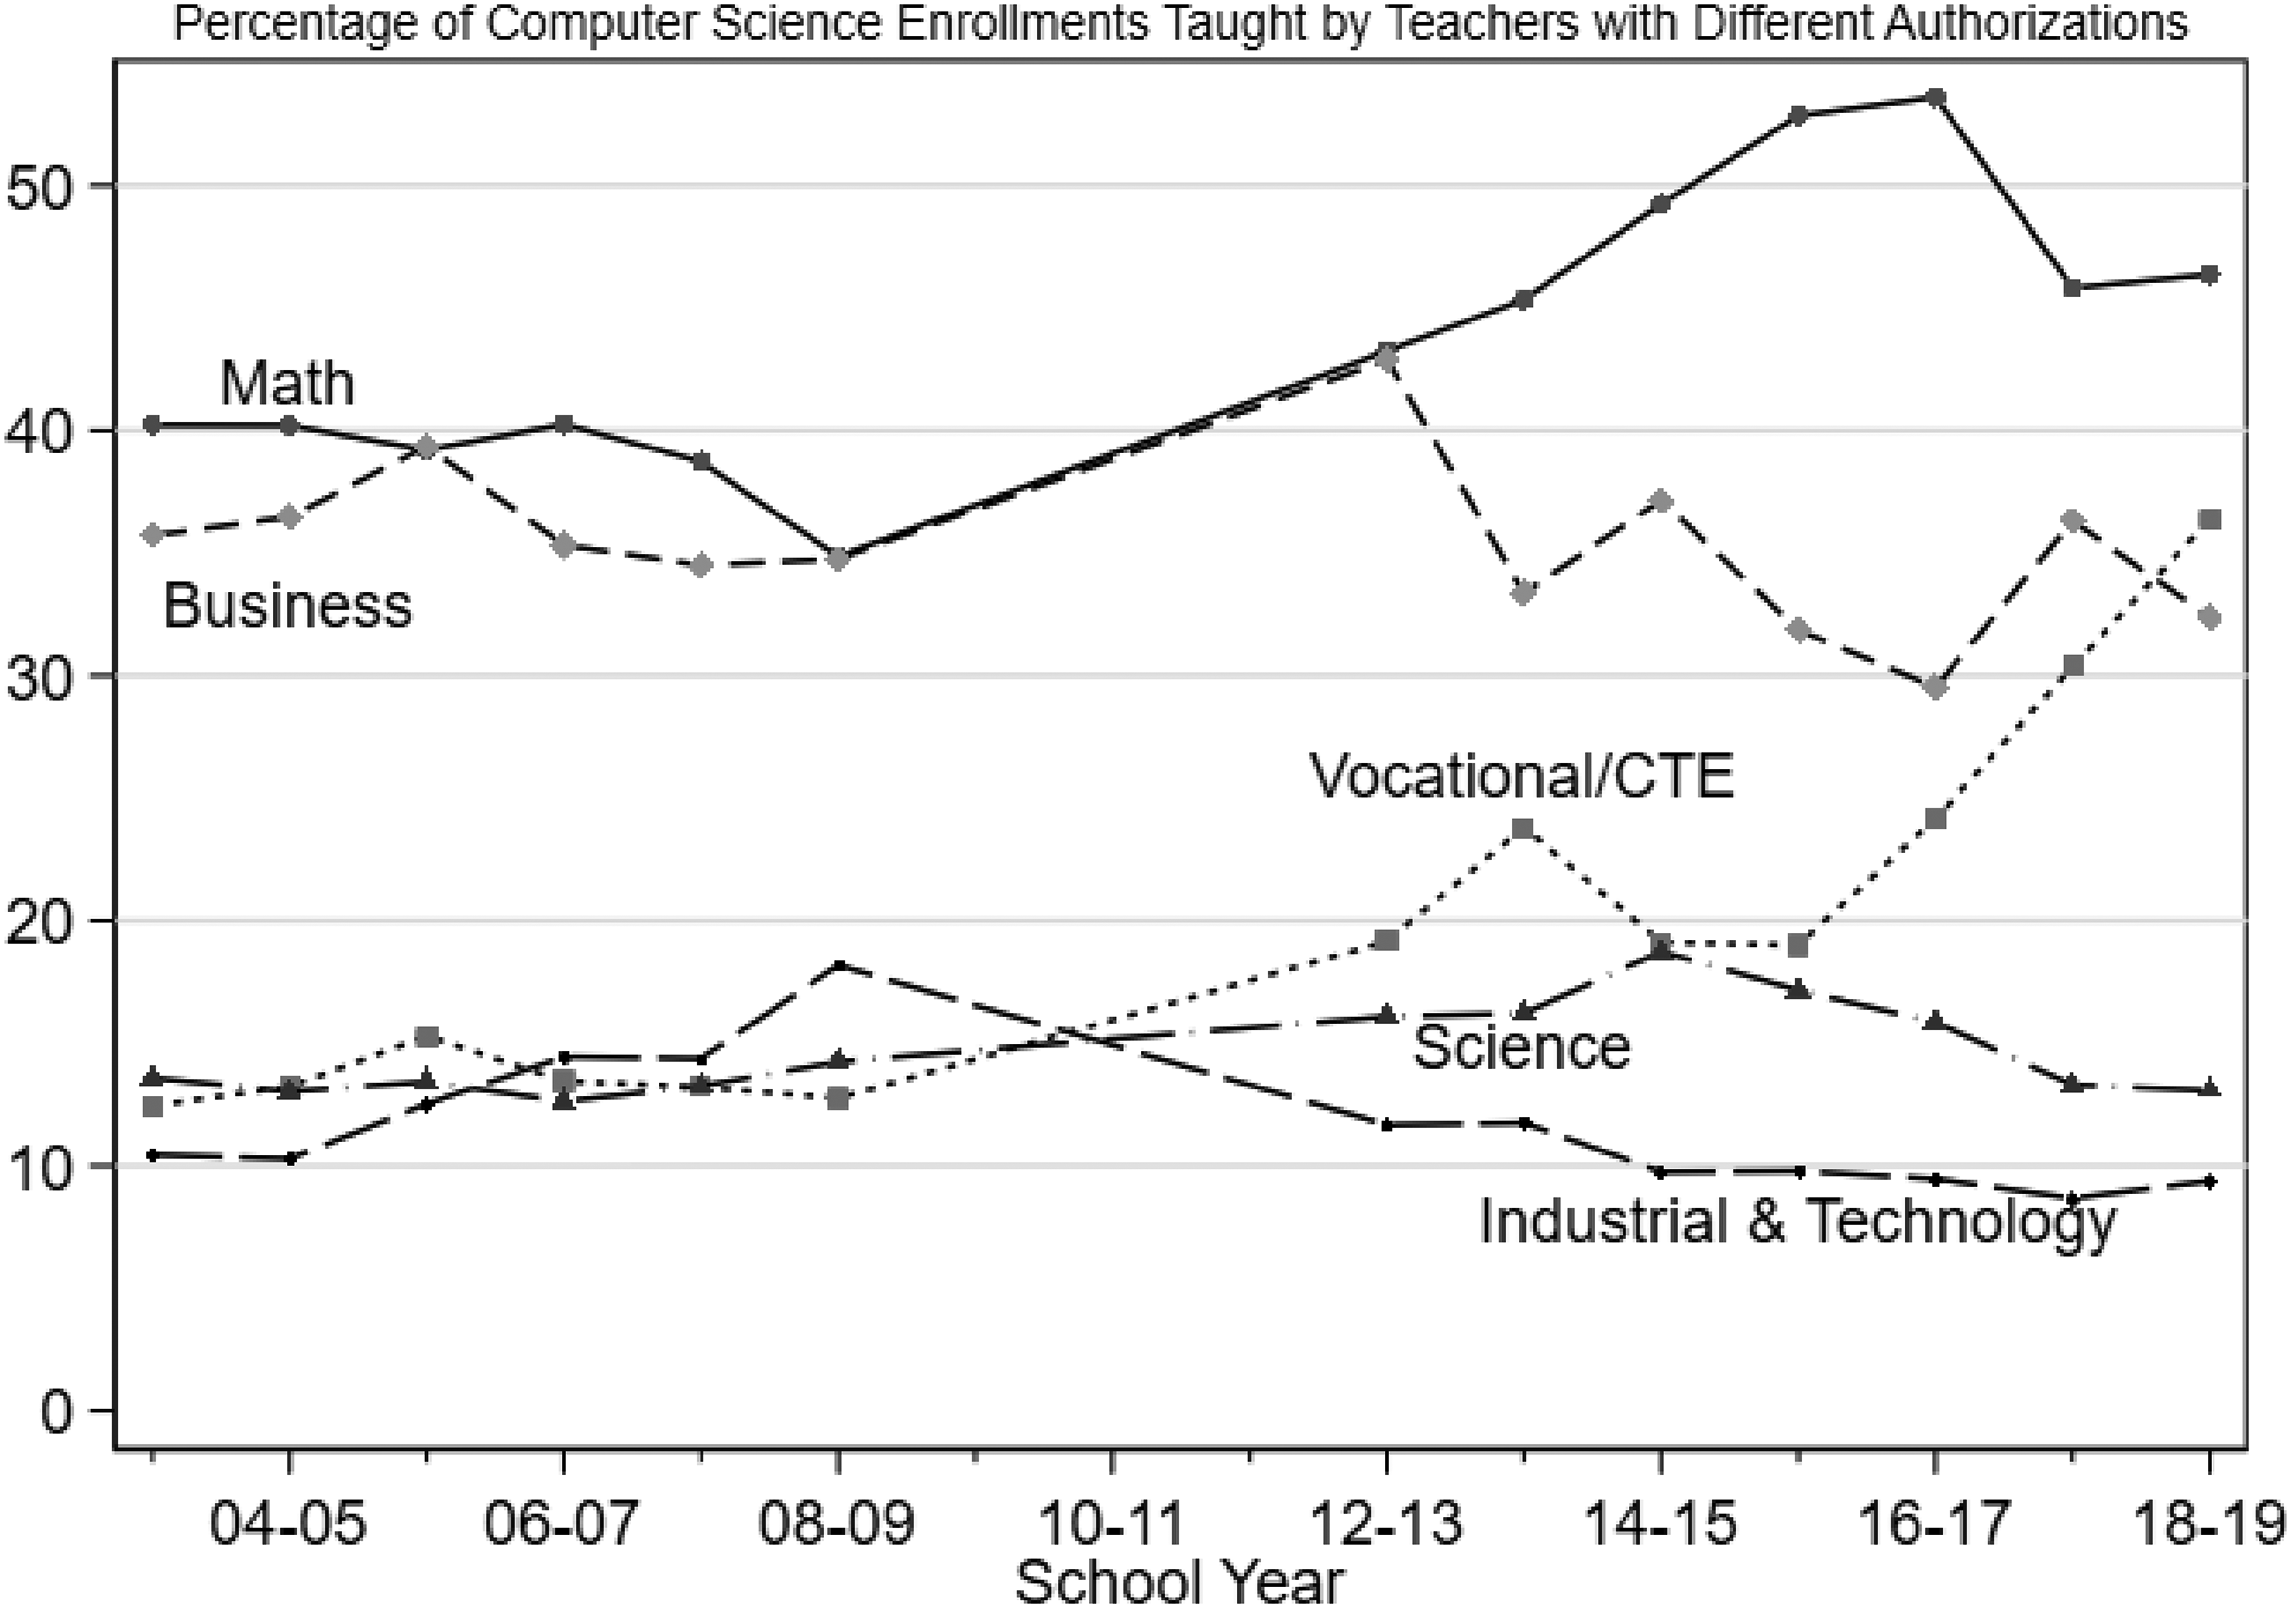
Subject authorizations of computer science teachers. CTE = Career Technical Education.
As was also discussed above, one potential downside to making it relatively easy to be authorized to teach CS is that CS teachers may often be unprepared to teach CS content, either because they lack requisite domain knowledge or because they have not received pedagogical training specific to CS. Nevertheless, relaxing authorization standards in this way may be preferable to alternatives, such as restricting CS enrollment growth or hiring additional teachers who have not earned full certifications and who are likely to be less experienced. This may be particularly true in contexts where in-service professional development is available to CS teachers (e.g., as has been the case through the Exploring Computer Science program mentioned above; Goode and Margolis, 2011). Indeed, because we cannot observe these or similar kinds of preparation information in the CDE data (e.g., teachers’ majors of study), our results should be interpreted with caution. Given expanding participation in CS courses and the dearth of rigorous research on CS teacher effectiveness, evaluating trade-offs (if any) between the quantity and quality of CS teachers is an important area for future studies.
Course Replacements (RQ2) – Results
Figure 5 shows which types of courses have seen decreases as CS course taking has expanded. Each marker represents the coefficient (and 95% confidence interval) on the %CS term in model 1 when predicting the share of all course enrollments that are in each subject area. That is, each marker indicates how much each type of course changes its share (in percentage points) of all course enrollments in a school when CS courses represent an additional one percentage point of course enrollments. All three panels include school and year fixed effects.
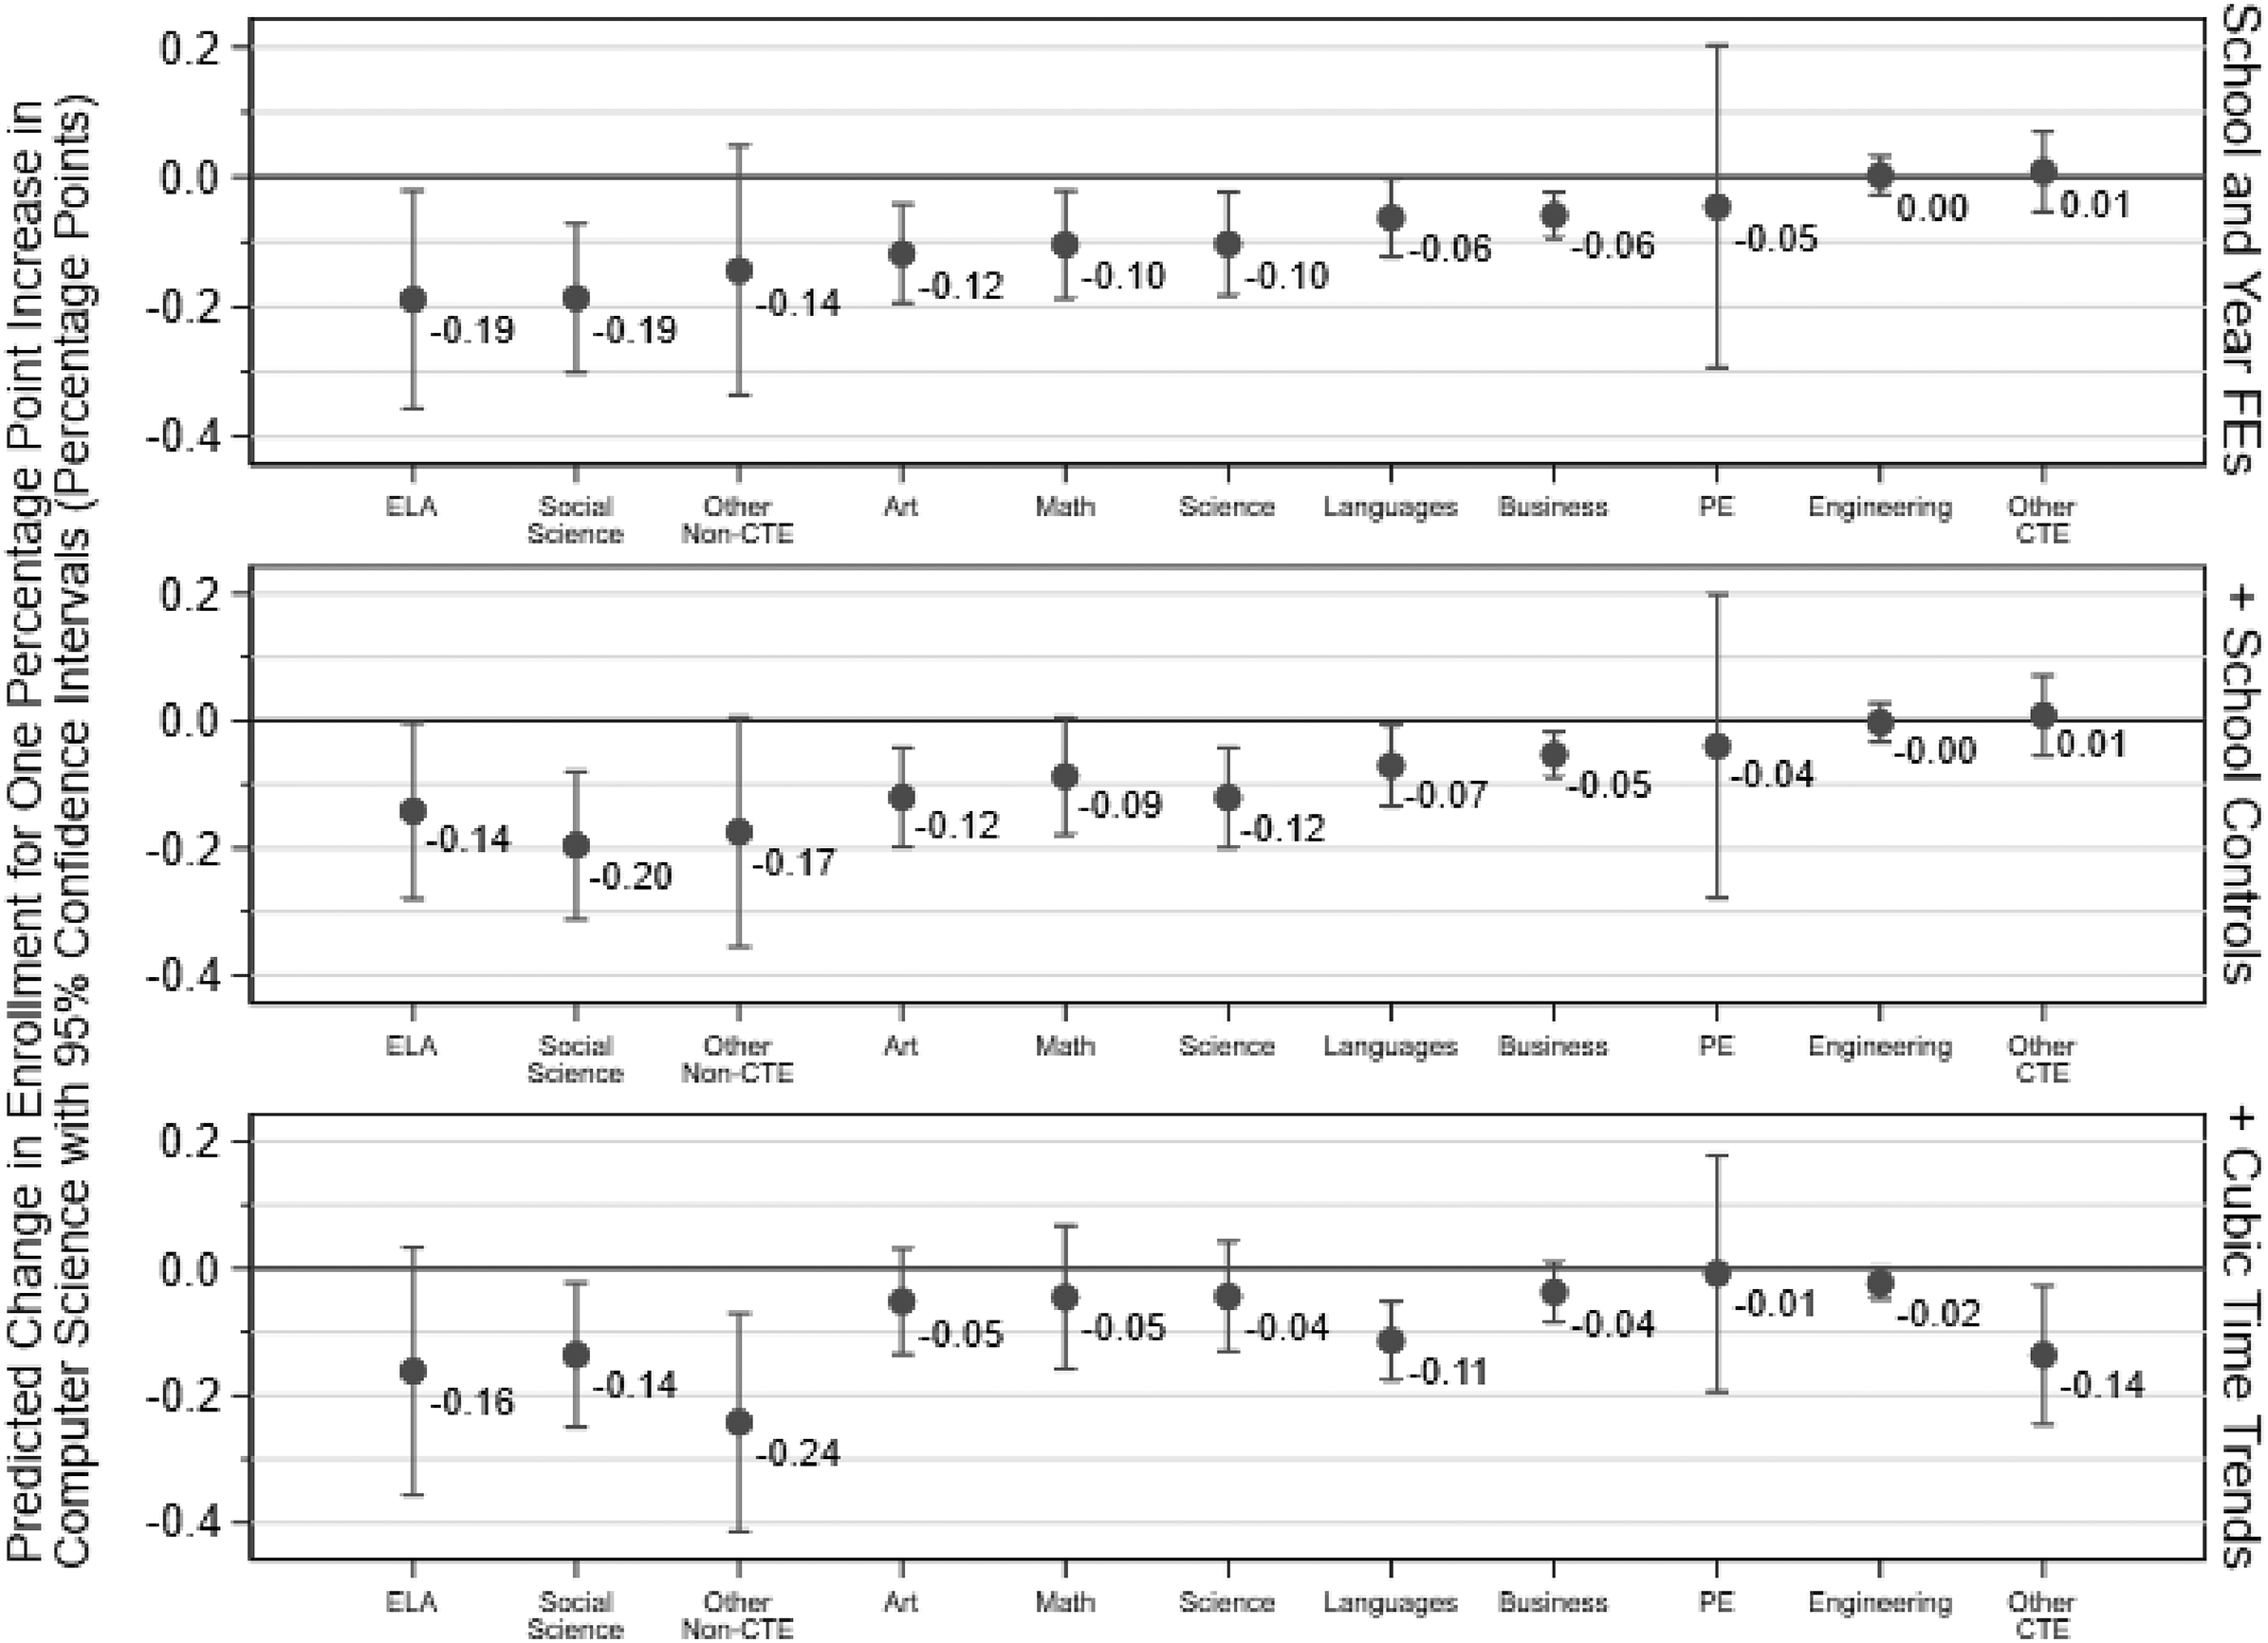
Changes in subject enrollment shares associated with computer science enrollment. Coefficients and standard errors correspond to estimates of
As shown in the top panel of Figure 5, CS course enrollments are associated with lower participation primarily in ELA, social science, art, and other (i.e., miscellaneous non-CS) non-CTE courses. Collectively, drops in enrollment in these courses account for nearly two thirds (64%) of all course enrollment changes associated with additional CS course taking. These “other” non-CTE courses are difficult to distinguish more finely from one another because most of the predicted decrease in these courses comes from courses identified simply as “other instruction-related assignments.” This catch-all category typically includes courses that would commonly be considered electives, but that do not have designated course codes.
Decreases in math and science course taking associated with CS course taking are smaller. There is also essentially no relationship between course taking in CS and engineering, closely-related fields that might be expected to be substitutes. This suggests that growing CS participation may be causing narrowing of the curriculum in favor of STEM and away from humanities and potentially diverse elective courses, though we cannot be certain about why we observe these relationships. This stands somewhat in contrast to findings by Darolia et al. (2020), who find that when high-school students enroll in a newly-offered STEM course, they primarily replace other STEM courses. CS courses may be different from other STEM courses in this regard because they are often CTE-oriented (e.g., as evidenced by CS teachers’ subject area authorizations above) while other STEM courses are more academically oriented, or because CS course content is relatively novel compared to other STEM disciplines that have long been more common in high schools (e.g., biology or math).
CS courses might be expected to draw students away from foreign language courses, as many K-12 and higher education systems have considered or adopted plans that allow students to receive foreign language credit for completing CS courses (Jaschik, 2017). There is some evidence that this is happening, but the effect appears small: a percentage point increase in the share of all course enrollments that are in CS is associated with a decrease in the share of foreign language course enrollments of just 0.06 percentage points. Similarly, the prevalence of business-authorized teachers in CS courses discussed above suggests that CS courses are often thought of as business-oriented and may thus draw students from courses classified as business-related. There is also some evidence of this, with the relationship between CS and business courses roughly similar in magnitude as the relationship between CS and language courses.
Comparing the top and middle panels in Figure 5 reveals that these course taking trade-offs are similar if we control for time-varying school characteristics. This suggests that the shifts in course taking associated with CS are not simply driven by changes in student composition. Finally, the bottom panel of Figure 5 additionally controls for school-specific cubic time trends. This reduces the precision of our estimates, but also controls to some extent for unobserved factors varying within schools over time. Again, though, these results are largely similar. As in the other specifications, the majority of enrollment declines associated with CS course taking come from ELA, social science, and other non-CTE electives, though the former two categories account for somewhat less, and the latter category somewhat more, of those trade-offs.
The largest change in our results when controlling for these time trends comes from a large increase in magnitude of the inverse relationship between course taking in CS and other CTE electives. This may indicate that expanded CS course taking is driven to some extent by schools prioritizing vocational education generally, rather than CS specifically. Since these kinds of cultural or priority shifts are not directly observable in our data, when we do not control for time trends, we observe no relationship between CS and other CTE courses because they are expanding – or contracting – together as often as not. However, net of school-specific time trends – and thus perhaps net of time-varying shifts in vocational education generally – the trade-off between CS and other applied and professionally oriented education is more apparent. This is consistent with controlling for school-specific time trends also shrinking the magnitudes of the trade-offs between CS and ELA, social science, art, math, and science courses, which are often more academic courses. Similarly, controlling for time trends increases the apparent trade-offs with language and other non-CTE elective courses. These are often more applied and professionally oriented courses, even if they are not officially designated as CTE.
Student Test Scores (RQ3) – Results
In addition to representing an important set of trade-offs in their own right, negative relationships between CS course taking and course taking in other subject areas may present another dilemma for school leaders because they are often accountable for student performance in math and ELA. Since administrators face no similar pressure to increase student performance in CS, they may be reluctant to expand CS participation. This may be particularly true if, as indicated above, CS courses replace to a substantial extent courses in subjects in which students are given standardized assessments by the state (namely ELA and math).
The results in Table 3 provide little evidence that CS course enrollments have a substantial effect on a school’s standardized test outcomes. There is a small positive linear relationship within schools over time between CS participation and standardized mean scale scores in ELA (column 13), but our estimate of that relationship shrinks and loses significance after controlling for school-specific cubic time trends (column 14) and no such relationship is observed in math (columns 1 and 2). Considering each testing regime separately (columns 17 and 18) suggests that the ELA result is driven by the period beginning in 2014–2015. This may be a consequence of the different testing regimes assessing different kinds of skills or could reflect that these later years contain a disproportionate share of the variation in CS participation (e.g., as shown in Figure 2 above), However, the lack of a similar divergence between testing regimes in our math results (columns 5 and 6) suggests that the ELA results may be spurious.
Models Predicting School Math and English/Language Arts (ELA) Achievement.
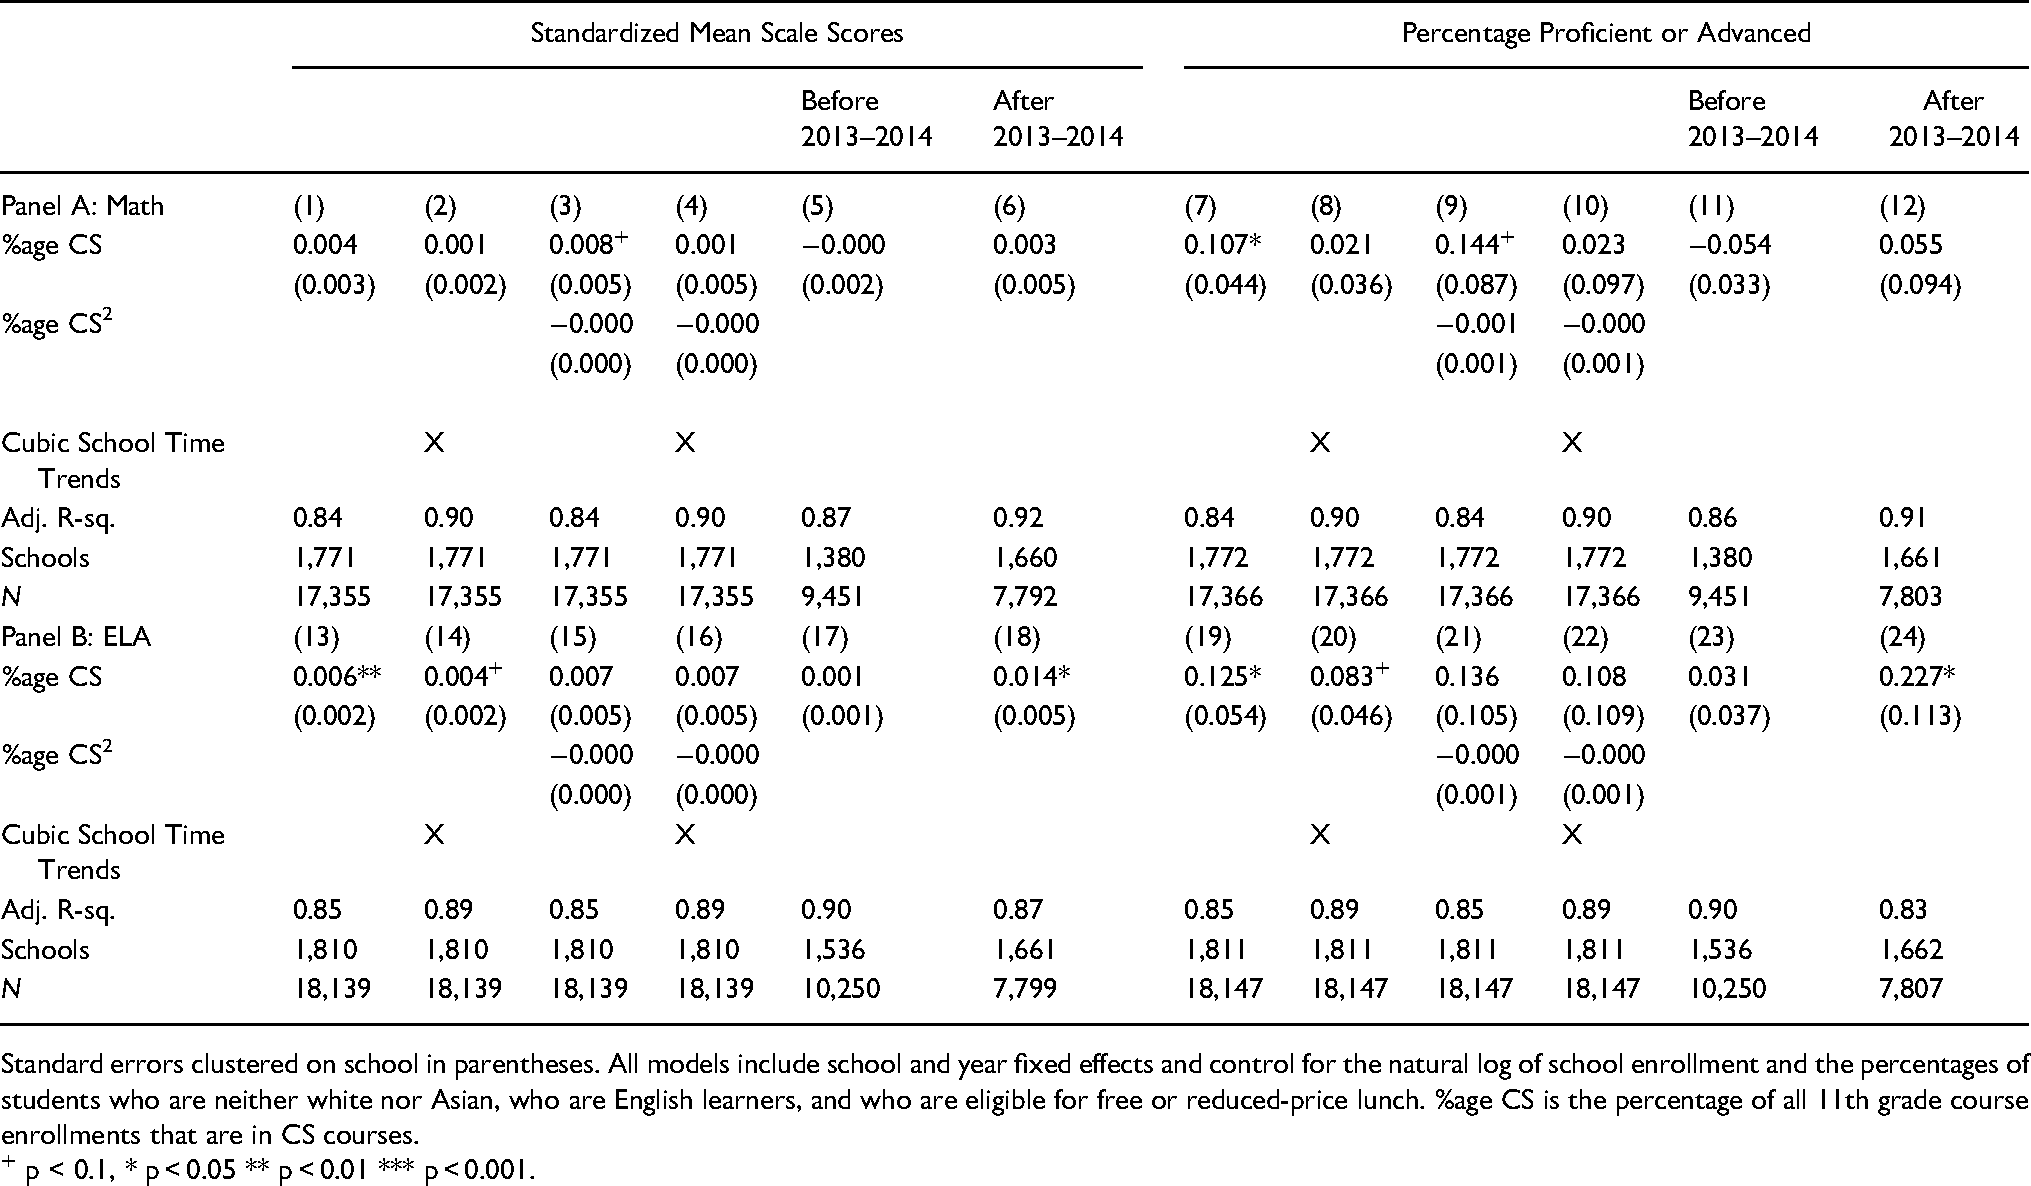
Standard errors clustered on school in parentheses. All models include school and year fixed effects and control for the natural log of school enrollment and the percentages of students who are neither white nor Asian, who are English learners, and who are eligible for free or reduced-price lunch. %age CS is the percentage of all 11th grade course enrollments that are in CS courses.
+ p < 0.1, * p < 0.05 ** p < 0.01 *** p < 0.001.
Average linear relationships do not appear to be obscuring substantial nonlinearities. Coefficients on the squared terms in quadratic models are essentially nil (columns 3, 4, 15, and 16). The costs (or spillover benefits) of CS participation to math and ELA tests thus do not appear to compound at higher levels of participation. Analogous results considering proficiency rates (columns 7–12 and 19–24) are similar. Importantly, however, since even in our most recent data CS courses represent on average slightly less than 1% of all course enrollments (Figure 2), results should be generalized to contexts with very high CS participation rates only with caution.
As discussed above, a challenge to giving these estimates a causal interpretation is that changes in CS participation rates may reflect changes in unobserved student characteristics. This motivates our IV analysis. Because the IV analysis uses only the variation in participation associated with expanded CS course offerings, this mitigates to some extent concerns that the relationship between CS participation and math and ELA test scores is driven by unobserved differences between students who choose to enroll in existing CS courses and those who do not.
Our IV results are presented in Table 4. The first stage results show that offering additional CS courses is substantively related to CS course taking. An additional CS course being offered for each 1,500 students in a school is associated with CS courses accounting for an additional 0.08 percentage points of all students’ enrollments in majority-11th grade courses. 8 The second stage, however, results in estimates very similar to those above. The 2SLS estimates are in some cases larger than the analogous estimates in Table 3, but this is not always the case, and the 2SLS estimates are uniformly much less precise. Collectively, the results point to little, if any, relationship between CS course enrollment and student test scores in ELA and math.
2SLS Models Predicting School Math and English/Language Arts (ELA) Achievement.
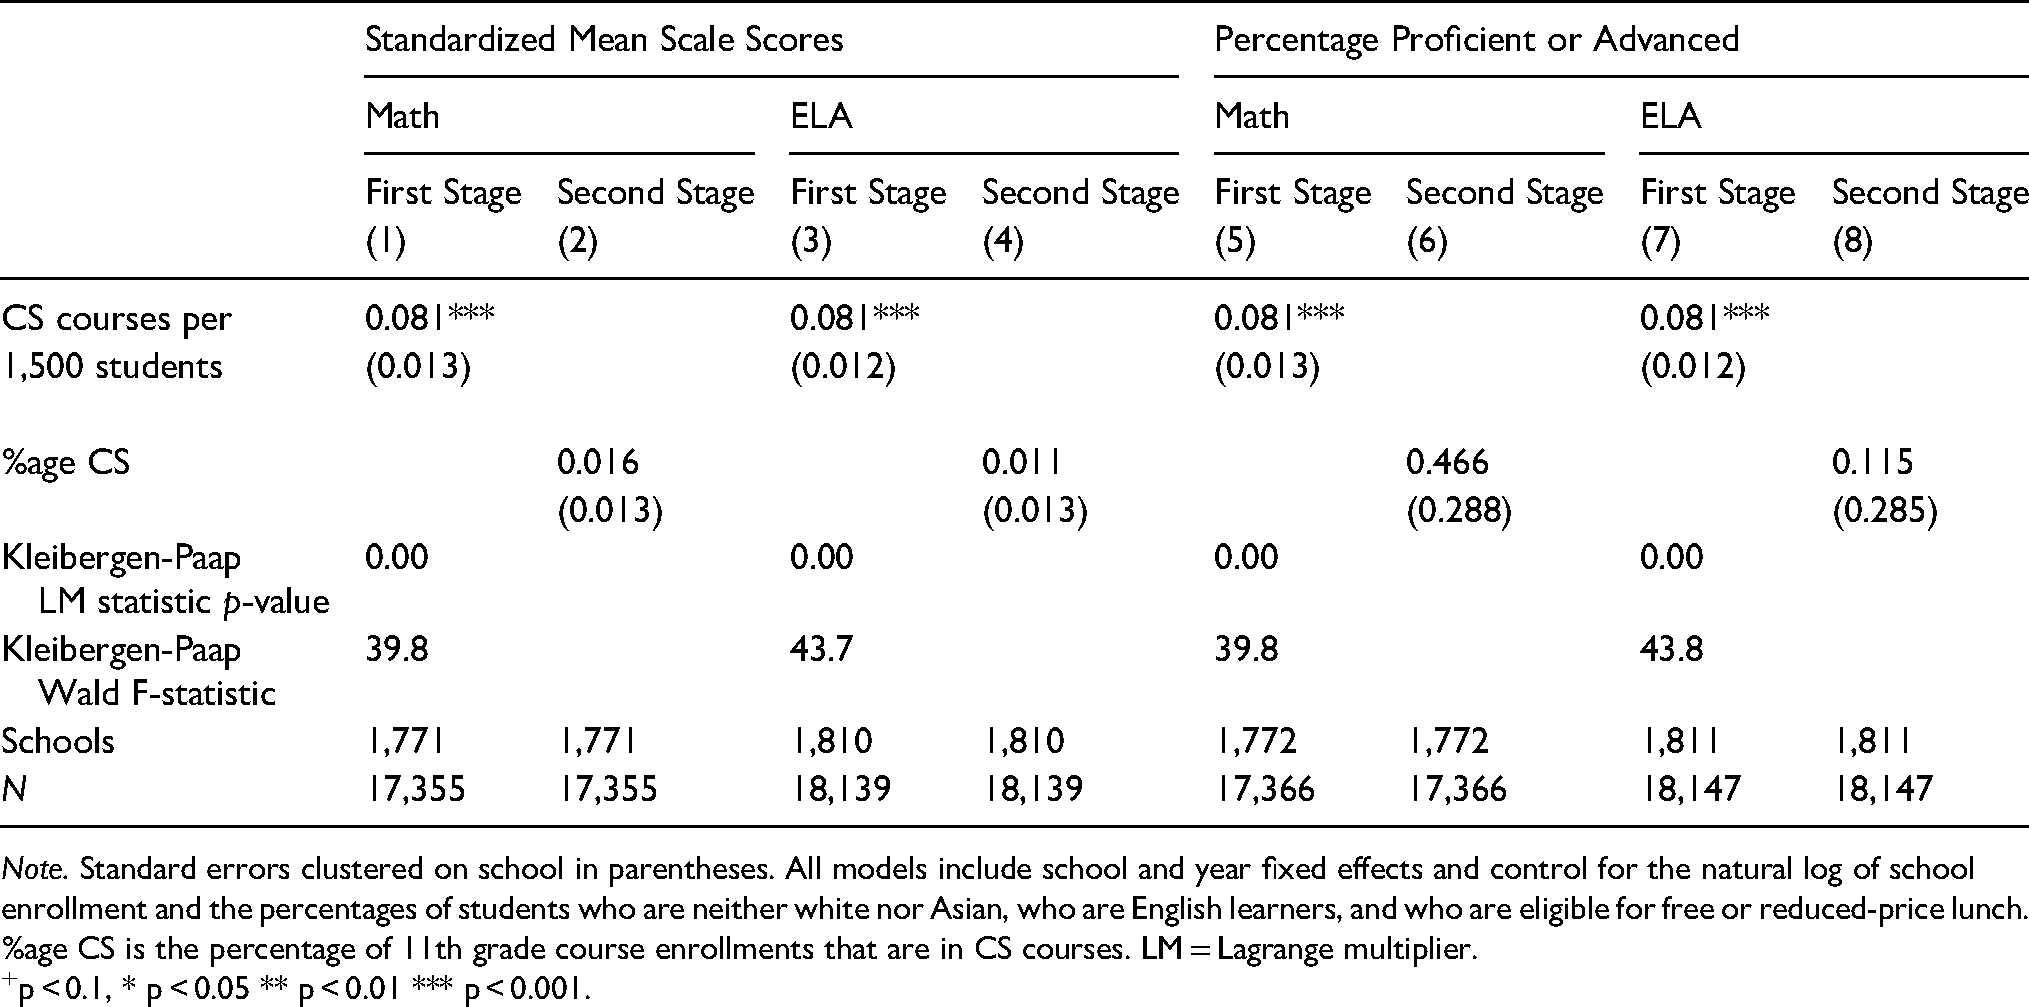
Note. Standard errors clustered on school in parentheses. All models include school and year fixed effects and control for the natural log of school enrollment and the percentages of students who are neither white nor Asian, who are English learners, and who are eligible for free or reduced-price lunch. %age CS is the percentage of 11th grade course enrollments that are in CS courses. LM = Lagrange multiplier.
+p < 0.1, * p < 0.05 ** p < 0.01 *** p < 0.001.
As discussed above, our IV estimates may still not reflect the true effect of CS course taking on student test scores if CS course offerings are related to test scores through channels other than CS course taking. We suspect that the expected direction of this bias is positive because expansions in CS course offerings may be driven in part by demand by more privileged families for access to coursework thought to advantage students in college and the later labor market. This would be consistent with evidence indicating that CS courses are more likely to be offered in the schools of students from groups that tend to score relatively highly on standardized tests (e.g., white and Asian students; Bruno and Lewis, forthcoming), and would tend to positively bias our estimates. As also discussed above, we find some evidence that CS course offerings expand along with other CTE courses. To the extent that more technical CTE courses in California tend to serve students with relatively high test scores (Reed et al., 2018), we would further expect our estimates to be biased upward. All things considered, however, the robustness of our small and mostly statistically insignificant estimates to various modeling choices provides evidence that expanded CS course taking, at least at levels currently observed in California, does not entail large short-term trade-offs for schools in terms of student achievement on standardized tests.
Discussion
K-12 curricula have increasingly emphasized CS, and that trend is likely to continue for the foreseeable future. We consider two potential capacity constraints schools may face as they expand CS education. Not only do these constraints need to be overcome as a precondition for achieving access, participation, and equity goals in CS education, how they are overcome may determine the extent to which schools and students benefit from CS education (Fletcher & Warner, 2021). Our findings reiterate some capacity challenges identified in previous work, while also shedding light on potential challenges that have not been as well studied. For example, despite concerns that it can be difficult to recruit and retain qualified CS teachers, California’s high schools appear to have had success navigating this challenge. Despite rapid growth in CS courses, CS teachers are at least as well qualified as they were 15 years ago in terms of credentials, education, and experience, and trends in those characteristics have tracked those of other teachers. This may be due to California’s flexible rules about what subject area authorizations qualify a teacher to teach CS. This flexibility may allow schools to draw on relatively well-qualified existing staff to teach new CS courses, rather than having to find new staff with emergency certifications. The diverse subject area backgrounds of California’s CS teachers may mean that many CS teachers lack strong CS content knowledge; this may limit their effectiveness in ways we are unable to observe. Nevertheless, if policymakers and administrators believe that offering additional CS courses is worthwhile, California’s teacher authorization model may have lessons for how those courses can be offered without needing to rely on teachers who are inexperienced or not fully certified. Changes to teacher authorization rules may also be more feasible politically than other alternatives, such as differentiating salaries so that CS teachers can be recruited more aggressively on the basis of compensation.
CS expansions also challenge schools’ curricular capacity; for CS courses to become a larger share of the curriculum, other courses must become a smaller share. By looking within schools over time, we present the most direct evidence to date about how these curricular substitutions operate in practice. The largest decrements associated with CS course taking are to participation in ELA, social science, and miscellaneous elective courses. CS course expansions thus appear to be associated with some narrowing of high school curricula, away from the humanities and toward STEM and CTE. These curricular shifts may reflect broader trends in schools, and so may not be driven by CS expansions as such, though our results on this question are largely robust to controlling for time-varying student characteristics and school-specific time trends. We are agnostic about whether these shifts are worthwhile. However, we believe the question of which courses CS courses should replace is one that has not received sufficient attention. While students may benefit from CS courses, they may benefit from other types of courses as well. The benefits of CS course expansions should therefore be weighed explicitly against the costs of reduced course taking in other subject areas.
Advocates of CS education may take encouragement from the fact that we do not find significant negative relationships between CS enrollment rates and standardized test scores in math and ELA. Indeed, in some cases, the relationships we estimate are positive; this is qualitatively consistent with CS course taking having spillover benefits for students outside of CS courses, a benefit often proposed by CS education advocates (Scherer et al., 2019; Wing, 2006). However, we would caution against giving those estimates a strong causal interpretation. Our 2SLS estimates do not suggest that our estimates are heavily biased by student sorting into existing CS classes, but we cannot rule out unobserved sources of bias associated with CS course offerings and our estimates are somewhat sensitive to test subject and state testing regime. Still, the absence of large negative relationships suggests that administrators need not worry greatly that expanding CS offerings will heighten test-based accountability pressure on their schools, at least at current levels of CS participation and with current course replacement patterns.
While we extend and advance previous work in several ways, our analyses are limited in important ways. For example, the teacher characteristics available in our data are at best rough proxies for teacher quality. As students spend more time in CS courses, it will be increasingly important to develop better measures of CS teacher quality that can be used to assess both the average strength of CS teachers and the prevalence of gaps in CS teacher quality between different groups of students (Bruno & Lewis, forthcoming). And because we observe enrollments at the course level and annual test scores only at the school level, we cannot link CS participation to outcomes for individual students, or even to aggregate outcomes other than test scores. Similarly, while our data cover many schools over many years, they do not offer the opportunity to understand why we observe the patterns we do in the way other sources of information, such as qualitative data, might. For instance, we cannot discern the quality of students’ experiences in CS courses, why they are offered or choose to enroll in those courses, or whether CS content is incorporated into students’ non-CS courses.
Effective CS implementation in schools requires more than enrolling ever-growing numbers of students in CS courses. In addition to attending to access and participation gaps between groups of students, administrators and policymakers need to consider schools’ capacities to offer CS education. Thus, researchers should attend to these issues also. Our results highlight several challenges for expansions of CS education related to teaching and curricular capacity. The importance of these and other capacity challenges, and thus the importance of understanding and meeting them, will likely continue to grow for the foreseeable future.
Footnotes
Notes
Notes and Acknowledgements
We are grateful for data support from the Data Reporting Office of the California Department of Education, for research assistance from Anisha Kaul and Sage White, and for thoughtful feedback from anonymous reviewers. This work was supported by the Google Computer Science Education Research Program.
Declaration of Conflicting Interests
The author(s) declared no potential conflicts of interest with respect to the research, authorship, and/or publication of this article.
Funding
The author(s) disclosed receipt of the following financial support for the research, authorship, and/or publication of this article: This work was supported by the Google Computer Science Education Research Program (grant number 93661913).