
Abstract
Keywords
Across the country, school districts regularly experience churn and uncertainty related to school staffing. The most recent data from the National Center for Education Statistics (2024) show that 16 percent of teachers left their schools in 2021. When teachers exit a school, it is often the principal's responsibility to review applications and hire for the resultant vacant positions. In some cases, those positions are still unfilled when the school year starts. For example, a report from the North Carolina State Board of Education (2025) identified that 8 percent of instructional positions in the state's public schools were vacant as of the 40th day of the 2023–24 school year. The interrelated problems of educator turnover and unfilled vacancies raise urgent questions about what district and school leaders can do to make schools desirable places to work so that they are fully staffed and so that all students can learn.
Extensive research has documented the relationship between teacher turnover and school characteristics like student racial composition, poverty, and achievement levels (Boyd, Lankford, et al., 2011; Ingersoll, 2001; Lankford et al., 2002; Loeb et al., 2005; Scafidi et al., 2007). Some research has shown that these school characteristics were even stronger predictors of turnover than salary (Hanushek et al., 2004; Scafidi et al., 2007). However, teacher working conditions were also important determinants of turnover (Horng, 2009; Ladd, 2011). Research has highlighted that teachers’ perceptions of the quality of their school leadership, principal-teacher relationships, and the level of support they receive from their principals were associated with reductions in both turnover intentions (Johnson et al., 2012; Ladd, 2011) and actual turnover (Allensworth et al., 2009; Boyd, Grossman, et al., 2011; Boyd, Lankford, et al., 2011; Grissom, 2011; Grissom & Bartanen, 2019; Kim, 2019; Kraft et al., 2016; Marinell & Coca, 2013). Finally, teacher retention was higher when they had worked under the same principal for 5 or more years as well as in the year prior to principal turnover (DeMatthews et al., 2022; Winters et al., 2023) and when the principal was of the teacher's same race or sex (Bartanen & Grissom, 2023; Grissom et al., 2012; Grissom & Keiser, 2011).
There is another line of research describing teachers’ preferences based on the characteristics of schools where teachers seek or accept employment, as opposed to characterizing the schools that teachers leave. Many of these studies have relied on teachers’ actual moves between schools to draw inferences about teacher preferences for school characteristics. However, these studies may conflate supply-side factors (e.g., teacher preferences) and demand-side factors (e.g., vacant positions) of the teacher labor market. Analysis of transfer applications overcomes this limitation because researchers observe the complete set of schools over which teachers indicate interest in working regardless of available positions. These studies are most similar to ours in terms of data availability, and, therefore, we focus here on summarizing the prior research that uses transfer applications.
Researchers found that teachers in New York City sought out schools that served fewer Black students, had lower poverty rates and lower crime rates, and were closer to their home (Boyd et al., 2005; Boyd, Lankford, et al., 2011). Two international papers also used information from centralized application and hiring systems. In Italy, teachers preferred schools with fewer students with identified disabilities and lower grade retention rates, as well as schools that were in more-resourced areas (Barbieri et al., 2011). In Peru, teachers sought more-resourced schools that were closer to home (Bertoni et al., 2023). Indeed, a large body of research has documented “localism” (Engel & Cannata, 2015) in teacher preferences for where to work, including preferences for schools located close to where teachers completed their educator preparation programs (Bertoni et al., 2023); schools in close proximity to where teachers grew up (Boyd et al., 2005) and where they currently live (Boyd et al., 2013; Cannata, 2010; Engel et al., 2014); and, among beginning teachers, schools near their student teaching assignments (Krieg et al., 2016).
As with retention, we suspect that principals play a critical role in attracting candidates to their schools when they have open positions to fill. Yet little is known about the characteristics of principals that are associated with applicants’ job-seeking behaviors and the importance of principal characteristics relative to other school qualities in a teacher's job search. Only two papers have examined whether principal characteristics were related to teacher demand for schools, and they focused on principal-teacher demographic congruence, suggesting that, on average, teachers preferred to work for a principal of the same race/ethnicity and/or sex (Bartanen & Grissom, 2023; Husain et al., 2023). Given the extent to which principals shape educators’ day-to-day workplace experiences, our study seeks to provide a better understanding of principal influence over teachers’ labor market decisions. Specifically, we answer the following questions:
What current-school principal characteristics (e.g., years of experience, principal-teacher demographic congruence, teacher survey reports of leadership quality) are most associated with a teacher's decision to seek a transfer away from that school? Conditional on seeking a transfer, do teachers prefer certain principal attributes over others when choosing schools on their application (e.g., a preference for working at schools with more-experienced principals versus less-experience principals)? What is the relationship between the number of teachers who applied to transfer into a school and the number of teachers who sought a transfer out of the same school (proxying for vacancies)? Is this relative measure of demand to work at a school related to principal characteristics?
The context of this research is the Wake County Public School System (WCPSS). With over 10,000 teachers serving about 160,000 students in nearly 200 schools, WCPSS is the 15th-largest district in the country (de Brey et al., 2021) and is geographically large, making it diverse in terms of urbanicity and student population. Like other large school districts (e.g., New York City as described in Boyd, Lankford, et al., 2011), WCPSS has a formal transfer policy that allows teachers to seek employment in other schools within the district. Seeking to transfer is a relatively common occurrence, with about one in ten WCPSS teachers completing a transfer application every year. Using the data generated from this transfer application process, we separately estimate teacher preferences over principal characteristics from two different perspectives: 1) the principal at the school where the teacher currently works and 2) the principal(s) at the application school(s) that teachers list on their transfer application. In the paper, we refer to these different sets of principals as “current-school principals” or “application-school principals,” respectively.
We find that 1) current-school principal characteristics were strong predictors of whether a teacher sought to transfer away from a school and that 2) application-school principal characteristics were also correlated with teacher requests for a specific school on their transfer application. Compared to other teachers, transfer applicants were more likely to be currently working at schools led by less-experienced principals who received less favorable ratings in terms of school leadership quality. Conditional on completing a transfer application, by far the strongest predictor of requesting a specific school was that the teacher and the applicant-school principal had worked at the same school together in the past. We also document the interplay between teachers exiting a specific school and the demand for teaching in that same school, showing that the schools where principals struggled to retain teachers were often the same schools that attracted the fewest transfer applicants. Further, these schools tended to have less-experienced principals and to serve historically marginalized student populations with lower achievement levels.
In an era where teacher hiring is especially challenging, better understanding the role that principals can play in teacher recruitment and retention is critical. Findings from our research highlight the importance of strong principals as a piece of this puzzle. District investments in principal capacity to foster school climates where there are positive working relationships among adults in the building would likely result in increased teacher workforce stability, thereby raising the chances that schools are fully staffed. Districts may also consider providing targeted support to principals who have had difficulty retaining and attracting teachers, particularly around filling vacancies and developing their new teachers. Central office leaders, as well as principals, could also use the data generated by transfer requests - at the teacher or school level – to guide their retention efforts, especially if the individual teachers seeking transfer are highly effective and/or work in high-needs positions or schools.
Conceptual Framework: Employment Decisions Based on Utility Maximization
In this paper, we study teacher employment decisions using a labor economics framework of utility maximization. This model simply predicts that a teacher forms expectations about what it would be like to work in a specific school setting, and they use that information to seek employment in the school that they think will be the best fit for them, which may certainly be the school where they currently work. More formally, each teacher faces a labor market decision between academic years. They can (1) stay at their current school; (2) seek to transfer to another school in the same district; or (3) leave the district entirely, which includes either exiting the teaching profession or teaching outside of the district. Economic theory suggests that a teacher will weigh the expected benefits and costs of each option based on the public (e.g., state data on the student population or school climate) and private (e.g., word of mouth, past experiences with employees at the school) information they have about the school. Then, they will pursue the option that they think will give them the greatest expected utility (i.e., the greatest benefit or satisfaction after accounting for any perceived costs).
A teacher's calculation of the expected utility of working in a specific school is informed by their expected pecuniary and nonpecuniary benefits and any expected costs. Below, we provide examples of these different factors.
Pecuniary factors include salary and benefits like health care and retirement. Prior studies have documented teacher pay as a significant predictor of teacher turnover (e.g., Hanushek et al., 2004; Loeb et al., 2005). Within the same school district, including in this study's setting, pecuniary benefits typically do not vary across schools (e.g., teacher salary is the same at all schools in a given district). For this reason, differences in pecuniary benefits cannot explain why a teacher would seek to transfer schools within the same district, so this paper does not consider the role of pecuniary factors in teacher labor market decisions.
Nonpecuniary factors are about the school itself that influence the working environment, like principal years of experience (DeMatthews et al., 2022; Winters et al., 2023) and principal-teacher demographic congruence (Bartanen & Grissom, 2023; Grissom et al., 2012; Grissom & Keiser, 2011); school climate and culture (Boyd, Lankford, et al., 2011; Johnson et al., 2012; Kraft et al., 2016; Ladd, 2011; Simon & Johnson, 2015); characteristics of the student population, such as achievement and demographic composition (Barbieri et al., 2011; Hanushek et al., 2004; Scafidi et al., 2007); and a teacher's commute between home and work (Bertoni et al., 2023; Boyd et al., 2005; Engel & Cannata, 2015). Unlike teacher pay and benefits, nonpecuniary factors do vary across schools within the same district. As such, we expect that they have a large influence on a teacher's decision to seek employment in specific schools (and not others) based on the teacher's preferences. In this paper, we expand the literature on teacher preferences over nonpecuniary factors by focusing on the relationship between principal characteristics and teachers’ job-seeking behaviors.
Costs related to working in a given school also influence labor market decisions, and perceived costs of staying in the current school versus seeking transfer to a new school vary. Notably, teachers face a lot of uncertainty when considering seeking employment in another school, which may influence their estimate of the costliness of seeking a transfer. For example, teachers likely have a good sense of what it is like to work in their current school, but what it would be like to work in another school is likely much less clear. Further, because school-specific vacancies are unknown at the time of the transfer application, there is also uncertainty about whether a school will have a position that is of interest to a teacher and matches their credentials. In addition, it is costly for teachers to learn a new student population, grade level, or school culture.
In WCPSS, we observe a teacher's transfer-seeking behaviors, as well as their ultimate labor market decision to stay in their current school, transfer to another school, or to leave the district entirely. We focus on the decision to stay in their current school or transfer to another school within the district, modeling that decision as a function of various nonpecuniary factors that we measure directly or proxy for using the district's administrative and survey data. The goal of this research is to describe teacher preferences over a set of nonpecuniary factors that vary across schools within the same district, allowing us to say that, on average, one factor is more important to teachers than others. We are especially interested in understanding the relative importance of school leaders, namely principals, in influencing teachers’ labor market decisions.
Features of the Teacher Labor Market in WCPSS
WCPSS is a large and growing school district in North Carolina. Over the period we examine, the district's teacher workforce expanded from roughly 9,300 employed in 2007–08 to about 10,500 in 2018–19, a nearly 10-percent increase. At the same time, student enrollment increased by 15 percent with over 150,000 students in 2018–19. About half of WCPSS students were racial/ethnic minorities (24 percent Black and 15 percent Hispanic), and about one-third of students were eligible for free- or reduced-price lunch. The district has a range of school settings like magnet schools and multi-track year-round options, as well as schools in rural, suburban, and urban settings.
In this section, we describe three important features of the teacher labor market in WCPSS: compensation, the transfer process for teachers, and position allocation and hiring.
Compensating Teachers
As in many states and districts, WCPSS teacher salary is determined by their qualifications. In fact, the North Carolina state legislature sets the base salary schedule and differentiates pay according to teachers’ years of experience and National Board Certification status. 1 Districts can offer “local supplements” to increase pay beyond the legislated salary schedule. Supplements are paid from local revenue streams, so districts vary in how much additional pay they can offer teachers. Because of the local supplements, teachers can change their pay by moving across districts but not by transferring schools within the same district. Therefore, teachers who seek to transfer within WCPSS are motivated by nonpecuniary reasons, such as better working conditions, more-experienced principals, or shorter commutes.
Applying to Transfer
Each year, WCPSS employs a centralized process for managing teacher transfer requests. The transfer period, which typically spans January through May, is open to eligible teachers who are currently employed in the district, 2 and 99 percent of transfer applications in this study were submitted during that window. (See Table A1 for the transfer process timeline). The application itself is a web-based portal that lists all schools in the district sorted alphabetically within each of the district's geographic regions. Every school is available on the transfer application regardless of whether the school has, or expects to have, vacant teaching positions the following school year. To request a transfer into a specific school, the teacher ticks the box next to the name of the school on the application. There is no limit to how many schools a teacher can select on their transfer application.
Throughout the transfer period, principals can access summary reports that list the teachers at their own school who have completed a transfer application. Teachers are aware that their current principal has access to this information, and they also know that completing an application does not guarantee that a transfer will occur. As such, teachers may face some uncertainty about how their principal will use the information that they are seeking a transfer to another school. On the one hand, a principal could act punitively toward a transfer applicant, thinking that the teacher will likely leave the school in the near future. On the other hand, a principal could try to retain the transfer applicant by offering a more desirable teaching assignment or additional support. We assume that the expected benefits outweigh the costs for any teacher who completes a transfer application.
Filling Vacant Positions
A teacher can only transfer to another school if 1) that school has a position available that matches their qualifications (e.g., area of certification, grade level) and 2) the principal makes them a job offer. Each March, the district allocates positions to each school for the next school year based on student enrollment projections, student performance, and other student characteristics. These allocations give principals an estimate of how many staff members they will have and in what positions. In April, the district's teachers submit an “intent-to-return” letter to their principals, so principals know which of their current teachers plan to return. Principals use the district's position allocations and their teachers’ stated plans to make staff rosters for the next school year, identifying expected vacancies for the district to post to the WCPSS job board. 3
Once posted, candidates can apply to any vacancy. A hiring principal can observe transfer applicants to their school and applications from external applicants not currently employed by the district. While no official policy favors transfer applicants over external applicants, there are some advantages to being a transfer applicant in the hiring process. When a principal views candidates for a vacancy, transfer applicants are listed above external applicants. WCPSS engages in this practice in order to increase retention of their current employees who are more likely to be familiar with district policies and procedures, curricula, etc., relative to external applicants. In addition, principals can also interview transfer applicants even if their qualifications are not aligned with the school's known or expected vacancies. If a relevant position does open up, the principal can make a job offer to any transfer applicant they had previously interviewed. Finally, during the transfer period, a transfer applicant can accept an offer at another school without their current principal's permission. Outside of this period, a transfer requires the approval of the teacher's current principal and the Department of Human Resources.
Data and Sample
We constructed a longitudinal analytic dataset using WCPSS administrative records and survey responses from school-based staff about working conditions for the 2007–08 to 2019–20 school years. For each year, the personnel data included the school of employment, which we used to identify whether teachers stayed at their current schools, transferred schools, or exited the district. The personnel data also allowed us to flag the principals that teachers previously worked with in various capacities. We merged teacher transfer applications into the personnel data so that that we could observe each year: (a) whether a teacher completed a transfer application, and, if so, (b) the schools that the teacher requested on the transfer application. We also used other student-level administrative data aggregated to the school-by-year level to describe school contexts (e.g., proportion racial/ethnic minority students, proficiency rate on standardized tests) combined with data on school-level building characteristics (e.g., whether the school was newly opened).
Every other spring, the North Carolina Department of Public Instruction administered the statewide Teacher Working Conditions survey to all certified school-based K-12 public school educators. The survey was anonymous at the respondent-level but linked respondents to their schools, so we aggregated responses to the school-by-year level. 4 Over the study period, the survey included ten items about school leadership, such as “The school leadership consistently supports teachers” and “The school improvement team provides effective leadership at this school.” We conducted a principal component analysis on the ten items that supported the creation of a single measure characterizing teacher reports about school leadership. (Table A3 shows the weights assigned to each survey item.)
Table 1 provides descriptive statistics for the sample of transfer-eligible teachers, transfer applicants, and principals. Panel A shows educator characteristics. Transfer-eligible teachers were predominantly female (81 percent) and white (85 percent). Among this group, 14 percent completed a transfer application with 6 percent transferring schools and another 11 percent exiting the district at the end of the school year. Transfer applicants generally resembled the population of transfer-eligible teachers with one noticeable difference: transfer applicants had about one year less teaching experience relative to all eligible teachers (11.4 years compared to 12.3 years). We also show transfer applicant characteristics separately based on the teacher's actual transfer status (movers transferred schools, and stayers remained at their current school). Transfer applicants who ultimately stayed in their current school were older on average compared to the transfer applications who exited their current school (40.7 years compared to 37.9 years) and had more years of teaching experience (12.1 years versus 10.4 years). Panel B reports information from the transfer application itself and labor market outcomes. On average, a transfer applicant applied to about 11 schools. There was considerable variation across applicants with 11 percent having applied to only one school and 40 percent having selected more than 10 schools. (Table A4 provides characteristics of teachers by the number of schools they listed on their application.) Ultimately, 29 percent of transfer applicants did transfer schools by the start of the next school year, and another 12 percent exited the district.
Descriptive Statistics for Teachers, Transfer Applicants, and Principals.
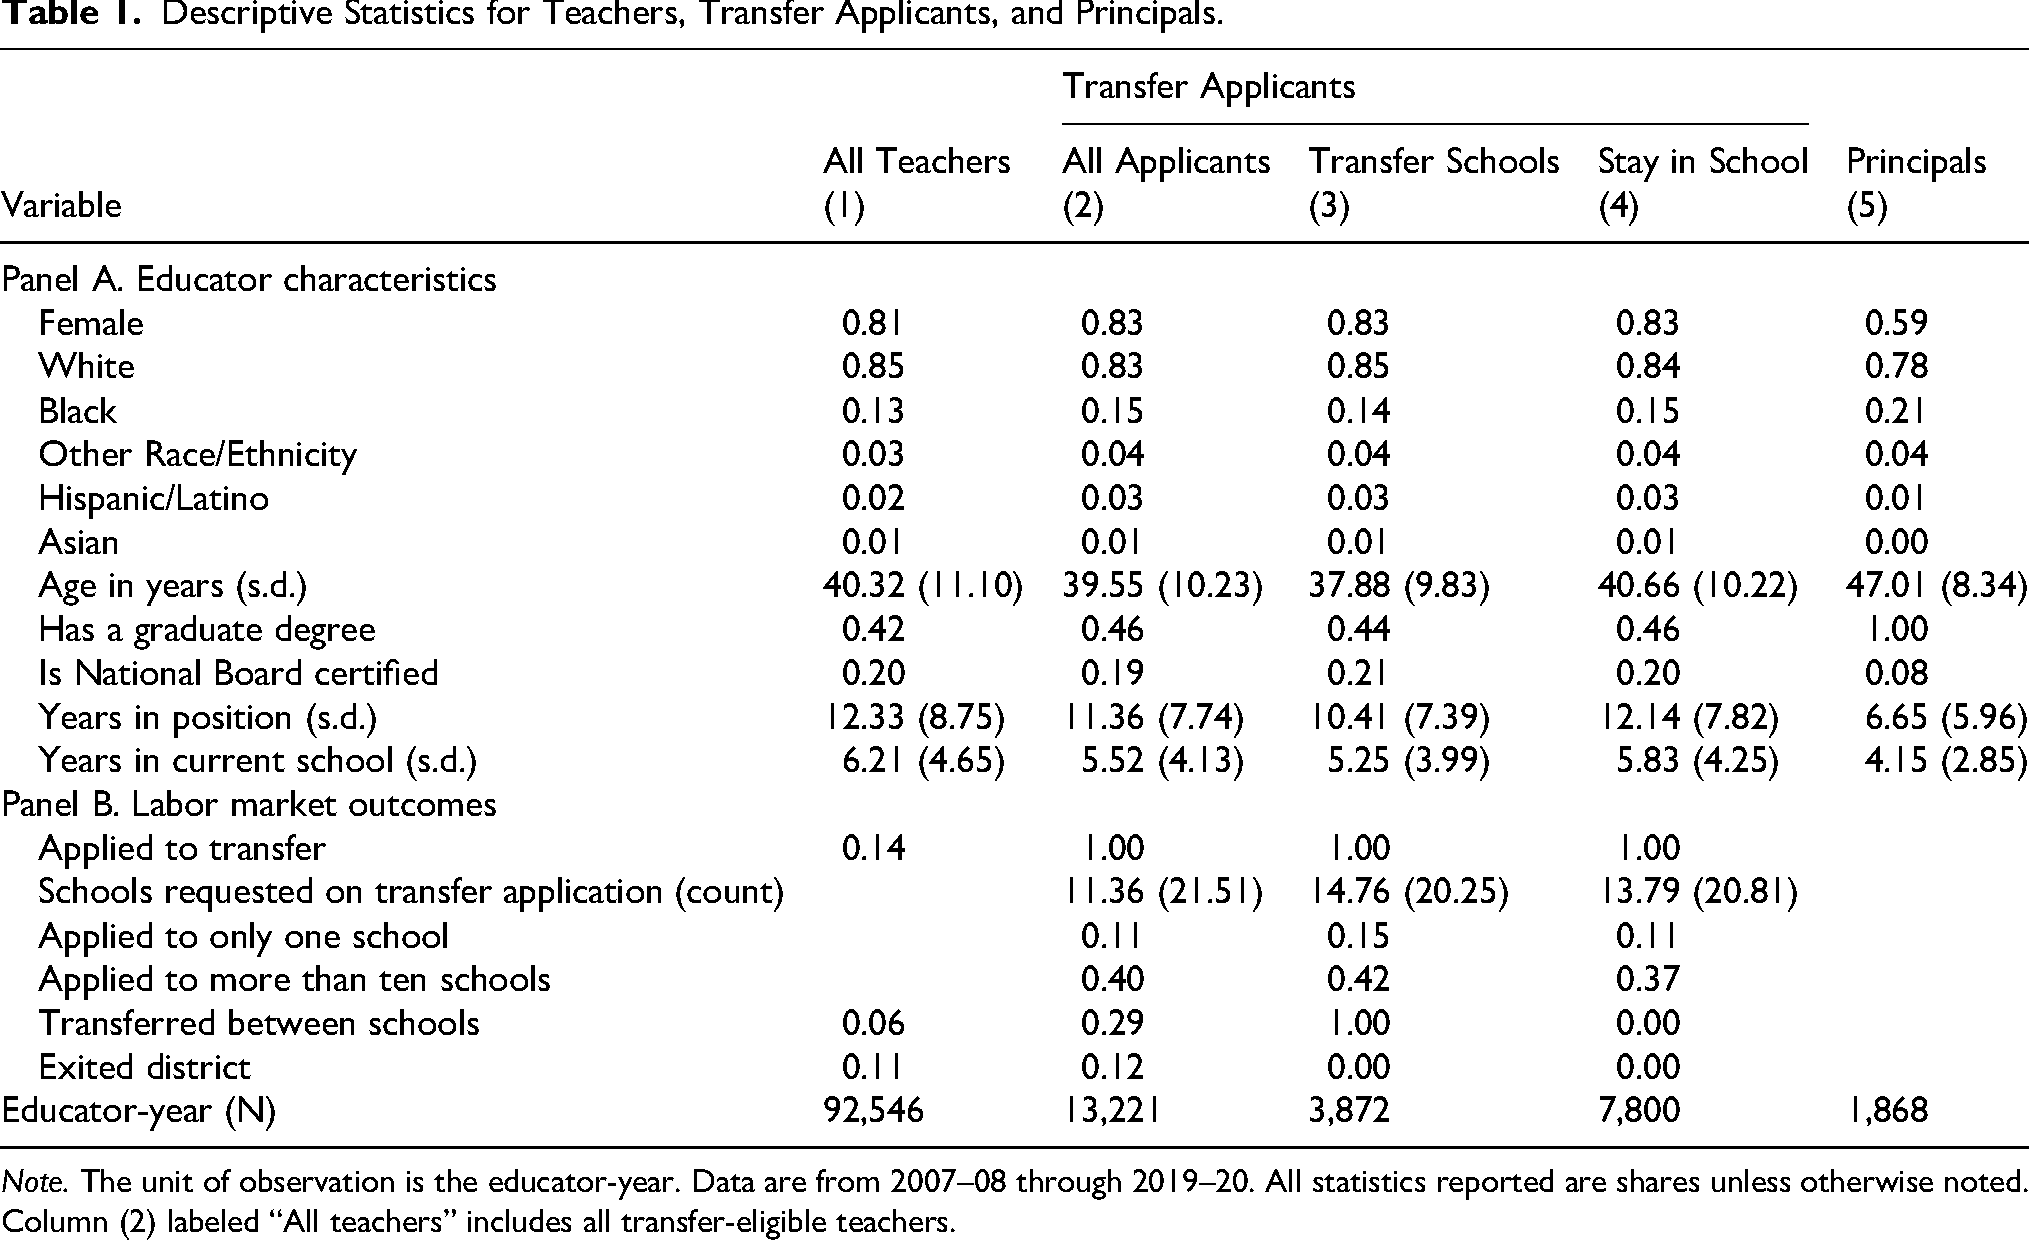
Note. The unit of observation is the educator-year. Data are from 2007–08 through 2019–20. All statistics reported are shares unless otherwise noted. Column (2) labeled “All teachers” includes all transfer-eligible teachers.
The population of principals during this period looks noticeably different from teachers on observable characteristics. Fewer principals were female (59 percent), and principals were more likely to be Black (21 percent). All principals had graduate degrees (per certification requirements), but only 8 percent held National Board Certification while 20 percent of teachers did. Further, the average principal had been in their position at their current school for about 4 years compared to 6 years for teachers.
Table 2 describes the current school for all transfer-eligible teachers in Column (1) and for transfer applicants in columns (2)-(4). The table also includes information about the principals and schools that applicants requested in columns (5)-(7) to provide a contrast of their current school with the schools. Panel A reports principal characteristics. Among all transfer-eligible teachers, 61 percent worked at schools where the principal had 5 or more years of experience, whereas 17 percent worked at schools with a new principal. Regarding demographic congruence, 73 percent worked for a principal of the same race, and 57 percent worked for a principal of the same sex.
Descriptive Statistics for Teacher's Current School and Application School.
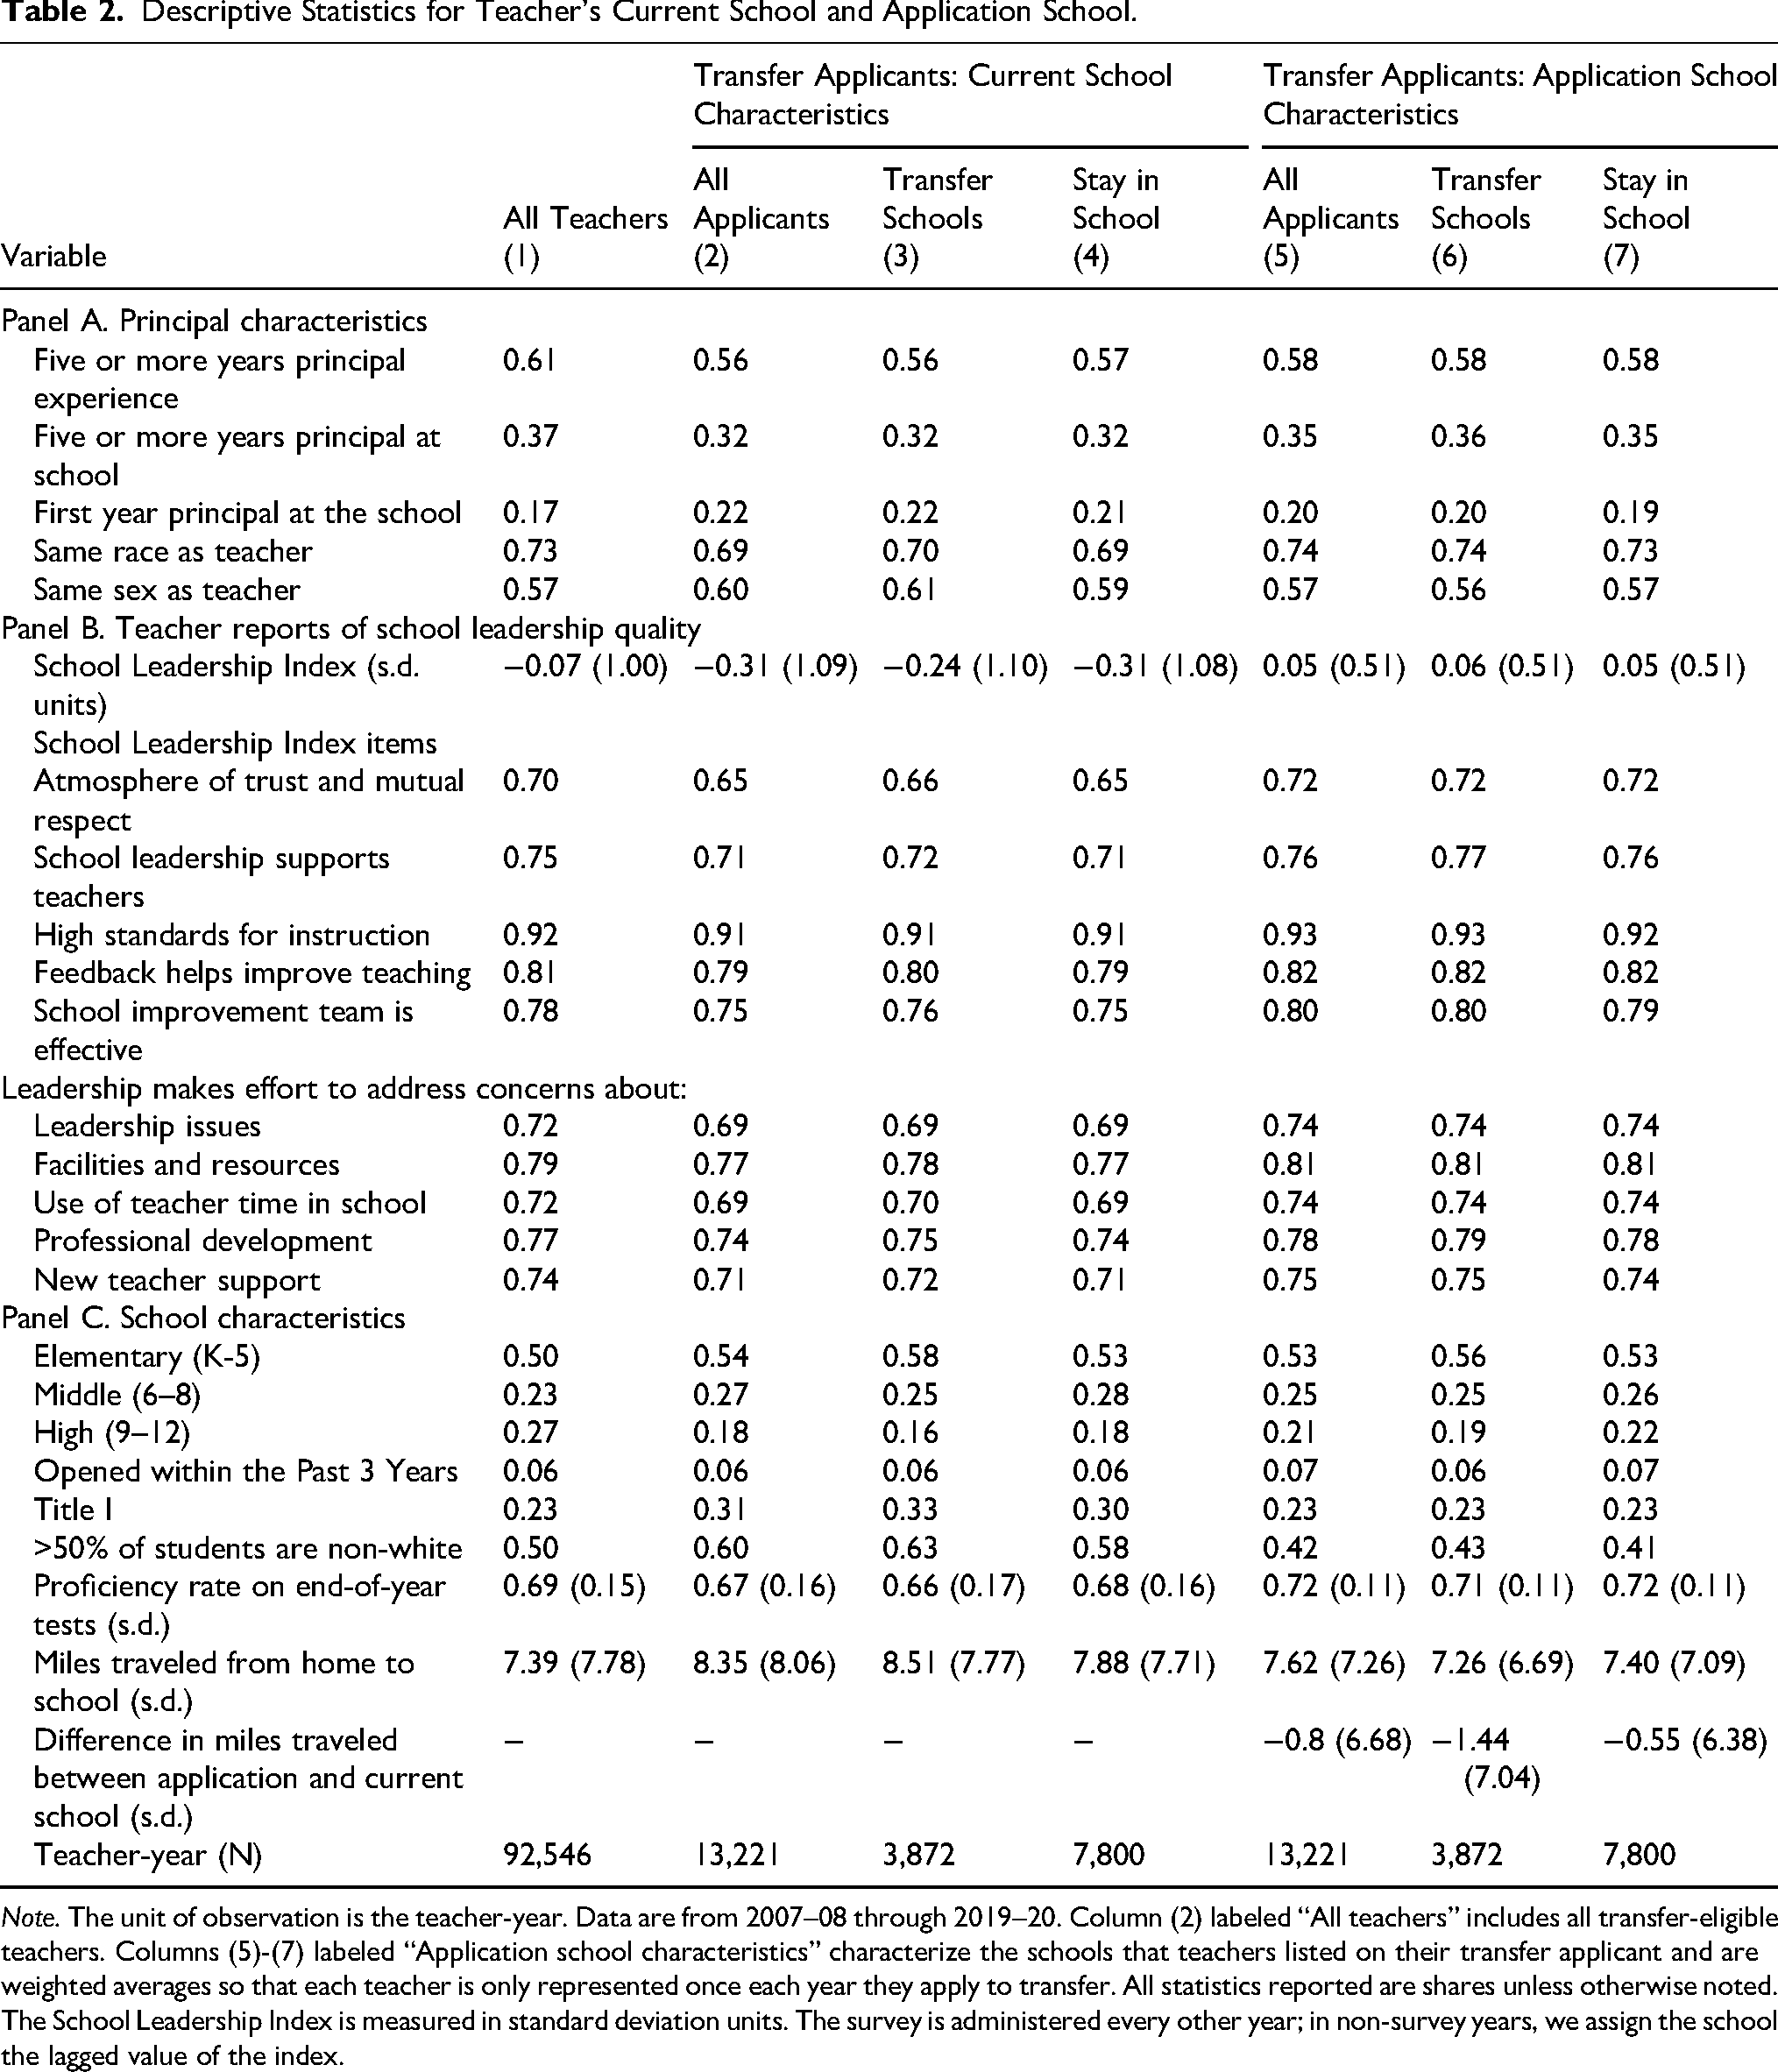
Note. The unit of observation is the teacher-year. Data are from 2007–08 through 2019–20. Column (2) labeled “All teachers” includes all transfer-eligible teachers. Columns (5)-(7) labeled “Application school characteristics” characterize the schools that teachers listed on their transfer applicant and are weighted averages so that each teacher is only represented once each year they apply to transfer. All statistics reported are shares unless otherwise noted. The School Leadership Index is measured in standard deviation units. The survey is administered every other year; in non-survey years, we assign the school the lagged value of the index.
Panel B provides information about the School Leadership Index, including the share of teachers who agreed or strongly agreed with each survey item. The average transfer-eligible teacher worked at a school with a School Leadership Index value of −0.07 standard deviation units while transfer applicants worked at schools with lower reports (−0.31 s.d. units). Further, looking just at transfer applicants, the average School Leadership Index at their current school was lower for those who ultimately transferred schools compared to those who stayed (−0.31 s.d. units compared to −0.24 s.d. units). Interestingly, the schools that transfer applicants sought to transfer into generally had higher values on the index (∼0.05 s.d. units).
Panel C shows school characteristics. Among all transfer-eligible teachers, 23 percent worked at a Title I School, and 50 percent worked at a school where students from minoritized racial/ethnic groups comprised over half the student population. Some student characteristics were associated with completing a transfer application. For example, 31 percent of transfer applicants worked at Title I schools compared to 23 percent of all transfer-eligible teachers.
Among transfer applicants, 33 percent of those who transferred worked in a Title I school compared to 30 percent of those who stayed. Distance between teacher home and current school was also related to transfer status. 5 Transfer applicants had a commute that was about a mile longer than all transfer-eligible teachers (8.35 miles versus 7.39 miles), and then, among transfer applicants, those who transferred also tended to travel farther to get to their schools than did transfer applicants who stayed at their current school (7.9 miles, on average, versus 8.5 miles). Finally, applicants selected schools on the transfer application that were roughly one mile closer to home, on average, than were their current schools.
Methods
RQ1. Characterizing the Principals of Schools That Teachers Seek to Exit
We first predicted whether a teacher applied to transfer away from their current school with characteristics of the current-school principal, the current school itself, and the teacher. We estimated the linear probability model shown in Equation (1):
Apply equaled 1 if teacher i completed a transfer application to leave current school c in year t, and 0 otherwise. We modeled the decision to complete a transfer application as a function of a vector of school leadership qualities stability in school leadership (indicator variables that denoted if the principal was new to the school or if the principal had been at the same school for five years or more); demographic congruence between principals and teachers (an indicator variable that equaled 1 if the teacher and current-principal were the same race and 0 otherwise, and an indicator variable that equaled 1 if the teacher and current-school principal were the same sex
6
and 0 otherwise); leadership quality was measured by teacher survey responses (described in more detail in the Data and Sample section), which was standardized to have a mean of 0 and a standard deviation of 1; and whether the applicant and the principal were previously colleagues (an indicator variable that equaled 1 if they were colleagues and 0 otherwise).
Based on previous literature, we also included a broad set of school-level characteristics as control variables,
The estimated coefficients of interest were in the
RQ2. Estimating Transfer Applicant Preferences for Principals and Schools
On the transfer application itself, teachers could have requested any district school. At the time of the application, it was unknown whether the school would have an opening for which the teacher was qualified the following school year. Thus, we assumed that any transfer applicant who requested a school on their application preferred that school to any school they did not select and to their current school. Thus, we applied an estimation strategy like that shown in Equation (1) to examine transfer applicants’ preferences for principal and school characteristics. We estimated Equation (2):
Conditional on completing a transfer application, Request equaled 1 if transfer applicant i requested application school a in year t, and 0 if they did not. Because all schools were on the transfer application, we allowed each school to be in the applicant's choice set; however, we present results in the appendix with some restrictions. We modeled the decision to request a school on the transfer application as a function of the
The estimated coefficients of interest were in the
Results
We start by establishing that there was a meaningful relationship between teacher transfer-seeking behaviors and their eventual labor market decisions. At the school-by-year level, the correlation between the share of teachers who completed a transfer application and the school's turnover rate later that same year was 0.57. This relationship between transfer seeking and turnover builds on recent work that documents the positive correlation between teachers’ stated intentions to leave and actual turnover nationally (Nguyen et al., 2025). Further, this result suggests that teacher transfer requests away from a school could be considered an early indicator of school-level turnover at the end of the school year.
RQ1. Characterizing the Principals of Schools That Teachers Seek to Exit
Table 3 reports the associations between various factors at the teacher's current school and the teacher's likelihood of completing a transfer application as specified in Equation (1). 7 We describe the results shown in Column (1), though the results in Column (2) with school fixed effects were qualitatively similar. Teachers at schools with new principals were 3.7 percentage points more likely to complete a transfer application (compared to teachers who had a principal who had been at the school for 1–4 years). In addition, teachers whose current schools were one standard deviation above average on the School Leadership Index were 2.7 percentage points less likely to complete a transfer application. Consistent with previous studies (Boyd et al., 2013; Cannata, 2010; Engel et al., 2014), we also show that teachers who lived the farthest from their schools were 5.3 percentage points more likely to complete a transfer application than teachers who lived closest to their schools.
Predictors of a Teacher Applying to Transfer Away from Their Current School.
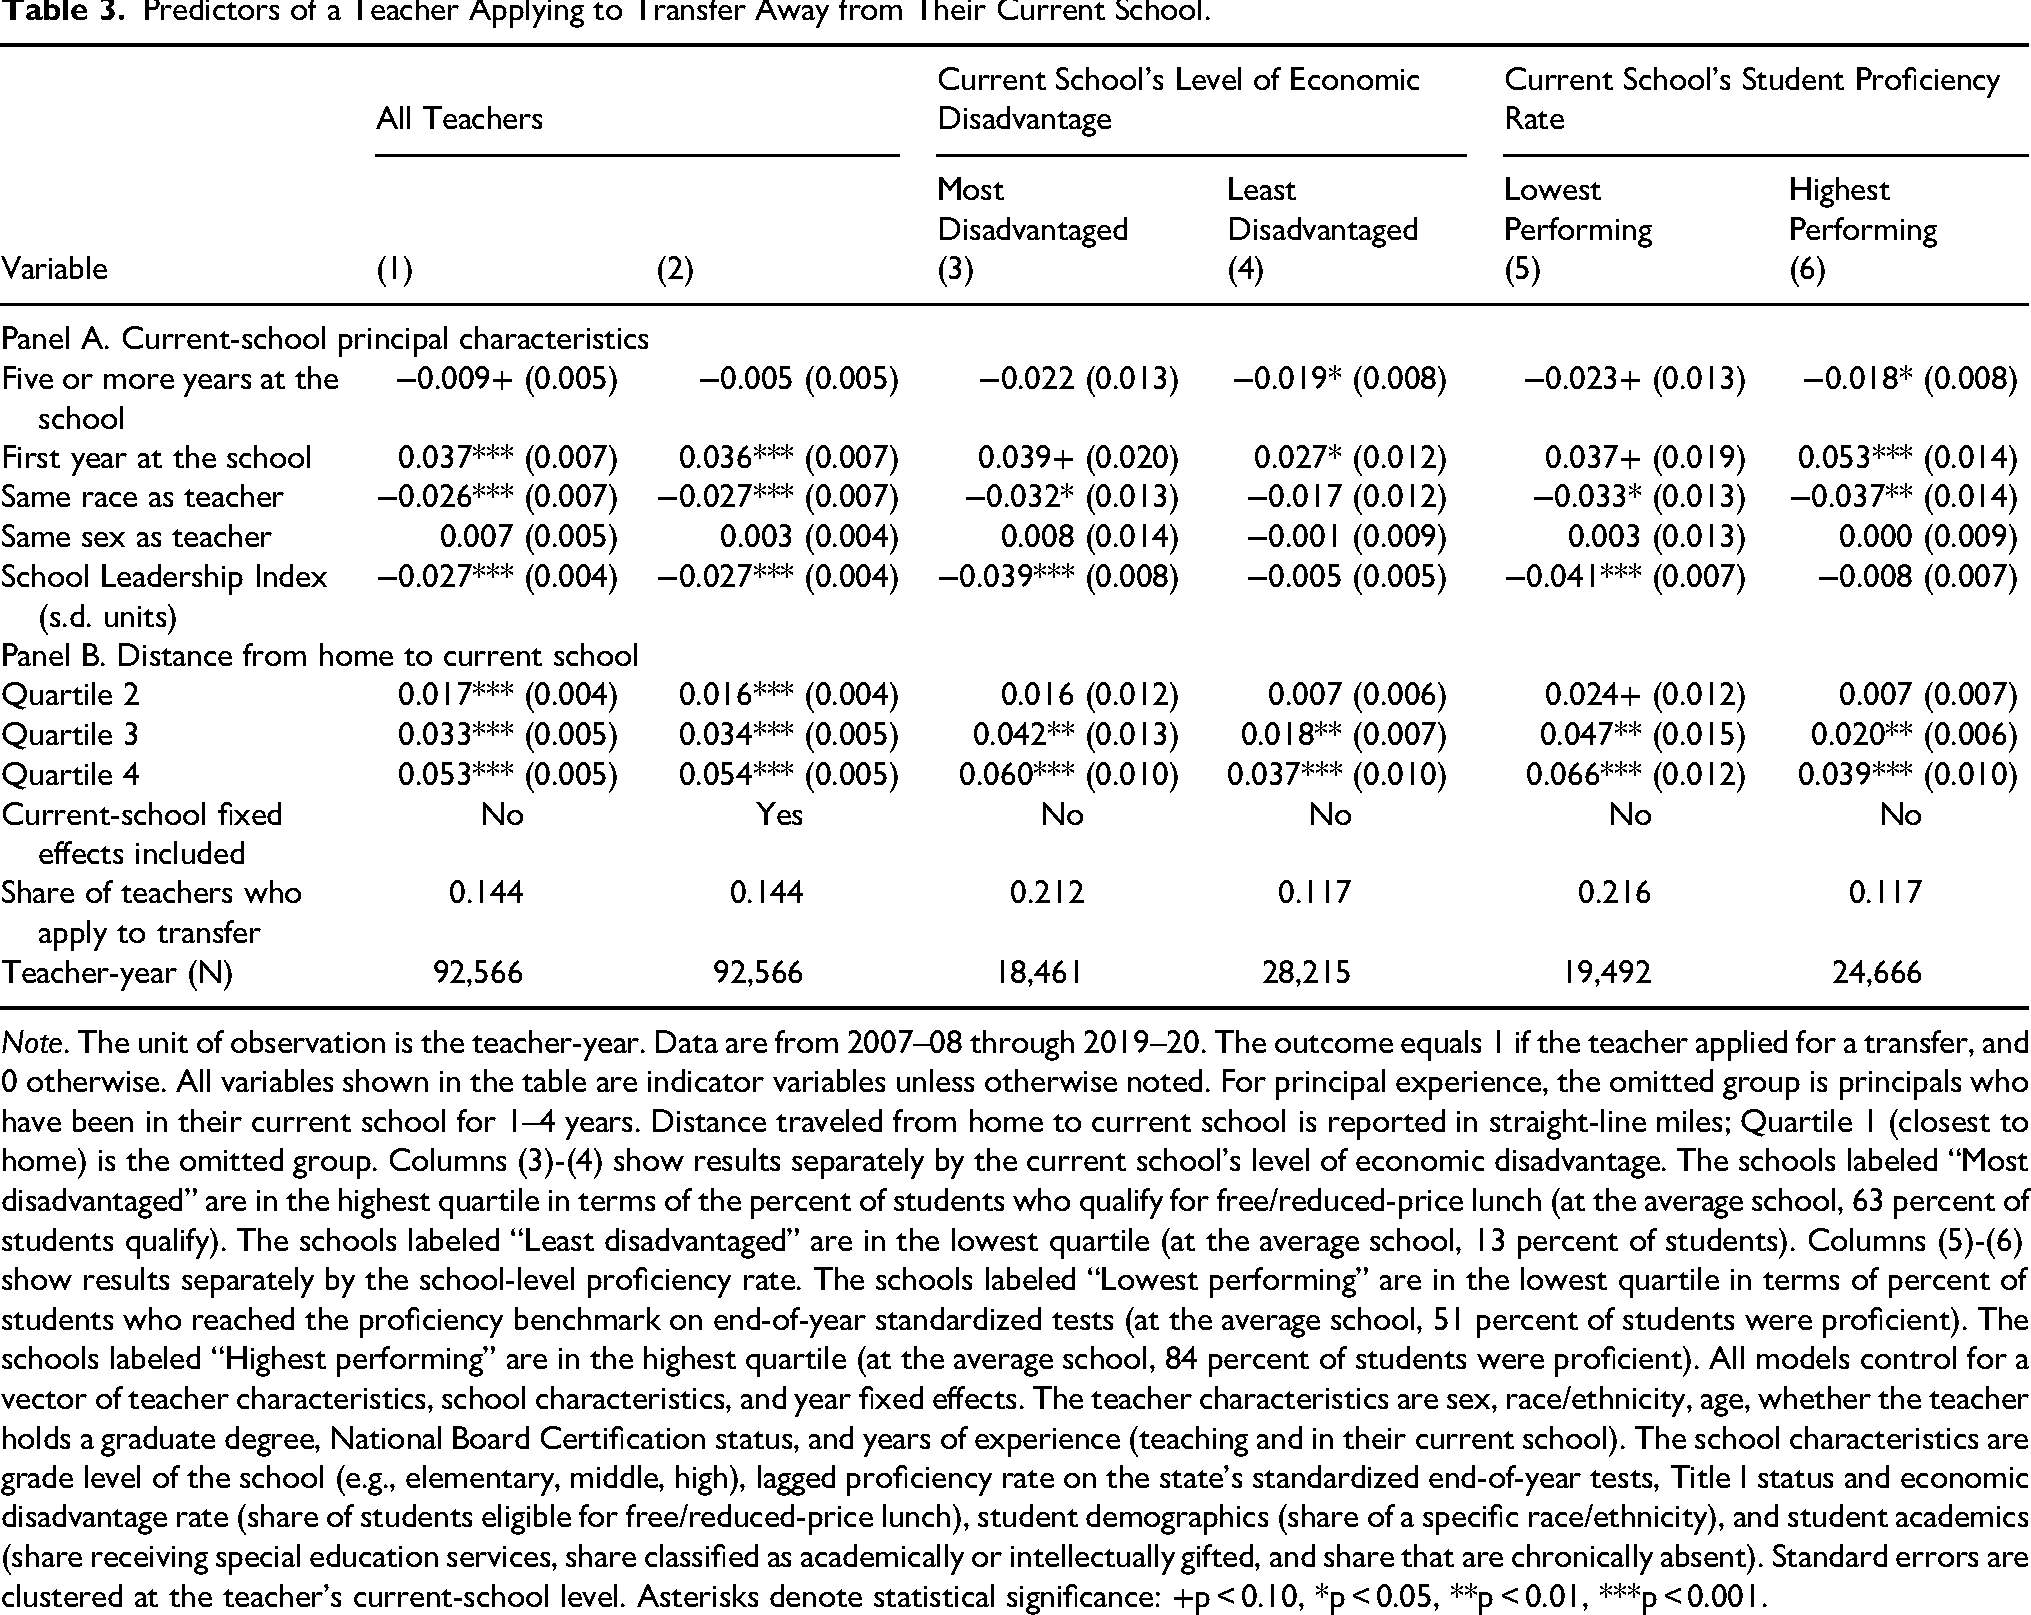
Note. The unit of observation is the teacher-year. Data are from 2007–08 through 2019–20. The outcome equals 1 if the teacher applied for a transfer, and 0 otherwise. All variables shown in the table are indicator variables unless otherwise noted. For principal experience, the omitted group is principals who have been in their current school for 1–4 years. Distance traveled from home to current school is reported in straight-line miles; Quartile 1 (closest to home) is the omitted group. Columns (3)-(4) show results separately by the current school's level of economic disadvantage. The schools labeled “Most disadvantaged” are in the highest quartile in terms of the percent of students who qualify for free/reduced-price lunch (at the average school, 63 percent of students qualify). The schools labeled “Least disadvantaged” are in the lowest quartile (at the average school, 13 percent of students). Columns (5)-(6) show results separately by the school-level proficiency rate. The schools labeled “Lowest performing” are in the lowest quartile in terms of percent of students who reached the proficiency benchmark on end-of-year standardized tests (at the average school, 51 percent of students were proficient). The schools labeled “Highest performing” are in the highest quartile (at the average school, 84 percent of students were proficient). All models control for a vector of teacher characteristics, school characteristics, and year fixed effects. The teacher characteristics are sex, race/ethnicity, age, whether the teacher holds a graduate degree, National Board Certification status, and years of experience (teaching and in their current school). The school characteristics are grade level of the school (e.g., elementary, middle, high), lagged proficiency rate on the state's standardized end-of-year tests, Title I status and economic disadvantage rate (share of students eligible for free/reduced-price lunch), student demographics (share of a specific race/ethnicity), and student academics (share receiving special education services, share classified as academically or intellectually gifted, and share that are chronically absent). Standard errors are clustered at the teacher's current-school level. Asterisks denote statistical significance: +p < 0.10, *p < 0.05, **p < 0.01, ***p < 0.001.
We also explored whether teacher preferences varied by two school-level characteristics: economic disadvantage shown in columns (3)-(4) and proficiency rate on state standardized tests columns (5)-(6). Because the results for all teachers were so similar without and with school fixed effects, we only report coefficients without school fixed effects in these columns. Looking at the level of economic disadvantage at the school, the coefficient estimates for teachers working in the most economically disadvantaged schools were generally larger in magnitude than they were for teachers working in the least disadvantaged schools. As such, transfer-seeking behaviors of teachers working with higher-poverty student populations were more sensitive to principal and school characteristics that their peers in lower-poverty schools. For example, teachers in the most disadvantaged schools were 3.9 percentage points less likely to apply to transfer when school leadership was strong whereas teachers in the least disadvantaged schools were not responsive to School Leadership index. There were similar patterns when comparing teacher transfer seeking across schools with low- and high-proficiency rates. Principal characteristics were more predictive of the likelihood that a teacher completed an application to transfer away from their current school when they worked in a school with low levels of achievement than in a school with high levels of achievement.
RQ2. Estimating Transfer Applicant Preferences for Principals and Schools
We now discuss the characteristics of application-school principals and application schools that attracted transfer applicants. Table 4 provides the coefficient estimates from the regression of whether a transfer applicant requested a school on their application on the characteristics of the application-school principal and the distance between the applicant's home and the application school as shown in Equation (2). Again, we describe the results shown in Column (1), although the results in Column (2) with school fixed effects were qualitatively similar.
Predictors of a Teacher Listing an Application School on Their Transfer Application.
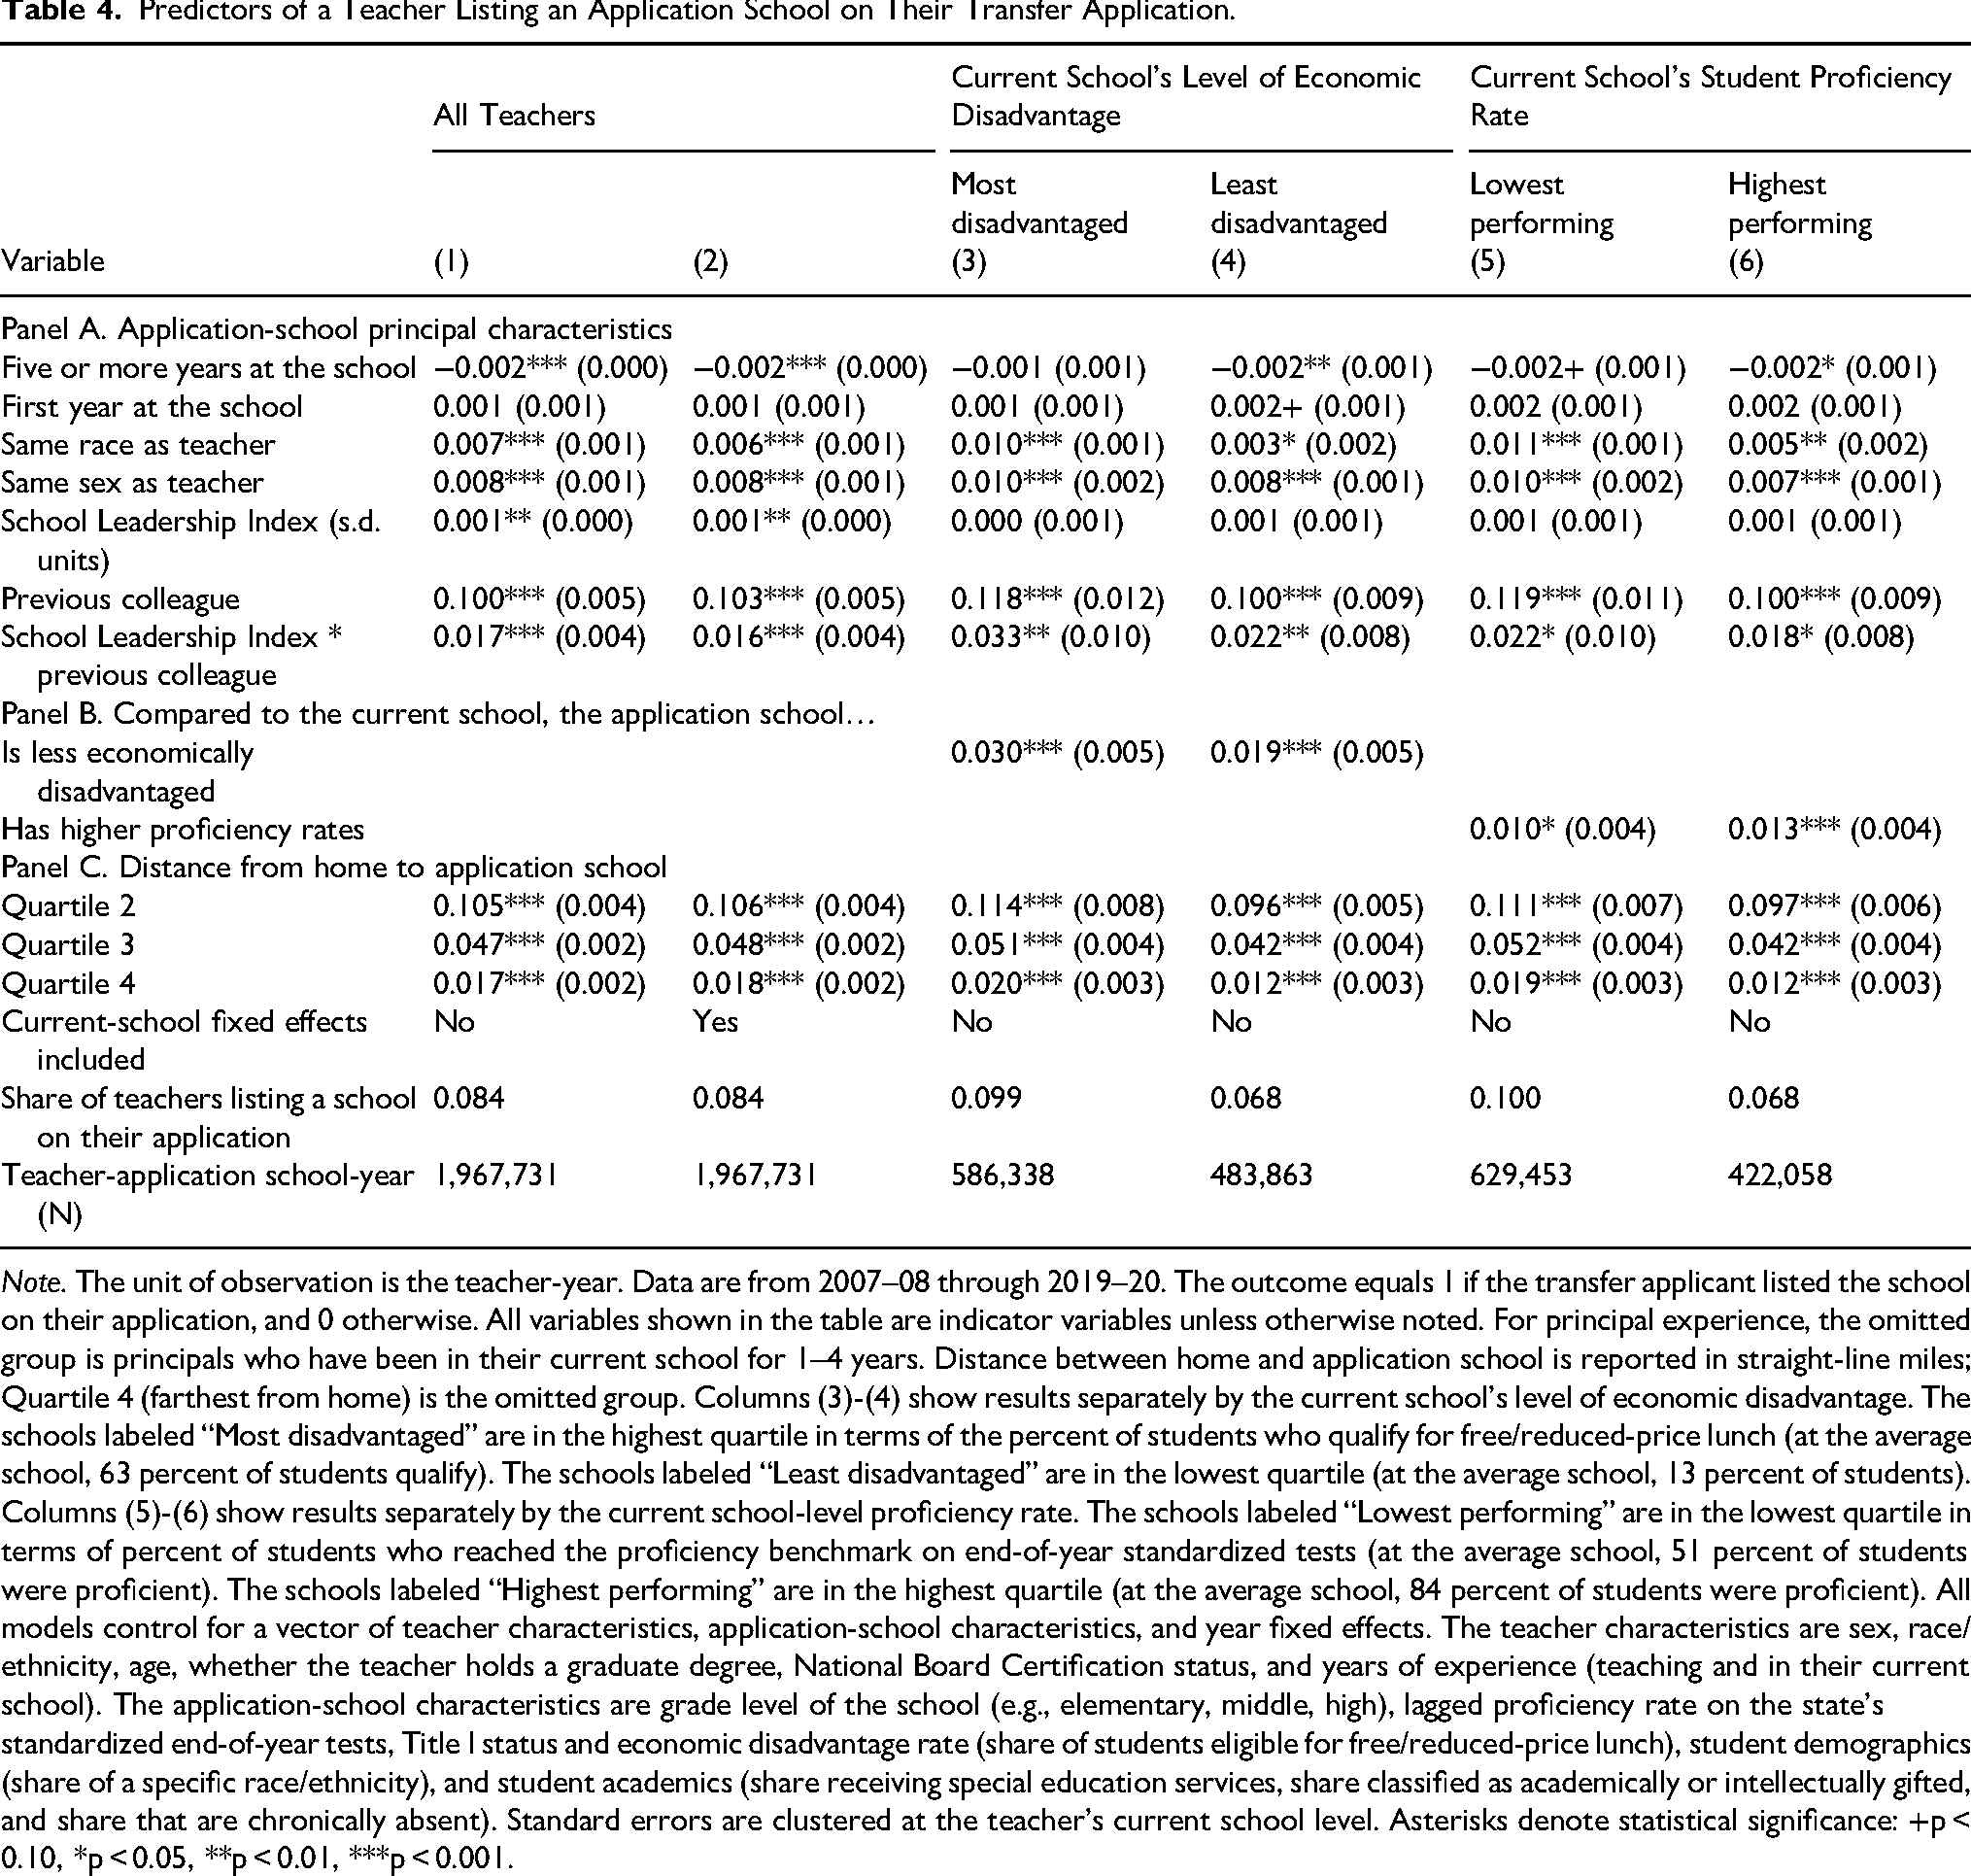
Note. The unit of observation is the teacher-year. Data are from 2007–08 through 2019–20. The outcome equals 1 if the transfer applicant listed the school on their application, and 0 otherwise. All variables shown in the table are indicator variables unless otherwise noted. For principal experience, the omitted group is principals who have been in their current school for 1–4 years. Distance between home and application school is reported in straight-line miles; Quartile 4 (farthest from home) is the omitted group. Columns (3)-(4) show results separately by the current school's level of economic disadvantage. The schools labeled “Most disadvantaged” are in the highest quartile in terms of the percent of students who qualify for free/reduced-price lunch (at the average school, 63 percent of students qualify). The schools labeled “Least disadvantaged” are in the lowest quartile (at the average school, 13 percent of students). Columns (5)-(6) show results separately by the current school-level proficiency rate. The schools labeled “Lowest performing” are in the lowest quartile in terms of percent of students who reached the proficiency benchmark on end-of-year standardized tests (at the average school, 51 percent of students were proficient). The schools labeled “Highest performing” are in the highest quartile (at the average school, 84 percent of students were proficient). All models control for a vector of teacher characteristics, application-school characteristics, and year fixed effects. The teacher characteristics are sex, race/ethnicity, age, whether the teacher holds a graduate degree, National Board Certification status, and years of experience (teaching and in their current school). The application-school characteristics are grade level of the school (e.g., elementary, middle, high), lagged proficiency rate on the state's standardized end-of-year tests, Title I status and economic disadvantage rate (share of students eligible for free/reduced-price lunch), student demographics (share of a specific race/ethnicity), and student academics (share receiving special education services, share classified as academically or intellectually gifted, and share that are chronically absent). Standard errors are clustered at the teacher's current school level. Asterisks denote statistical significance: +p < 0.10, *p < 0.05, **p < 0.01, ***p < 0.001.
Many of the applicant-school principal characteristics were statistically significant but relatively weak predictors of a teacher's likelihood of requesting a specific school on the transfer application, especially when compared to the estimated coefficients from Table 3 that predicted whether a teacher completed a transfer application. For example, we found that transfer applicants were nearly one percentage point more likely to request a school led by a principal of their same race or sex. They were also slightly more likely to request schools with more favorable reports of school leadership. It is quite plausible that teachers would have had less information about places where they had not worked relative to their current schools or to other schools where they had previously worked. Information about school principals was also less publicly accessible than school characteristics were. A school report card included student demographics or performance levels but not information about things like principal experience.
There was, however, one principal characteristic that strongly predicted whether the transfer applicant requested the school: if the applicant had previously worked with the principal in another school context, there was a 10.0 percentage-point increase in the likelihood that the applicant requested the school on the transfer application. 8 From the administrative data, we could not determine whether principals had reached out to their former colleagues or if transfer applicants had independently sought schools led by former colleagues, though both could have been contributing factors. Regardless of the mechanism, having previously worked with a principal was the main characteristic associated with requesting a transfer to a specific school. Further, the magnitude of that relationship was comparable to the likelihood of a transfer applicant having requested a school near their home relative to one farther from their home.
While having worked previously with a principal was associated with an increased likelihood of the transfer applicant requesting that principal's school, it was not guaranteed that the applicant chose the school. Indeed, when a transfer applicant could have requested a school led by a former colleague, they did so 24 percent of the time. We hypothesized that a transfer applicant was more likely to request a transfer to a school led by a former colleague when that principal received stronger reports of leadership. We tested for this hypothesis by interacting the former-colleague indicator with the School Leadership Index. The coefficient on the interaction term implies that transfer applicants were more likely to request a school led by a former colleague when teachers rated that principal's leadership more favorably. For example, Column (1) implied that a transfer applicant was 11.9 percentage points more likely to have requested a school led by a former colleague when the School Leadership Index was one standard deviation above average (compared to former colleagues whose index was below average). 9
Table 4 also presents heterogeneity in transfer applicant preferences for principal and characteristics by characteristics of their current school - again, school-level economic disadvantage and proficiency rates. These regressions allowed us to test whether teachers who currently worked in more disadvantaged schools or schools with lower proficiency rates were especially likely to seek out more advantaged schools or schools with higher proficiency rates. The coefficients shown in the rows labeled “Comparing application school to current school” do just that. Teachers who were working in a highly disadvantaged school were 3.0 percentage points more likely to choose a school that was more economically advantaged than their current school than when the school was less economically advantaged than their current school. For applicants already working in economically advantaged schools, the comparable coefficient was 1.9 percentage points. In sum, regardless of their current school's level of economic advantages, teachers generally sought out schools that were more advantaged than their current school - but the magnitude of the relationship was stronger for teachers working in the most disadvantaged schools. The pattern was similar when comparing teachers who currently worked in schools with low and high levels of proficiency.
Finally, the appendix includes results from two robustness checks. First, we assumed in our analysis above that all district schools were in every transfer applicant's choice set. Table A7 presents results where we restricted every transfer applicant's choice set to the schools where their certifications made them eligible for employment based on the applicant's own certifications. For example, we limited the choice set of a teacher who held elementary certification to schools with grades K-5. The point estimates in Table A7 were qualitatively similar but slightly larger in magnitude compared to those based on the unrestricted choice set. Second, teachers who completed a transfer application later during the transfer period may have had more information about vacancies than those who applied earlier during the period, which may have influenced their choices. Therefore, Table A8 includes results separately for teachers who applied to transfer in January-February and March-May. The coefficient estimates were similar to those in Table 4.
RQ3. Putting the Information from Transfer Requests Together: Demand for Positions at the School Level
We now characterize teacher labor market dynamics through the lens of school principals who face the problem of fully staffing their schools each year. Each year, a school has vacant positions - primarily resulting from teacher departures. Principals must fill these positions, drawing from the teachers who decide to apply to the school (either via transfer request or applying from outside the district). Those teachers comprise the school's application pool. In this section, we examine the depth of the application pool in terms of how many requests principals received to transfer into their school compared to the number of transfer requests out at that school. Because the number of teachers seeking to transfer out of a school was correlated with the eventual turnover rate at the school, we used transfer requests out of the school as a proxy for school-level vacancies in this analysis.
First, we found wide variation in transfer applicant demand for working in a given school. Figure 1 shows the distribution of two demand measures: Panel A shows the total number of teachers who requested the school on the transfer application in a given year, and Panel B shows the ratio of the number of transfer applicants that requested a school to the number of teachers who sought to transfer out of that school (we refer to this as the “demand-to-vacancy ratio”). Across all years, the average school received a total of 98 applications with a demand-to-vacancy ratio of 23 applications in for every one transfer request out. This variation in transfer applicant interest in schools is consistent with the previously reported findings that some principal and school characteristics appealed more strongly to transfer applicants than others.
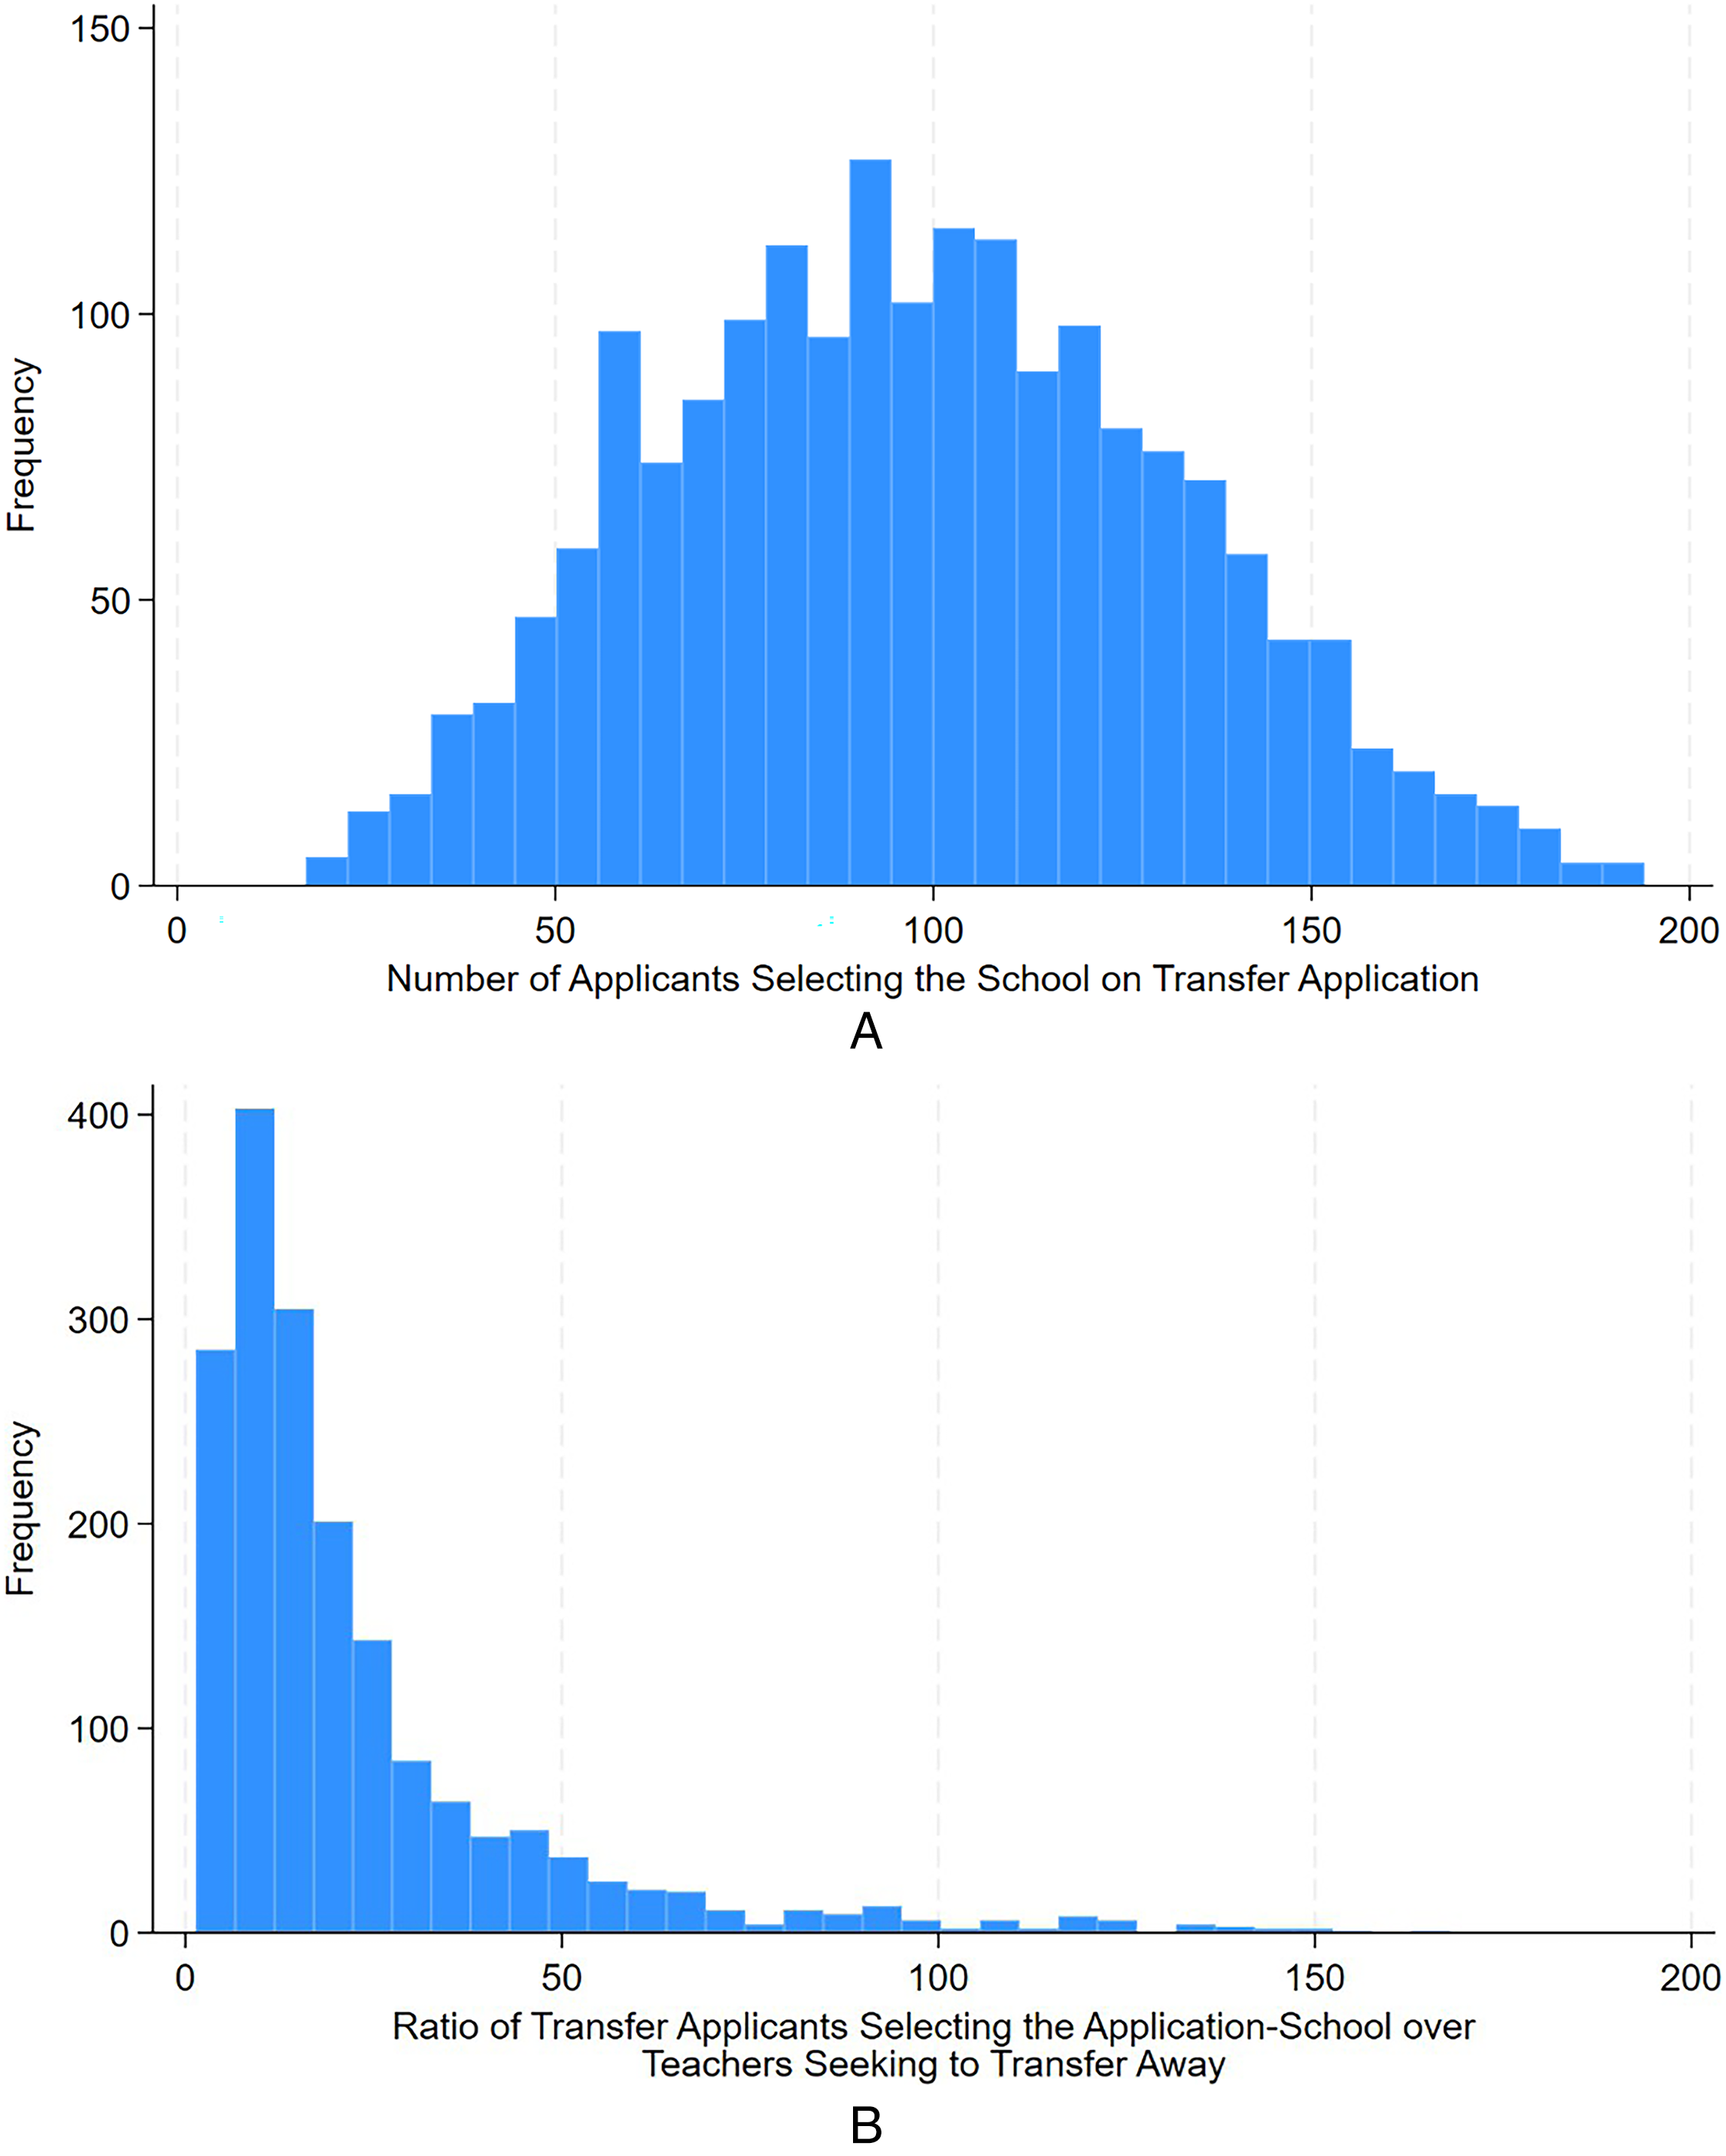
Transfer applicant demand for schools. Panel A. Distribution of the number of transfer applicants selecting the school. Panel B. Distribution of the number of transfer applicants selecting the school divided by the number of transfer applicants seeking to leave the same school. Note. In both panels, the unit of observation is school-year. In Panel A, the mean number of applications to a school is 98 applications (s.d. = 34). In Panel B, the mean ratio is 23 applications to a school for every 1 application away from the same school (s.d. = 24).
To augment the descriptive findings above, we conduct an analysis in the spirit of Boyd, Lankford, et al. (2011; see their Table 4) and model teacher demand for a school as a function of the characteristics of the current school's principal, teachers, structure and organization, and students. We operationalize teacher demand for a school as the ratio of the number of transfer applications into the school over the number of teachers seeking to transfer out of the same school (a proxy for eventual vacancies). A value of one on the ratio implies that a school has the same number of teachers applying to transfer in as seeking to transfer out. As the value increases, the number of teachers seeking to transfer in increasingly exceeds the number of teachers seeking to transfer out, which means that the school will have a larger applicant pool from which to fill vacancies. In the regression, we log the demand ratio so that the coefficients can be interpreted as percent changes in demand for the school. Table 5 presents the results of this analysis. (For reference, Table A9 reports descriptive statistics about principals and schools for schools in different quartiles of the ratio described in Table 5.)
Current-School Predictors of Whether a Teacher Completes a Transfer Application.
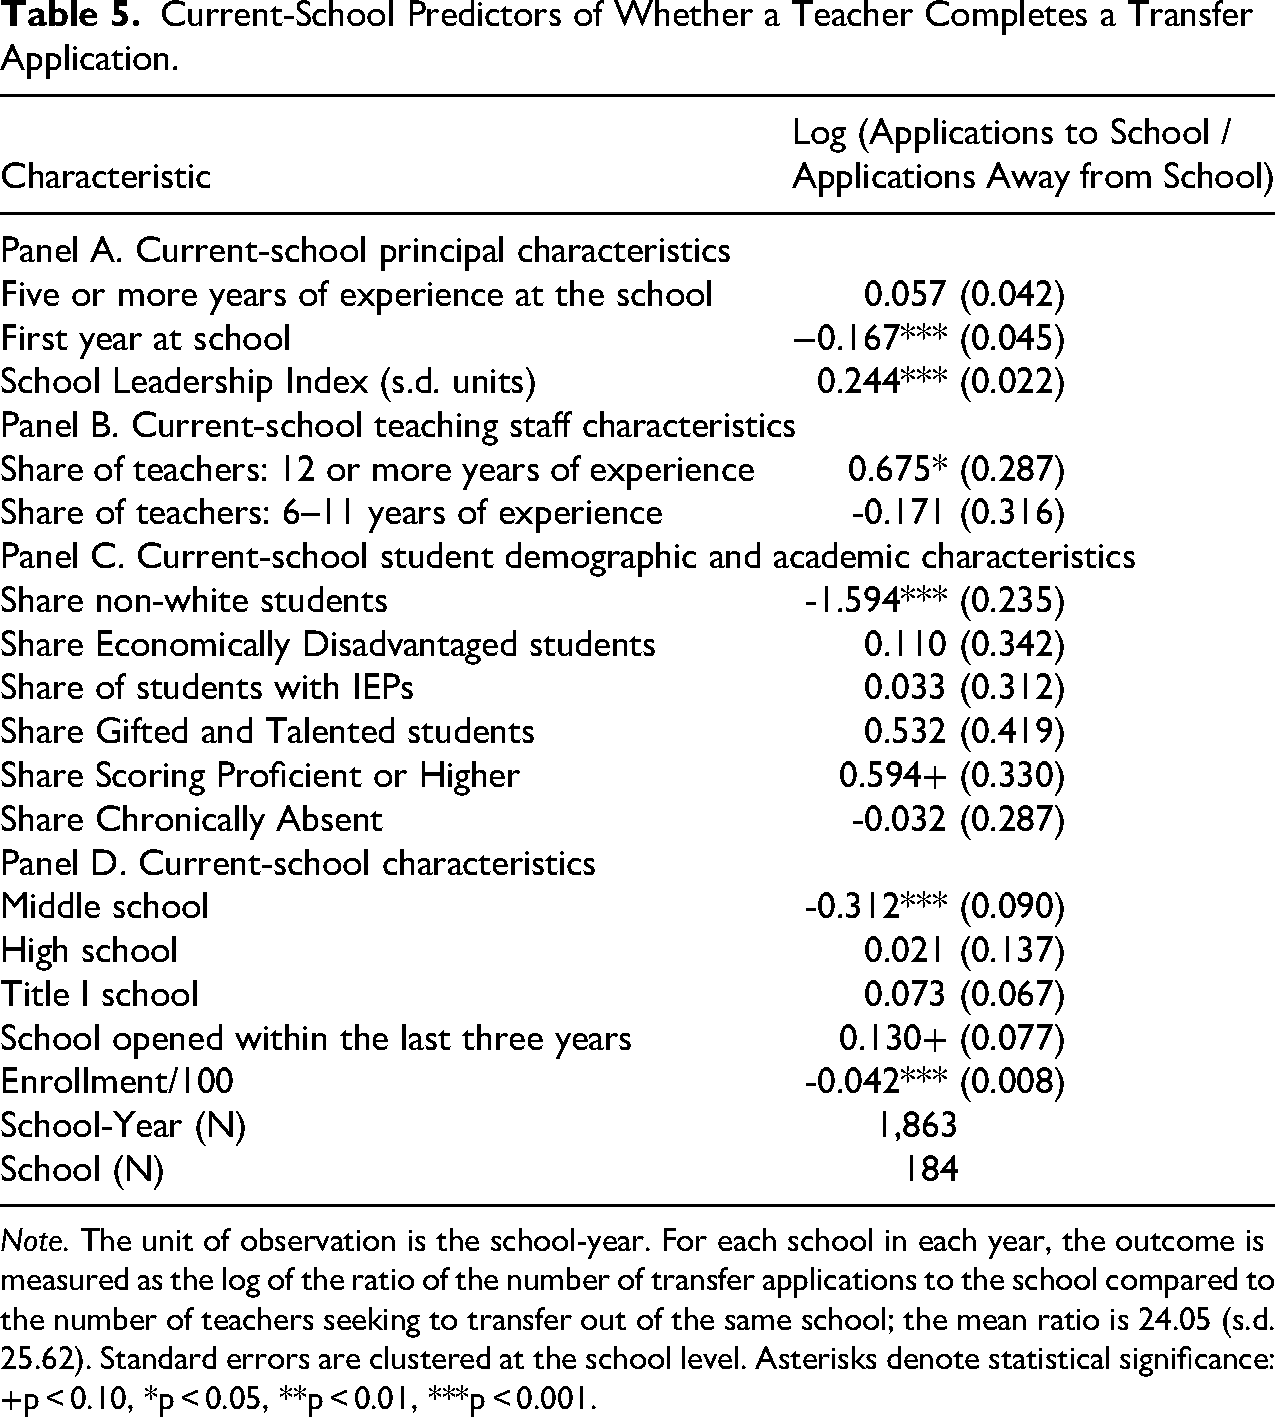
Note. The unit of observation is the school-year. For each school in each year, the outcome is measured as the log of the ratio of the number of transfer applications to the school compared to the number of teachers seeking to transfer out of the same school; the mean ratio is 24.05 (s.d. 25.62). Standard errors are clustered at the school level. Asterisks denote statistical significance: +p < 0.10, *p < 0.05, **p < 0.01, ***p < 0.001.
First, Table 5 shows that select educator characteristics are strong predictors of demand for a school. Demand for schools with new principals is 17 percent lower than at schools with more experienced principals; similarly, schools with higher teacher reports on the Leadership Index are in higher demand than schools with lower teacher reports. Consistent with Boyd, Lankford, et al. (2011), we find that teachers appear to prefer working with more-experienced teachers: a 10-percentage-point increase in the proportion of teachers with 12 or more years of teaching experience is associated with a 7-percent increase in demand for the school. Second, much like Boyd, Lankford, et al. (2011) tfound, we observe correlations between some school and student characteristics and teacher demand. For example, demand is relatively weak for middle schools and for schools that serve greater shares of non-white students, but relatively strong for newly opened schools and those where greater shares of students are proficient on standardized tests. Looking across these results, we conclude that schools serving the most vulnerable students who could have benefitted the most from strong teachers were typically the same schools that experienced the least interest from transfer applicants to fill vacancies.
Discussion
Researchers have established that principals directly and indirectly influence the school environment (Burkhauser, 2017; Grissom et al., 2018; Sebastian & Allensworth, 2019) and a range of student outcomes (Bartanen, 2020; Bartanen & Grissom, 2023; Hanushek et al., 2024; Sebastian & Allensworth, 2012, 2019). In this paper, we add to the literature in another critical area that principals influence: teacher labor market decisions. We found that characteristics of principals were associated with whether teachers completed a transfer application and, conditional on applying, the schools where teachers wanted to work. In WCPSS, schools where teachers had favorable reports of school leadership generally also had the lowest rates of teachers seeking to transfer away from the school, even after accounting for a robust set of teacher and school characteristics that previous studies had established as important factors for teacher turnover.
When looking at the number of transfer requests into a given school, we similarly found that not all schools were equally attractive to transfer applicants. Having previously worked with a school's principal was the strongest predictor of a teacher requesting that school on the transfer application, especially if teachers had rated that principal's leadership highly. Notably, the association between requesting a school and having worked with a principal in the past was similar in magnitude to requesting a school and the school being located near the transfer applicant's home. This follow-the-leader finding has implications for approaches to the management of school leadership talent pools. When a principal moves to another school, our findings suggest that, in the subsequent years, the district could reasonably expect an increase in teacher exits from the school that the principal left, especially if that leader was well liked by their staff. In many districts, control over principal hiring and placement processes is centralized; therefore, central office decision-makers may want to consider the implications of principal transfers for subsequent teacher attrition.
Another key finding from this research has important equity implications: on average, schools out of which teachers sought to transfer also had fewer transfer applicants requesting to work there, and those schools tended to serve historically marginalized student populations with academic need. We also showed that these schools were often led by principals who teachers reported were weaker leaders and had less experience. The good news is that research has shown that school climate is malleable and that principals can drive school culture change (Aldridge & Fraser, 2016; Allensworth & Hart, 2018; Kraft et al., 2016; Kraft & Papay, 2014). Some principals might need extra support and mentorship so that they are equipped with the leadership skills to foster school climates where teachers like to work and where they feel good at their jobs.
Admittedly, making positive changes to school climate is no small feat, and there is no one-size-fits-all solution for developing strong school leaders. However, transfer application data can provide insights about expected teacher turnover and, in turn, can inform retention and recruitment efforts. For example, WCPSS principals can already access real-time lists of teachers who have both actively sought to transfer out of their schools and of teachers who have requested to transfer into their schools. And, because this information is updated as soon as teachers submit their application through mid-spring when the application window closes, principals know who may leave their building in advance of when they receive their position allocations and hire for the following school year. A principal could use that information to tailor their retention efforts, especially toward teachers who are highly effective and/or in hard-to-staff teaching assignments. Central office decision-makers could further raise awareness by sending reminders to principals about the transfer list alongside actionable ways that principals could engage with transfer applicants with the goal of increasing the likelihood that they stay at the school.
Knowing how many teachers have sought to transfer away from their schools could also help central planners be more proactive in supporting specific schools as they work to staff their buildings fully. The district could aggregate transfer requests out of a building to the school level and use the data point as a leading indicator for vacancies. Most immediately, the district could use this aggregate measure to identify schools that will likely need extra support with hiring enough quality teachers for the upcoming school year. A longer-run approach might center around identifying principals at schools with high transfer-seeking rates and then providing them with targeted resources related to building strong relationships with their staff, connecting them with effective mentors, and/or creating professional networks focused on this problem of practice.
We acknowledge that the educator workforce patterns we found in WCPSS might differ in other settings. We do, however, believe our findings are generalizable to other settings. First, we found that school-level factors like academic performance and student demographics were correlated with teacher transfer behaviors in WCPSS, and these results had been similarly documented in studies from other contexts. Teachers in WCPSS also make employment decisions within a set salary scale, which is similar to how teachers operate in other districts across the country. Since teachers cannot typically increase their pay by switching schools within a district, they likely seek to improve their wellbeing by pursuing jobs at schools with working conditions that they prefer over their current school. Our study underscores the importance of the role of the principal as a key determinant of teacher satisfaction and working conditions, which is not context specific.
Our findings are especially policy relevant given the continued concerns about increasing reports of teacher burnout and teacher turnover rates after they held steady during the pandemic (Bacher-Hicks et al., 2023; Barnum, 2023; Bastian & Fuller, 2023; Diliberti et al., 2021; García et al., 2022; Goldhaber & Theobald, 2023; Jotkoff, 2022; Pressley, 2021; Steiner & Woo, 2021), though there is certainly more to learn about the qualities of principals that attract applicants to vacancies. A better understanding of the role principals play in drawing teachers to their school can inform the development of human resources policies and guide districts’ investments that aim to reduce churn among these teachers. Serving as a principal is a complex and nuanced job with a wide range of responsibilities, and we can only consider dimensions of school leadership that are available in the administrative and survey data. This area would benefit from qualitative research, including interviewing teachers about how they evaluate their employment options and how principals influence their decision making. Qualitative research would likely uncover a deeper understanding of teachers’ employment strategies and bring out areas where changes in policy or practice could lead to teacher workforce stability.
Footnotes
Author Note
The administrative data that we use are proprietary and provided by the WCPSS. We will retain the programs and any associated analytic datasets for at least five years, though other researchers will have to approach WCPSS to apply for data access.
Authorship is equal, and authors are listed in reverse alphabetical order. We thank participants at the Association for Public Policy Analysis and Management, the Society for Research on Educational Effectiveness Conference, and the Association for Education Finance and Policy Conference, as well as the University of North Carolina at Chapel Hill Educational Inequality Seminar. The paper benefited from discussions with Thad Domina and Bradley McMillen. Any views or opinions expressed in this paper are those of the authors and do not reflect those of their respective institutions. All errors are ours.
Funding
The authors received no financial support for the research, authorship, and/or publication of this article.
Declaration of Conflicting Interests
The authors declared no potential conflicts of interest with respect to the research, authorship, and/or publication of this article.