
Abstract
There are several techniques that increase the precision of subscores by borrowing information from other parts of the test. These techniques have been criticized on validity grounds in several of the recent publications. In this note, the authors question the argument used in these publications and suggest both inherent limits to the validity argument and empirical issues worth examining.
Introduction: Subscores and Adjusted Subscores
There are several techniques that increase the precision of subscores by borrowing information from other parts of the test. These techniques have been criticized on validity grounds in several recent publications such as Skorupski and Carvajal (2010) and Stone, Ye, Zhu, and Lane (2010). In this note, we question the argument used in these publications and suggest both inherent limits to the validity argument and empirical issues worth examining. We begin with an introduction to the techniques that borrow information from other parts of the test as part of the subscore computation process and then evaluate the validity arguments advanced recently concerning these techniques.
Interest in subscores in educational testing reflects their potential remedial and instructional benefit. According to the National Research Council report "Knowing What Students Know" (2001), the target of assessment is to provide particular information about an examinee’s knowledge, skill, and abilities. Subscores have the potential to provide such information; however, they are too often not reliable enough for their intended purposes. Several researchers have suggested methods that increase the precision of subscores by borrowing information from the other related scores or subscores. For example,
Wainer, Sheehan, and Wang (2000) and Wainer, Vevea, et al. (2001) suggest the augmented subscore that is a function of an examinee’s score on the subscale of interest and that examinee’s score on the remaining subscales.
Yen (1987) suggested the objective performance index (OPI) that is a weighted average of the observed subscore and an estimate of the observed subscore obtained using a unidimensional item response theory (IRT) model for the entire test.
Haberman (2008a) suggested a weighted average of a subscore and the total score. Sinharay (2010) found that this weighted average is typically very similar to the augmented subscore (Wainer et al., 2000).
Several researchers (de la Torre & Patz, 2005; Haberman & Sinharay, 2010; Luecht, 2003; Yao & Boughton, 2007) suggested using estimated abilities or their transformations obtained from a multivariate IRT (MIRT) model as subscores. For background on MIRT models, see, for example, Reckase (1997).
The scores obtained from the above-mentioned approaches will be referred to as "adjusted subscores." 1 Researchers have found that adjusted subscores are more reliable, often substantially so, than the subscores themselves (Dwyer, Boughton, Yao, Steffen, & Lewis, 2006; Sinharay, 2010; Skorupski & Carvajal, 2010; Stone, Ye, Zhu, & Lane, 2010).
Recent Criticisms of Adjusted Subscores
The validity of adjusted subscores has been questioned recently. Skorupski and Carvajal (2010) studied four subscores from a large statewide test and found that the corresponding OPIs and the augmented subscores (Wainer et al., 2000) were highly correlated among themselves. The correlations between augmented subscores were 0.97 or greater and those between the OPIs were all 1.00. Skorupski and Carvajal (2010) commented that this phenomenon of high correlations among the adjusted subscores (which means that the rank orderings for the four adjusted subscores are very similar) leads to potential loss of meaning of the subscores and "reduces, if not eliminates, the utility of the subscores for the diagnostic purposes for which they are intended. This begs the question: Are the augmented subscores providing more useful information than the raw ones?" (p. 372). They went on to comment that "although augmentation dramatically improves the reliability of subscores, it may in fact negatively affect the validity of score interpretations" (p. 372). In the abstract of their article, they commented that the near-perfect correlations among the adjusted subscores "called into question the validity of the resultant subscores, and therefore the usefulness of the subscore augmentation process."
Stone et al. (2010) studied the four subscores for the spring 2006 assessment of the Delaware Student Testing Program 8th grade mathematics assessment. They found the augmented subscores, the OPIs, and the MIRT-based subscores to be highly correlated among themselves and commented that "it may be that adjusted subscale scores represent the measurement of a construct that is different from the construct being measured by the unadjusted subscale scores" (p. 80). They commented that borrowing information from other subscales causes a "potential threat to validity" of the adjusted subscores (p. 80).
It seems that Skorupski and Carvajal (2010) and Stone et al. (2010) have criticized the use of adjusted subscores in general (rather than criticizing their use with their data sets), and their criticisms might make some practitioners wonder whether it makes sense to use adjusted subscores at all.
Should One Report Diagnostic Scores for the Tests Considered in Skorupski and Carvajal (2010) and Stone et al. (2010)?
Let us look closely at the tests considered by Skorupski and Carvajal (2010) and Stone et al. (2010) and ask the question, "Should one report subscores, or, more generally, any kind of diagnostic scores for these tests?"
According to Standard 5.12 of the Standards for Educational and Psychological Testing (American Educational Research Association, American Psychological Association, & National Council for Measurement in Education,1999), scores should not be reported for individuals unless the validity, comparability, and reliability of such scores have been established. This standard applies to subscores as well as to the overall or total score. Furthermore, Standard 1.12 of the Standards for Educational and Psychological Testing (1999) demands that, if a test provides more than one score, then the distinctiveness of the separate scores should be demonstrated.
Haberman (2008a) suggested an approach to determine if subscores and augmented subscores have added value over the total score. This approach has been applied in Lyren (2009); Puhan, Sinharay, Haberman, and Larkin (2010); and Sinharay (2010). In this approach, a subscore has added value if it is reliable and is distinct from the other subscores.
Sinharay (2010) applied the approach of Haberman to the data set considered in Stone et al. (2010) and concluded that none of the original subscores were of added value and that none of the weighted averages (or augmented subscores) were of added value. In addition, Stone et al. reported an exploratory factor analysis that suggested the presence of only one factor in the data set and found the disattenuated correlations between the subscores to be between 0.96 and 1.03.
The disattenuated correlations between the subscores of Skorupski and Carvajal (2010) were between 0.89 and 0.96, with an average of 0.94. None of the subscores, weighted averages, and augmented subscores had added value for this data set either. 2
These results are enough to conclude that subscores or, more generally, any kind of diagnostic scores (including adjusted subscores) for the tests considered in Skorupski and Carvajal (2010) and Stone et al. (2010) will not satisfy professional quality standards (especially the above-mentioned Standard 1.12 on distinctiveness). Hence, it is true that the adjusted subscores for these tests lack validity (because of the fact that Haberman, 2008b, showed that the validity of subscores is limited when the subscores are either not reliable or are highly correlated with total scores).
However, no reasonable person should blame the adjusted subscores for not being valid for the tests considered in Skorupski and Carvajal (2010) and Stone et al. (2010). If the bathroom scale tells us that we need to lose weight, it would be unfair to blame the scale. The tests considered in Skorupski and Carvajal and Stone et al. were unidimensional and were incapable of producing diagnostic scores of any kind. So it is no wonder that the adjusted subscores computed from these data are not valid. However, responsibility for the lack of validity lies not with the adjusted subscores but rather with the tests and those who try to report any diagnostic subscores from the tests in the first place. The adjusted subscores are just the messengers of the bad news that the data are not appropriate for diagnostic score reporting.
A General Defense of Adjusted Subscores
The examples of Skorupski and Carvajal (2010) and Stone et al. (2010) do not represent a complete picture of the empirical situation, as is evident from a recent review of subscores for operational tests (Sinharay, 2010). For example, consider the Swedish Scholastic Assessment Test considered in Lyren (2009), which included subscores and adjusted subscores that had added value. For this test, the correlation between the augmented subscores ranged between 0.58 and 0.94, with an average of 0.79. 3 These correlations are much higher than the correlations between the unadjusted subscores that ranged between 0.42 and 0.67, with an average of 0.55. However, the correlation between the augmented subscores are much lower than those in Skorupski and Carvajal (2010) and Stone et al. (2010) and demonstrate that the correlations between augmented subscores are not always extremely high.
When several subscores of an assessment are adjusted by use of the total score (or other parts of the test), the adjusted subscores share a common component, the total score (or score on the other parts), so that the adjusted subscores will always be more highly correlated than are the original observed subscores.
In general, increased correlations among adjusted subscores do not threaten validity. If the correlations are very high, then the adjusted subscores are essentially just versions of the total score, and the test is not able to produce useful diagnostic scores. If the correlations are not very high, measurement error has been reduced with the computation of the adjusted subscore (because the variance of adjusted subscore is less than that of the subscore and hence the reliability is higher). If the measurement error is sufficiently reduced, then the correlation with external criterion scores is likely to increase rather than decrease when adjusted rather than observed subscores are employed, although empirical study is needed to verify this observation with real data (Haberman, 2008b).
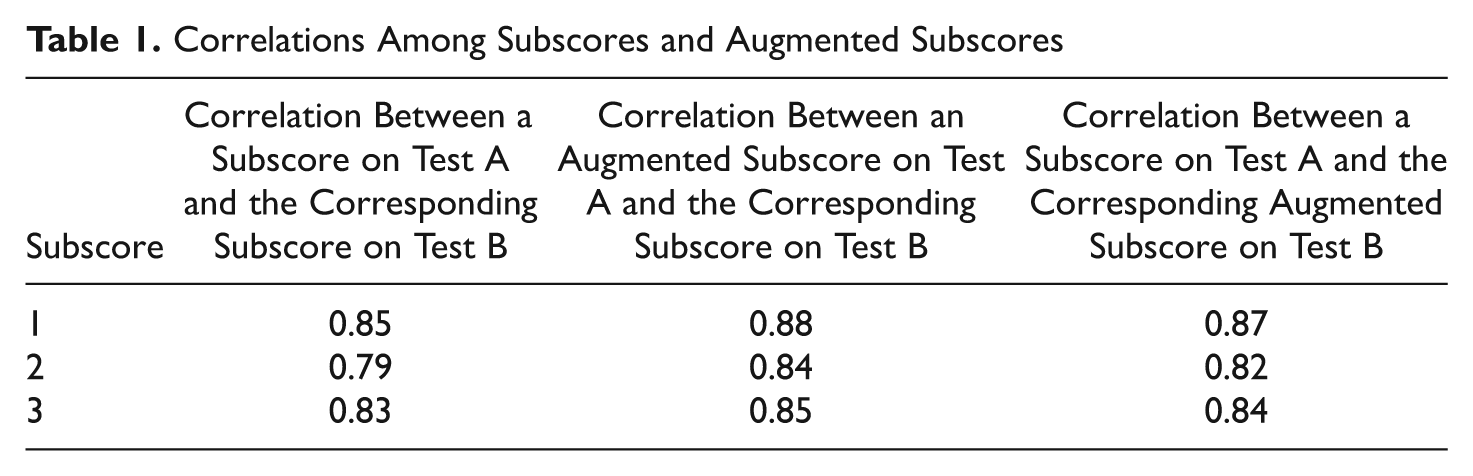
To examine the validity issue in a simple setting, it is helpful to consider parallel forms. The subscore on a parallel form is a basic validity criterion for the corresponding observed and adjusted subscores on the original form. For example, let us consider the test TC2 considered in Table 1 of Sinharay (2010). The test, which measured achievement in a discipline, had 200 multiple choice items and three subscores, each having 66 or 67 items. We split the test into two tests, say Test A and Test B, of length 100 items each. Tests A and B were made roughly parallel in difficulty and content. We then computed the subscores and augmented subscores for Tests A and B. All three of the augmented subscores have added value for both Tests A and B according to the criteria of Haberman (2008a). Table 1 shows some correlations. The table shows that any subscore on Test B (or A) has a higher correlation with the corresponding augmented subscore on parallel Test A (or B) than with the corresponding subscore on parallel Test A (or B). 4 For example, the correlation between subscore 1 on Test B and augmented subscore 1 on Test A is 0.88, which is larger than 0.85, the correlation between subscore 1 on Test B and subscore 1 on Test A. Figure 1, which is like Figure 4 of Skorupski and Carvajal (2010), shows the subscore profiles (top panel) and the profiles of augmented subscores (bottom panel) of five randomly chosen examinees. Although the three observed subscores for each examinee vary more than the three augmented subscore for the examinee, the profiles of augmented subscores are not all parallel, unlike in Figure 4 of Skorupski and Carvajal. Some of the profiles of augmented subscores even intersect with each other.
Correlations Among Subscores and Augmented Subscores
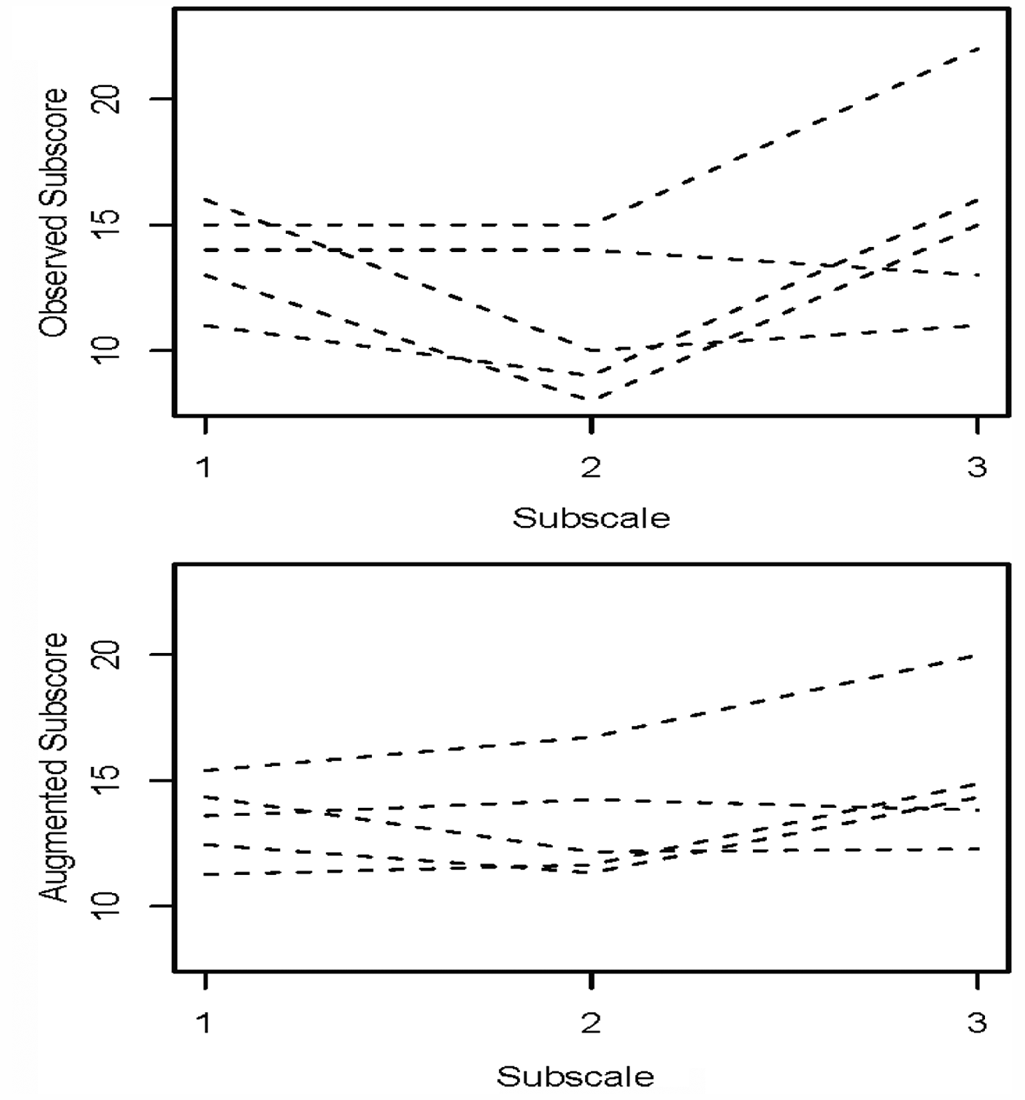
Subscore profiles of five randomly chosen examinees
Thus, the two facts—(a) the adjusted subscores (augmented subscores in this case) estimate the subscores on a parallel form better and (b) the profiles of the adjusted subscores are not all parallel—show that adjusted subscores did not "lose their meaning" or "have their utility reduced or eliminated" (as commented in Skorupski & Carvajal, 2010, p. 372) and did not represent a construct different from that measured by the subscores (as mentioned in Stone et al., 2010).
Therefore, for a test that was designed to report diagnostic scores (e.g., the Swedish Scholastic Assessment Test or the test TC2 considered above), it is straightforward to gather evidence that supports the proposed interpretation of the adjusted subscores and it will not be difficult to stand up to any criticism of the adjusted subscores as long as the accumulated evidence is evaluated in an evenhanded way (Kane, 2006, mentioned the need to stand up to criticism in establishing validity).
To make the validity claim foolproof, it is important also to collect empirical evidence concerning validity of subscores and adjusted subscores. Haberman (2008b) suggested some theoretical results on the validity of subscores, but those results do not obviate the need for data on validity. Although modern concepts of validity of tests consider many aspects of test content, intended use, and consequences of use (Kane, 2006; Messick, 1989), a mature testing program requires empirical evidence that a reported test score is adequately related to appropriate criterion scores.
If the adjusted subscores have lower correlations with appropriate criterion variables than the total scores or the original subscores, then there is justification to criticize them for lack of validity. However, until that can be demonstrated, we think that it is premature to criticize their validity based on any current findings. It does not seem that any of the validity standards of the Standards for Educational and Psychological Testing (American Educational Research Association, American Psychological Association, & National Council for Measurement in Education, 1999) have been violated by the use of the adjusted subscores.
We agree with Stone et al. (2010) that score users may not like or understand the dependence of, say, a reading subscore on a speaking subscore. However, many score users do not understand measurement concepts such as Cronbach’s alpha or equipercentile equating and that has not deterred the testing companies from reporting reliability values or equated scores. In addition, we believe that it would not be difficult to make an argument that, for example, a common language skill is required to answer both reading and listening items, which will justify the adjustment of listening subscores using reading subscores in addition to the listening subscores. Think of a test for which (a) the subscores are reliable and distinct, (b) the adjusted subscores have higher reliability than the subscores, (c) there is a strong evidence of criterion validity of adjusted subscores, and (d) the subscales are somewhat connected conceptually (e.g., language skills such as reading and listening). Here, it makes sense to adjust subscores. In our opinion, for such a test, it is possible for the testing company to make a claim about the validity of the adjusted subscores that is strong enough to overcome the above-mentioned potential problem of explanation of adjusted subscores to users and to convince the users that the adjusted subscores are reliable, valid, and useful.
Footnotes
Acknowledgements
The authors are grateful to Dan Eignor, Wendy Yen, Gautam Puhan, and George Mercoulides for their helpful comments and to William Skorupski for generously sharing with us some summary of a data set.
Any opinions expressed in this article are those of the authors and are not necessarily those of Educational Testing Service or National Board of Medical Examiners.
The authors declared no potential conflicts of interests with respect to the authorship and/or publication of this article.
The research of the first two authors was funded by Educational Testing Service (ETS), which is the company that these two authors work for.