
Abstract
There is much debate on the merits and pitfalls of standardized tests for college admission, with questions regarding the format (multiple-choice vs. constructed response), cognitive complexity, and content of these assessments (achievement vs. aptitude) at the forefront of the discussion. This study addressed these questions by investigating the relationship between SAT Mathematics (SAT-M) item characteristics and the item’s ability to predict college outcomes. Using multiple regression, SAT-M item characteristics (content area, format, cognitive complexity, and abstract/concrete classification) were used to predict three outcome measures: the correlation of item score with first-year college grade point average, the correlation of item score with mathematics course grades, and the percentage of students who answered the item correctly and chose to major in a mathematics or science field. Separate models were run including and excluding item difficulty and discrimination as covariates. The results revealed that many of the item characteristics were related to the outcome measures and that item difficulty and discrimination had a mediating effect on several of the predictor variables, particularly on the effects of nonroutine/insightful items and multiple-choice items.
Several themes commonly emerge in discussions of high-stakes testing. One is skepticism about multiple-choice testing, with the common contention that “life isn’t multiple choice” (Ryan & Greguras, 1998) and that constructed response items or performance assessments would be more valid indicators of student achievement and better predictors of subsequent performance. Another is a call for tests that measure higher-order thinking rather than rote memory or recall. A third is an assertion that achievement tests are more appropriate than aptitude tests for assessing college readiness.
Multiple-Choice Versus Constructed Response
Critics of standardized tests commonly assert that multiple-choice questions on college entrance examinations are artificial and do not represent the types of tasks that college students undertake in their coursework. There is widespread belief that these tests place too much emphasis on factual knowledge and the application of procedures and fail to assess higher-order thinking. Quite the opposite, performance assessments and constructed response items are often praised for their greater emphasis on problem solving, comprehension, critical thinking, reasoning, and metacognitive processes (Linn, Baker, & Dunbar, 1991). In this sense, tests comprising constructed response items are thought to be better predictors of college success than tests of multiple-choice items.
Whereas there is little debate that constructed response items provide a more realistic context for assessment than multiple-choice items, Ryan and Greguras (1998) aptly note that the appearance of realism, or the face validity of an assessment, should “not be assumed to be important until researchers provide more concrete demonstrations of its relation to applicant behavior and other outcomes” (p. 198). This statement underscores the importance of research on the validity of assessments for predicting relevant outcomes.
The most common procedure for examining the validity of college admission tests involves correlating the scores on the tests with various measures of college performance. Whereas constructed response items are typically thought to have greater face validity and more desirable effects on education, the trade-off is usually less predictive power than multiple-choice tests. Because it is generally possible to administer more multiple-choice items than constructed response items in a fixed period of time allotted for testing, tests using a multiple-choice format are usually more reliable and show larger correlations with criterion measures.
Bennett (1993) suggested that examining the incremental validity of constructed response items over multiple-choice tests in predicting college outcomes would provide a useful measure of the relevance of constructed response tests. He cited two studies finding that essay tests added very little to the prediction of first-year college grade point average (FYGPA) (Bridgeman, 1991; Bridgeman & Lewis, 1991) and one study finding that essay tests generally provided a slightly larger increment in predicting individual course grades (Breland, Camp, Jones, Morris, & Rock, 1987). Bennett (1993) concluded that essay tasks appeared to add little predictive value over multiple-choice tests in college admissions. However, there are some instances where constructed response items may perform as well or better than multiple-choice items. For example, Bridgeman (1992) compared multiple-choice and open-ended versions of the same quantitative items on the GRE and found that both formats had similar relationships with GRE scores and undergraduate GPA.
Cognitive Complexity
Critics who denounce multiple-choice tests often claim that such tests cannot assess higher-level cognitive skills or critical thinking. Yet multiple-choice items can be constructed to tap higher-order thinking skills, just as constructed response items can sometimes tap lower-level skills. Judgments regarding the cognitive complexity of a test item need to take into account student familiarity with the problems and the ways in which students attempt to solve them (Linn et al., 1991). Even if an item appears to be at a high cognitive level, if the students are familiar with the problem, the question is a recall item (McDonald, 2002). Items assessing higher cognitive processes are thought to be better predictors of college readiness and college success than items that primarily assess routine mental processes, because these higher mental processes are valued in college.
Achievement Versus Aptitude Tests
Another popular belief is that achievement tests are superior to aptitude tests and that the former are more valid indicators of college readiness (Atkinson & Geiser, 2009; National Association for College Admissions Counseling, 2008). The SAT is sometimes referred to as an aptitude test, even though it is aligned with high school and college curricula (Vasavada, Carman, Hart, & Luisier, 2010). A few studies have directly compared the predictive validity of the SAT and SAT Subject Tests, which are 1-hour tests designed to measure knowledge in specific subject areas and the students’ ability to apply that knowledge. These studies generally find slightly larger correlations with college grades for the subject tests, although both tests provide a similar increment in the prediction over the other when high school GPA is also included in the prediction model (Geiser & Studley, 2002; Kobrin, Camara, & Milewski, 2002). The College Board offers two separate SAT subject tests in mathematics—Level 1 and Level 2. Level 1 covers content learned in 2 years of algebra and 1 year of geometry, whereas Level 2 also covers precalculus (elementary functions) and trigonometry. The Level 2 test has been found to have a larger correlation with first-year college grades than Level 1 (Kobrin et al., 2002; Ramist, Lewis, & McCamley-Jenkins, 2001).This finding supports the widely held notion that students mastering higher-level mathematics content do in fact perform better in college.
Abstract Versus Concrete Assessment
Although this issue does not receive the same amount of attention and scrutiny as those described above, there is precedent for examining potential differences in the validity of abstract and concrete test items. Prior research has found mixed results with regard to performance differences on abstract and concrete mathematics problems. Concrete items are those that include a setting or a real-world instantiation of the concept, whereas abstract items present symbolic language instead of concrete examples. Although some studies have found better performance on concrete items (Koedinger & Nathan, 2004; Nunes, Schliemann, & Carraher, 1993), other studies have found better performance on abstract items (Kaminski, Sloutsky, & Heckler, 2008). Koedinger, Alibali, and Nathan (2008) offered an explanation for the inconsistent results in prior studies. They found that college students performed better on concrete problems when the problems were simple, but the students performed better on abstract items when the problems were more complex.
Purpose of the Present Study
The present study used the SAT mathematics test to shed light on the questions raised above by examining the relationship between item characteristics and the items’ relationship with various college outcomes. This study afforded the opportunity to separate the content area, format, cognitive complexity, and abstract/concrete designation of the items to determine the unique contribution of each factor in an item’s prediction of college outcomes. Because the difficulty and discrimination of an item varies by each item characteristic, and is also related to an item’s validity for predicting college outcomes, it was also of interest to assess whether the item characteristics have an effect on college outcomes after controlling for item difficulty and discrimination. This study addressed the following two research questions:
Research Question 1: How do SAT mathematics items’ content area, format, cognitive complexity, and abstract/concrete designation affect the item’s prediction of college outcomes?
Research Question 2: Is the relationship between item characteristics and college outcomes mediated by item difficulty and discrimination?
Most studies on the validity of the SAT and other large-scale tests examine the relationship between total test scores and various outcomes of interest. Yet Haladyna (2004) noted that since the test item is the basic unit of observation in a test, it is important to collect validity evidence for both item responses and test scores. The validity evidence gathered to support interpretation of an item response is also part of the validity evidence for the test scores as a whole. The collection of validity evidence at the item level is akin to the use of coefficient alpha to evaluate whether a set of test items works together as composite to create a test score. If an individual test item is shown to have a low item–total correlation with the total test score, or coefficient alpha increases if the item is deleted, that item is scrutinized and possibly removed from the test. Similarly, information on the validity of each item on a test and how item characteristics are related to item validity can help test developers identify the item characteristics that are most strongly related to criteria of interest.
Many researchers have examined the relationship between characteristics or types of test items and the difficulty of the item, also called item difficulty modeling (see, e.g., Enright, Morley, & Sheehan, 2002; Sebrechts, Enright, Bennett, & Martin, 1996), but very few have directly examined whether item characteristics are related to validity. There are many facets to validity and all are important, but this study focused on validity for predicting college performance, since this is the primary use of the SAT. Studying the validity of an assessment by item type can provide information on whether all types of items contribute equally to its validity or whether certain types of items may detract from the overall validity of the test. Other testing programs have conducted research on the validity of specific types of items. For example, Roussos and Norton (1998) examined the validity of three different item types on the Law School Admission Test for predicting first-year average in law school. The three item types were analytical reasoning, logical reasoning, and reading comprehension. Each was found to have a substantial correlation with first-year average, and the authors concluded that all should remain as part of the Law School Admission Test to maintain its overall level of predictive validity.
Method
The SAT Mathematics Test
The SAT Reasoning Test (hereafter referred to as the SAT) is a standardized test of critical reading, mathematics, and writing ability that is used to assist colleges and universities to make admission decisions. The SAT consists of three separately timed sections: critical reading, mathematics, and writing. The SAT mathematics section (SAT-M) consists of 54 items, administered in three separately timed sections, for a total of 70 minutes. The majority of the SAT-M consists of multiple-choice questions, but 10 items are student-produced responses (SPR), which have no answer choices provided and require students to solve the problem and enter their response on a special grid. SAT-M items are also categorized by content area. Approximately 20% to 25% of the items are numbers and operations, 35% to 40% algebra and functions, 25% to 30% geometry and measurement, and 10% to 15% data analysis, statistics, and probability.
During the test development process, each SAT-M item is coded according to cognitive complexity and whether the item is abstract or concrete. Cognitive complexity is coded into three categories. Routine (RTNE) items are those that require examinees to recall factual knowledge and/or perform mathematical manipulation, comprehension (COMP) items are those that require examinees to solve problems that demonstrate comprehension of mathematical ideas and/or concepts, and nonroutine/insightful items (NONR) are those that require examinees to solve nonroutine problems or problems that require insight, ingenuity, or higher mental processes. As stated earlier, concrete items are those that include a setting or a real-world instantiation of the concept, whereas abstract items present symbolic language instead of concrete examples. For example, a concrete item might ask the student to solve a probability problem involving randomly choosing a red marble from a bag containing red and blue marbles or involving rolling a six-sided die, whereas an abstract item might present probability as choosing n things from a larger set of m things (Kaminski et al., 2008). Appendix A includes examples of some disclosed SAT items in these categories.
Although SAT-M subscores by item type are not reported, there have been efforts to explore the reliability of cluster scores based on content specifications or item type (Ewing, Huff, Andrews, & King, 2005). Several studies on the dimensionality of the SAT-M have found the test to be essentially unidimensional, with some indication that there is a small factor related to geometry items (Dorans & Lawrence, 1987; Doub & Lawrence, 1996; Oh & Sathy, 2006). However, Gierl, Tan, and Wang (2005) found more substantial evidence for two dimensions on the SAT-M but noted that the dimensions were difficult to identify and were not strongly replicable across samples.
Data Source
The data were obtained from 110 colleges and universities that participated in the College Board’s National SAT Validity Study (Kobrin, Patterson, Shaw, Mattern, & Barbuti, 2008). FYGPA, course grades, and major were available for 161,584 students who finished their first year of college in spring 2007. Official SAT Reasoning Test scores were obtained from the 2006 College-Bound Senior Cohort database that consists of data of the students who participated in the SAT program and reported plans to graduate from high school in 2006.
Table 1 displays characteristics of the items used in the current study. These items came from 12 SAT forms that were administered between March 2005 and April 2006, which were the first operational forms of the SAT after its revision in March 2005. Each SAT form includes a total of 54 mathematics items, so a total of 648 items were available. On these 12 particular forms, each mathematics item appeared on only one form. The exception was two forms that were administered a first time, then reprinted and administered again during a separate test administration date. For the purposes of this study, the data were combined on these two identical forms. Four items were excluded from the study due to missing data on one or more of the predictor or outcome variables, so a total of 644 items were studied.
SAT-M Items by Content Area, Format, Cognitive Category, and Abstract/Concrete
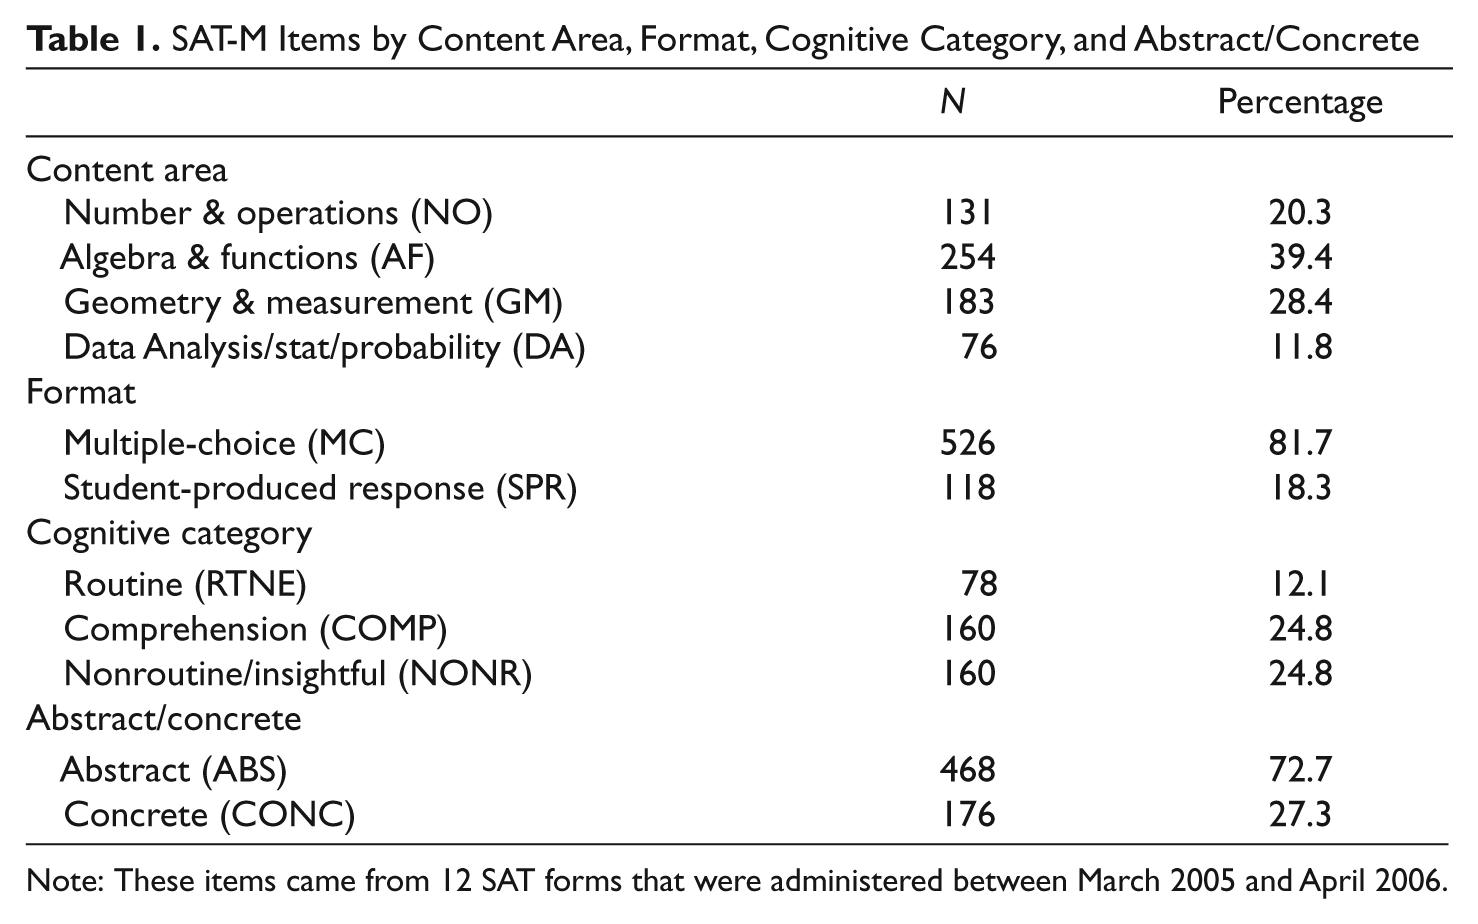
Note: These items came from 12 SAT forms that were administered between March 2005 and April 2006.
Outcome Variables
Three outcome variables were computed for this study. The first two outcome variables were point–biserial correlations of the item score (1, 0) with FYGPA and mathematics course grades (henceforth referred to, respectively, as the FYGPA and mathematics course grade validity coefficients). In calculation of the item score for each student, omitted items (where students did not respond to that item but did respond to at least one item placed later in the test) were scored incorrect, and items that were not reached (where students did not respond to that item or any item placed later in the test) were designated as missing. In calculation of the mathematics course grade validity coefficients, if more than one mathematics course was taken, the mathematics GPA was the average of the grades earned in each course. If only one course was taken, the mathematics GPA was the mathematics grade for the single course.
The third outcome variable was the percentage of students majoring in a science, technology, engineering, or math (STEM) field among those answering the item correctly (hereafter referred to as the STEM percentage). STEM fields include mathematics, natural sciences (including physical sciences and biological/agricultural sciences), engineering/engineering technologies, and computer/information sciences. Given the national interest in increasing the number of students pursuing an STEM career (e.g., National Science Board, 2010), this outcome variable was included to determine whether students answering particular types of items correctly are more or less likely to major in an STEM field. This information can potentially help identify students with an interest in STEM. According to the National Postsecondary Student Aid Study of 2003-2004, 14% of all undergraduates enrolled in U.S. postsecondary institutions in 2003-2004 were enrolled in an STEM field (National Center for Education Statistics, 2009). In the sample used in the current study, approximately 10% of students majored in an STEM field. The National Center for Education Statistics percentage is higher because that figure also includes students whose secondary major field was STEM, whereas in the current study only the primary majors were available.
Predictor Variables
A set of effect code variables was created to designate the 12 separate cohorts of students taking each SAT form. As distribution of ability among students taking the test varies from administration to administration, controlling for cohort captured these range restriction effects. Effect codes were also created for each of the four item characteristics (content area, format, cognitive category, and abstract/concrete). Additional predictor variables included item difficulty (measured by equated delta, an inverse translation of proportion correct into a scale with a mean of 13 and an SD of 4, based on the curve for a normal distribution and equated over tests and samples) and item discrimination (the biserial correlation of the item score with SAT-M total score).
Statistical Analyses
First, descriptive statistics and correlations were calculated for the predictor and outcome variables by each item characteristic. Then, two sets of multiple regression analyses were performed, regressing each of the three outcome variables (FYGPA validity coefficient, mathematics course grade validity coefficient, and STEM percentage) on the predictor variables (or sets of predictor variables). A significance level of p < .01 was used as the criterion to retain predictor variables in the models. The first set of regression analyses entered only the item characteristics (effect code variables for content area, format, cognitive complexity, and abstract/concrete), while the second set included item difficulty and discrimination as covariates. In all models the effect code variables for cohort were entered first, to account for differences in the mean ability of the population of students taking the different test forms. The effect code variables for the item characteristics were entered into the models in the order in which they accounted for the most residual variance of the outcome variables. The final models entered the two- and three-way interactions among the effect codes for the item characteristics. The regression coefficients for the final models were inspected to determine whether particular item types were associated with significantly higher or lower FYGPA validity coefficients, mathematics course grade validity coefficients, and STEM percentage.
Results
Descriptive Statistics
Table 2 shows the descriptive statistics for the predictor and outcome variables. There was great variability in the outcome variables across items, and in fact some items had very small negative coefficients. As shown in Table 3, item difficulty and item discrimination was generally the same across content area, which is consistent with the content and statistical specifications for the SAT mathematics test. As expected, on average the SPR items were more difficult than the multiple-choice items. Also as expected, the nonroutine/insightful items were the most difficult, and the routine items were easiest, but items in all cognitive categories were equally discriminating on average. The abstract and concrete items had similar mean difficulty and discrimination.
Descriptive Statistics for Continuous Variables
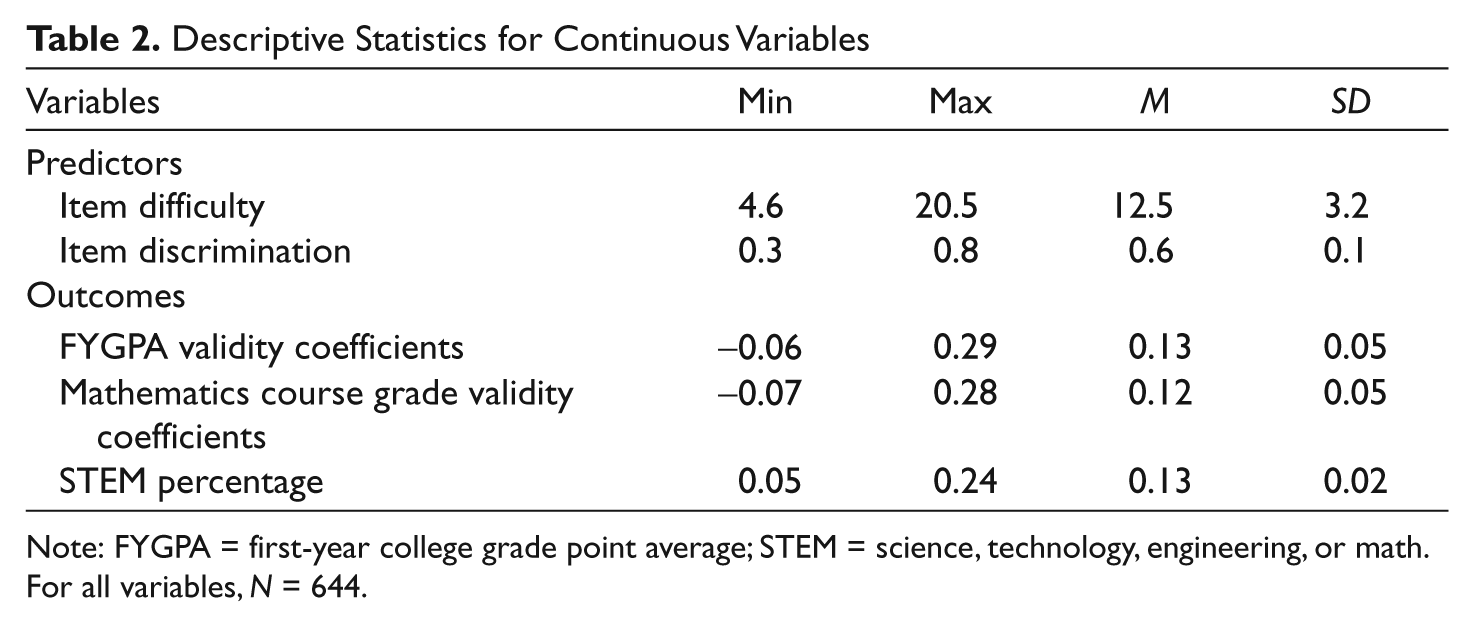
Note: FYGPA = first-year college grade point average; STEM = science, technology, engineering, or math. For all variables, N = 644.
Descriptive Statistics for Item-Level Variables and Outcome Variables (Mean, SD) by Item Characteristics
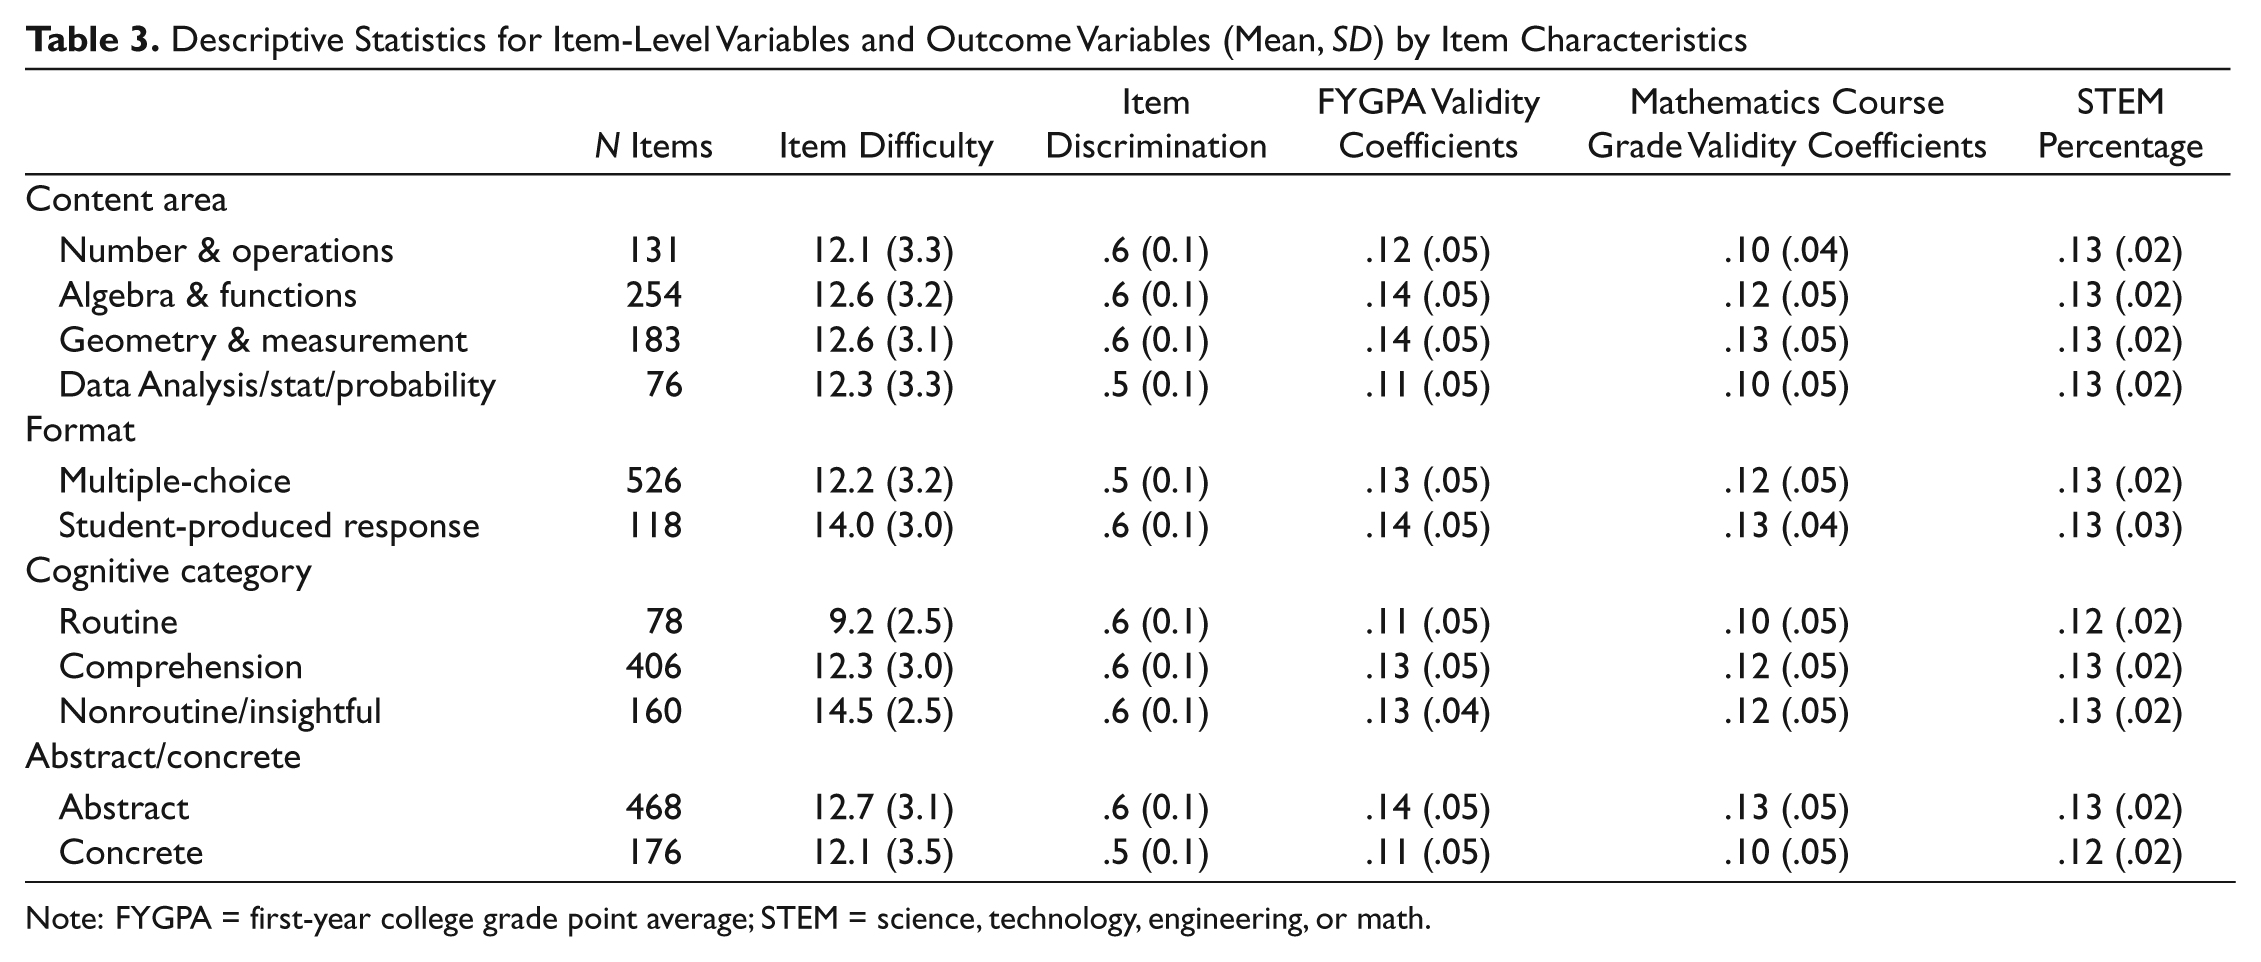
Note: FYGPA = first-year college grade point average; STEM = science, technology, engineering, or math.
Item difficulty and discrimination were both moderately related to the outcome variables, warranting their inclusion in the models as covariates. Item difficulty correlated .54 with the FYPGA validity coefficients, .48 with the mathematics course grade validity coefficients, and .45 with the STEM percentage. Item discrimination correlated .44 and .47 with the FYGPA and mathematics course grade validity coefficients, respectively, but had a much smaller correlation with the STEM percentage (r = .16). All of these correlations were statistically significant at p < .01.
The mean FYGPA and mathematics course grade validity coefficients were generally similar across content area, format, cognitive complexity, and abstract/concrete items. The validity coefficients were slightly higher for algebra and functions and geometry and measurement items, compared with number and operations, and data analysis, statistics, or probability items; were slightly higher for SPR items compared with multiple-choice items; were higher for comprehension and nonroutine/insightful items compared with routine items; and were higher for abstract items compared with concrete items (see Table 3). The STEM percentage was similar for all item types. The multiple regression analyses that followed tested whether these item characteristics were significantly related to the magnitude of the outcome variables and the extent to which that relationship is moderated by item difficulty and discrimination.
Multiple Regression Analyses Excluding Item Difficulty and Discrimination
Table 4 shows the multiple regression results for predicting the outcome variables, with and without controlling for item difficulty and discrimination. In Model 1, the effect codes for cohort were entered into each regression model. For all three outcome variables, the R2 for cohort was statistically significant at p < .01, indicating significant variability in the extent to which SAT-M items predicted the outcome variables depending on the particular cohort. This finding was attributed to differences in the ability level of SAT test takers at different SAT administrations. Cohort accounted for approximately 14% of the variance of the FYGPA validity coefficients, 8% of the variance of the mathematics course grade coefficients, and 35% of the variance of the STEM percentage. This indicates that the effects of cohort were much more pronounced in the prediction of the percentage of students majoring in STEM, compared with the prediction of the FYGPA and mathematics course grade validity coefficients. Because of the significant effects of cohort, the effect codes for cohort were retained in all subsequent models.
Multiple Regression of Item Validity Coefficients on SAT-M Item Characteristics With and Without Covariates: Change in R2 Associated With Each Additional Predictor
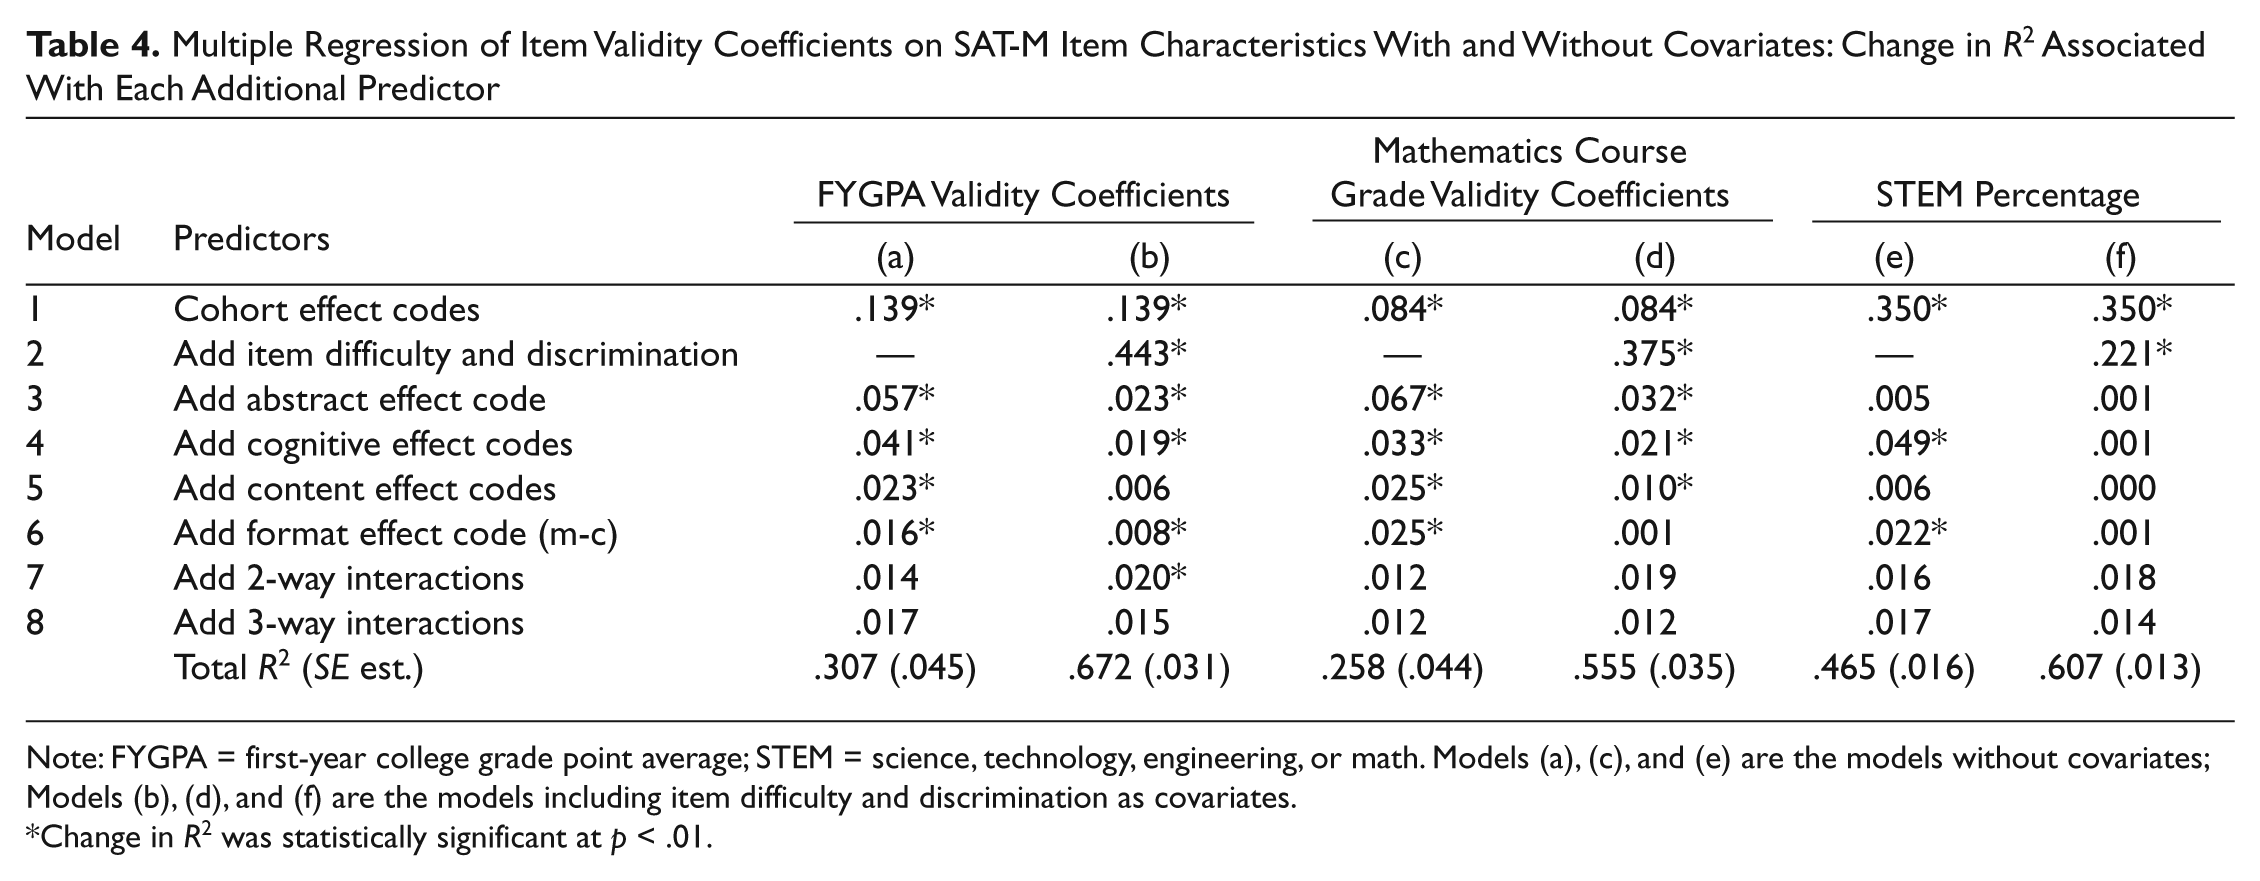
Note: FYGPA = first-year college grade point average; STEM = science, technology, engineering, or math. Models (a), (c), and (e) are the models without covariates; Models (b), (d), and (f) are the models including item difficulty and discrimination as covariates.
Change in R2 was statistically significant at p < .01.
In the models excluding item difficulty and discrimination, the effect codes for the four main item characteristics considered in this study (content area, format, abstract/concrete, and cognitive complexity) were added separately to Model 1, to determine which set of effect codes provided the most incremental validity to the prediction of the outcome variables. The effect code designating whether the item was abstract or concrete had the largest partial correlation with both the FYGPA and mathematics course grade validity coefficients, and was entered next, bringing the total R2 to .196 and .151, respectively. Next, the effect codes for cognitive complexity were added, which significantly increased R2 to .237 for the FYGPA model and .184 for the mathematics course grade model. The effect codes for content area and format also each provided a significant increment to R2 in both these models. In the model predicting the STEM percentage, the cognitive and format effect codes each significantly increased R2. However, the effect code for abstract items and the content effect codes did not add to the prediction of the percentage of students majoring in STEM. The two-way and three-way interaction effects were not statistically significant at p < .01 in any of the models.
Table 5 shows the unstandardized and standardized regression coefficients for the final models. Appendix B provides the full regression equations for these models. For the models excluding item difficulty and discrimination, the final model is Model 6, which includes the effect codes for cohort, abstract/concrete, cognitive complexity, content, and format and excludes the interaction effects. In the models for all three outcome variables, the regression coefficients for abstract items and nonroutine/insightful items were statistically significant at p < .01, indicating that these items had larger correlations with FYGPA and mathematics course grades compared with the grand mean and that students answering these items correctly were more likely to major in an STEM field compared with the grand mean. The effect of abstract items was largest in the prediction of mathematics course grade validity coefficients (i.e., had the largest standardized regression coefficient) compared with the other two outcome variables, and the effect of nonroutine/insightful items was largest in the prediction of the STEM percentage compared with the other two outcome variables.
Unstandardized and Standardized Regression Coefficients for Final Models With and Without Covariates
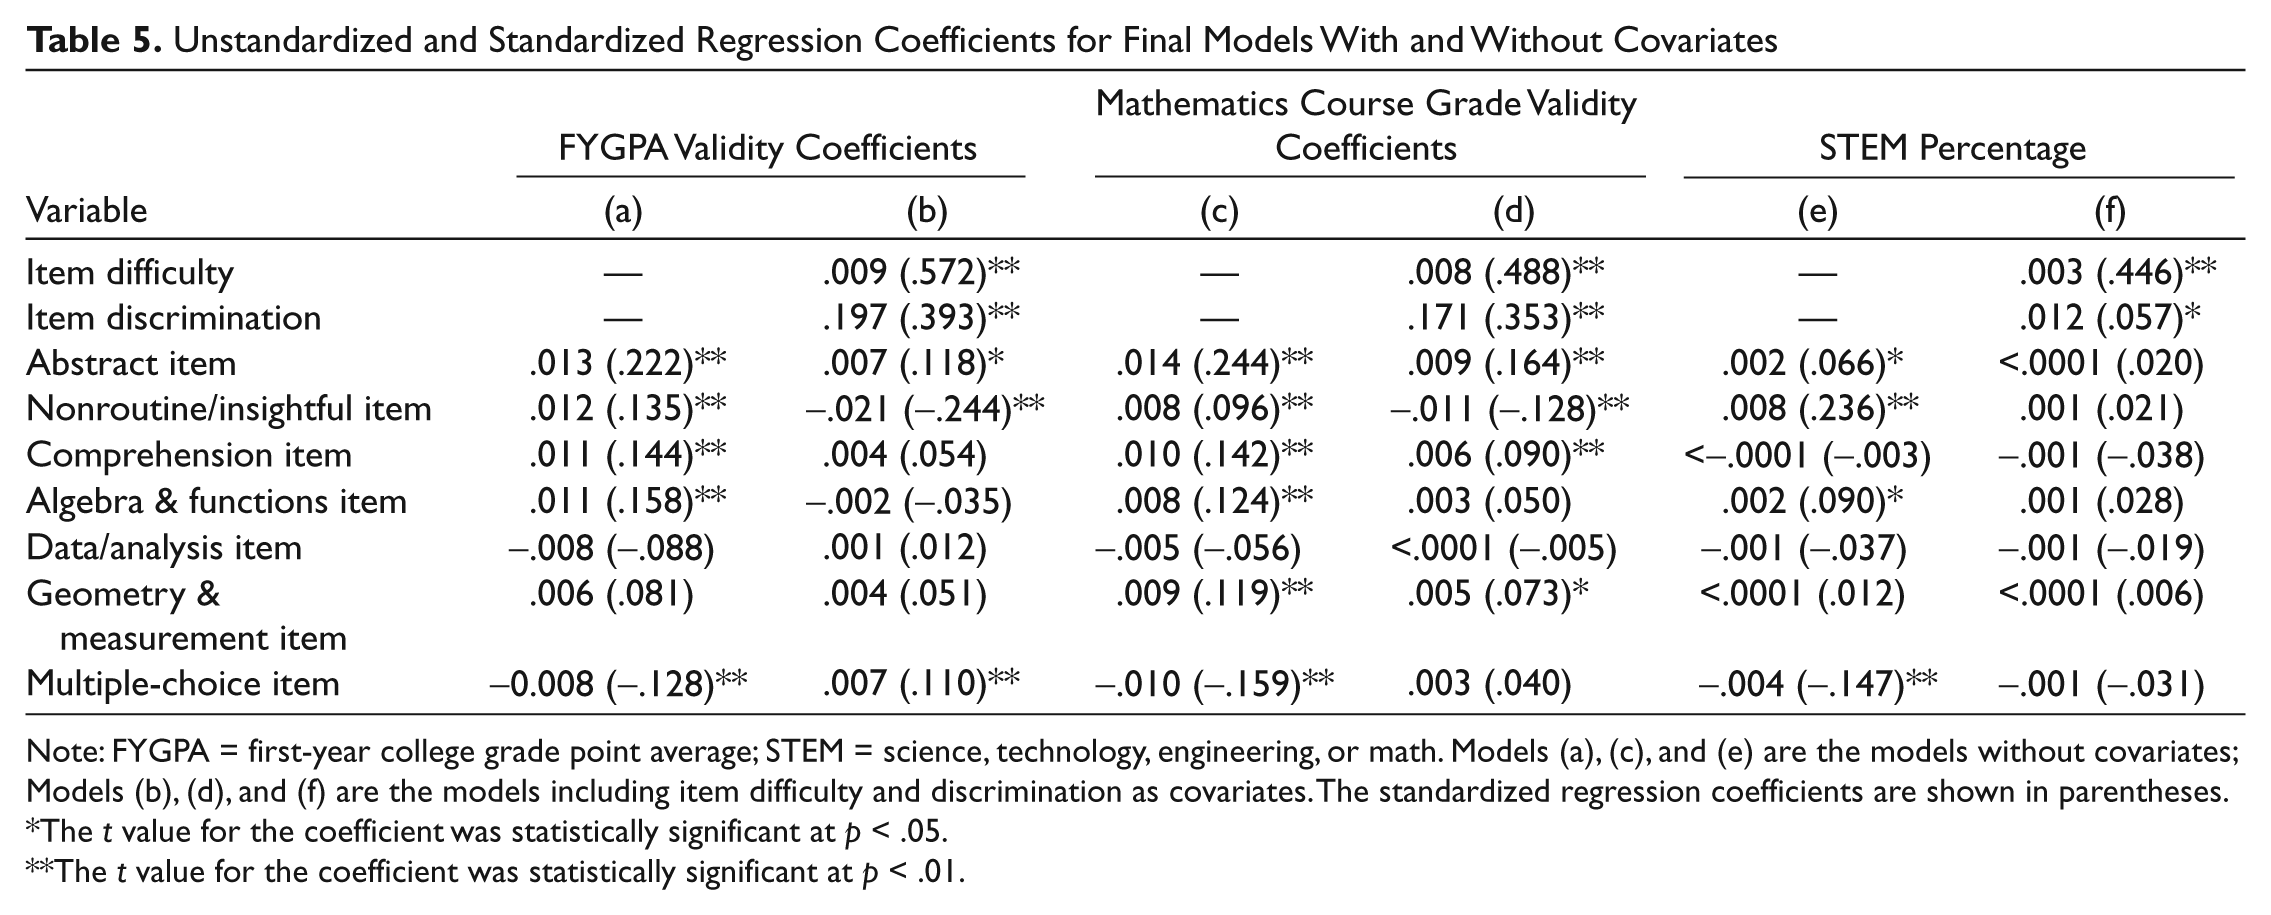
Note: FYGPA = first-year college grade point average; STEM = science, technology, engineering, or math. Models (a), (c), and (e) are the models without covariates; Models (b), (d), and (f) are the models including item difficulty and discrimination as covariates. The standardized regression coefficients are shown in parentheses.
The t value for the coefficient was statistically significant at p < .05.
The t value for the coefficient was statistically significant at p < .01.
The regression coefficient for comprehension items was statistically significant for both the FYGPA and mathematics course grade models but was not significant for the STEM percentage model. With regard to the content effect codes, algebra and functions items had significantly larger FYGPA and mathematics course grade validity coefficients and a larger percentage of students answering these items correctly majored in STEM compared with the grand mean. Geometry and measurement items had higher mathematics course grade validity coefficients compared with the grand mean but did not have a significant effect in predicting either of the other two outcome variables. The regression coefficient for multiple-choice items was negative and statistically significant in all three models, indicating that the multiple-choice items had smaller FYGPA and mathematics course grade validity coefficients than the SPR items, and students answering these items correctly were less likely to major in STEM, holding all other variables in the model constant.
Multiple Regression Analyses Controlling for Item Difficulty and Discrimination
The second set of regression models shown in Table 4 included item difficulty and discrimination. These models assessed whether the effects of the item characteristics were mediated by item difficulty and discrimination. Entering item difficulty and discrimination significantly increased the R2 for each of the three outcome variables, adding most to the prediction of the FYGPA validity coefficients and least to the prediction of the STEM percentage.
After accounting for item difficulty and discrimination, the effect code for abstract items, the cognitive effect codes, and the effect code for multiple-choice items each significantly increased R2 in the FYGPA model. The set of effect codes representing all possible two-way interactions also significantly increased R2 in this model. Two of the interaction effect codes had regression coefficients significantly greater than zero (p < .01); these were the interaction of nonroutine/insightful and multiple-choice items and the interaction of abstract and algebra and functions items. In the mathematics course grade model, all item characteristics significantly increased R2 with the exception of the multiple-choice effect code. In the STEM percentage model, none of the item characteristics provided an increment to R2 after item difficulty and discrimination were entered into the model.
Table 5 displays the unstandardized and standardized regression coefficients for the final regression models including item difficulty and discrimination. The final models were Model 7 for the FYGPA validity coefficients and Model 6 for both the mathematics course grade validity coefficients and the STEM percentage. As expected, an item’s difficulty and discrimination were strong predictors in all three models, with higher values associated with higher FYGPA and mathematics course grade validity coefficients, as well as a larger percentage of students answering the item correctly and majoring in STEM.
After controlling for item difficulty and discrimination, the regression coefficient for abstract items was still positive and statistically significant, but the magnitude of the effect was reduced with the inclusion of these covariates in the models. The nonroutine/insightful items had a large negative effect in both the FYGPA and mathematics course grade models. Note, of course, that these findings reflect net effects after controlling for other variables in the model; recall that in the models excluding difficulty and discrimination the nonroutine/insightful items had positive regression coefficients. Comprehension items and geometry and measurement items both had statistically significant regression coefficients only in the mathematics course grade model, and the magnitude of their effects was smaller with the inclusion of item difficulty and discrimination. The positive effect of algebra and function items disappeared when item difficulty and discrimination were included in the model.
Interestingly, the multiple-choice effect code had a significant and positive regression coefficient in both the FYGPA and mathematics course grade models after controlling for item difficulty and discrimination, reversing the negative effect that was found in the model excluding these covariates. In the STEM percentage model, none of the regression coefficients for the item characteristic effect codes were significant after accounting for item difficulty and discrimination.
Discussion
The purpose of this study was to determine whether particular characteristics of SAT mathematics items (content area, format, cognitive complexity, and abstract/concrete) were associated with the item’s ability to predict FYGPA, mathematics course grades, and the percentage of students majoring in an STEM field and whether item difficulty and discrimination mediate these effects.
Item difficulty and discrimination had a mediating effect on several of the predictor variables, particularly on the effects of nonroutine/insightful items and multiple-choice items. Categorization of the item as abstract or concrete was a significant predictor of an item’s validity for predicting FYGPA and mathematics course grades, whether or not item difficulty and discrimination are controlled. The abstract items were significantly better predictors of these two outcomes than the concrete items. Yet although the abstract and concrete items in this study had very similar mean difficulty and discrimination, once item difficulty and discrimination were controlled, the beneficial effect of abstract items on the validity coefficients was reduced.
There is research indicating that students may benefit more from learning mathematics through a single abstract, symbolic representation rather than from multiple concrete examples (Kaminski et al., 2008). If it is true that students learn mathematics concepts better via abstract examples, abstract test items may be better than concrete items to assess their knowledge. There is evidence that certain groups of students (females, minorities) perform better on abstract items because these items are more similar to textbook problems than are concrete items (O’Neill & McPeek, 1993). Similar to the current study, Koedinger et al. (2008) found an interaction between item difficulty and abstract/concrete items in the performance of college students. These findings suggest that the benefits of abstract items may be mediated by item difficulty and discrimination, and additional research is needed to tease out these effects and determine whether or not they persist for different student subgroups.
Although the items coded at the highest level of cognitive complexity (nonroutine/insightful) in this study were positively related to FYGPA and mathematics course grades, these items actually had significantly lower validity coefficients after controlling for their difficulty and discrimination. Although we expected that difficulty and discrimination would largely account for the validity of the items, we did not expect negative validity coefficients for the nonroutine/insightful items. This finding warrants further investigation, including a review of these particular items. One possible explanation is that, on the one hand, these items are more difficult, contributing positively to their validity, but on the other hand, their complexity or an unfamiliar setting makes them prone to misinterpretation on the part of examinees, which decreases validity after the positive effects of difficulty and discrimination are controlled.
Another possible confounding factor involves students’ prior knowledge and problem-solving strategies. An item is coded as nonroutine/insightful if it can be answered using multiple approaches with at least one approach involving insight, although other more direct solution paths can also be used to solve the problem (I. Cane, personal communication, September 17, 2010). The assumption is made that students use the insightful strategy, but this is not always the case. If a student happens to be familiar with the concept presented in the item, for that student, the item may actually be a routine item involving simple recall. The variability in students’ prior knowledge and problem-solving approaches may have introduced error into the coding of the nonroutine/insightful items, contributing to the unexpected results.
In the model not accounting for item difficulty and discrimination, multiple-choice items had significantly lower FYGPA and mathematics course grade validity coefficients compared with SPR items, and they had a negative effect on the percentage of students majoring in STEM. However, when item difficulty and discrimination were controlled, multiple-choice items had larger correlations with FYGPA and mathematics course grades and did not affect the STEM percentage. These findings suggest that since the SPR (constructed-response) items are more difficult than multiple-choice items, the larger validity coefficients for the SPR items are mostly due to their difficulty. Once difficulty is controlled, multiple-choice items may be better predictors of FYGPA and mathematics course grades than SPR items. These results suggest that multiple-choice items may perform just as well as constructed response items in predicting college outcomes, if the two-item formats are matched in difficulty and discrimination. An important caveat to note is that the constructed response items that appear on the SAT are pretested and meet specific statistical specifications. These items have a predefined and limited number of correct answers, and thus represent only one type of constructed response assessment. The item types examined here do not include forms of assessment where examinees are asked to explain their response processes or where there are multiple possible responses that can earn full credit (Linn et al., 1991). Further work with other types of constructed response items is needed.
The content area of an item provided a significant increment to the prediction of the item’s validity coefficient for predicting FYGPA and mathematics course grades when item difficulty and discrimination were not considered. This effect disappeared in the model predicting FYGPA validity coefficients once item difficulty and discrimination were controlled but remained in the model predicting mathematics course grade validity coefficients. The items’ content area is expected to be more closely related to grades in mathematics courses than to FYGPA, since the latter is based on grades in a variety of subject areas that require different cognitive skills than those required specifically in mathematics courses. The positive effect of algebra and functions items seemed to be entirely mediated by the item’s difficulty and discrimination. On the other hand, geometry and measurement items significantly contributed to an item’s ability to predict mathematics course grade irrespective of the item’s difficulty and discrimination. This finding may be due to the fact that geometry and measurement items tap spatial and visual perception skills that are not assessed by items in the other content areas. Perhaps it is this unique component that enables these items to maintain their relationship with mathematics course grades even after their difficulty and discrimination are controlled, since the ability to understand spatial relationships is important for success in all mathematics courses (R. O’Callaghan and I. Cane, personal communication, February 9, 2011).
Although the results are specific to the SAT and are confined to the items on this test, they are useful to understand how test item characteristics are associated with an item’s validity for predicting college outcomes. This information may be used to help test developers increase the predictive validity of the test, although it is always necessary to maintain the test’s content and statistical specifications. The item characteristics examined in this study, including cohort, accounted for approximately 30% of the variance of the FYGPA validity coefficients, 26% of the variance of mathematics course grade validity coefficients, and 46% of the variance of the STEM percentage. When item difficulty and item discrimination were also included, the models accounted for 67% of the variance in the FYGPA validity coefficients, 56% of the variance of the mathematics course grade validity coefficients, and 61% of the variance of the STEM percentage. Research is currently underway to model the predictive validity of other types of tests (e.g., reading, writing) and attempt to identify other item characteristics that are associated with item validity. It will also be important to examine whether item characteristics are associated with differential validity for certain subgroups of test takers.
Footnotes
Appendix A
Appendix B
Acknowledgements
The authors would like to thank Robin O’Callaghan and Ilirjan Cane of the College Board for their assistance with this study and George Engelhard for his comments and suggestions on an earlier version of this article.
The author(s) declared no potential conflicts of interests with respect to the authorship and/or publication of this article.
The author(s) received no financial support for the research and/or authorship of this article.