
Abstract
Many measurement biases affect student evaluations of instruction (SEIs). However, two have been relatively understudied: halo effects and ceiling/floor effects. This study examined these effects in two ways. To examine the halo effect, using a videotaped lecture, we manipulated specific teacher behaviors to be “good” or “bad” based on specific items on the evaluation form (the Teacher Behavior Checklist). To examine ceiling/floor effects, we expanded the standard 5-point rating to either 7 or 9 points. Across three universities, 537 students watched and rated the videotaped lecture. Both biases were robust and remained despite characteristics of the measure designed to combat them. Instead, direct instruction regarding how to use the evaluation forms seems to be necessary to limit these biases on ratings.
Student evaluations of instruction (SEIs) have become a commonly used tool by which institutions of higher learning measure their instructors’ effectiveness. SEIs can have a great impact, positive or negative, on a professor’s career—with promotions and even job security at stake. Therefore, it is imperative that we ensure these ratings accurately measure teaching ability. Although many decisions can be made about professors as a result of their SEIs, there have been mixed results concerning the overall validity of these evaluations. Some researchers have found evidence supporting the validity of SEIs (Feldman, 1977; Marsh, 1982; Zhao & Gallant, 2012), whereas others have apprehensions (Greenwald, 1997). McKeachie (1997) believed that despite the validity concerns, SEIs were still the best way available to evaluate teachers’ performance. Of the variety of factors that can affect the validity of SEIs (e.g., class size, teaching methods, teacher personality), most research has been devoted to how students’ grades will influence their evaluation of the instructor. Multiple studies have shown that an instructor is able to “buy” positive evaluations simply by increasing the student’s grade (Krautmann & Saunder, 1999; Marsh, 1984; Smith, Cook, & Buskist, 2011). Apart from the typical teacher and course characteristics that can affect SEIs, two psychometric issues that have received less attention are halo effects and ceiling/floor biases.
Halo Effects
First named by Thorndike (1920), halo effects occur when a rater’s opinion about one aspect of the teacher influences the remainder of that person’s ratings. For example, if a student likes a teacher’s personality style, she rates him as being an effective communicator as well. Although it has been recognized for more than a century, there is still much to be learned about how the halo effect influences a person’s perception. Nisbett and Wilson (1977) posited two possible explanations. First, the halo effect may simply be a result of the person generalizing an overall impression onto unknown or vague attributes (e.g., if we like certain qualities of a person, we may assume that we would like his unknown qualities as well). Second, the halo effect may be powerful enough to change perceptions of known or unambiguous characteristics (e.g., we may rate a friendly person as being more attractive when compared with those who only saw a picture). If the second is true, then an instructor with a cheerful and friendly personality may make up for his unmistakable or potential deficiencies as a teacher. Feeley (2002) found strong halo effects in an analysis of SEIs. He proposed that it was a result of engulfing—which is similar to Nisbett and Wilson’s (1977) second explanation—but also noted that the effect may simply be a result of the student’s lack of effort. At any rate, it is clear that halo effects can affect people’s ratings of others—including instructors via SEIs.
Ceiling/Floor Effects
Ceiling and floor effects (also referred to as maximizing and minimizing effects) occur when a scale does not have a sufficient range to produce meaningful variability at the upper or lower ends of possible scores. An example of a ceiling effect would be using a scale designed to measure the weight of humans to determine the weight difference between two elephants. Even if the two elephants were obviously different in size, in all likelihood they would max out the scale and it would be impossible to determine the actual difference. To describe floor effects, the same principle could be applied to the converse if one was trying to determine the weight difference of humans using a scale intended for elephants. Ceiling and floor effects usually appear in SEIs in the form of students giving their professors either all high marks or all low marks. It becomes especially problematic when student’s answer choices are limited to a 5-point scale with little variability between the different anchors. Ceiling and floor effects have been examined in many modalities, ranging from extremely gifted school children (McBee, 2010) to elderly populations with cognitive and physical deficits (Gustafsson & Grahn, 2008; Holstein, Avlund, Due, Martinussen, & Keiding, 2006). Nevertheless, despite the obvious manifestation of these effects in SEIs (Keeley, Furr, & Buskist, 2010), no study has yet to examine if these effects can be reduced.
Teacher Behavior Checklist
The Teacher Behavior Checklist (TBC) is a 28-item teaching evaluation instrument developed from descriptions of the qualities of master teachers (Buskist, Sikorski, Buckley, & Saville, 2002; Epting, Zinn, Buskist, & Buskist, 2004; Schaeffer, Epting, Zinn, & Buskist, 2003; Wann, 2001). Students rate their teachers on each of 28 qualities using a 5-point Likert-type scale. However, previous research (Keeley et al., 2010; Keeley, Smith, & Buskist, 2006) has shown that ratings exhibit a strong ceiling effect, that is, students tend to use only the high end of the scale, limiting the variability of the ratings. This restricted variability limits the TBC in its ability to differentiate the quality of instruction. However, the design of the TBC is intended to protect against halo effects in that each item has specific behavioral anchors. These anchors might help student raters focus on the different characteristics of each item; however, no specific test of halo effects has yet been done with this instrument.
Current Study
This study attempted two manipulations to investigate the measurement effects described above. First, we manipulated the quality of the teaching being evaluated. To achieve this goal, we manipulated specific items of the TBC during a videotaped mini-lecture. For example, we manipulated the Approachable/Personable item but not the Knowledgeable About Subject Matter item. The TBC as an instrument is particularly well suited to this manipulation, as each of its items includes concrete descriptions of example behaviors that correspond to the quality being rated. Thus, the teacher in the video can specifically alter his behavior on only those items, leaving other behaviors intact. This manipulation tests the ability of students to make discriminating ratings, thus investigating the halo effect. Second, we modified the original 5-point Likert-type scale to include 7- and 9-point options. By expanding the number of response options, it is possible to stretch the variability of the response scale. This manipulation was primarily aimed at the ceiling and floor effects. Thus, our research questions for this study were the following: (a) Do student raters discriminate among specific behaviors on the TBC, thereby reducing a halo effect? (b) Will the inclusion of broader response options spread the variability of SEIs to combat ceiling/floor effects? To our knowledge, no studies have performed an experimental manipulation that is so explicitly tied to the evaluation instrument. In addition, our study is innovative in that we were simultaneously able to explore the halo and ceiling/floor effects, which heretofore have been studied separately or have been confounded in the measurement scheme.
Method
Participants
The participants were 537 students at three universities in different geographic regions of the United States. They were predominantly female (n = 320; 59.6%) with an average age of 18.99 years (SD = 2.04). The participants described their ethnicities as Caucasian (n = 385; 71.7%), African American (n = 117; 21.8%), or Other (n = 35; 6.5%). The class standings of the participants were freshman (n = 347; 64.6%), sophomore (n = 95; 17.7%), junior (n = 51; 9.5%), senior (n = 41; 7.6%), or graduate (n = 3; 0.6%). Participants learned about the study through research participant pools or advertisements in psychology classes; they earned either course or extra credit for their effort. The universities involved include a large land-grant institution, a master’s-level university known for high-quality teaching, and a technological research university; they are not intended to be representative of higher education but are a convenience sample.
Materials
The participants rated the teacher from a computer-based assessment using the TBC (Keeley et al., 2006). Keeley et al. (2006) found that TBC items loaded onto two factors: a Caring and Supportive subscale and a Professionalism and Communication Skills subscale. A Total scale was also calculated using all 28 items. The TBC has produced an internal consistency alpha of .95 for the Total, .93 for the Caring, and .90 for the Professionalism scales. When the test–retest reliability was examined, the TBC produced a Pearson r value of .71 for the Total, .68 for the Caring, and .72 for the Professionalism scales from mid-semester to the end of the semester. Overall, the TBC has been shown to be a very reliable and valid measure for examining teachers’ performances (Keeley et al., 2006; Keeley et al., 2010).
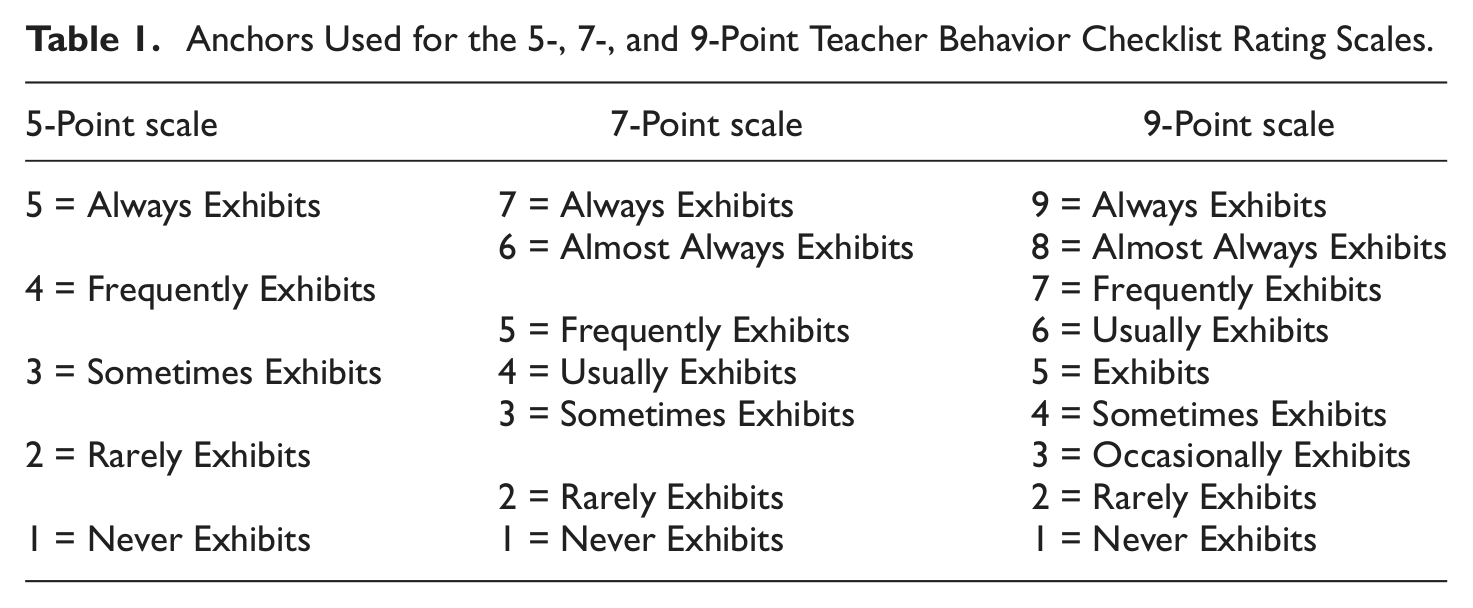
The TBC was originally developed to include a 5-point Likert-type scale with anchors ranging from “my professor always exhibits these behaviors reflective of this quality” to “my professor never exhibits these behaviors reflective of this quality.” To create 7- and 9-point anchors, we expanded the existing scale such that the absolute anchors quoted above remained the extreme response options. All anchors are displayed in Table 1. Participants completed either a 5- point and 7-point scale or a 5- point and 9-point scale on two administrations; order of administration was fully counterbalanced. Because of the nature of the manipulation described below, participants were also given a not applicable option for each item on all scales. Participants also completed a demographics questionnaire that assessed age, sex, class standing, GPA, ethnicity, and college courses taken.
Anchors Used for the 5-, 7-, and 9-Point Teacher Behavior Checklist Rating Scales.
Procedure
Participants attended a session held in a computer lab on a university campus in groups of approximately 5 to 15. During these sessions, participants were randomly assigned to view one of two video lectures given by the same male teacher demonstrating either high or low quality instruction, each lasting approximately 15 minutes. The topic of the lecture (“culture bound syndromes in the DSM-IV”) was selected to be interesting and unusual material to which students were unlikely to have had prior exposure. We wished to limit the likelihood of prior exposure to the material to avoid evoking comparisons to other teachers who had presented the same material. In the high-quality version, the instructor demonstrated “good” teaching behaviors (e.g., good eye contact, variable inflection, etc.), whereas the instructor in the low-quality version demonstrated “bad” teaching behaviors (e.g., poor eye contact, monotone inflection, etc.). We specifically manipulated particular TBC items to define the “good” and “bad” conditions. As previously mentioned, the TBC is particularly well suited to this manipulation, as each of its items includes behavioral anchors that correspond to the quality being rated. Thus, the teacher in the video can specifically alter his behavior on only those items, leaving other behaviors intact. The TBC items we selected for manipulation included the following: Approachable/Personable, Confident, Effective Communicator, Enthusiastic about Teaching, and Happy/Positive Attitude/Humorous. These items included qualities and behaviors that could be easily manipulated in a short, video lecture, versus other items that presume traditional classroom interaction. The instructor, topic, and wording of the lecture were the same for the two conditions; only the teaching behaviors were manipulated. For items such as Promotes Class Discussion, participants could choose the “not applicable” response.
After viewing the short lecture video, the participants completed the original 5-point scale version of the TBC and a second version of the TBC (either a 7-point scale or a 9-point scale). The order in which participants completed the TBC versions was randomized, such that some participants completed the 5-point scale first, then the second longer scale and others completed the longer scale followed by the 5-point scale. We did not include conditions comparing the 7- and 9-point scales as we were only interested in comparing modifications of the original format (i.e., the 5-point scale). It should be noted that although the video and questionnaires were identical, there were no formal instructions for the research assistants who managed the experiments; therefore, there may have been some variation between the universities in how the sessions were administered.
Results
Preliminary Analyses
We initially conducted some preliminary analyses to examine the quality of the data. The order in which the scales were presented (i.e., 5 then 7, 7 then 5, 5 then 9, 9 then 5) had no impact on TBC scale scores (all ps > .05). Furthermore, students’ GPA and number of courses taken were not significantly related with any outcome measures (all rs < ±.10, ns). Thus, neither stimulus order nor student characteristics will be used as covariates in any of the ensuing analyses. Furthermore, all demographic characteristics (gender, ethnicity, age, class standing, GPA, and number of courses taken) were evenly distributed across the two videos and across the four scale order combinations (all ps > .05), indicating successful randomization for both factors.
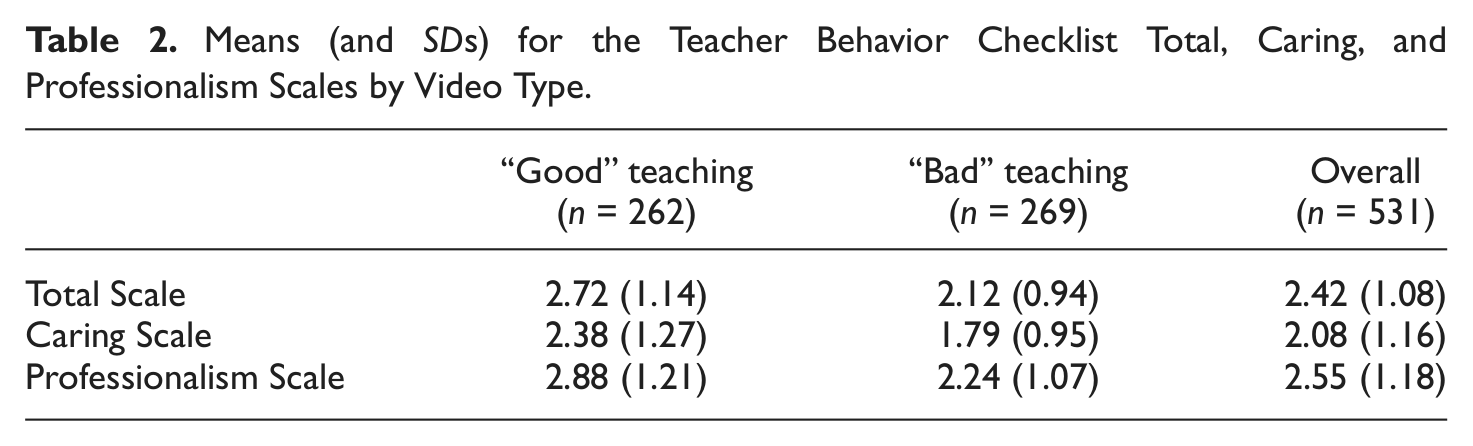
Additionally, to determine if the video manipulation was successful overall (i.e., that students meaningfully differentiated the two videos), we included the 5-point scale ratings across the three TBC scores (Caring, Professionalism, and Total) as dependent measures in a multivariate analysis of variance with the video as a between-subjects factor. We included only the 5-point scale because all participants completed that version. Comparisons between the 5-point scale and the other options are presented later. The overall test indicated that there were significant differences between or within the variables, Wilks’s Λ(3, 527) = 0.92, p < .001, η2 = .08. For each scale, the “good” video received higher overall ratings than the “bad” video, Total F(1, 529) = 43.51, p < .001, η2 = .08; Caring F(1, 529) = 36.72, p < .001, η2 = .07; Professionalism F(1, 529) = 42.79, p < .001, η2 = .08. Thus, the manipulation was successful. Means for the two videos on each scale can be found in Table 2. Additionally, this finding could be taken as evidence of the validity of TBC ratings, as they successfully discriminated between good and bad teacher behaviors. It should be noted that the scores on the Professionalism scale were significantly higher than for the Caring scale, F(1, 529) = 315.65, p < .001, η2 = .37, but the degree of change between the two videos (i.e., the interaction of video and scale) was not significant, F(1, 529) = 1.14, ns.
Means (and SDs) for the Teacher Behavior Checklist Total, Caring, and Professionalism Scales by Video Type.
Next, we examined if there were mean differences across the three types of rating scale (5-, 7-, and 9-point). To do so, we first restandardized the 7- and 9-point scales onto a 5-point metric, such that a rating of 1 was equal to a rating of 1 on each scale, and the highest rating on each (5, 7, 9) were also equal. All other points were then equally distributed relative to the number of points on that scale (i.e., we preserved the same intervals that participants used in completing the rating). This restandardization placed all three scales on the same metric (i.e., values ranging between 1 and 5). For those who completed the 7-point scale, there were no differences between participants’ 5- and 7-point mean ratings on any TBC scale (all ps > .05). The same held true for the 5- and 9-point scales. Thus, there was not any unintended measurement drift that occurred by virtue of using different scales. Therefore, the utility of the 5-point scale can be compared with its alternatives directly without having to correct for mean drift.
Halo Effects
To examine if halo effects occurred in this sample, we compared the degree of change between the “good” and “bad” videos across the TBC items we manipulated versus those we did not manipulate. In other words, if the behavioral anchors of the TBC make it more resistant to halo effects, the items we manipulated should evidence a larger change than those we did not. In fact, if there is no halo effect, there should not be any difference on nonmanipulated items. For this analysis, we examined only the 5-point rating scale as all participants completed that scale and there were no preliminary mean differences between the 5-point and alternative scales. We also excluded individuals who selected the not applicable option for any given item.
The average degree of change between the “good” and “bad” video for the five manipulated items (Approachable/Personable, Confident, Effective Communicator, Enthusiastic about Teaching, and Happy/Positive Attitude/Humorous) remained the same as that for the other 23 items, F(1, 200) = 0.03, ns. In other words, the TBC ratings exhibited a halo effect, as nonmanipulated items changed just as much across the two videos as did manipulated ones. The mean difference and effect size for each TBC item are presented in Table 3. Another way of expressing the same concept is that the effect sizes for the 5 manipulated items were the same as the effect sizes for all the other items, t(26) = 1.39, ns (mean d for manipulated items = .47, mean d for nonmanipulated items = .49). All differences between the means for the “good” and “bad” videos for each item were significantly different (all ps < .001).
Means, Standard Deviations, and Effect Sizes for the 5-Point Scale Ratings of All Teacher Behavior Checklist Items Across the Two Videos.
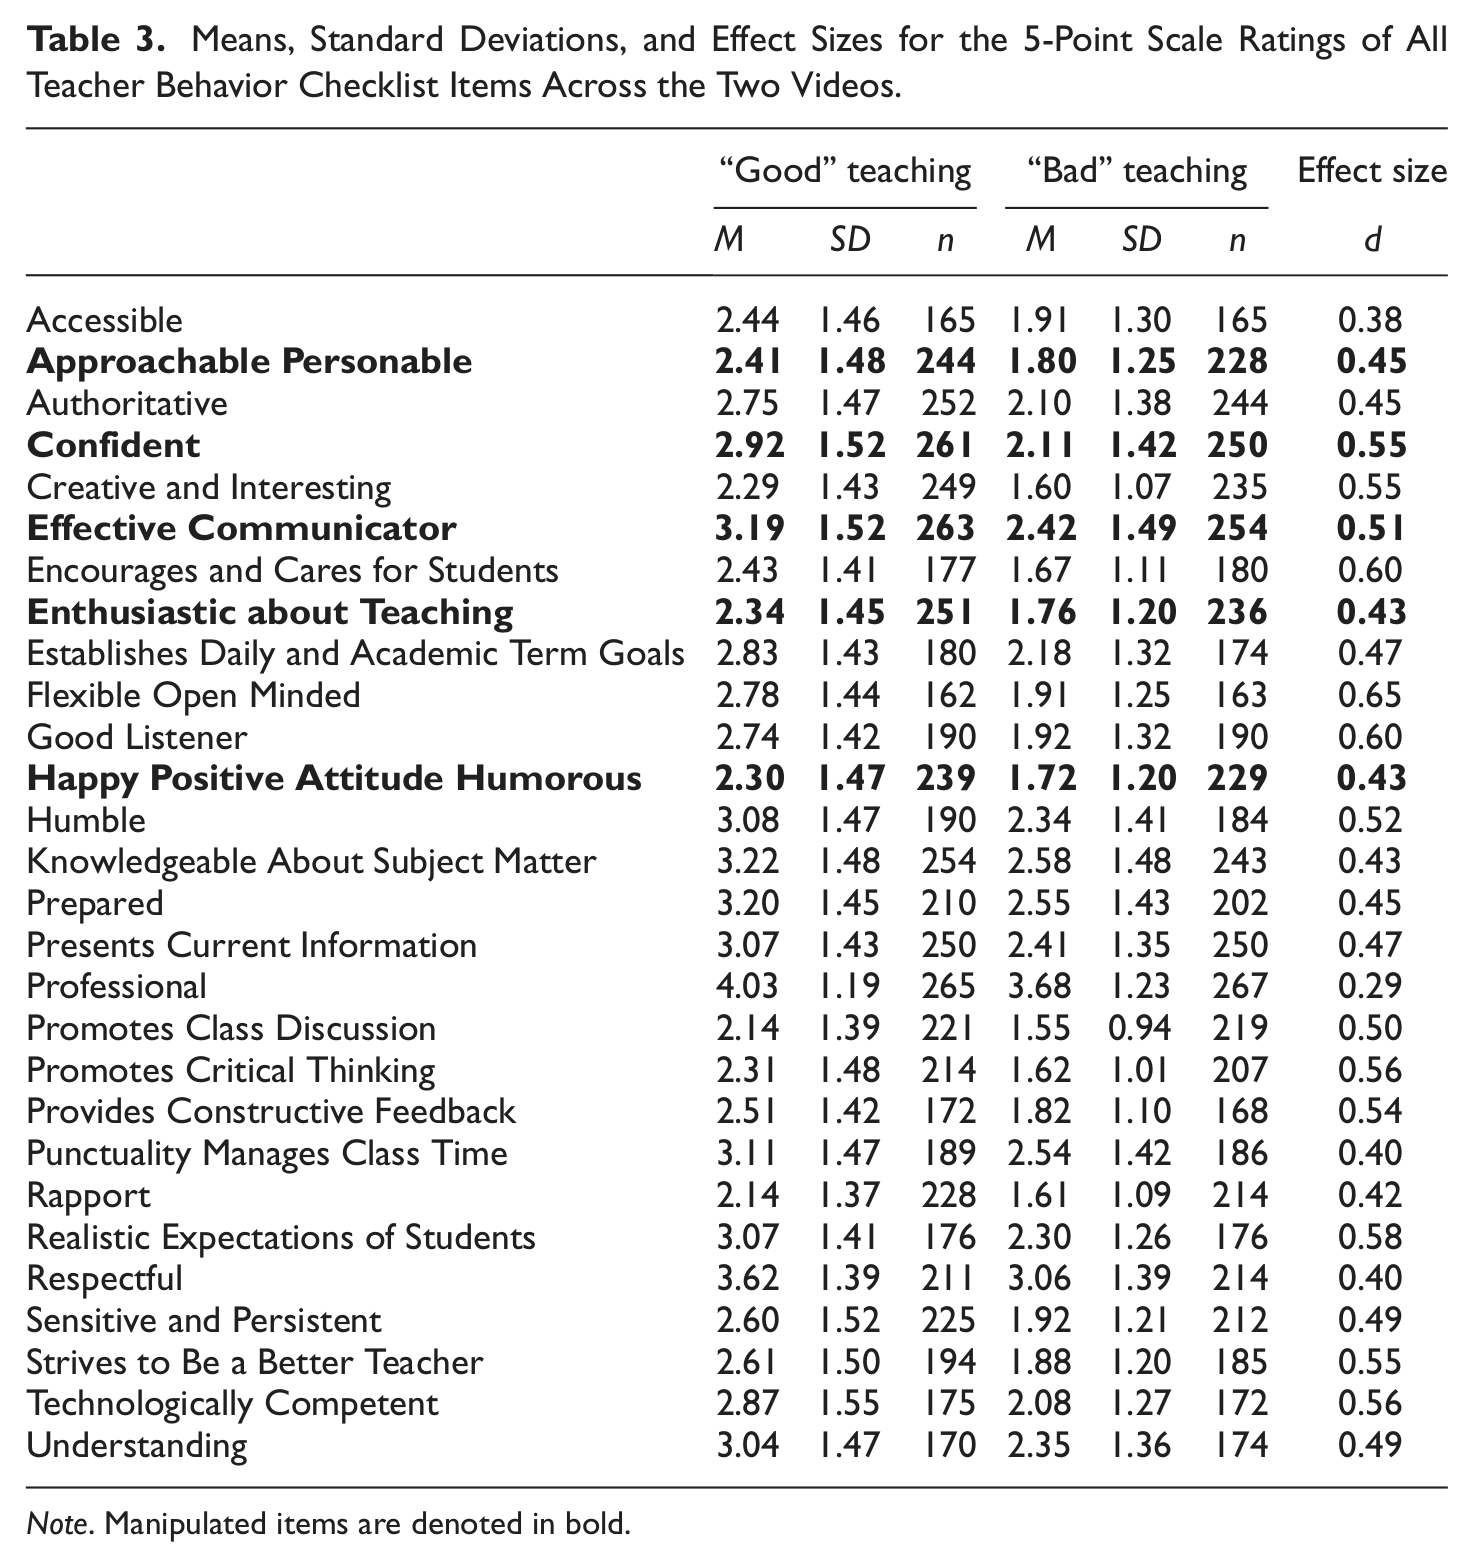
Note. Manipulated items are denoted in bold.
Interestingly, despite not changing the way they rated the items, more individuals rated the nonmanipulated items as not applicable for both the “good” (M frequency = 60, SD = 32) and “bad” videos (M frequency = 71, SD = 30) than the manipulated items (good M frequency = 13, SD = 10, t[21.38] = 5.64, p < .001; bad M frequency = 33, SD = 12, t[17.02] = 4.61, p < .001). Thus, participants correctly chose not to rate many characteristics that were not present in the videos.
Ceiling and Floor Effects
We next examined if expanding the rating scale significantly increased the utility and variability of the ratings. As previously discussed, uniformly positive or negative ratings are not particularly useful for most psychometric and practical purposes of SEIs. Thus, it is an interesting question if a simple manipulation, like expanding the number of rating options, can alleviate ceiling and floor effects on a measure like the TBC.
First, as already noted above, the mean values for the three TBC scales were equivalent across the rating types. Thus, using a different type of rating scale did not shift the center of participants’ responses one way or the other. In other words, the manipulation did not shift scores either toward or away from the floor or ceiling of the scales. However, it is possible that the variability of the response options could be different. Thus, we conducted Levene’s equality of variance tests for the 5- versus 7-point scales (collapsed across order) and for the 5- versus 9-point scales (collapsed across order). Across all three TBC scales (Total, Caring, Professional), the variances were equal between the different scale options (all ps > .05).
Item-response theory (IRT) models provide a meaningful metric for examining differences between rating scales and between items. Through IRT, it is possible to quantify the amount of psychometric information an item (or response option) provides across a latent trait (in this case, the general “good teaching” factor of the TBC represented by the Total scale). This metric can be expressed graphically in an item characteristic curve (ICC) or numerically through computational models. Example ICCs for the item Punctuality/Manages Class Time are provided in Figures 1 to 3 for the 5-, 7- and 9-point scales, respectively. This item is represented because of the relative clarity of the results for understanding their interpretation. ICCs for all items are available from the author on request.
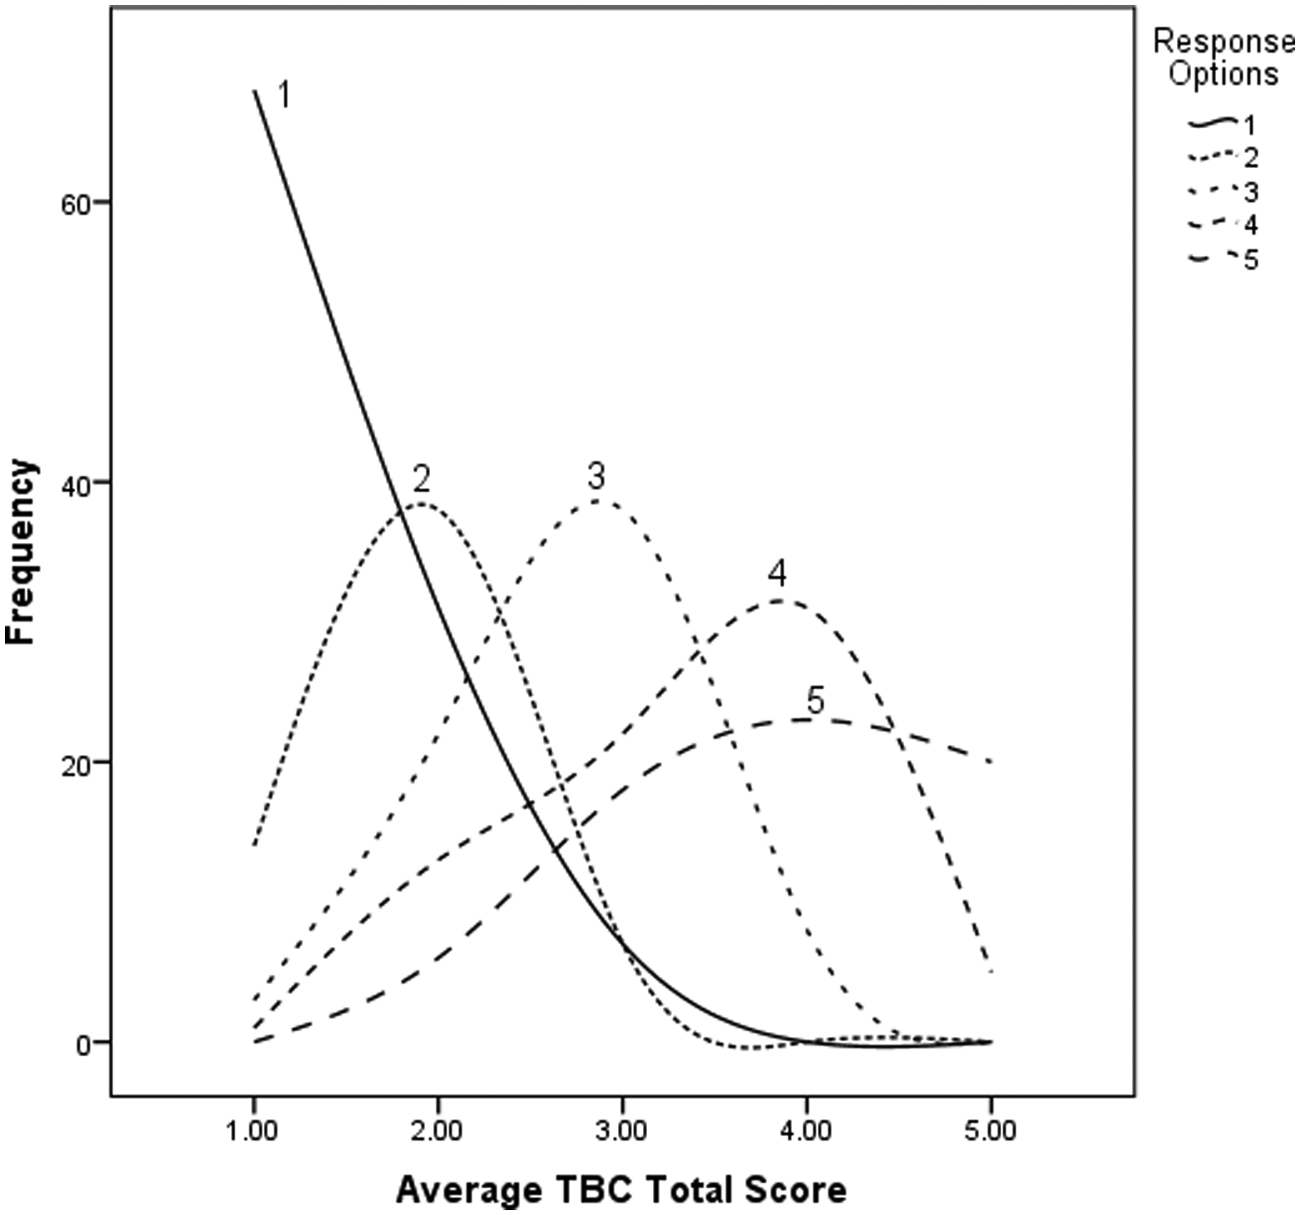
Item characteristic curve for Punctuality/Manages Class Time on the 5-point scale.
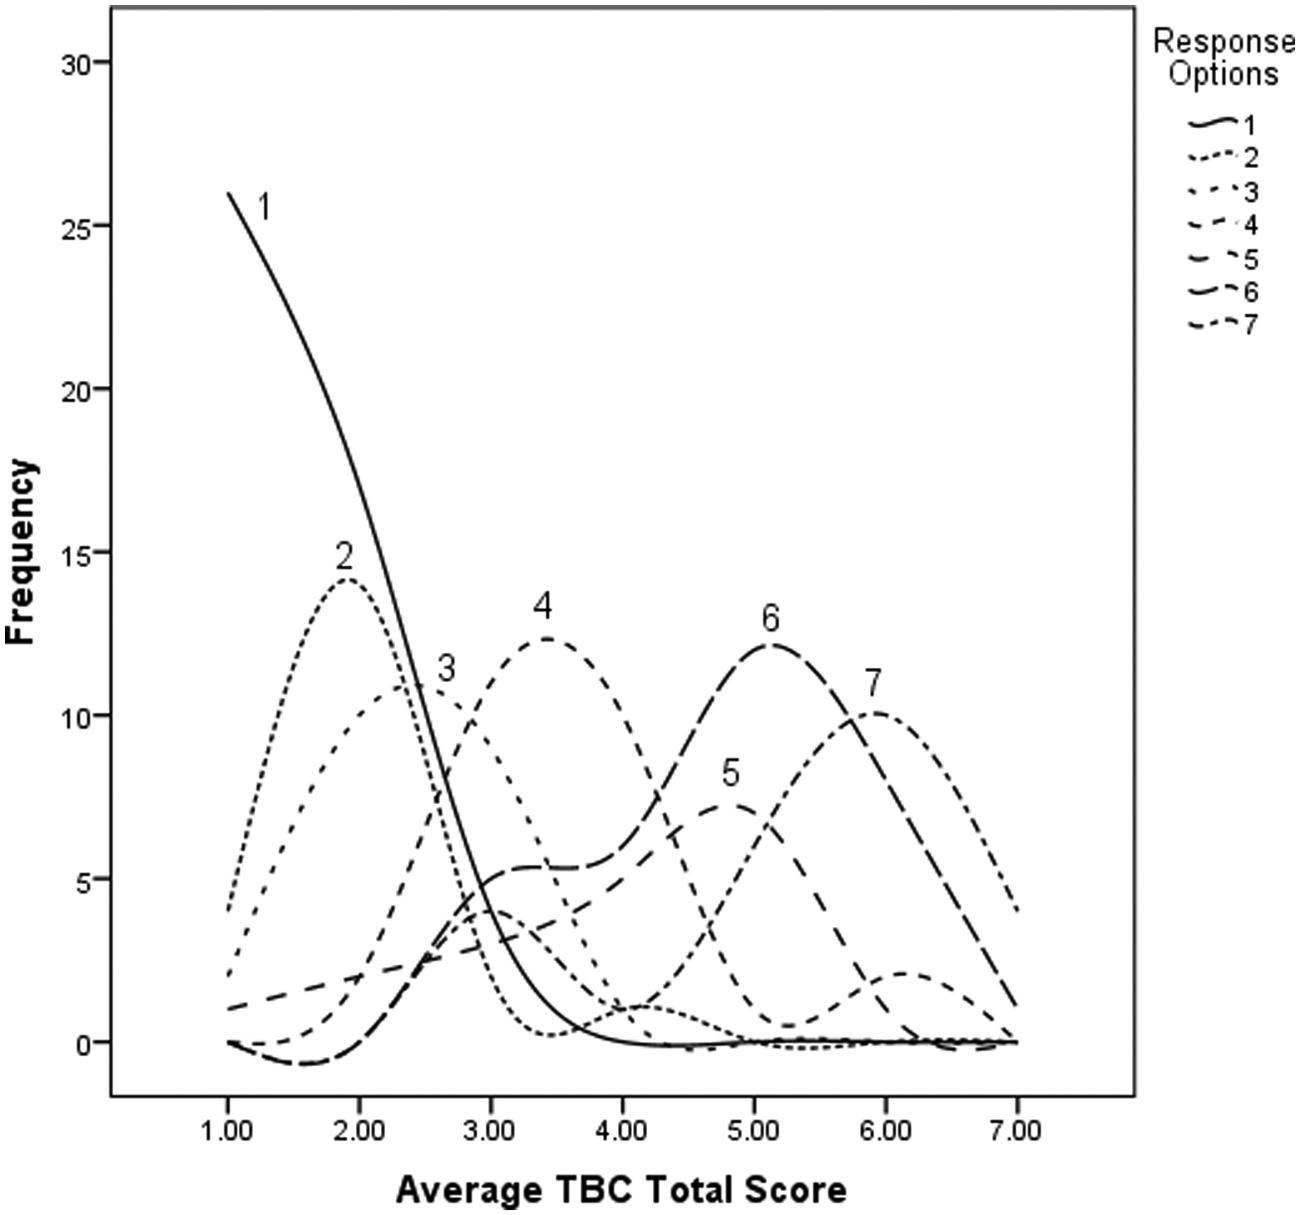
Item characteristic curve for Punctuality/Manages Class Time on the 7-point scale.
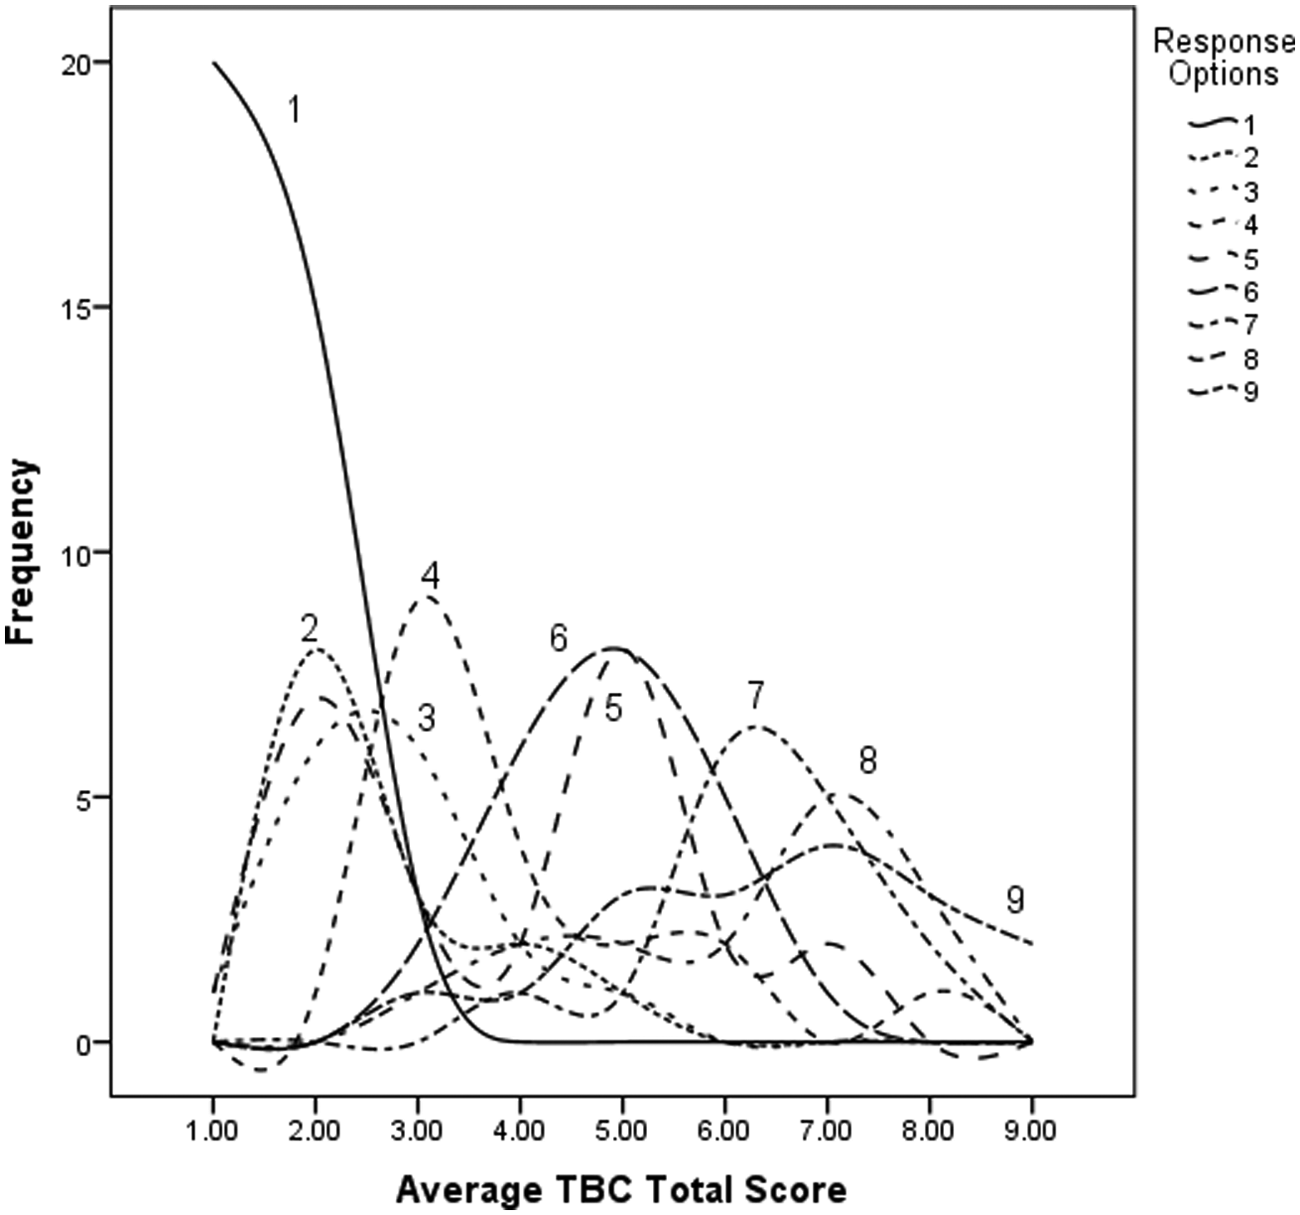
Item characteristic curve for Punctuality/Manages Class Time on the 9-point scale.
To begin, the curves in each figure represent the distribution of responses for a particular option across the Total scale score. In other words, each curve represents the relationship of responders to that item with how they responded overall on the instrument. In each figure, there are curves for each response option. As can be seen in Figure 1, the 5-point response options systematically increase in the central tendency of the curve across the Total score relative to the value of the response option chosen (1-5). Each option has a relative peak whereby it became the most likely response choice for a given range on the Total scale score. It should be noted that the overall ratings for the videotaped lecture (regardless of whether the video was “good” or “bad”) were relatively low. The most common response on all items was a 1. These relatively poor ratings are likely because of the contrived nature of the videotaped lecture. Although they may not be representative of ratings received in everyday use of the TBC, for the purpose of this analysis they suffice because there is sufficient spread across the response options. The interpretation of Figure 1 would be that the 5-point scale provides a reasonable representation of response options that captures a full range of variability.
By way of comparison, Figure 2 illustrates that the 7-point scale also has the expected monotonic increase in the central tendency of the curves across the increasing points of the scale. However, each response option does not represent the most frequent response for a given range of the Total scale. In this case, Response Option 5 was totally subsumed under Response Option 6, meaning that Option 5 provides little additional information beyond that already provided by Option 6. This principle can be more clearly seen in Figure 3 where several response options are totally subsumed under the others, indicating that the additional options are not providing additional useful information. However, the graphical representation of the items can be confusing and difficult to compare, especially for items that do not have such clear cut ICCs. It is also possible to quantify the relative amount of information provided in the curves for each item across each response scale using IRT models.
The IRT model used in this analysis is a version of the Graded Response Model (Samejima, 1969) for polytomous variables calculated using the “ltm” package for the statistical program R (Rizopoulos, 2006). The Graded Response Model is a two-parameter model in that it estimates both item difficulty and item discriminability. Because of the nature of the comparison, we calculated two separate analyses for the 5-point responses, split by those who responded also to the 7-point or 9-point scale. Thus, when examining analyses involving the 7-point scale, comparisons are only made to the 5-point scale on individuals who also completed the 7-point scale, versus all individuals who completed the 5-point scale (i.e., all analyses remained within-participant).
For those who completed the 7-point scale, both the 5- and 7-point models provided adequate fit to the data (see Table 4). However, the 5-point scale seemed to fit the data better across all fit indices (i.e., smaller numbers). When examining the amount of psychometric information provided by the items (and the total scale; see Table 5), the 7-point scale had a slight advantage in the total amount of information, and was superior on 16 of the 28 items, compared with superior performance on 11 items for the 5-point scale and equal performance on one. However, the difference in the total amount of information is negligible (less than 1%) between the two.
Fit Statistics for the Item-Response Theory Models.
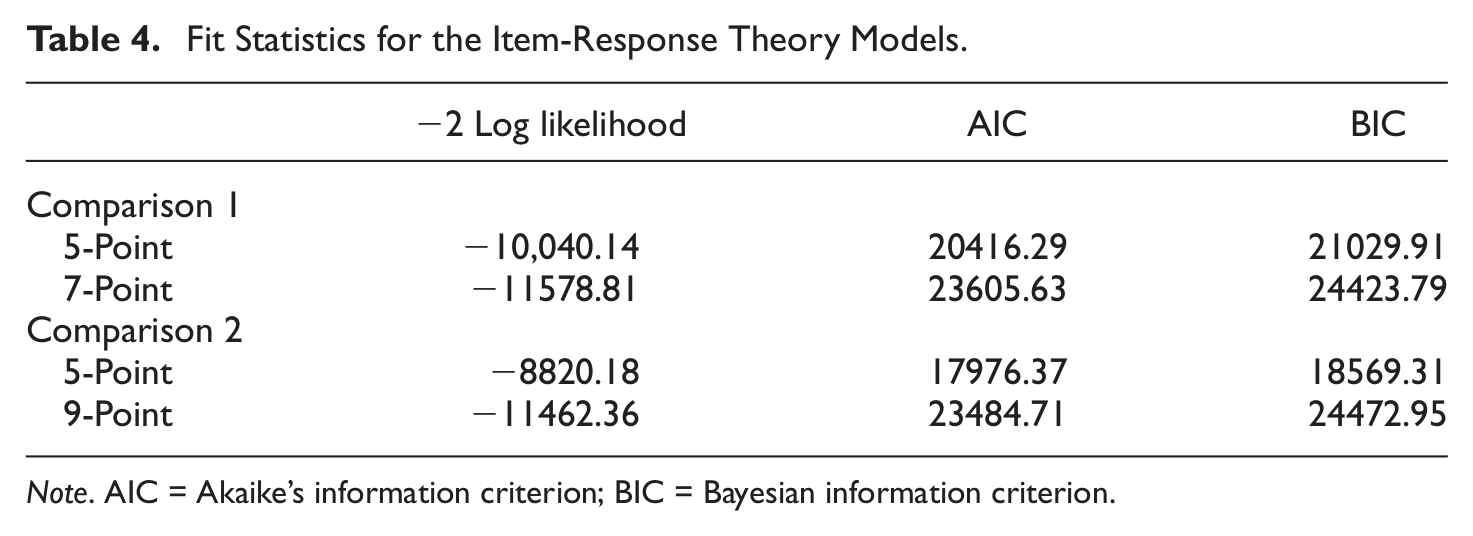
Note. AIC = Akaike’s information criterion; BIC = Bayesian information criterion.
Amount of Information for All TBC Items Across Response Options.
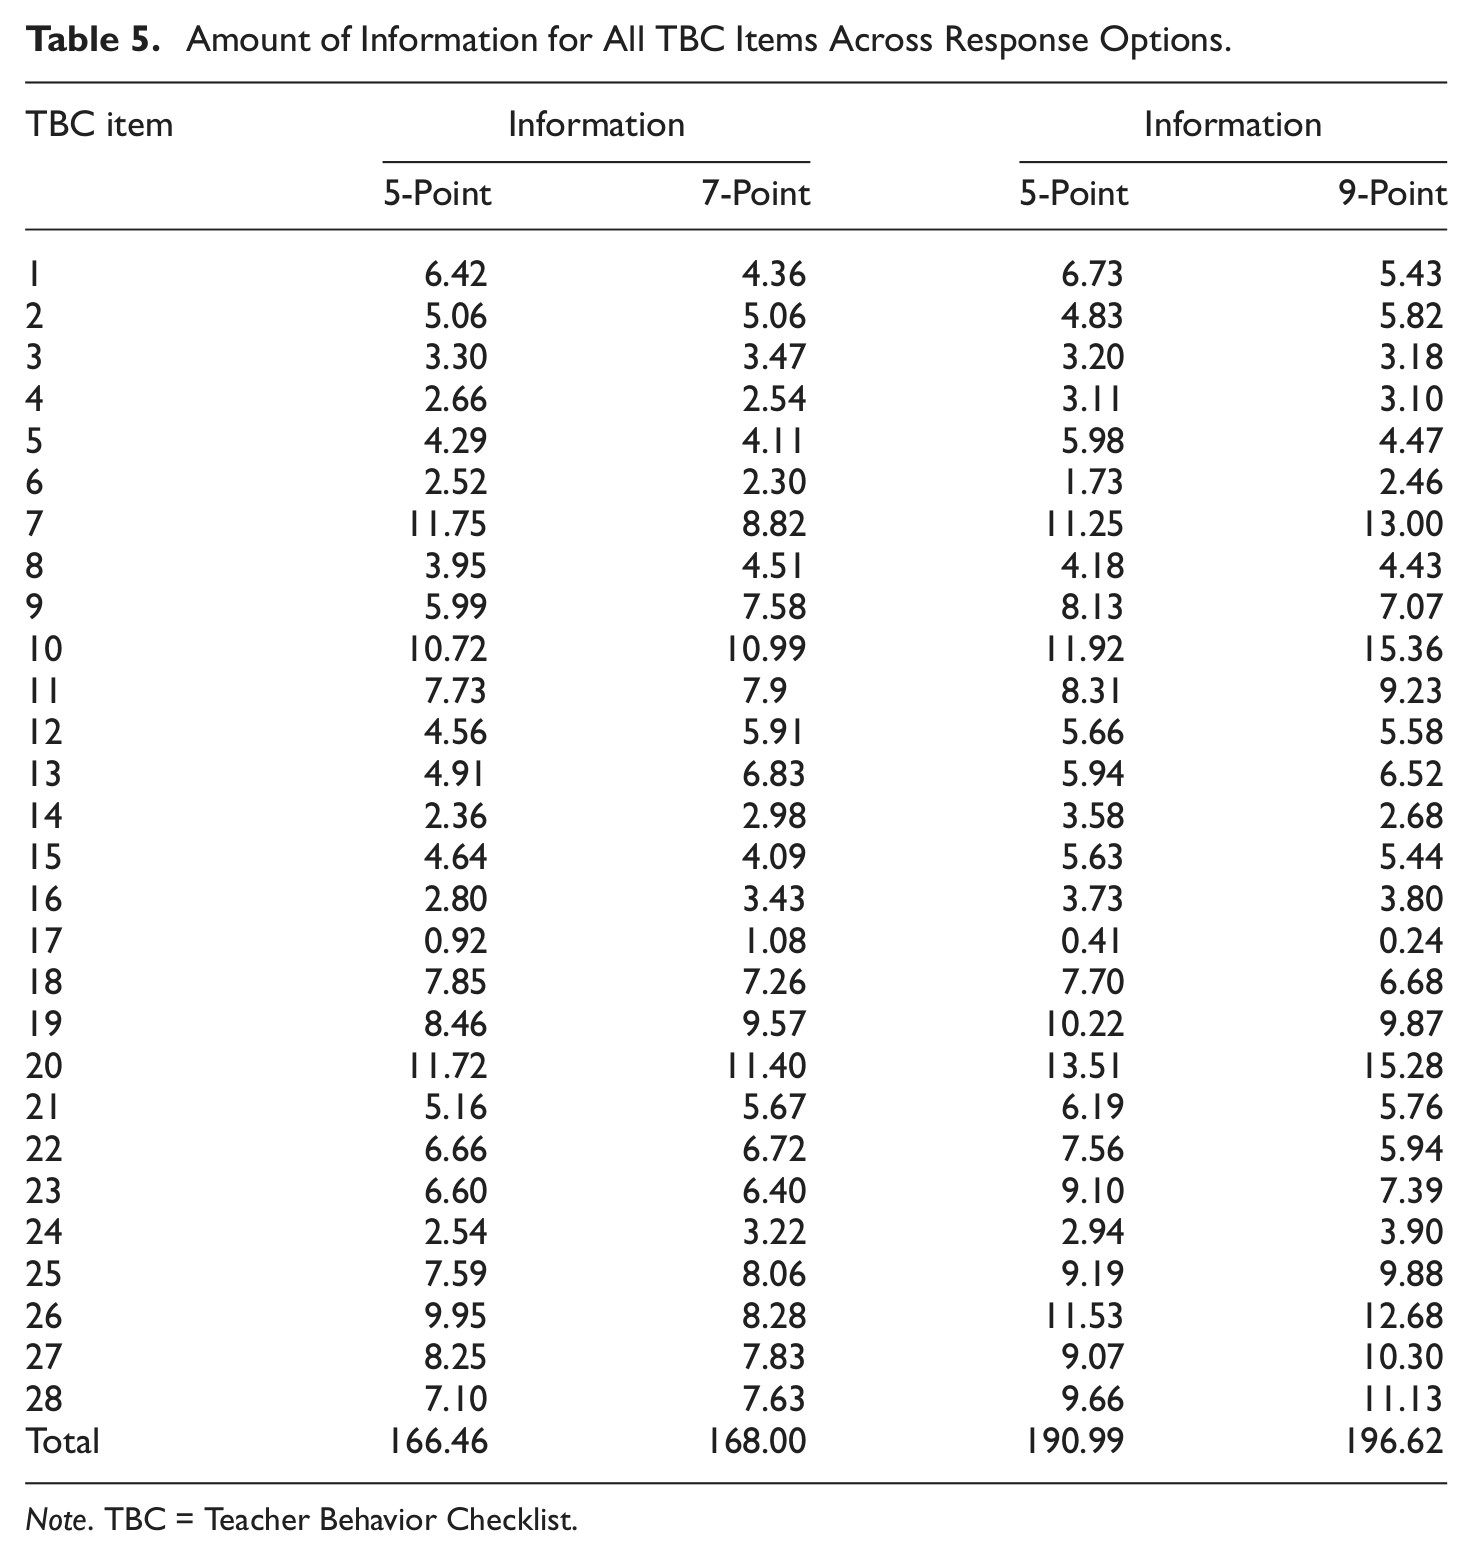
Note. TBC = Teacher Behavior Checklist.
A similar pattern emerged for the 9-point scale. Again, both models provided an adequate fit to the data, with the 5-point model evidencing a more substantial advantage in this case. Again, the larger scale had a slight advantage in the total amount of information provided, but it was again by a minimal amount (2.86%). In this instance, the 9-point scale provided more information on half of the items, and the 5-point on the other half. For all IRT models, full information regarding item difficulty and discriminability parameters are available on request.
Another feature of Table 5 is that some items provide more information than others on the TBC, at least in this context where many items were considered not applicable by many participants. For example, Item 17 (Professional) provided very little information relative to other items, largely because there was little variability relative to the Total score. In other words, Item 17 had a relatively poor relationship with the Total score, in that ratings on Item 17 were almost independent of how participants were rating all the other items. Their estimation of the lecturer’s professional character (which in the description of the item relies almost solely on how the person dressed) was not associated with other characteristics like the speaker’s intonation or attitude.
Other items provided a lot of information about the participants’ estimation of the lecturer’s teaching ability. For example, Items 10 and 20 (Flexible/Open-Minded and Provides Constructive Feedback) were strongly related to how the participant rated the lecturer overall. Interestingly, these strongly related items were ones that many students considered not applicable in the current context.
Discussion
Based on our results, it is evident that the halo effect has a strong impact on the students’ perceptions of the instructor, despite the inclusion of behavioral anchors to operationalize teacher qualities. Even when only manipulating a few behavioral anchors, the students generalized the manipulations to the teacher’s entire performance, including items for which the students were provided no evidence in the video (e.g., promotes class discussion). These findings suggest that if students have a particularly powerful positive or negative opinion of one of the teacher’s characteristics, then they will be likely to give an overall rating that is more positive or negative based on the one opinion. Decreasing the halo effect may prove to be a tough challenge—partly because it is difficult to have students parse a good teacher from a likeable one, and partly because the students may just rate the teacher on an overall “gut” feeling rather than objectively rating the individual behavioral anchors. One possible way to reduce the effect would be simply to educate students about the importance of the ratings and to consider each anchor separately from their overall impression. Research has shown that training student raters and educating them about rating errors significantly decreased the halo effect, although the decrease diminished with subsequent ratings (Bernardin, 1978). Many times these SEIs are given as an afterthought near the end of the semester with little instruction on what to do besides keeping responses confidential. If instructors stressed the importance of the ratings and how they could influence future teaching performance, perhaps the students would more accurately rate the teacher’s performance. Despite the pronounced halo effect we found in the ratings, we did detect a robust difference between the good and bad teaching videos, which evidenced the validity of the TBC ratings for this purpose.
A secondary purpose of this experiment was to determine if it was possible to minimize ceiling and floor effects by expanding the anchors of the rating scale. In traditional 5-point rating scales, scores usually cluster at the upper and lower ends of the scale. We hoped that by expanding the scale to 7 and 9 points, the variability across the scale would increase, which would therefore allow us to detect a greater range of teacher effectiveness. Our results suggested that increasing the rating options provided negligible change to variability for both the 7- and 9-point scales. Furthermore, IRT models showed a minimal increase in information for 7- and 9-point scales versus the 5-point scale. However, the 5-point scale showed superior fit to the data in both cases. Based on these results, we recommend keeping the 5-point anchor scale as the most parsimonious rating system. These results found no advantage to increasing the number of rating options for increasing the range of variability in responses. Five anchor points appeared adequate to capture the range of students’ responses to teacher qualities. Indeed, the additional response options may be nothing more than artificial and meaningless distinctions among an ordinal scale of “good” to “bad” in the students’ internal representation of the teacher.
This study was the first to examine the ceiling/floor effect and halo effect simultaneously. Indeed, the two influences seemed to interact. A strong halo effect across items implies that students internalize a single representation of their teacher as “good” or “bad,” which informs their decision about individual items on an SEI and overrides true item variability. The halo effect also influences ceiling/floor effects via students’ tendency to rate items similarly. When students have a positive impression of the teacher, all items tend to float toward the ceiling of the scale. When students have a negative impression, all items drop toward the floor. To recover meaningful variance across SEI items—which is the information that is most valuable for the formative improvement of the teacher—student ratings must somehow be recentered and made independent from item to item. To do so, teachers and administrators may be fighting an uphill battle, as they are fighting against students’ cognitive representations of teachers (Anderson & Smith, 2005).
One suggested solution would be to train student raters. Indeed, some SEI systems have done so, and may show evidence of scale centering and item individuation (Gillmore & Greenwald, 1994). Nonetheless, even in the Gillmore and Greenwald (1994) study, they found significant halo effects with students tending to respond positively to courses even when attempting to control for the quality of other courses. The Individual Development and Educational Assessment (IDEA) is a privately owned and operated SEI system that is relatively sophisticated in its attempts to control for halo effects (Hoyt, 1973). First, the IDEA system statistically controls for a number of extraneous variables: class size, student motivation, discipline-related difficulty, and student effort (Hoyt, Chen, Pallett, & Gross, n.d.). For example, students tend to rate the instruction more highly in smaller courses, and the system would correct for that effect. Second, individual instructors can compare their scores to a normative basis of similar courses at similar institutions. In that way, instructors can equate for halo effects by shifting the interpretive basis of the scale from the anchors to a normative comparison. For example, a person’s ratings may seem high on the range of the scale, but average relative to other instructors of similar classes. However, for those teachers who do not have the good fortune to work where such formalized systems of SEIs are implemented, they will need to find a way of training students (likely from individual class to individual class) to rate SEI instruments.
One implication of this study is that ceiling/floor and halo effects are likely ubiquitous (and understudied) in SEIs. Both instructors and administrators should be aware of these biases and interpret SEI findings accordingly. Uniformly high ratings may not correspond to uniformly excellent teaching behaviors, and one area of poor performance might drag down all others if students find it particularly salient. For example, one TBC item assesses the degree to which information in the course is current. For someone teaching a history course (or a course that is heavily based on historical context), to the degree to which students value this characteristic and believe it reflects “good” teaching, that item might lower students’ ratings of other, irrelevant items. Similarly, noninstructional variables like students’ appreciation of the professor’s personality style likely influence their ratings (e.g., Clayson & Sheffet, 2006; Kneipp, Kelly, Biscoe, & Richard, 2010), and to the degree students maintain a unified representation of their professor cognitively, those personality appraisals will influence that professor’s overall teaching evaluations.
Limitations
There are a number of limitations to this study. First, the videotaped manipulation of a short lecture is limited in its generalizability to naturalistic classroom settings or students’ rating of SEIs in those contexts. Usually, students have an entire semester to form and/or alter their opinion of a teacher versus only 15 minutes. However, some evidence suggests that students’ initial impression is highly predictive of their overall ratings of a teacher (Ambady & Rosenthal, 1993). Second, because of the artificial nature of the classroom, students may have had less invested in the exercise than in a usual course, because of a lack of a grade, lack of interest in the topic, and so on. Third, we did not conduct an independent manipulation check to ensure that student raters had processed and responded to the manipulated behaviors in the videotaped lecture. Instead, we only measured those differences on the same instrument we used to detect halo effects. Thus, there is no certainty that students responded to the manipulation other than the indirect evidence of overall differences on the TBC scales.
Conclusions
Halo and ceiling/floor effects likely play a large role in distorting the measurement characteristics of SEIs. However, as demonstrated in this study, these effects are robust and resistant to simple interventions like altering the characteristics of the measure. Instead, more explicit training for student raters is likely required to increase the meaningful variability in feedback for teachers.
Footnotes
Acknowledgements
The authors would like to thank Lee McCluskey, Christopher Webb, Destiny Peterson, Tim Hakenwerth, Sam Kempker, and Zachary Pittman for their help in data collection and the anonymous reviewers for their helpful comments.
Declaration of Conflicting Interests
The author(s) declared no potential conflicts of interest with respect to the research, authorship, and/or publication of this article.
Funding
The author(s) disclosed receipt of the following financial support for the research, authorship, and/or publication of this article: All contributors received financial support from the Society for the Teaching of Psychology (a nonprofit professional organization that promotes teaching in the discipline of psychology) through a competitive grant designed to fund research projects on the scholarship of teaching and learning. The Society for the Teaching of Psychology has no interests in any product of the contribution.