
Abstract
The simultaneous item bias test (SIBTEST) method regression procedure and the differential item functioning (DIF)-free-then-DIF strategy are applied to the logistic regression (LR) method simultaneously in this study. These procedures are used to adjust the effects of matching true score on observed score and to better control the Type I error rates of the LR method in assessing DIF, respectively. The performance and the detailed procedure, including anchor length, of the newly proposed method are investigated through a series of simulation studies. The results show that the standard LR method yielded inflated Type I error rates as the percentage of DIF items or group ability differences increased, whereas the newly proposed method produced less inflated results. It controlled Type I error rates well in these conditions as the length of anchor increased. However, the usually suggested one-anchor or four-anchor rule of the DIF-free-then-DIF strategy is not long enough for methods that use the raw score as the matching variable. In general, the newly proposed method with eight anchor items yielded well-controlled Type I error rates under all study conditions, even with 40% DIF items in the test and a group ability difference equal to one standard deviation. It is recommended that both the SIBTEST correction procedure and the DIF-free-then-DIF strategy be applied to the LR method when assessing DIF.
Differential item functioning (DIF) assessment is essential in ensuring test fairness for examinees from different groups. A common metric for matching examinees of different groups should be established before the DIF assessment procedure is carried out. The variable that is used to match examinees with the same or similar ability between groups is called the matching variable. According to the type of matching variable, the formerly proposed DIF assessment methods can be generally divided into two approaches. The first uses latent trait estimates to match examinees (called latent-trait-matching in this study), and the approach includes the item response theory (IRT)–based chi-square test method (Lord, 1980; Wright & Stone, 1979); the likelihood ratio test method (IRT-LRT; Thissen, Steinberg, & Wainer, 1988); and the area measure method that calculates the area between two item response functions (Raju, 1988, 1990). The other approach uses the observed score of the test as a matching variable (called observed-score-matching in this study), and examples of this approach include the Mantel–Haenszel method (Holland & Thayer, 1988), the simultaneous item bias test (SIBTEST) method (Shealy & Stout, 1993), and the logistic regression (LR) method (Swaminathan & Rogers, 1990).
In DIF assessment methods, especially the observed-score-matching approach, mismatch between groups might cause inflated Type I error rates (incorrectly identifying DIF-free items as DIF), and therefore yield incorrect DIF assessment results (Meredith & Millsap, 1992; Zwick, 1990). The influence of inflated Type I error rates will be introduced later. More specifically, when the observed score of the test is used as the matching variable, several factors that might lead to a mismatch between the observed score and ability are as follows. First, including too many DIF items in the test leads to inappropriate matching variables and incorrect DIF assessment results, especially when most or all the DIF items are favored to the same group (e.g., the reference group). Consequently, the Type I error rates of DIF assessment tend to be inflated, and the power rates tend to be deflated as the percentage of DIF items in the test is increased (Jodoin & Gierl, 2001; Wang, Shih, & Yang, 2009). Second, as the mean ability difference between groups (i.e., impact) is increased, the mean difference in the true ability of examinees matched to the observed score is increased, especially for less reliable tests (DeMars, 2010). Furthermore, when data include guessing, using a method with the wrong parametric form to assess DIF might lead to inflated Type I error rates (DeMars, 2010). In this study, we focus on handling the three factors simultaneously. We deal with the former two factors by adding two procedures to the LR method, and we evaluate the performance of the newly proposed method under various conditions by adding the third factor in the design of the simulation study.
The inflated Type I error rate has several drawbacks. The first is the inefficient use of testing resources (Jodoin & Gierl, 2001), as the items identified as DIF should be revised by item writers or subject experts. Second, items that are actually DIF-free would be revised unnecessarily, which can create further problems. Third, the power rates of a method with inflated Type I error rates might be meaningless, and, therefore, power comparisons between the different DIF assessment procedures could be problematic (Li & Stout, 1996). Last, by incorrectly identifying DIF-free items as DIF, the confidence in the test score is threatened.
To yield a well-controlled Type I error rate in DIF assessment, three strategies are usually adopted. The first is the scale purification procedure to diminish the contamination caused by the DIF items in the matching variable. The procedure has been applied to several DIF assessment methods (Clauser, Mazor, & Hambleton, 1993; French & Maller, 2007; Navas-Ara & Gómez-Benito, 2002). Most of the scale purification procedures consist of similar procedures, and detailed explanations of the steps can be found in the literature (French & Maller, 2007; Wang et al., 2009). Navas-Ara and Gómez-Benito (2002) investigated the effect of ability scale purification on the DIF assessment for both latent-trait-matching and observed-score-matching methods and found that purifying the scale can improve the results of DIF assessment greatly. French and Maller (2007) applied the scale purification procedure to the LR method and found that it performs better in assessing DIF than the standard LR method under certain conditions does. Moreover, several studies have applied scale purification procedures to latent-trait-matching methods (Candell & Drasgow, 1988; Park & Lautenschlager, 1990; Wang et al., 2009). For example, the scale purification procedure has been applied to the multiple indicator, multiple causes method (MIMIC; Wang et al., 2009), and the MIMIC method with scale purification outperforms the standard MIMIC method in controlling false-positive rates and yielding higher true-positive rates. In general, the DIF assessment method with the scale purification procedure yielded better controlled Type I error rates and increased power rates compared with those of the assessment without the scale purification procedure. However, when there are 20% or more DIF items in the test, the DIF method with the scale purification procedure began to yield an inflated Type I error rate and a deflated power rate (French & Maller, 2007; Wang et al., 2009).
Second, a so-called DIF-free-then-DIF (DFTD; Wang, Shih, & Sun, 2012) strategy can help to control Type I error rates of DIF assessment when there may be many DIF items in the test. The logic of the DFTD strategy, as the scale purification procedure, is to diminish the effect of DIF items to the matching variable and to keep it as pure as possible. This strategy is actually a combination of the constant anchor item (CI; Wang & Yeh, 2003) method and an anchor item selection method (which will be introduced later). When using the CI method to assess DIF for items in the test, a set of most possibly DIF-free items should be set as the anchor to build up the pure common metric for different groups. Through a series of simulation studies, the CI method was found to yield very good control over Type I errors and reasonable power, given that a set of DIF-free anchor items can be correctly identified, even when there are 32% to 40% DIF items in the test (Shih & Wang, 2009; Wang & Yeh, 2003). Therefore, a way to better control the Type I error rates of DIF assessment would be to identify a set of DIF-free items first and then assess DIF for all other items in the test by setting the preidentified items as anchor (the latter part is the CI method). The resulting two-step DIF assessment procedure formed the DFTD strategy. The DFTD strategy so far has been applied to latent-variable-matching methods, such as the MIMIC method (Shih & Wang, 2009; Wang & Shih, 2010); IRT-LRT method (Wang et al., 2012); and the hierarchical generalized linear model (Chen, Chen, & Shih, 2014), and one anchor or four anchors is usually suggested (Shih & Wang, 2009).
The third strategy is the SIBTEST method, which is especially useful for short tests and large samples with existent impact (DeMars, 2009). The SIBTEST method was proposed to correct the mismatch of latent traits between different groups of examinees with identical observed scores (Shealy & Stout, 1993). Through regressing the observed score on the true score, whether linearly or nonlinearly, and then adjusting the difference in proportion to the correct metric for a different group of examinees, the SIBTEST method can yield well-controlled Type I error rates in DIF assessment. Both the linear and nonlinear regression correction procedures have been applied to the LR method (called LR-SIB) by DeMars (2009), and the nonlinear correction was effective in controlling Type I error rates when an impact exists between groups. However, DeMars assumed there is only one DIF item (i.e., the studied item) in the test. In reality, there might be more than one item exhibiting DIF in the test. For example, Chilisa (2000) found that 11 of the 60 items in the Botswana Junior Certificate Science Multiple-Choice Examination exhibited DIF, and 6 of them favored girls, and the others favored boys. In addition, Maller (2001) found that approximately one third of the items in the Wechsler Intelligence Scale for Children (third edition) exhibited DIF. Because many DIF items in a test (especially when most DIF items favored the same group) can result in less accurate ability estimates, and it is expected to weaken the correctness of matching between raw test scores and ability estimates and therefore yield inflated Type I error rates and deflated power rates of DIF assessment (French & Maller, 2007; Jodoin & Gierl, 2001). How the LR-SIB method performs when there are many DIF items in the test remains unknown, and further investigation is needed.
The effects of the DFTD strategy and the SIBTEST correction procedure of the observed-score-matching method under different conditions remain unclear. In this study, the LR method is selected to stand for the observed-score-matching methods for several reasons. First, the LR method is quite popular for its capability of assessing uniform and nonuniform DIF simultaneously, and it is less complex in computation during the DIF assessment (French & Finch, 2010; Narayanan & Swaminathan, 1996; Swaminathan & Rogers, 1990). Second, unlike the popular Mantel–Haenszel method used to categorize examinees into groups, the LR method uses the continuous matching variable (i.e., the observed score) as a predictor of the studied item score. Therefore, the LR method takes the continuous nature of a latent trait into account, and it is flexible to adding more variables as the predictor in the model for the DIF assessment (DeMars, 2009; Mazor, Kanjee, & Clauser, 1995; Swaminathan & Rogers, 1990). Moreover, the LR can be easily adopted to accommodate multilevel data (French & Finch, 2010), and the possible source of DIF can be explored by adding an item or a covariate into the model (van den Noortgate & De Boeck, 2005). Last, the SIBTEST correction procedure has been applied to the LR method (DeMars, 2010), and, therefore, the results can be taken as a reference in this study.
Several variations of LR method have been proposed and their performances are investigated. The scale purification procedure and effect size measure have been applied to the LR method, and its performance in assessing DIF was compared with standard LR method (French & Maller, 2007). Though the scale purification procedure is beneficial under certain conditions, French and Maller found that the overall power and Type I error rates of the LR method did not substantially improve after the scale purification procedure was added. However, Bolt and Gierl (2006) found that groups that were matched on the observed score differed on true score when a large impact existed. Furthermore, to adjust the inflated Type I error rates caused by impact, the linear and nonlinear corrections of the SIBTEST method were incorporated into the LR method by DeMars (2009), who found that the nonlinear correction procedure in SIBTEST can effectively reduce the Type I error inflation for the LR method, when the sample size of each group is large (e.g., 1,000 or 2,000 examinees). Though these variations of the LR method have been investigated, the performance of these methods in assessing DIF when there are many DIF items in the test has not being investigated yet. Meanwhile, the DFTD strategy has not been applied to the observed-score-based method yet, and the procedural details remain unclear. For example, as mentioned previously, either one anchor or four anchors are typically used in the DFTD strategy, and such a short anchor was found long enough to yield well-controlled Type I error rates and a high power of DIF assessment for latent-trait-matching methods (Chen et al., 2014; Shih & Wang, 2009). However, this might not be true for the observed-score-matching method, because a short anchor means that the matching score does not have enough observed score points to separate examinees, especially when impact exists. Consequently, the matching between groups can be problematic, as can the following DIF assessment. Therefore, the length of anchor is a critical issue when applying the DFTD strategy to the observed-score-matching methods. In addition, how well the DFTD strategy works with the SIBTEST correction within the LR method needs further investigation. This study compares several different variations of LR methods simultaneously under various conditions. Moreover, the detailed settings of the newly proposed LR method will be further discussed in this study.
The article is organized as follows. First, the procedures of the LR method on DIF assessment are introduced. Next, several newly proposed LR methods that have combined the DFTD strategy and the SIBTEST correction procedures are presented. Then, a simulation study is used to compare the performances of the new methods. In addition, several variations of LR methods in DIF assessment were implemented and the results are summarized. Next, another simulation study used to determine the minimum size of anchor set for the newly proposed method is presented, and the results are summarized. Finally, the findings and limitations are described and the conclusions of this study are drawn.
LR Method for DIF Assessment
The LR method was proposed by Swaminathan and Rogers (1990). Within the LR model, the observed score of examinee, group membership, and their interaction were usually included in the model as predictors. In the LR method, the probability of a correct response can be expressed as
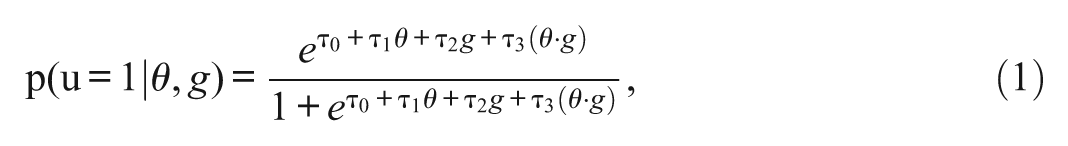
where
Applying the SIBTEST Correction Procedures to the LR Method
The matching variable of the LR method is the observed score that consists of the score of a set of anchor items and the studied item. However, such a matching criterion might fail to control Type I error rates when large impact exists between groups (Shealy & Stout, 1993; Zwick, 1990). To solve this problem, the SIBTEST procedure includes an approach that excludes the studied item from the matching variable. However, the studied item is included in the matching variable (the ability effect) of the LR method. Specifically, the SIBTEST estimates each group’s true score within the cell and then adjusts the proportion of correct answers to recover the difference in true scores between the two groups (DeMars, 2009). Using Jiang and Stout’s (1998) notation here, the linear regression of true score on observed scores of the matching variable can be expressed as
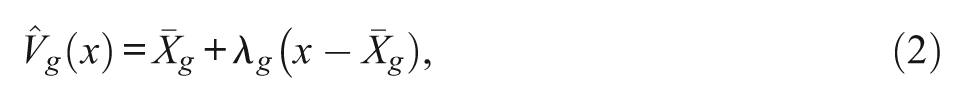
where x is the observed score of matching variable (without the studied item),
After the estimated true score of the matching variable

where
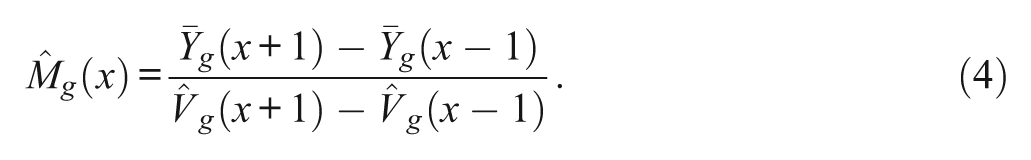
After the adjusted true scores of the two groups have been estimated, a chi-square statistical test with one degree of freedom for DIF assessment is then carried out. However, the linear regression that has been described above is not always appropriate in a real test. For example, when guessing is presented in item response data, the regression of the true score on the observed score (i.e., true regression) is nonlinear rather than linear.
Applying a more complex nonlinear approach to the data fits the true regression better, but there is more noise in estimating the true regression than that would be expected. To solve this problem, a two-piecewise linear approach was used by Jiang and Stout (1998). Within the nonlinear correction, the point estimates
where
Applying the DFTD Strategy to LR for DIF Assessment
The DFTD strategy contains two steps. First, a procedure for identifying a set of anchor items that are the most likely to be DIF-free is implemented. Several procedures have been proposed to identify the DIF-free items as anchors, namely the standard method (Woods, 2009), the scale purification method (Wang et al., 2012), and the iterative constant-item method (Shih & Wang, 2009). Because the scale purification method was found to be more accurate than the standard method in identifying DIF-free items when there are many DIF items, and especially for large samples (Wang et al., 2012), and because the method is less labor intensive than the iterative constant-item method, the scale purification procedure of the LR method (denoted as LR-SP) is used to identify anchor items in this study. The statistical testing result of the final iteration of the LR-SP method was used to identify the most unlikely DIF items as the anchors. The detailed steps for identifying anchors are as follows:
Conduct the LR method to assess DIF with chi-square test for every item in the test
Remove DIF items from the matching variable
Conduct the LR method to assess DIF for every item with the new matching variable
Repeat Steps 2 and 3 until the same set of items are identified as having DIF in two consecutive iterations and record the difference of deviance (i.e., −2 log-likelihood) between two comparative models for each item. For example, to assess uniform DIF, a reduced model (Equation 1 without the
Find a set of items (depends on the length of anchor) with the smallest difference of deviance as the anchor
After the anchor items were identified, the CI method (Wang & Yeh, 2003) is used to assess DIF for other items of the test in the second step.
When applying the DFTD strategy to the LR method (called LR-DFTD), the matching variable consists of the observed score of a set of anchor items and the studied item, which is the same way as the standard LR method. Such a matching variable performs well in matching examinees from different groups when the response data follow a one-parameter logistic (1PL; Rasch, 1960) model (Holland & Thayer, 1988). However, when there is large group ability difference, the Type I error rates of DIF assessment tend to be inflated, regardless of whether the studied item is included in the matching variable or not (Zwick, 1990). This might be because using the observed score as a matching variable is unlikely to match the true ability when there is large impact (DeMars, 2010). Nevertheless, if the test length is long enough, the observed score on the total test might still be a good approximation to match examinees, even when impact exists (Roussos & Stout, 1996). Therefore, a long anchor was used first to yield a good match between the observed score and the true score in this study.
Applying the SIBTEST Correction Procedure and DFTD Strategy Simultaneously to the LR Method
Shealy and Stout (1993) proposed the SIBTEST method, which implemented a so-called regression correction to solve the Type I error inflation problem caused by impact. The correction procedure was preliminarily applied to the Mantel–Haenszel and LR method by DeMars (2009). In this study, the matching variable of the LR-DFTD method is further modified by adding the SIBTEST correction (called LR-DFSIB method). When applying the DFTD strategy and SIBTEST correction simultaneously to the LR method, the correction for the studied item score and the matching score are two separated steps. First, a set of anchor items and one studied item are viewed as a whole test. The matching subtest score is defined as the sum of the anchor items (without studied item), and the adjusted matching scores of two groups are calculated through Equation (2). Subsequently, the studied item score is adjusted through Equation (3). The sum of two adjusted scores is regarded as the true score to match people between groups for DIF assessment in the LR method. This adjustment is also applied for the iterative purification procedure when identifying anchors in the first step of the LR-DFSIB method. In sum, when adjusting the matching score within the SIBTEST regression correction procedure of the LR-DFSIB method, the studied item is not included in the matching variable. However, when using the LR-DFSIB to assess DIF for items, the score of the studied item is added into the matching variable, as suggested in the literature (Holland & Thayer, 1988; Zwick, 1990). Though an anonymous reviewer suggested that the studied item should not be added to the matching variable in this study because the true score difference has been adjusted in the anchor, we added it as well because the pure anchor is not achieved perfectly by the current anchor item selection methods.
Method
The newly proposed LR-DFSIB method is expected to diminish the influence of impact on DIF assessment between two groups when there are many DIF items in the test. The performances of the LR-DFSIB method in assessing DIF are investigated through a series of simulations in this study. Taking several variations of the LR method (described above) as a baseline for comparison, the methods being compared in this study are the standard LR method (denoted as LR), the LR method with a scale purification procedure (denoted as LR-SP), the LR method with the SIBTEST nonlinear correction (denoted as LR-SIB), the LR method with the DFTD strategy (denoted as LR-DFTD), and two forms of the LR-DFSIB method—the LR-DFTD procedure with the SIBTEST linear correction (denoted as LR-L-DFTD) and the LR-DFTD procedure with the SIBTEST nonlinear correction (denoted as LR-N-DFTD). The simulation study can be divided into two parts. The performances of six methods were compared under different conditions, including the worst scenario, in Simulation Study 1, to evaluate which method performed best among these methods. This is because the observed score on the total test can be a good approximation to match people even when impact exists, given that the test length is long enough (Roussos & Stout, 1996). Moreover, a longer matching subtest would approximate nonlinear correction assumption properly (Jiang & Stout, 1998). Therefore, the matching variable of the LR-DFSIB method should be as long as possible. The longest anchor that has been investigated is 20% of the test length (Woods, 2009), and therefore, this length is adopted in the LR-DFTD and LR-DFSIB methods in Simulation Study 1. If the LR-DFSIB method with a long anchor does not perform better than the other methods, then it should not be used in assessing DIF, no matter whether the test is short or long. However, if the LR-DFSIB method (with a long anchor) performs better than other methods, it is worth to know if the 20% rule works well for both long and short tests, as well as if a shorter anchor can reach a similar performance to that of a long anchor in the LR-DFSIB method. The length of anchor is investigated here because it is a critical issue in reality, and because the risks of including DIF items as anchors increases as the length of anchor is increased. Therefore, the length of the anchor on the LR-DFSIB method is further investigated in Simulation Study 2, to provide useful information for both researchers and practitioners in identifying a set of anchor items for the LR-DFSIB method.
Design of Simulation Study 1
Six independent variables were manipulated in Simulation Study 1: (1) item response model, two-parameter logistic model (2PL; Birnbaum, 1968) and three-parameter logistic model (3PL; Birnbaum, 1968); (2) DIF assessment methods, LR, LR-SP, LR-SIB, LR-DFTD, LR-L-DFTD, and LR-N-DFTD, where N and L indicated nonlinear and linear correction procedure, respectively (in the LR-SIB, only the nonlinear correction procedure was used); (3) magnitude of impact—0 and 1. The latent trait of reference group follows N(0, 1), whereas the focal group follows N(0, 1) and N(−1, 1), respectively; (4) test length—20 and 60 items; (5) percentage of DIF items in the test—0%, 10%, 20%, 30%, and 40%; (6) sample size—R250/F250, R500/F250, R500/F500, and R1000/F500, where R and F represented the reference and focal groups, respectively. The reasons for manipulating these variables are explained next.
Model
For observed-score-matching methods, the Type I error rates of the DIF assessment can be inflated when the observed score is not a sufficient statistic for the latent trait, and also the LR method is used to assess the DIF when the data include “guessing” and there is large impact between groups (DeMars, 2010). To investigate the effect of the DFTD strategy and the SIBTEST correction procedure in controlling Type I error rates, the conditions with inflated Type I error rates are needed, which is most likely generated from the 3PL model. However, the data generated from 2PL can yield a good model−data fit in the LR method (Rogers & Swaminathan, 1993), and, therefore, the 2PL model is also used in this study.
Impact
The Type I error rates of DIF assessment tend to be inflated when impact exists between groups (DeMars, 2010). Furthermore, impacts can interact with other variables and degraded power rates of DIF assessment (Jodoin & Gierl, 2001). Therefore, impact was manipulated in this study. The impact was set at 0 to represent the conditions where no impact existed between groups, whereas 1 was chosen to represent the largest difference between groups in the literature reviewed in this study (DeMars, 2009; French & Maller, 2007).
Test Length
As a measure of latent trait, the accuracy of observed score is affected by the test length, and the longer the test, the more reliable the observed score (Swaminathan & Rogers, 1990). Less reliable scores yield greater inequality in the latent trait for equal observed scores, which is the same consequence as that under large impact conditions (DeMars, 2010). Therefore, test length is manipulated in this study.
Percentage of DIF Items
The percentage of DIF in the test is expected to affect Type I error and power rates of DIF assessment because the large percentage of DIF items can reduce the validity of the matching variable and result in less accurate ability estimates (French & Maller, 2007; Jodoin & Gierl, 2001). Therefore, this variable is manipulated in this study.
Sample Size
Because the Type I error rates increased in the LR method as the sample size of the reference and focal groups increased (Jodoin & Gierl, 2001; Rogers & Swaminathan, 1993), and because we wanted to know if the methods investigated in this study could help to control Type I error rates for the LR method under large samples, we have manipulated the sample size in this study.
A set of Matlab software programs were written by the authors to generate response data and to implement the following DIF assessment. When assessing DIF for all methods in this study, the GLMFIT function of Matlab was used to implement the model comparison with the chi-square statistical test with one degree of freedom. The dependent variables were the accuracy in identifying a set of DIF-free items, Type I error rates, and power rates of DIF assessment, where the accuracy of each condition was calculated as the averaged proportion of the anchor items identified by the LR-SP method that are indeed DIF-free over replications. The anchor length was set as 20% of the test length, and, therefore, 4 and 12 items would be identified as anchors under the 20- and 60-item conditions, respectively. For a replication that one of the four identified items (when test length is 20) is DIF-free, the accuracy is 0.25; if 6 of the 12 identified items (when test length is 60) are DIF-free, the accuracy is 0.50. As to the Type I error rates, a conservative significance level of .10 was used as the criterion in this study, and a Type I error rate larger than .10 would be deemed as inflation.
Other settings of Simulation Study 1 are as follows. The item parameters were taken from the study of Hanson and Beguin (2002), and the first 20- and 60-item parameters were adopted for the 20- and 60-item conditions in this study. When the data followed the 2PL model, then the c-parameter was set to 0 for all items. The DIF amount for each item was generated from N(0.4, 0.01), and all the DIF items were favored to the reference group and were arranged from the beginning of the test. Only uniform DIF was investigated in this study. In the LR-DFTD, LR-N-DFTD, and LR-L-DFTD methods, 20% of the test items were set as the anchor: 4 and 12 items were used as the anchor for these three methods under the 20- and 60-item conditions, respectively. A nominal α of .05 is used in this study. One hundred replications were made under each condition.
Results of Simulation Study 1
Accuracies of Identifying DIF-Free Items
The accuracy of the LR-SP method in identifying DIF items under various conditions is listed in Table 1. The listed accuracy is calculated as the average accuracy over 100 replications. Under the 2PL model, the accuracies of identifying a set of up to 12 DIF-free items are always higher than .75. As long as the percentage of DIF items in the test is no greater than 30%, the accuracy can always remain higher than .90, no matter what the sample size is. The accuracies increased as the sample size increased, and it is always higher than .96 under the R1000/F500 condition, which means, in this condition, the LR-SP can identify a set of up to 12 DIF-free items almost perfectly, even when there are 40% DIF items in the test. Moreover, the accuracies under the long test were slightly higher than those under the short test; the accuracies under no-impact conditions were higher than those under the conditions with impact.
Accuracy of Identified Items That Are Indeed DIF-Free.
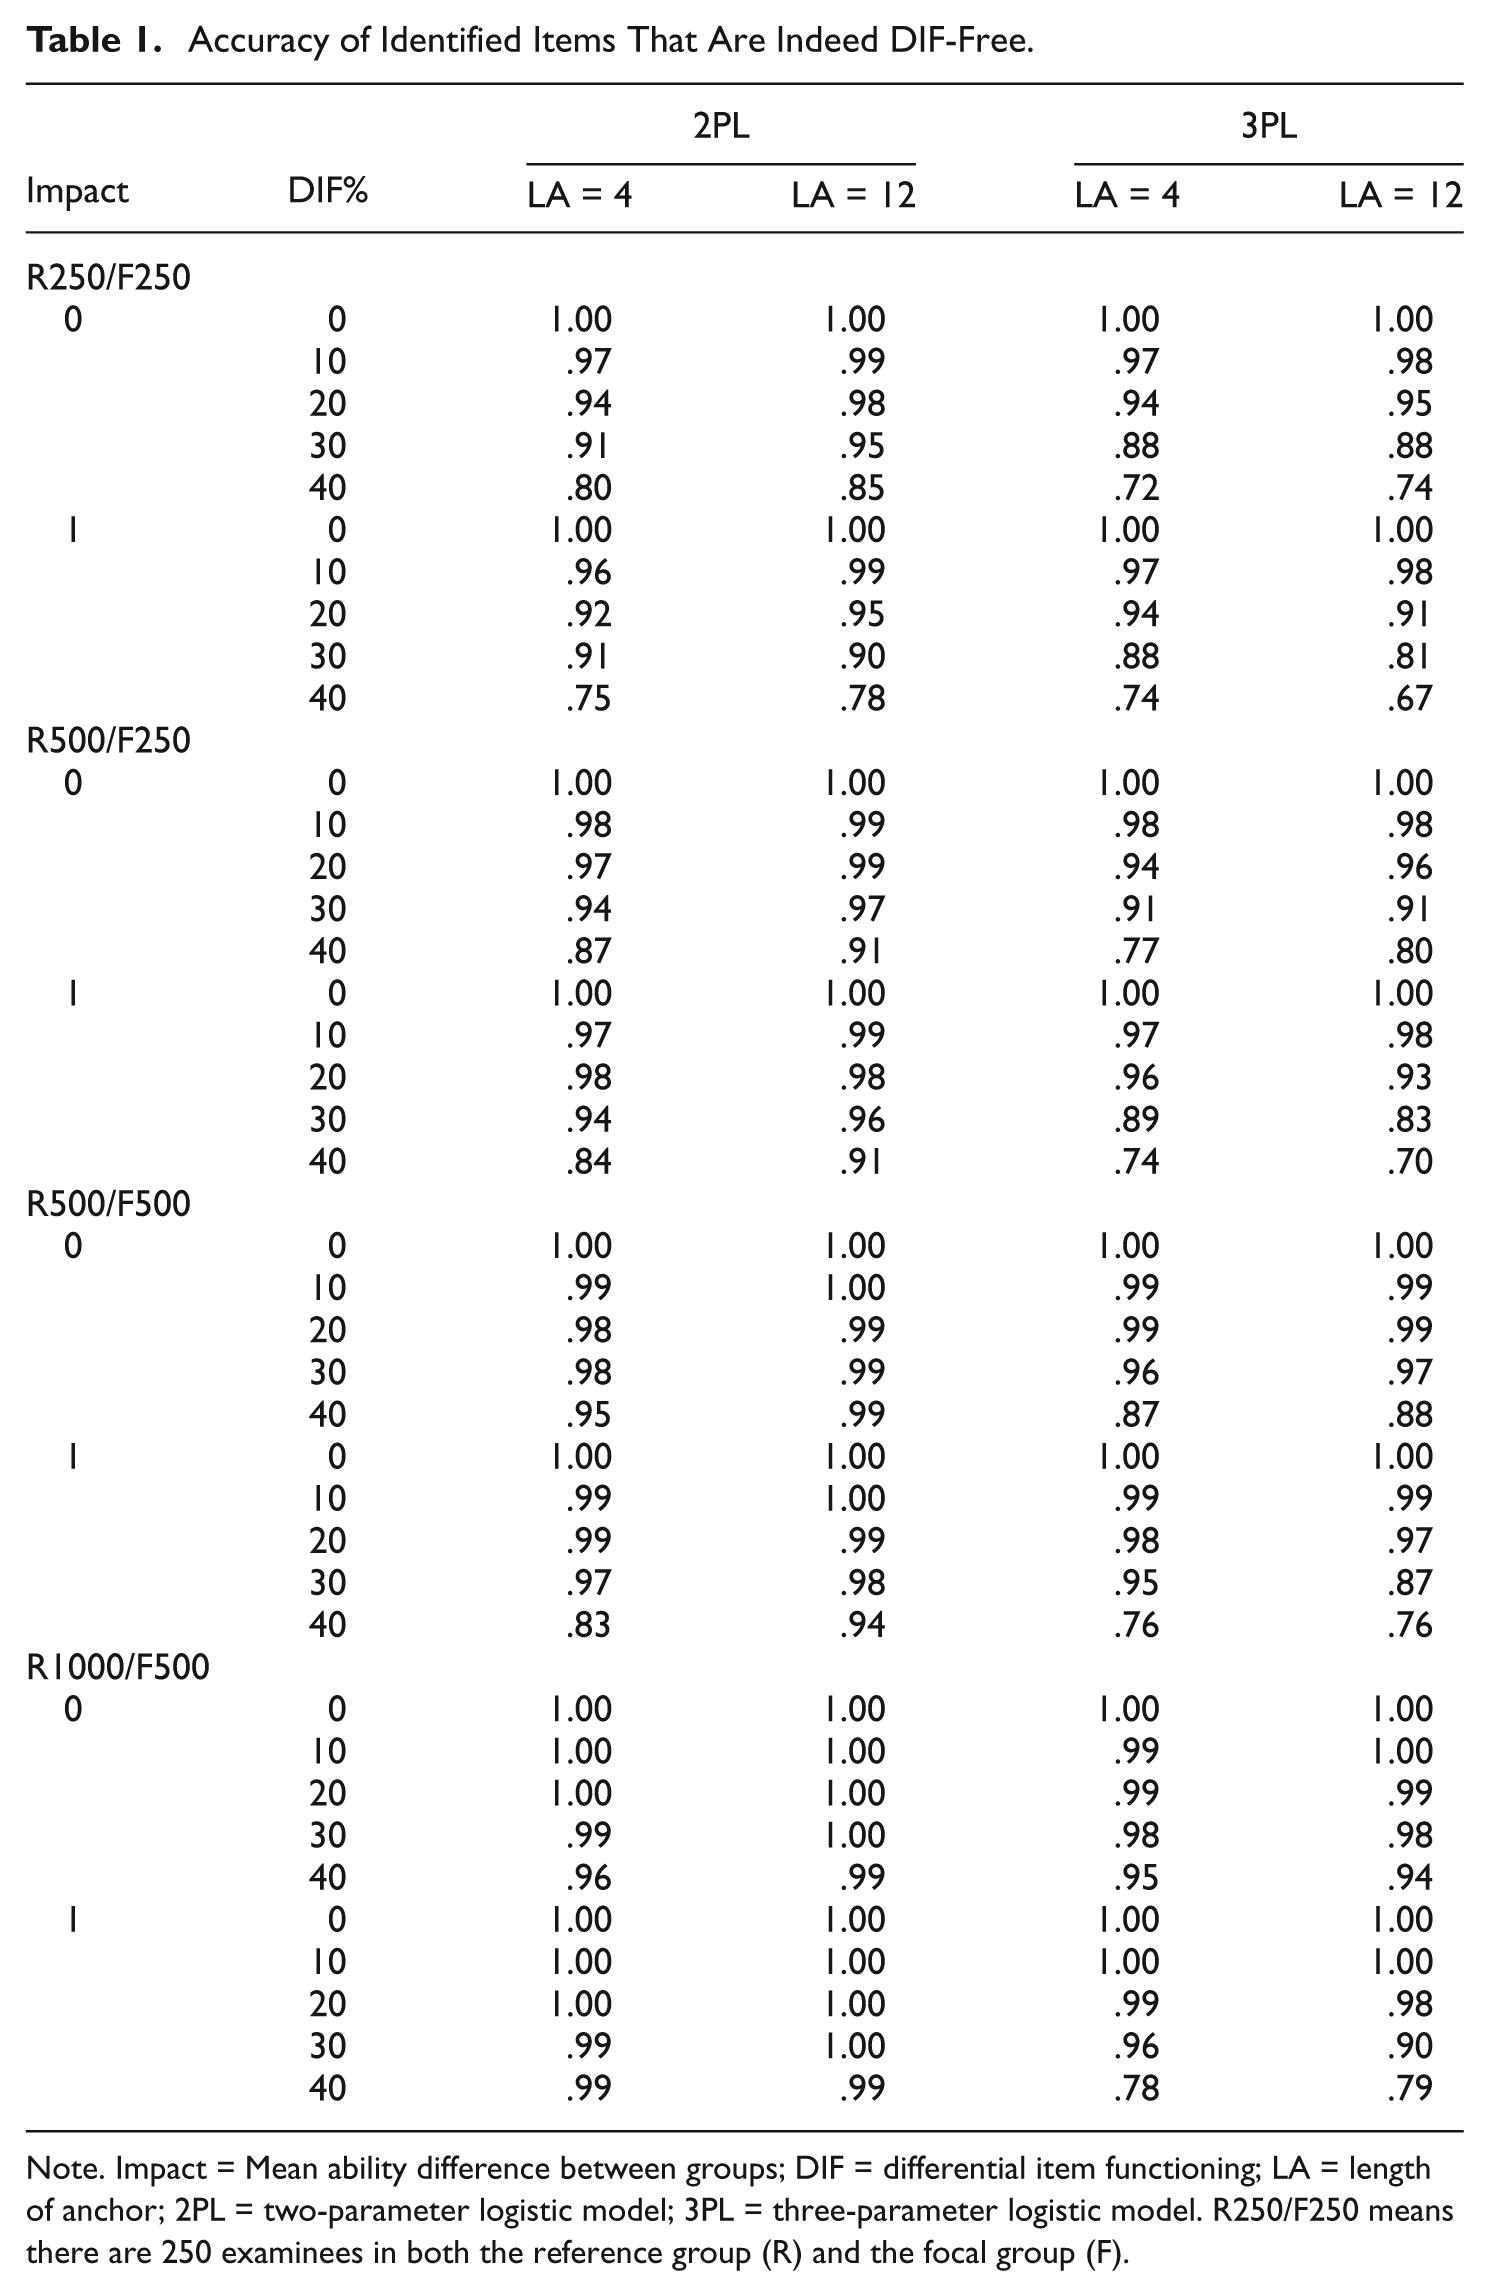
Note. Impact = Mean ability difference between groups; DIF = differential item functioning; LA = length of anchor; 2PL = two-parameter logistic model; 3PL = three-parameter logistic model. R250/F250 means there are 250 examinees in both the reference group (R) and the focal group (F).
Under the 3PL model, the accuracies in identifying DIF-free items were higher than .67. The accuracies were always higher than .81, given that the percentage of DIF items in the test were no greater than 30%, even when the sample size of each group is small. Similar to the 2PL results, the accuracies increased as the sample size increased, and it was always higher than .78 under the R1000/F500 condition. In addition, the accuracies under no-impact conditions were higher than those under impact conditions. In general, the accuracies under the 3PL model were lower than those under the 2PL model.
DIF Assessment Under 2PL
Table 2 shows the Type I error rates and power rates of these six methods under the 2PL model, and no impact existed between groups. The cells with inflated Type I error rates, as well as the corresponding power rates, are marked in italics and underlined.
Type I Error Rates and Power Rates of Six Methods Under 2PL With Impact = 0.
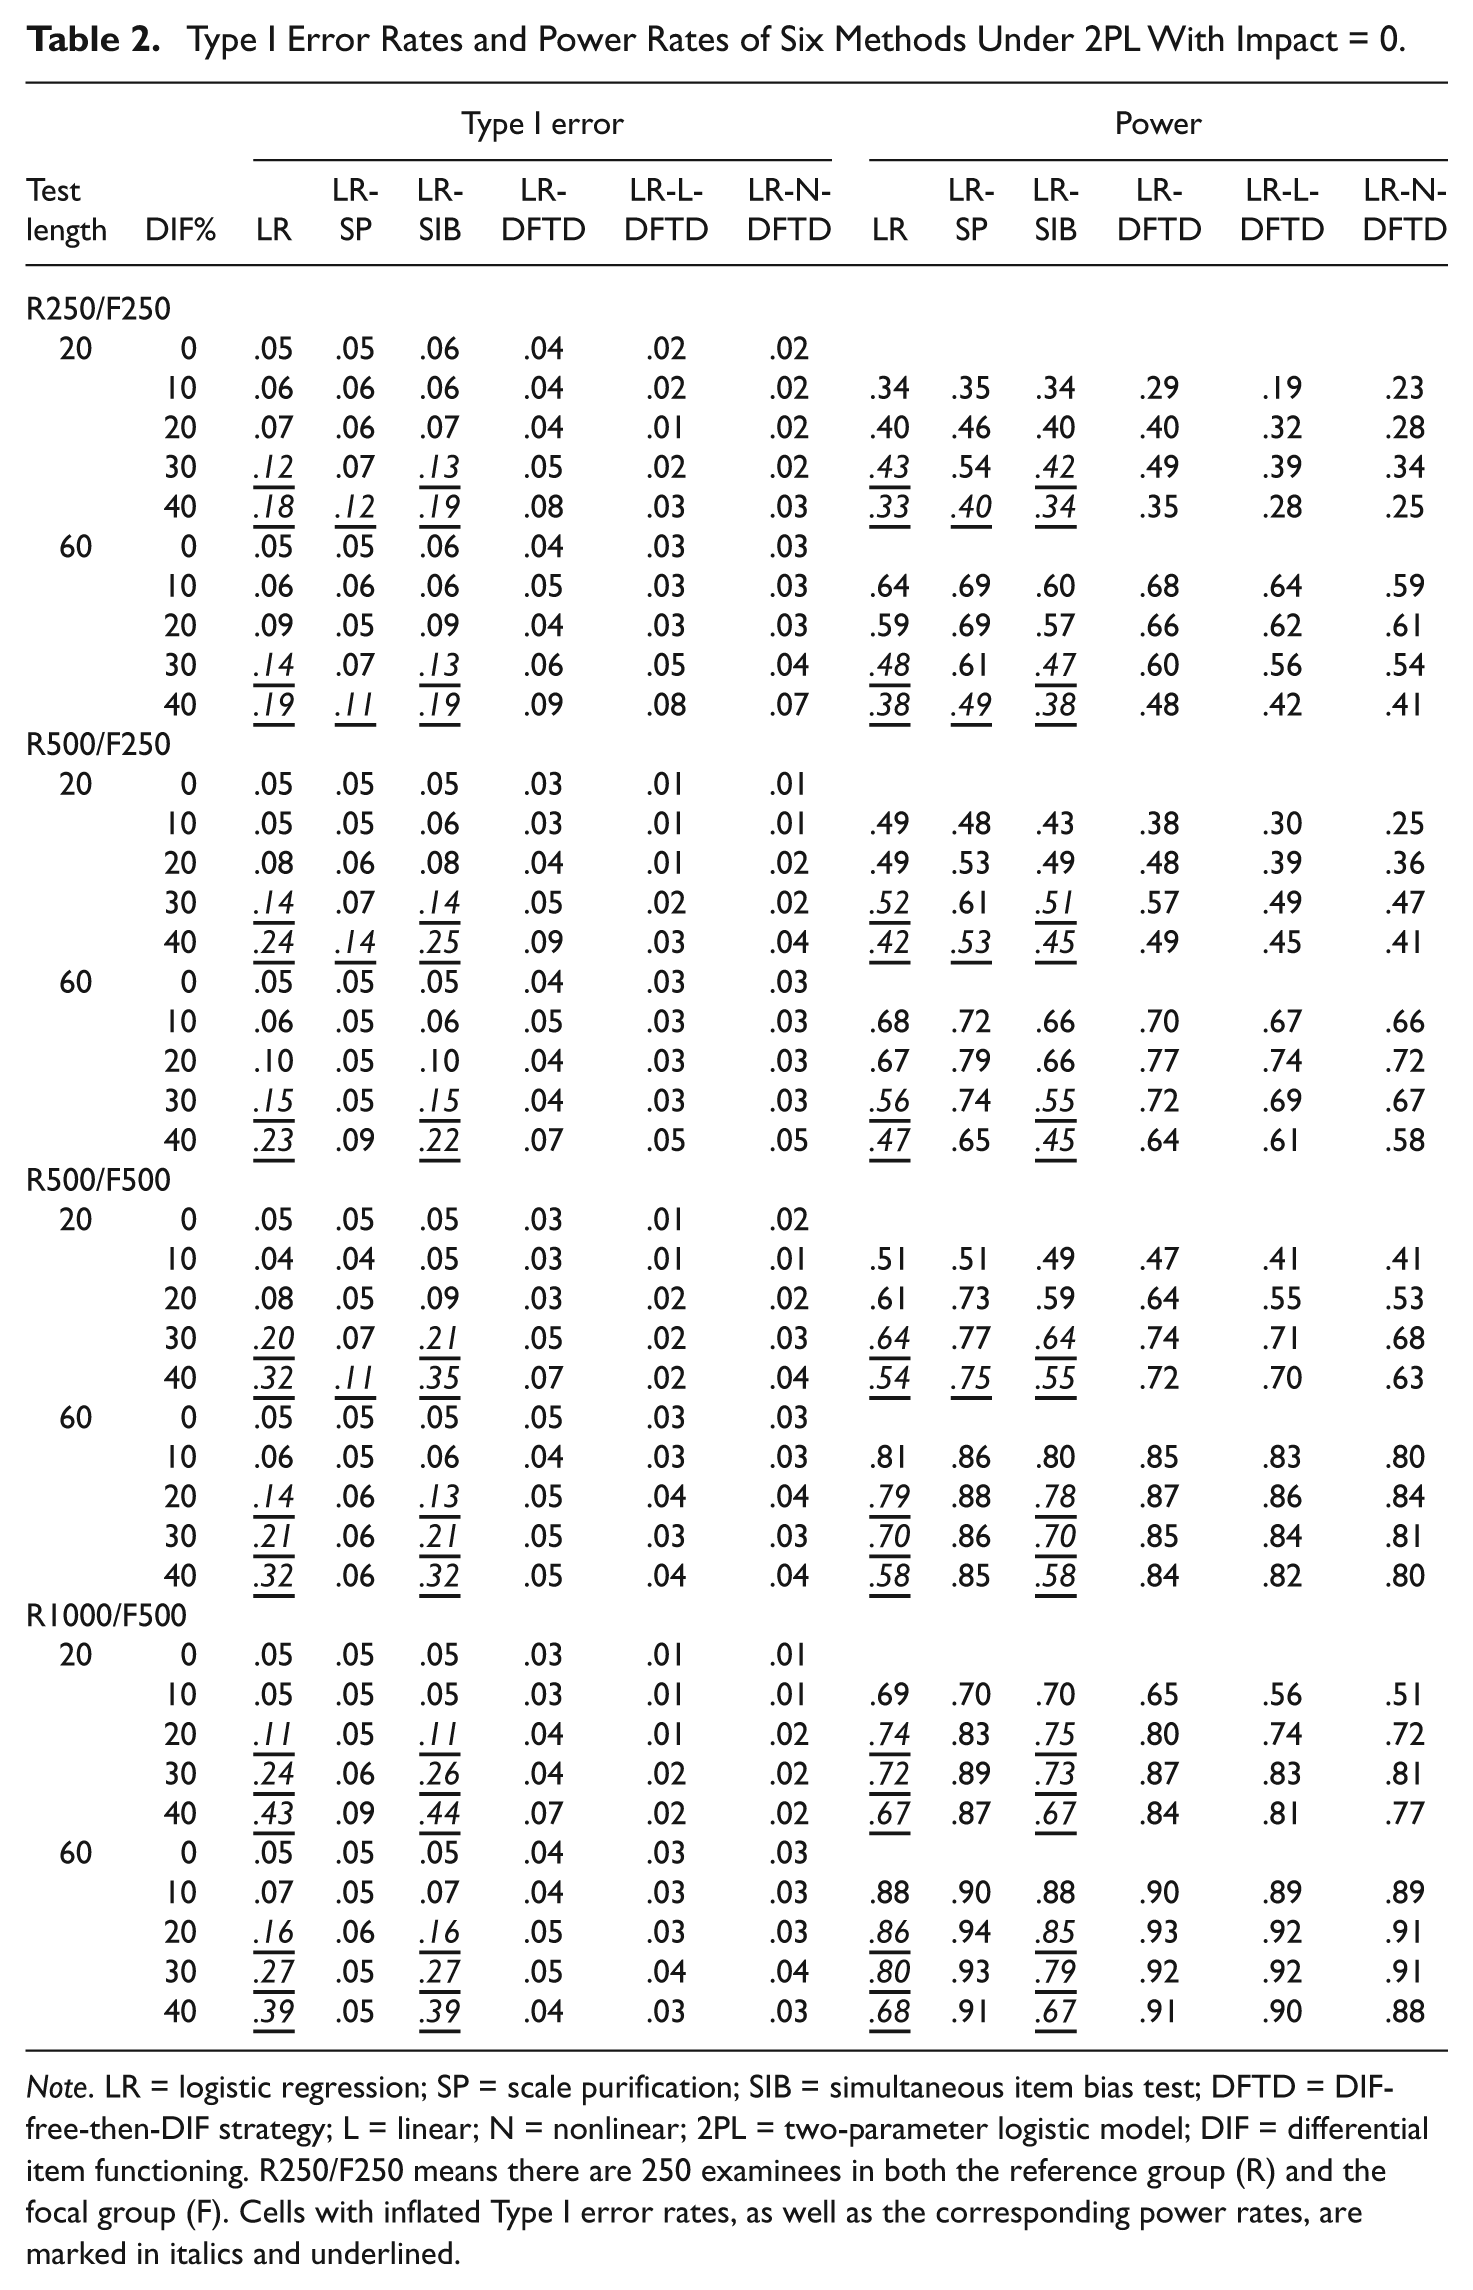
Note. LR = logistic regression; SP = scale purification; SIB = simultaneous item bias test; DFTD = DIF-free-then-DIF strategy; L = linear; N = nonlinear; 2PL = two-parameter logistic model; DIF = differential item functioning. R250/F250 means there are 250 examinees in both the reference group (R) and the focal group (F). Cells with inflated Type I error rates, as well as the corresponding power rates, are marked in italics and underlined.
For the results of the short test (20 items) in Table 2, the LR method and the LR-SIB method both tended to lose their control of Type I error rates when there was 30% or more DIF items in the test when each group contained at most 500 examinees. As the sample size increased to R1000/F500, both methods tended to yield inflated Type I error rates when the test contained 20% DIF items. For the long test (60 items), however, these two methods yielded inflated Type I error rates when the test contained 30% or more DIF items and the sample size was no more than R500/F250. Whereas, when the sample size increased to at least R500/F500, the Type I error rates for these two methods were inflated, as the test contained 20% or more DIF items. As for the LR-SP method, it can yield well-controlled Type I error rates for the long test (e.g., 60 items) or as long as the sample size is large (e.g., R1000/F500), even when there are 40% DIF items in the test. For the short test or small sample (R250/F250), LR-SP tended to lose control over Type I error rates when there were many DIF items (e.g., 40%) in the test. For the other three methods that were combined with the DFTD strategy, the Type I error rates were well controlled (ranged from 0.01 to 0.09) across conditions, even when there were as many as 40% DIF items in the test. However, the power rates were increased as the sample size or test length increased for all six methods.
Table 3 shows the Type I error rates and power rates of these six methods under the 2PL model with mean ability difference between groups equal to one standard deviation. Similar results were found for the LR, LR-SP, and LR-SIB methods except for that under the long test conditions, LR and LR-SIB yielded inflated Type I error rates when the test contained 40% DIF items and the sample size was no more than R500/F250. However, for large sample size conditions (e.g., more than R500/F500), these two methods yielded inflated Type I errors when the test contained 30% or more DIF items. In general, these three methods yielded less inflated Type I error rates here. The LR-SP also performed similarly as in Table 2, except that it yielded inflated Type I error rates under the combination of large sample size and short test conditions. For the three DFTD-type methods, the LR-DFTD failed to control Type I error rates when the test was short, especially for large sample size conditions. However, the LR-DFTD method generally yielded well-controlled Type I error rates across long test conditions. The LR-N-DFTD method could not control Type I error rates for short test conditions, and the inflation became more serious as the sample size increased. The LR-L-DFTD failed to control Type I error rates only when the test length was short and the sample size was quite large (R1000/F500). However, these three methods can yield well-controlled Type I error rates when the test is long (60 items). Again, all methods yielded higher power rates as the sample size increased.
Type I Error Rates and Power Rates of Six Methods Under 2PL With Impact = 1 SD
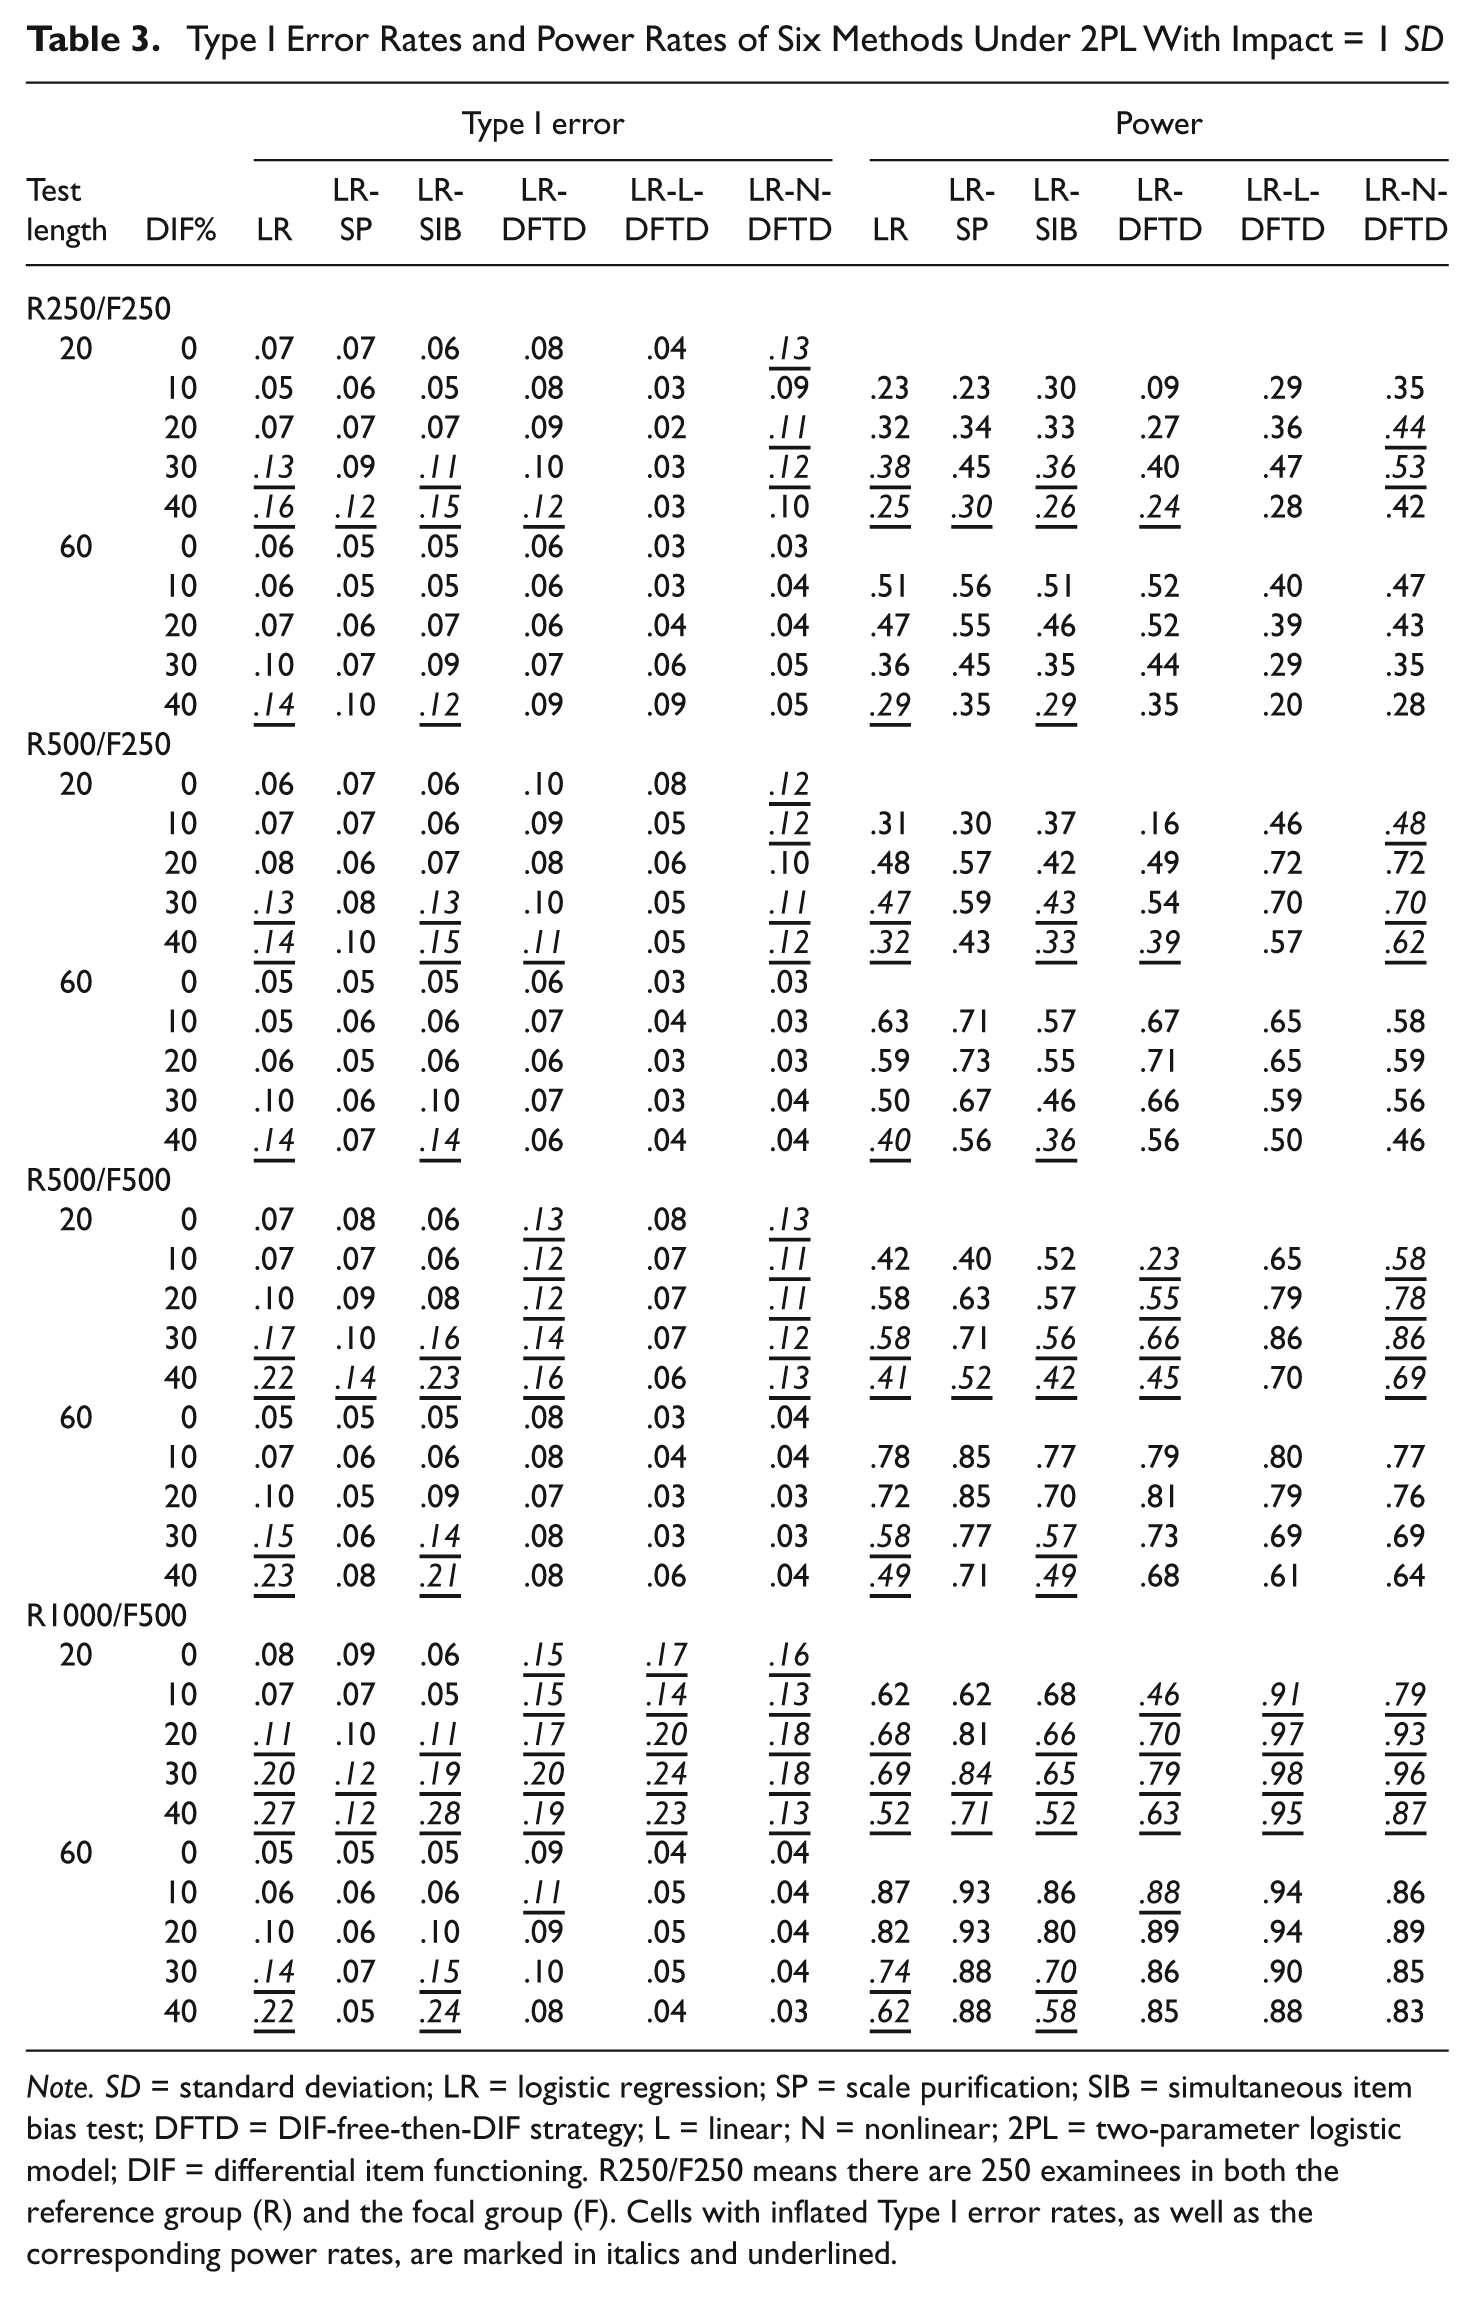
Note. SD = standard deviation; LR = logistic regression; SP = scale purification; SIB = simultaneous item bias test; DFTD = DIF-free-then-DIF strategy; L = linear; N = nonlinear; 2PL = two-parameter logistic model; DIF = differential item functioning. R250/F250 means there are 250 examinees in both the reference group (R) and the focal group (F). Cells with inflated Type I error rates, as well as the corresponding power rates, are marked in italics and underlined.
DIF Assessment Under 3PL
The Type I error rates and power rates of these six methods under the 3PL model with no impact existing between groups are listed in Table 4. Under the short test conditions, the LR and LR-SIB methods yielded inflated Type I error rates as the sample size and percentage of DIF items increased, especially when there were 30% or more DIF items in the test and the sample sizes were greater than or equal to R500/F250. The LR-SIB can generally maintain well-controlled Type I error rates as long as the percentage of DIF items is no greater than 30%. For the three DFTD-type LR methods, Type I error rates were well controlled (ranging from 0.01 to 0.09) across every condition. The power rates of all six methods were increased as the sample size and test length increased. The results under the 3PL model with the mean ability difference between groups equal to one standard deviation are listed in Table 5. For the short test conditions, the LR method failed to control Type I error rates when there were 20% or more DIF items in the test and the sample size no more than R500/F500. As the sample size increased to R1000/F500, the Type I error rates of the LR method became inflated, as there were 10% or more DIF items. The LR showed slightly better control of Type I errors under long test conditions than it did in short test conditions. Both the LR-SP and LR-SIB controlled the Type I error rates better than LR, and both methods performed better under long test conditions, such as that found in the LR method. For three DFTD-type methods, the LR-N-DFTD failed to control Type I errors under short test conditions, whereas well-controlled Type I error rates were found across the long test conditions. Both LR-DFTD and LR-L-DFTD yielded inflated Type I errors under short test conditions, especially as the sample size increased. In general, all methods tended to yield inflated Type I error rates for short test conditions, as the percentage of DIF items and the sample size increased, especially when there were 20% or more DIF items in the test and each group contained at least 500 examinees. As shown in Table 5, all methods yielded higher power rates as the sample size increased.
Type I Error Rates and Power Rates of Six Methods Under 3PL With Impact = 0.
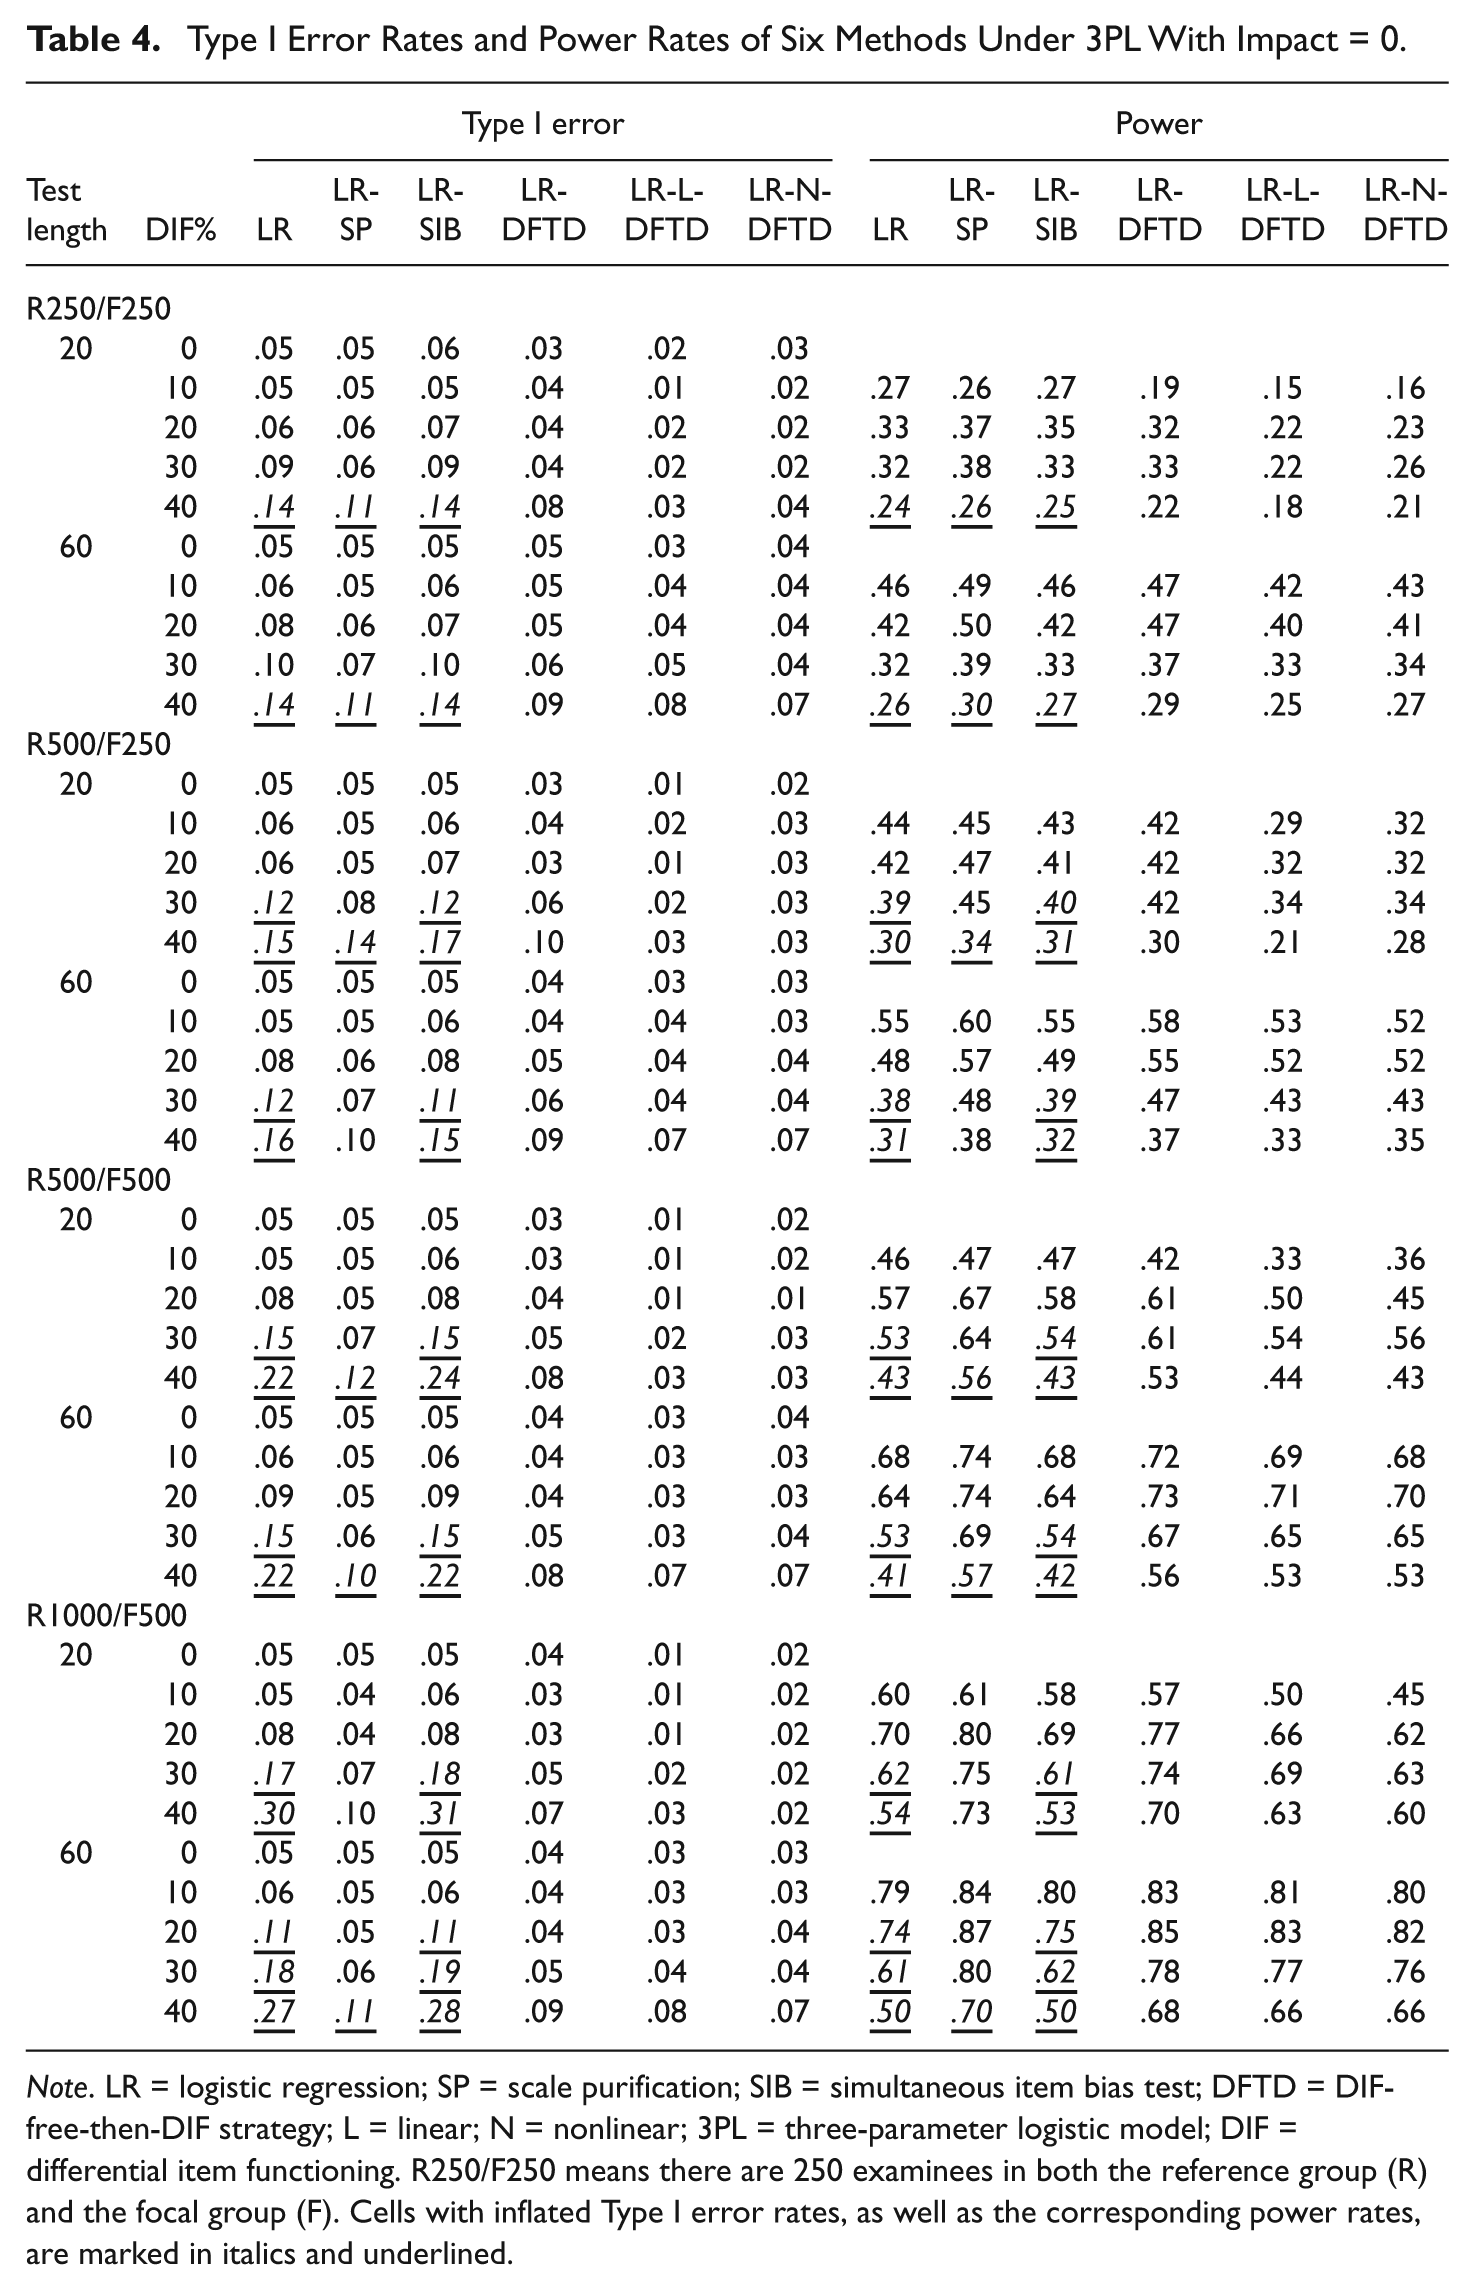
Note. LR = logistic regression; SP = scale purification; SIB = simultaneous item bias test; DFTD = DIF-free-then-DIF strategy; L = linear; N = nonlinear; 3PL = three-parameter logistic model; DIF = differential item functioning. R250/F250 means there are 250 examinees in both the reference group (R) and the focal group (F). Cells with inflated Type I error rates, as well as the corresponding power rates, are marked in italics and underlined.
Type I Error Rates and Power Rates of Six Methods Under 3PL With Impact = 1 SD.
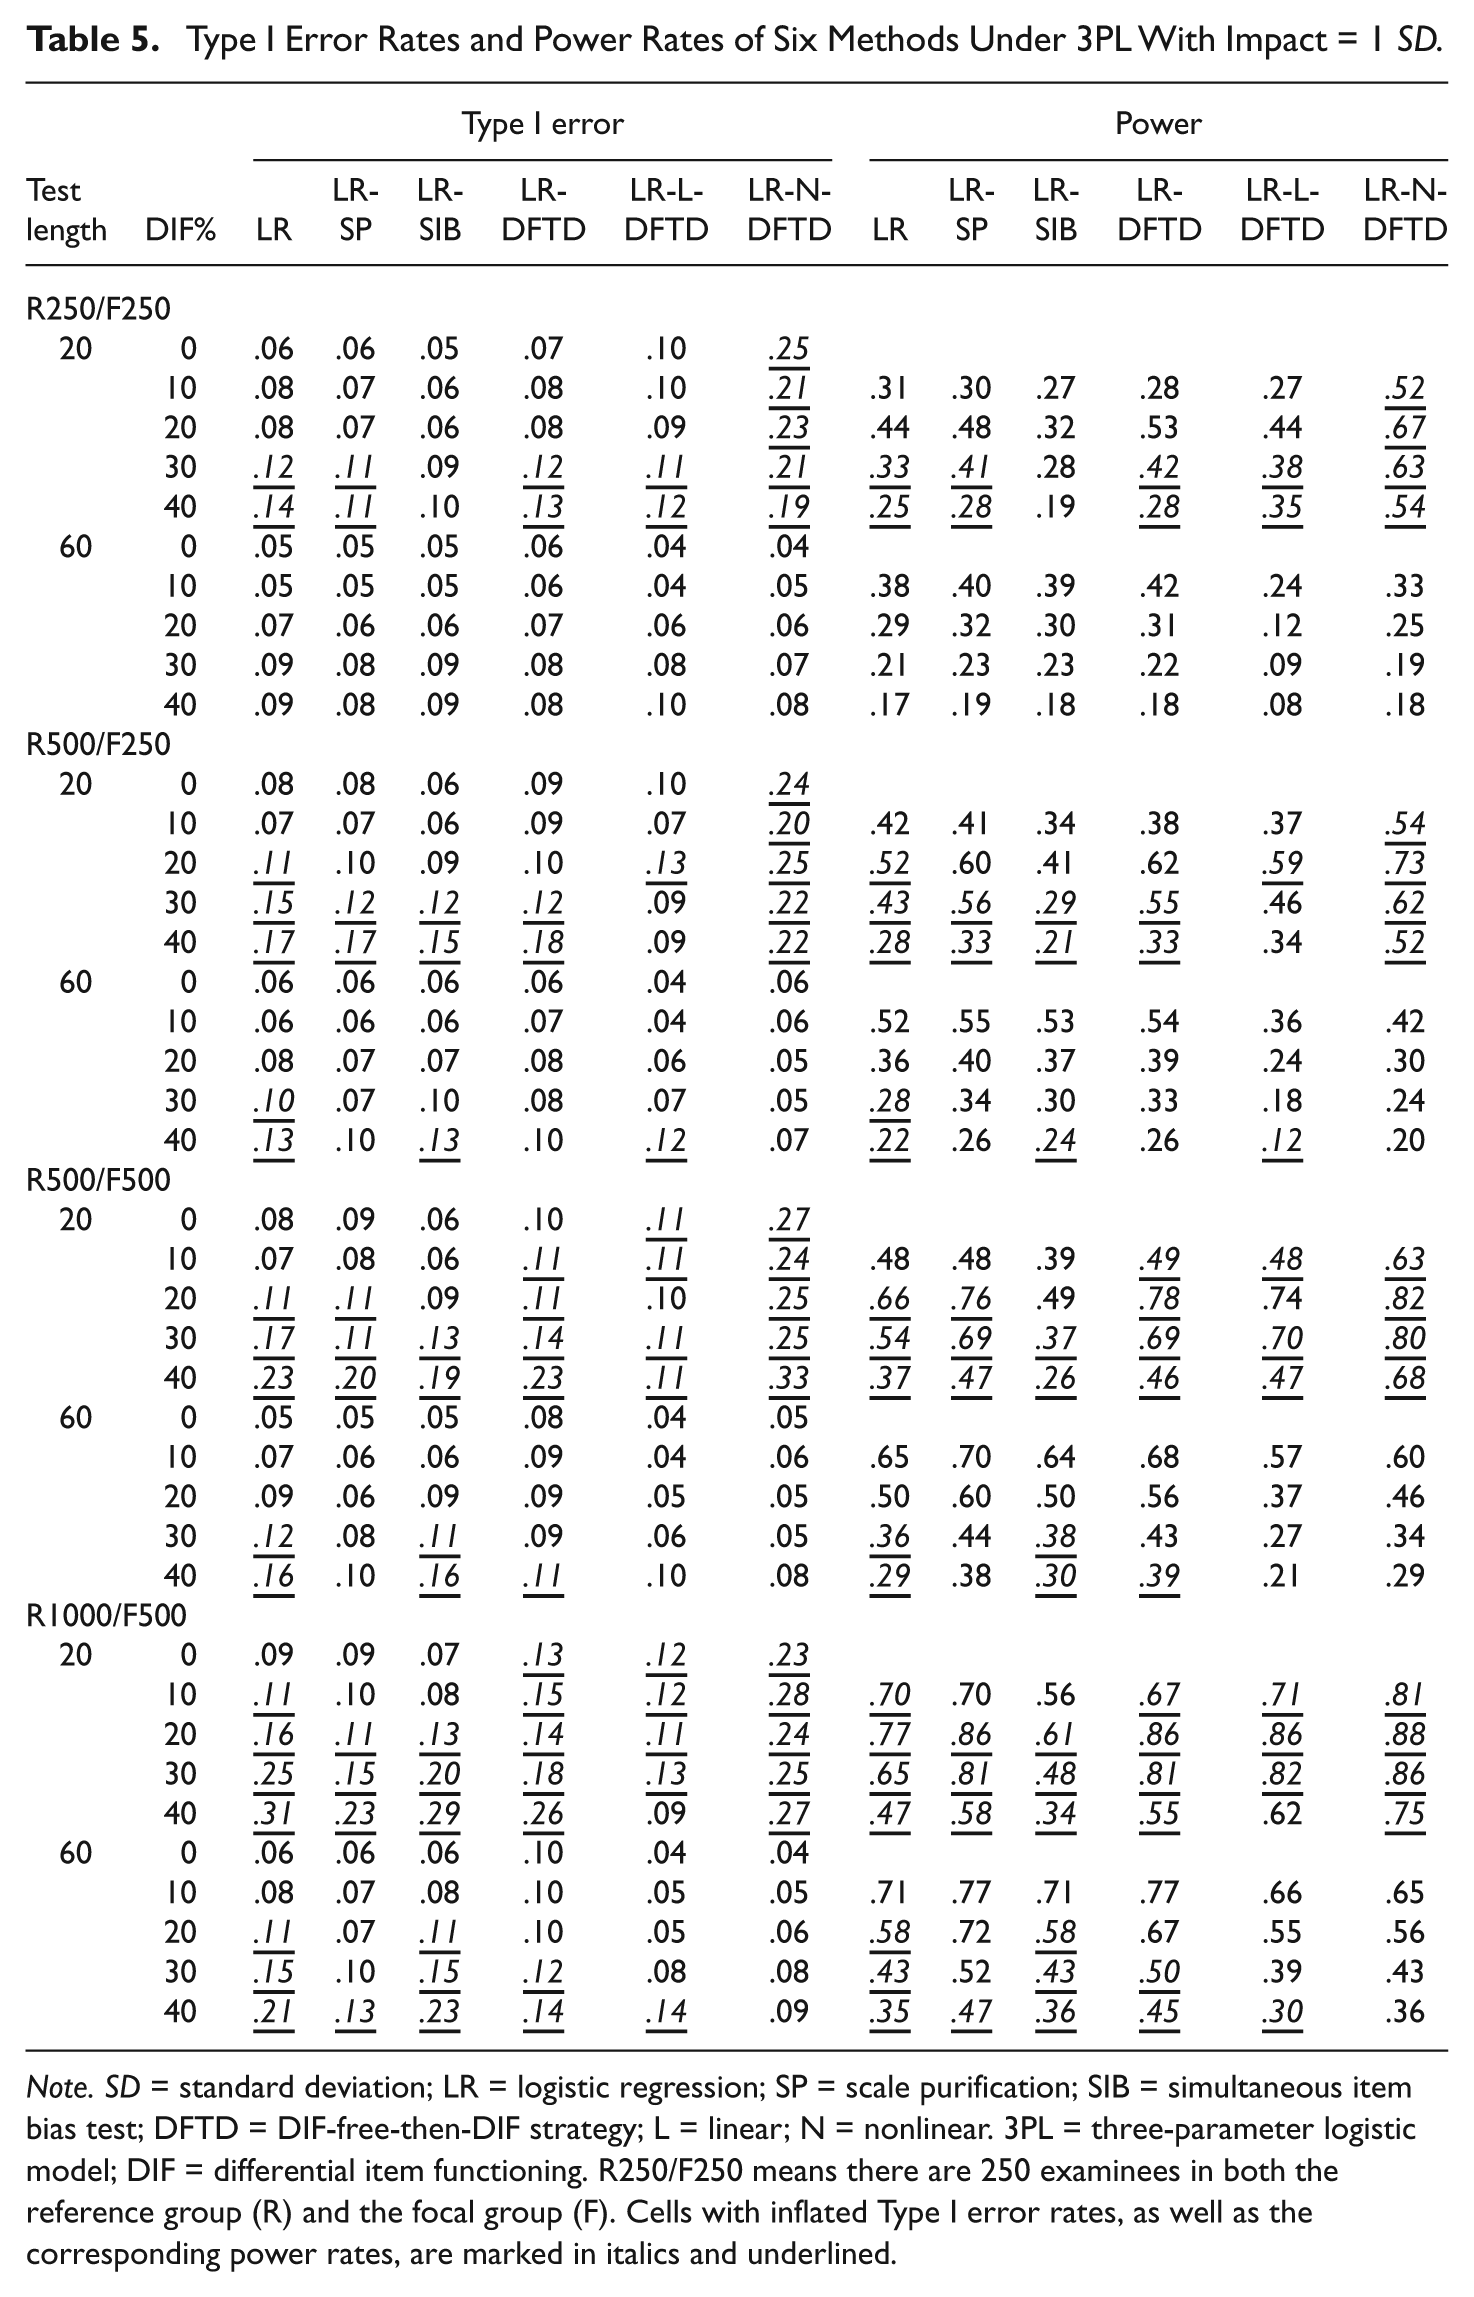
Note. SD = standard deviation; LR = logistic regression; SP = scale purification; SIB = simultaneous item bias test; DFTD = DIF-free-then-DIF strategy; L = linear; N = nonlinear. 3PL = three-parameter logistic model; DIF = differential item functioning. R250/F250 means there are 250 examinees in both the reference group (R) and the focal group (F). Cells with inflated Type I error rates, as well as the corresponding power rates, are marked in italics and underlined.
We further compared the results under 3PL with those under 2PL, and all six methods yielded better control of Type I error rates, but lower power rates, under the 3PL model when there was no impact existing between the groups. On the contrary, all six methods yielded slightly better control of Type I error rates and higher power rates when the mean ability difference between the groups was equal to one standard deviation under the 2PL model. Moreover, the LR-SP performed reasonably well, both in controlling Type I error rates and improving power rates when the test length was long (e.g., 60 items). The difference between the LR-SP and LR-DFSIB methods is mainly that the LR-SP lost its control of Type I error rates when she test contains many DIF items, whereas the LR-DFSIB method performed better in controlling Type I error rates.
According to the results of Simulation Study 1, the test length as well as the anchor length can largely affect the DIF assessment results. This is because the matching score of a long test might be a good approximation to match people even when impact exists (Roussos & Stout, 1996). Nevertheless, if the test (or anchor) length is short, the Type I error rates might be inflated because of the mismatch between ability and observed score. To apply the DFTD strategy to a DIF assessment method, the length of the anchor set is a critical issue that could lead to different DIF assessment results. We used 20% of the items of the test as an anchor, and the item scores were summed to be the matching variable in Simulation Study 1 and found that this variable did not work well for the short test conditions. Though a pure long anchor is in general more powerful than a short one, a longer anchor might increase the probability that DIF items will be included in the anchor set. However, a short anchor might yield a less reliable observed score and therefore caused inflated Type I error rates (DeMars, 2010). Consequently, the length of the anchor that can yield well-controlled Type I error rates and appropriate power rates in the DFTD-type LR method remained unclear for now, and thus further investigation was necessary. Therefore, we conducted another simulation study as follows.
Design of Simulation Study 2
The goal of Simulation Study 2 is to investigate the effect of anchor length in two DFTD-type LR methods: LR-L-DFTD and LR-N-DFTD. The design of this simulation study was similar to that of Simulation Study 1. Seven independent variables were manipulated here: (1) item response models—2PL and 3PL; (2) DIF assessment methods—LR-L-DFTD method and LR-N-DFTD method; (3) magnitude of impact—0 and 1; (4) percentage of DIF items in the test—0%, 10%, 20%, 30%, and 40%; (5) sample size—R250/F250, R500/F250, R500/F500, and R1000/F500; (6) test length—20 and 60 items; (7) anchor length—4, 6, 8, and 12 items. The 12-item anchor is not used in the 20-item condition because the percentage of DIF items is set up to 40% and it is not reasonable to set 60% of items as the anchor. The dependent variables were Type I error rates and power rates of DIF assessment. One hundred replications were made under each condition. The other settings were the same as those in Simulation Study 1. A conservative significance level of .10 was again used as the criterion here.
Results of Simulation Study 2
Because the results of sample sizes R250/F250, R500/F250, and R500/F500 were quite similar, only the results of sample size R250/F250 are listed here for simplicity.
2PL
Table 6 shows the Type I error and power rates of both the LR-L-DFTD and LR-N-DFTD methods under the 2PL model. The results of no-impact conditions are listed in the upper half, and both methods controlled Type I error rates (ranged from 0.01 to 0.07) well under all the conditions, regardless of the anchor length. The power rates of both methods were found generally increased as the test length, anchor length, and sample size increased. The results of the conditions under which the two groups were one standard deviation apart are listed in the lower half of Table 6. For the small sample size condition (R250/F250), the LR-L-DFTD generally controlled the Type I error rates well, no matter what the anchor length was. However, the LR-N-DFTD method with a four-item anchor yielded slightly inflated Type I error rates (from 0.11 to 0.15). As sample size increased to R1000/F500, both LR-L-DFTD and LR-N-DFTD with a four-item anchor failed to control Type I error rates. Furthermore, the LR-L-DFTD with a six-item anchor yielded slightly inflated Type I error rates (from 0.13 to 0.14) when the test length was 20 and the test contained 30% or more DIF items. To yield well-controlled Type I error rates when impact exists, eight- and six-item anchors were suggested for LR-L-DFTD and LR-N-DFTD, respectively, regardless of whether impact existed or not. The power rates also generally increased as the test length and sample size increased, with generally smaller power rates than those of the no-impact conditions.
Type I Error Rates and Power Rates of Methods With Different Anchor Length Under 2PL.

Note. 2PL = two-parameter logistic model; DIF = differential item functioning; LA = length of anchor; LR = logistic regression; DFTD = DIF-free-then-DIF strategy; L = linear; N = nonlinear. R250/F250 means there are 250 examinees in both the reference group (R) and the focal group (F). Cells with inflated Type I error rates, as well as the corresponding power rates, are marked in italics and underlined.
The Type I error rates and power rates of the LR-L-DFTD and LR-N-DFTD methods with various anchor lengths under the 3PL model are listed in Table 7. The results of the no-impact conditions are listed in the upper half of the table, and again both methods yielded well-controlled Type I error rates under all conditions (from 0.01 to 0.08). The results when the mean ability difference between groups was equal to one standard deviation are listed in the lower half of the table. The LR-L-DFTD method with a four-item anchor generally yielded inflated Type I error rates (from 0.11 to 0.19), and the inflation became more serious as the sample size increased. In general, the LR-L-DFTD with a six-item anchor yielded well-controlled Type I error rates, especially for small sample size conditions. The LR-N-DFTD with a six-item anchor performed similarly as the LR-L-DFTD with a four-item anchor under small sample size conditions (R250/F250), whereas the LR-N-DFTD with a four-item anchor failed to control Type I error rates (from .19 to .30). For large sample size, a six-item anchor is generally long enough for both methods. To yield well-controlled Type I error rates when impact exists, six- and eight-item anchors are suggested for LR-L-DFTD and LR-N-DFTD, respectively, no matter impact existed or not. This finding is slightly different from that under the 2PL conditions. The power rates were generally increased as the sample size increased, and, in general, they were smaller than those under no-impact conditions.
Type I Error Rates and Power Rates of Methods With Different Anchor Length Under 3PL.

Note. 3PL = three-parameter logistic model; DIF = differential item functioning; LA = length of anchor; LR = logistic regression; DFTD = DIF-free-then-DIF strategy; L = linear; N = nonlinear. R250/F250 means there are 250 examinees in both the reference group (R) and the focal group (F). Cells with inflated Type I error rates, as well as the corresponding power rates, are marked in italics and underlined.
Discussion and Conclusion
This study applied the DFTD strategy and SIBTEST correction procedure to the LR method simultaneously, and investigated their performance in DIF assessment by comparing with other variations of LR methods, including the standard LR method. Through Simulation Study 1, it was found that the Type I error rates of the LR method increased as the sample size increased and the test length decreased, as was found in the literature (DeMars, 2009; Rogers & Swaminathan, 1993). The LR-SP method outperformed the LR method in controlling Type I error rates, especially when the test contained about 20% DIF items. However, when the percentage of DIF items was increased up to 30% or 40%, the scale purification procedure also failed to control Type I error rates (French & Maller, 2007; Hidalgo-Montesinos & Gómez-Benito, 2003; Wang et al., 2009). The LR-SP generally performed better than the LR and LR-SIB methods in controlling Type I errors across conditions in Simulation Study 1. The LR-SIB method performed similarly to the LR method when no impact existed between groups, whereas it outperformed the LR method when impact existed under the 3PL model with small sample size conditions. However, when there were many DIF items in the test, and regardless of whether or not impact existed, solely applying the SIBTEST correction procedure alone does not yield well-controlled Type I error rates for the LR method. All three DFTD-type LR methods were found to yield well-controlled Type I error rates under all the no-impact conditions. However, when mean ability difference between groups was equal to one standard deviation, these methods maintained their performance in controlling Type I error rates only when the test contained many items (e.g., 60 items). Moreover, the Type I error inflation under the short test conditions became serious as the sample size increased. For the LR-DFTD method, the Type I error rates under the short test were inflated as sample size increased, when impact existed between groups, which means that the DFTD strategy cannot perform well under the conditions. Furthermore, both the LR-L-DFTD and LR-N-DFTD methods failed to control Type I error rates when the matching variable contained only four anchor items, especially when the sample size was large (e.g., R1000/F500 in this study). However, according to the results of Table 1, the accuracies of identifying four DIF-free items as the anchor under the R1000/F500 condition were quite high (from .78 to 1.00, but mostly between .95 and 1.00). Therefore, the reason why these two methods failed to control Type I error rates might be that the observed score of such a short anchor tends to be less reliable and, therefore, yields inflated Type I error rates (DeMars, 2010). Consequently, a four-item anchor, even when all four items are DIF-free, is not good enough to form a reliable matching variable for the LR method. Therefore, the length of anchor for LR-L-DFTD and LR-N-DFTD methods was further investigated in Simulation Study 2.
Because a set of items should be identified as anchor when applying DFTD strategy to LR method, four levels of length of anchor (i.e., 4-, 6-, 8-, and 12-item anchors) were manipulated in Simulation Study 2. Because the test was manipulated as containing as high as 40% DIF items in the simulation study, the 12-item anchor (i.e., 60%) in the 20-item test condition was not implemented in this study. When the data followed the 2PL model and the two DFTD-type LR methods (LR-L-DFTD and LR-N-DFTD) were used to assess DIF with small sample size, at least a four- and a six-item anchor should be preidentified for LR-L-DFTD and LR-N-DFTD, respectively, to yield well-controlled Type I error rates under all conditions. As the sample size increased to R1000/F500, the four- and six-item rules still worked well for both the LR-L-DFTD and LR-N-DFTD methods under the no-impact conditions. However, if impact existed between groups, the six-item anchor still worked well with the LR-N-DFTD method, whereas the length of anchor should be increased to eight items in the LR-L-DFTD method to keep the Type I error well-controlled. However, when the data followed the 3PL model and sample size was small, a six- and an eight-item anchor should be used for the LR-L-DFTD and LR-N-DFTD, respectively, under all conditions. As the sample size increased to R1000/F500, a six-item anchor is long enough for both methods to yield well-controlled Type I error rates when assessing DIF. In sum, when both the SIBTEST correction procedure and the DFTD strategy are applied to the LR method, the length of anchor should be generally set at eight items, especially for a large sample size and when there is no prior knowledge about the property of the response data or the amount of impact between groups. However, as long as sample sizes for both groups are less than 500, the LR-L-DFTD with a six-item anchor is an alternative method that saves much time on computer calibration.
According to the results in Table 1, the accuracies of identifying DIF-free items as anchor are lower under 3PL than under 2PL, which might be because DIF items with low discrimination and high difficulty parameters tend to be deemed as DIF-free under 3PL (Bolt & Gierl, 2006). For example, under the condition that the test contains 60 items and 40% DIF items, Items 1 to 24 are DIF items by design. Within these DIF items, items either with high difficulty (Items 13, 14, 15, 18, and 20) or low discrimination parameters (Items 1, 2, 7, 15, and 19) are usually identified as DIF-free items and are taken as anchors, especially under the 3PL model. Consequently, the accuracies of identifying DIF-free items are lower under the 3PL model, and this factor should be taken into consideration when identifying anchor items in reality. Moreover, when DIF items are mistakenly identified as anchors, the items that are falsely identified as DIF were mostly deemed as favoring to the focal group. That is, the Type I error rates of the LR-DFSIB method resulted from falsely deeming the DIF-free items to favor the focal group.
LR-DFSIB methods, such as the LR method that combines both the SIBTEST correction procedure and the DFTD strategy simultaneously are not easy to use in regular DIF analysis. To enhance the feasibility of this method, a stand-alone program is now developed by the authors and is available on request from the first author. In addition, among the six methods being compared in Simulation Study 1, the LR-SP performed reasonably well when the test contained 60 items and the percentage of DIF items was less than 40%. Under the condition that the researchers or practitioners believe a test contains no more than 30% DIF items, the LR-SP method could be a reasonable choice.
In further comparing the LR-L-DFTD and LR-N-DFTD methods, the nonlinear correction procedure with at least a six-item anchor was found to be effective in controlling Type I error rates for the LR method with the large sample (R1000/F500) conditions, whereas the linear correction with a six-item anchor performed better under the short test (20 items) and small sample conditions. The finding is consistent with DeMars (2009), that a nonlinear correction procedure is effective when the sample size is 1,000 per group, whereas linear correction procedure is a better choice for small sample sizes. Moreover, if the researcher believes that the data follow the 2PL model or that there is no guessing in the test, then the linear regression correction is appropriate. However, if the data follow the 3PL model, then the nonlinear regression correction is more appropriate than the linear regression.
Readers who are interested in the methods compared in this study can further compare their performances in assessing nonuniform DIF. In the future, the DFTD strategy and the SIBTEST correction procedures could be further applied to the Mantel–Haenszel method. The procedural details, such as the anchor item selection method and length of anchor, should be further investigated.
Footnotes
Declaration of Conflicting Interests
The author(s) declared no potential conflicts of interest with respect to the research, authorship, and/or publication of this article.
Funding
The author(s) disclosed receipt of the following financial support for the research, authorship, and/or publication of this article: Ching-Lin Shih was supported by a grant from the National Science Council of Taiwan (NSC 101-2410-H-110-033). Wen-Chung Wang was supported by the General Research Fund, Hong Kong Research Grants Council (No.84410).