
Abstract
Recent research has shown how the statistical bias in Rasch model difficulty estimates induced by guessing in multiple-choice items can be eliminated. Using vertical scaling of a high-profile national reading test, it is shown that the dominant effect of removing such bias is a nonlinear change in the unit of scale across the continuum. The consequence is that the proficiencies of the more proficient students are increased relative to those of the less proficient. Not controlling the guessing bias underestimates the progress of students across 7 years of schooling with important educational implications.
Introduction
Large-scale assessment programs, including the OECD Program for International Student Assessment (PISA) and the Australian National Assessment in Literacy and Numeracy Program (NAPLAN), are dominated by multiple-choice (MC) items that are likely to induce guessing. Despite item difficulty estimates being statistically biased by guessing in the dichotomous Rasch model (RM), the model is used in the above and other assessment programs to analyze and report student proficiencies. The range of reasons why the RM is used with MC assessments is not debated in this article. However, three related features of the model relevant to this article are noted: first, unlike the two-parameter and three-parameter logistic models (3PL; Birnbaum, 1968), the RM has no discrimination or guessing parameter for the items; second, the total scores on the items and for the students are the sufficient statistics for the item difficulty and student proficiency parameters, respectively; third, the item difficulty estimates can be estimated independently of the student proficiencies, and vice versa (Rasch, 1960; Wright, 1997).
If the RM is to be used with large-scale assessment programs that use MC items, then it seems desirable to control the effect of guessing on its estimates. Andrich, Marais, and Humphry (2012) formalized Waller’s (1989) procedure for removing the effects of guessing in the RM and demonstrated how the statistical bias in difficulty estimates can be quantified, tested for statistical significance, and, most important, removed. This article reports the application of that formalization to a high-profile national set of NAPLAN data, which monitors progress of students across the years. The main features of the application are, first, that the unit of scale of the item difficulty estimates is changed nonlinearly across the continuum making the more difficult items even more difficult, and second, that the proficiency estimates of successive year groups, which range from Years 3 to 9 in schooling, show a greater trajectory of growth than when Waller’s procedure for removing guessing is not applied.
In both Waller’s procedure, which removes the effects of guessing in the RM estimates, and in the 3PL model (Birnbaum, 1968), which models guessing with an item parameter, the same major hypothesis is implied. This is that random guessing is a matter of degree, increasing as a function of the difference between the difficulty of the item and the proficiency of a student—that is, the more difficult the item relative to the proficiency of a student, the more likely the student will guess. Figure 1 shows the item characteristic curves (ICCs) for the 3PL, for a modified 3PL, which implies less guessing for more proficient students (Andrich et al., 2012), and for the RM, which implies no guessing.
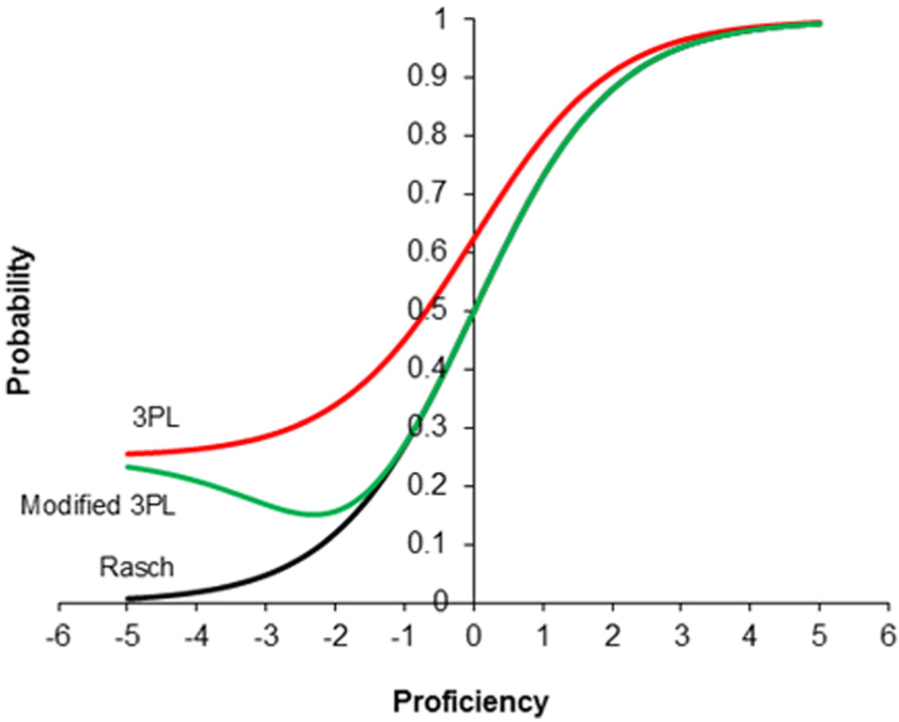
ICC for the 3PL, a modified 3PL, and the dichotomous Rasch model.
For completeness, we note the expressions for the models depicted in Figure 1. Let P{Xni = x}, x = 0 (incorrect), 1 (correct), be the respective probabilities of the two possible responses by student n to a dichotomously scored item i. Then the dichotomous RM is given by

where β n is the proficiency of student n and δ i is the difficulty of item i.
The 3PL model is given by

where γ i is the guessing parameter or lower asymptote of the ICC

and where α i is the discrimination parameter of item i. Equation (3) is known as the two-parameter logistic (2PL) model. Note the dichotomous RM is algebraically of the form of the 2PL model in which the discrimination parameter for all items is the same and is effectively set arbitrarily to be 1.0. In the 2PL, some arbitrary constraint is required on the discrimination parameters. Clearly, the 2PL and the 3PL are elaborations of the RM. However, these elaborations preclude the use of sufficient statistics in estimation.
In Figure 1, the 3PL is of an item that has the same discrimination as the ICC for the RM, α i = 1, with the asymptote for a totally random guess γ i = 0.25, which assumes four alternatives. It is evident that in the 3PL, the effect of guessing is very noticeable through a substantial part of the continuum, including where the probability of success according the RM is of the order of 0.75.
From a study of their real example, Andrich et al. (2012) concluded that the amount of random guessing was not as extensive as modelled by the 3PL, and for the purpose of their simulation study, they modified the 3PL. To obtain the modified 3PL of Figure 1 in which guessing is not prevalent beyond a probability of 0.2 of a successful response, first rearrange Equation (2) to give

It is evident from Equation (4) that the impact of guessing is a product of the asymptotic value

which has varying impact of guessing according to the value of y. In Figure 1, for the modified 3PL,
As indicated above, it is evident that in the ICCs of the 3PL, and the modified 3PL, the asymptote for the effect of guessing is reached at the least proficient end of the continuum, and this effect decreases continuously with increase in proficiency—the effect is virtually zero for a student whose proficiency is sufficiently high that the probability of a correct response is close to 1.0. The above hypothesis implies, for example, that in general a very proficient student will be able to eliminate all distractors and will exhibit no guessing; a reasonably proficient student may be able to eliminate one or two distractors and guess among the remainder; and a very poorly proficient student may guess among all responses. The ICC curve for the modified 3PL shows how the probability of success drops below chance level when students who are not very proficient (proficiencies between −2 and −3 logits) are very attracted to one or more plausible distractors. Those students who are even less proficient (proficiencies less than −3 logits) are not attracted even to these distractors and the probability of success approaches the chance level for those students. Thus, different students are taken to exhibit different degrees of random guessing ranging from no guessing to nothing but guessing.
In a data set illustrating the formalization of Waller’s procedure, Andrich et al. (2012) confirmed the hypothesis that guessing is a matter of degree with students more likely to guess as the items become more difficult for them. The hypothesis was confirmed by showing that when responses likely to have been guessed are removed from the data matrix, the relatively more difficult items become even more difficult. In addition, using a simulation study which included guessing according to the modified 3PL, they showed that the statistical bias in the difficulty estimates induced by guessing can be removed. Andrich et al. (2012) did not study the consequences of removing the effects of guessing on student proficiency estimates. However, in a further study using the same data sets, Andrich and Marais (2014) showed that when bias due to guessing is removed from difficulty estimates, the relative proficiencies of the more proficient students, who are least likely to guess, benefit by a greater amount than the less proficient who are most likely to guess. This initially counterintuitive result, which was explained in the aforementioned articles and is considered again below, is again evident in the present article.
Using a linked design in just two adjacent year groups from the NAPLAN–2013 reading data, Marais (2015) showed that the effect of removing guessing using Waller’s procedure is again to increase the relative proficiency of the more proficient students, and in this case in both groups. The present article uses the same reading data applied to a design in which the performances of four year groups, Years, 3, 5, 7, and 9, are linked and placed on the same scale. The article emphasizes the impact of removing the effects of guessing on the fit of the data to the model and the consequences for the study of growth across the wide range of 7 years of schooling. It shows that if the effect of guessing is removed using Waller’s procedure, then (a) the fit of the data to the RM improves substantially, (b) the statistical bias in the difficulty estimates is largely removed, (c) the increase in difficulty estimates of more difficult items compounds across year groups, and (d) the rate of growth from Years 3 to 9 is substantially greater than when the effect of guessing is not removed. Because it can remove bias in the estimates, results that apply Waller’s procedure are considered more correct. Thus, it is concluded that not applying Waller’s procedure underestimates the progress of students across year groups with important educational implications.
It is acknowledged that Waller’s approach for controlling the effects of guessing using the RM is not the approach of a standard statistical paradigm. In that approach, the task is to find a model that accounts for the data (Andrich, 2004). Therefore, if difficulty estimates are biased because of guessing in the RM, an item parameter likely to characterize guessing would be added. For an analogous reason a discrimination parameter is added, giving a model such as the 3PL. From a measurement paradigm different from the standard statistical one, in Waller’s approach, the RM with the properties of equal item discrimination, sufficiency, and invariance of difficulty and proficiency estimates with respect to each other, is retained, and guessing is controlled through specific handling of the data.
Formalizing Waller’s Procedure
The procedure for removing random guessing in the difficulty and proficiency estimates of the RM involves four sequential steps. These steps follow from the hypothesis that guessing on MC items is a function of the difference between proficiency and difficulty at the student-item level; they are justified in detail in Andrich et al. (2012) and only a summary is presented here. The steps can be executed interactively in the software program RUMM2030 (Andrich, Sheridan, & Luo, 2013), which was used for the analyses reported in this article. RUMM2030 uses a pairwise conditional method of estimation in which all student parameters are eliminated giving consistent item difficulty estimates, that is, as the number of students increases, so the difficulty estimates converge to their real values (Zwinderman, 1995). Then, given these item parameter estimates, the student proficiency estimates are obtained using direct weighted likelihood estimates (Warm, 1989). These estimates are somewhat less biased at the extremes than the maximum likelihood estimates which are stretched (Bock & Jones, 1968).
The Initial Analysis
First, because the relevant property for controlling guessing with MC items is the difference between student proficiency and item difficulty, an analysis of the data set is carried out using the dichotomous RM and proficiency and difficulty estimates obtained. This is termed the initial analysis, and the data set is termed the initial data.
To the degree that there is guessing in the responses, items will fit the RM less well than if the data do not have guessing. Nevertheless, from the hypothesis that guessing is a function of proficiency relative to difficulty, it can be predicted that items that are more difficult for students will induce more guessing and therefore that the number of correct responses to difficult items will be greater than if there were no guessing. However, because the total number correct is the sufficient statistic for the item’s difficulty, the more difficult an item and the greater the degree of guessing it induces, the less difficult its estimate compared with its estimates if no guessing were present. This difference in difficulty estimates is the statistical bias, and it is the basis for testing the hypothesis that guessing is a function of proficiency relative to difficulty.
Analogously, because the number correct is the sufficient statistic for a student’s proficiency, the greater the number correct, the greater the proficiency estimate; therefore, students who guess will have a greater proficiency estimate than if they did not guess. However, as shown in Andrich et al. (2012), already noted above, and central to the demonstration below, because of the effect of guessing on the difficulty estimates defining the scale, guessing has an even greater impact on the proficiency estimates of the more proficient students (who guess less than the least proficient).
The Tailored Analysis
Second, given the proficiency and difficulty estimates from the initial analysis, the probability of each student answering each item correctly is calculated. Then, if the item is sufficiently difficult that the student’s probability is less than chance of answering the item correctly, the response is converted to missing data—it is as if the student were not administered the item. The response is converted to missing data whether the response was correct or incorrect. Because items that are considered very difficult for a student are not administered in adaptive or tailored testing, by analogy, this analysis is termed the tailored analysis. The data, which are a subset of the initial data, are referred to as tailored data.
The choice of probability for a cutoff for eliminating a response is based on a chance probability of a correct response and therefore is a function of the number of alternatives. Thus, for items with four alternatives, which is the case for all MC items in the example in this article, this probability is 0.25. Therefore, based on the estimates of the proficiency and difficulty, a probability of a correct response less than 0.25 would be deemed likely to have been guessed. However, the initial analysis is of the initial data with guessing, and as indicated above, difficulty estimates are less difficult and proficiency estimates are greater, than they would be if the estimates were not biased by guessing. Therefore, estimates from the initial analysis will imply a greater probability of success of a less proficient student to a difficult item than would be the case without guessing. Accordingly, a cutoff value a little greater than 0.25 is justified. The value specified was 0.30. It is evident from Figure 1 that for the modified 3PL, in which guessing is somewhat less prevalent by the more proficient than in the 3PL, there is no guessing effect above the probability of 0.30. Thus, the cutoff of 0.30 should be adequate to remove the responses with guessing. That is, for the item in Figure 1 with difficulty δ i = 0.00 students with a proficiency estimates of less than −1.0 would have their responses converted to be missing.
Operationally, to the degree that there is random guessing in the responses as a function of student proficiency relative to item difficulty, it is predicted that to that degree the more difficult items from the tailored analysis will have estimates that are increasingly even more difficult and that the data will fit the RM better than in the initial analysis. This evidence is provided later in the article.
It is stressed that there is no way of knowing which specific response has any specific degree of guessing. The predictions are statistical across the data set and follow from the hypothesis that the more difficult an item is for a student, the greater the degree of guessing. The assessment of this hypothesis is also statistical, involving the study of the trend of estimates as a function of their difficulties in different analyses.
The Origin-Equated Analysis
Third, in a RM analysis, an arbitrary constraint is required on the item estimates and is usually
Because of the arbitrary constraint, each analysis of a data set has its own arbitrary origin. To facilitate comparisons of the scales between analyses in which the effect of guessing has and has not been removed, it is instructive to set the same arbitrary origin for the two analyses. The most instructive origin is the mean of a small subset of easy items in the tailored analysis. The rationale for this choice is that because the responses to the easiest items will have little if any guessing, the relative difficulties of these easy items will be stable between the tailored and non-tailored analyses. The initial data are then reanalyzed with this new origin which is the same as that in the tailored analysis. The analysis is referred to as the origin-equated analysis.
It is also stressed that the number of easy items that appear to have little or no guessing is a property of the data. In the example in Andrich et al. (2012), the mean of the six easiest items was used for the origin; in the present example, the mean of the four easiest items in the Year 3 cohort is used. However, because the origin is arbitrary, the relevant comparisons would not be affected if, for example, in these two examples the mean of the five easiest items was made the origin.
The All-Anchored Analysis
It is justified readily that the tailored analysis, which removes the effects of guessing in the item difficulty estimates, is the ideal analysis for obtaining student population estimates. However, because it involves removing responses, it is not the ideal analysis for reporting individual proficiencies. The main reason it is not ideal for this purpose is that there is never evidence as to which student guessed which item correctly and how much guessing was involved. Thus, it is possible that a less proficient student did not guess on a difficult item and that a more proficient student did guess on the same item. A second, related reason is that policy makers and students are unlikely to be convinced that removing a response that happens to be correct is justified by applying any general model to the responses. Therefore, a fourth analysis is conducted using the initial data that has all the responses, but with all difficulty estimates anchored or fixed to their estimates in the tailored analysis. This analysis is called the all-anchored analysis.
Because the responses include guessing, proficiency estimates from the all-anchored analysis will be greater than from the tailored analysis. However, as shown in the Results section of the article, the effect that can be quantified is small. By analogy to this example, suppose that the task was to estimate the degree of obesity in a student population. It would be necessary to measure the heights and weights of a sample of students (Dawes, 2014) with instruments known not to give biased measurements. However, for health and related reasons such as privacy, there may be a policy that students’ heights must be measured with their usual shoes on, and that their weight must be measured with their usual clothes on. In that case there will be a small inflation in the heights and weights which could be quantified and accounted for at the group level.
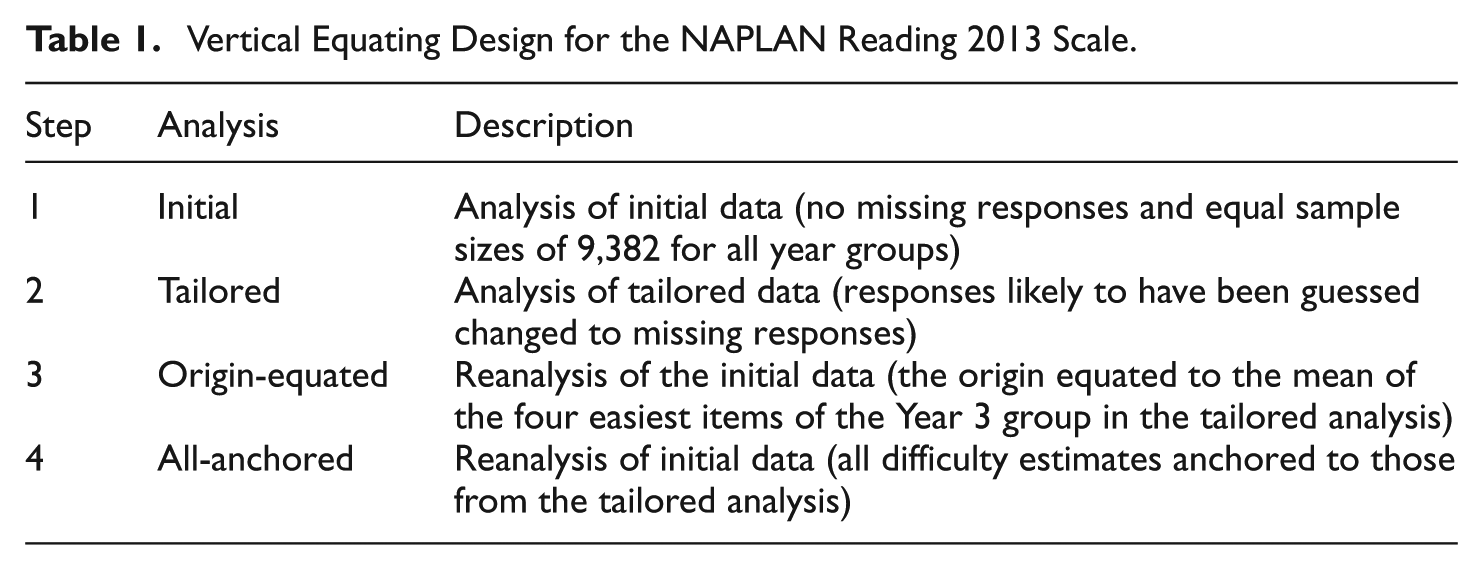
The three analyses, origin equated (initial data), tailored (tailored data), and all-anchored (initial data), have the same origin and their estimates can be compared for other differences. Table 1 summarizes the four analyses. In summary, evidence of an increasing difference in difficulty estimates (as a function of difficulty) between the tailored and origin-equated estimates confirms the hypothesis that, in general, guessing is a matter of degree and is a function of the difficulty of an item relative to the proficiency of the student answering it. The greater the difference between the two estimates, the greater the impact of guessing in biasing the estimates in the initial analysis. It is stressed again that because the effect of guessing hypothesized above is a function of the alignment of the proficiencies of students relative to the difficulties of items, different data sets will exhibit different degrees of guessing. This article shows that the effect is noticeable in the analysis of an important, national data set assessing students’ progress.
Vertical Equating Design for the NAPLAN Reading 2013 Scale.
The Data and Design of the Analyses
Persons
As indicated above, the data are from Years 3, 5, 7, and 9 Reading Assessments of the 2013 NAPLAN program. The data are specifically from the sample used in the NAPLAN analysis to calibrate the item difficulties using the RM. The data were of different year groups of students assessed in one calendar year, 2013. The sample of students was chosen to be representative of the Australian school population; for example, it consisted of approximately equal numbers of boys and girls. From this calibration sample of 69,567 students, only the responses of those students who completed all items that they were administered were considered (67,168). This ensured that there were no missed responses at the end of a profile that would need to be scored differently at the item and person estimation stages. In the NAPLAN analyses, because it is assumed that students had not engaged with the items, strings of missed responses at the end of a profile are treated as missing data in the item calibration stage; on the other hand, in the person estimation stage, these responses are scored as incorrect.
In addition, because the numbers of students in the different year groups were very different, an equal-sized random sample of students from each year group was used, with the number chosen to be the size of the minimum group. This ensured that the effect on the precision of the estimates of the link items was not dominated by the group that had substantially larger numbers of students. Thus, possible effects of missing responses and unbalanced samples were controlled in the analyses. This set of data, composed of equal, random samples with no missing responses in each year group, formed the initial data and is the basis of results reported in the article. The number of students in each year group was 9,382, which resulted in a total sample size of 37,528 students.
Items
The assessments consisted of almost all MC items (128) and relatively few constructed response (CR) items (6). The MC items were of standard format all with four possible answers from which students were required to select the best answer. The CR items generally required a word or a short phrase. All MC and CR items were scored dichotomously (correct or incorrect). The items covered three strands of reading (a) Text Location and Interpretation, (b) Text and Language Knowledge, and (c) Contextual Understanding.
The Year 3, 5, 7, and 9 tests consisted, respectively, of 34 MC and 2 CR, 36 MC and 1 CR, 49 MC and 1 CR, and 47 MC and 2 CR items. The Reading scale is vertically equated by including common or link items in tests administered to adjacent year groups. Table 2 shows the vertical scaling design schematically, including the number of items that are common and unique to each year group. The responses to the common items are represented as the shaded columns that overlap between adjacent year groups.
Vertical Equating Design for the NAPLAN Reading 2013 Scale.
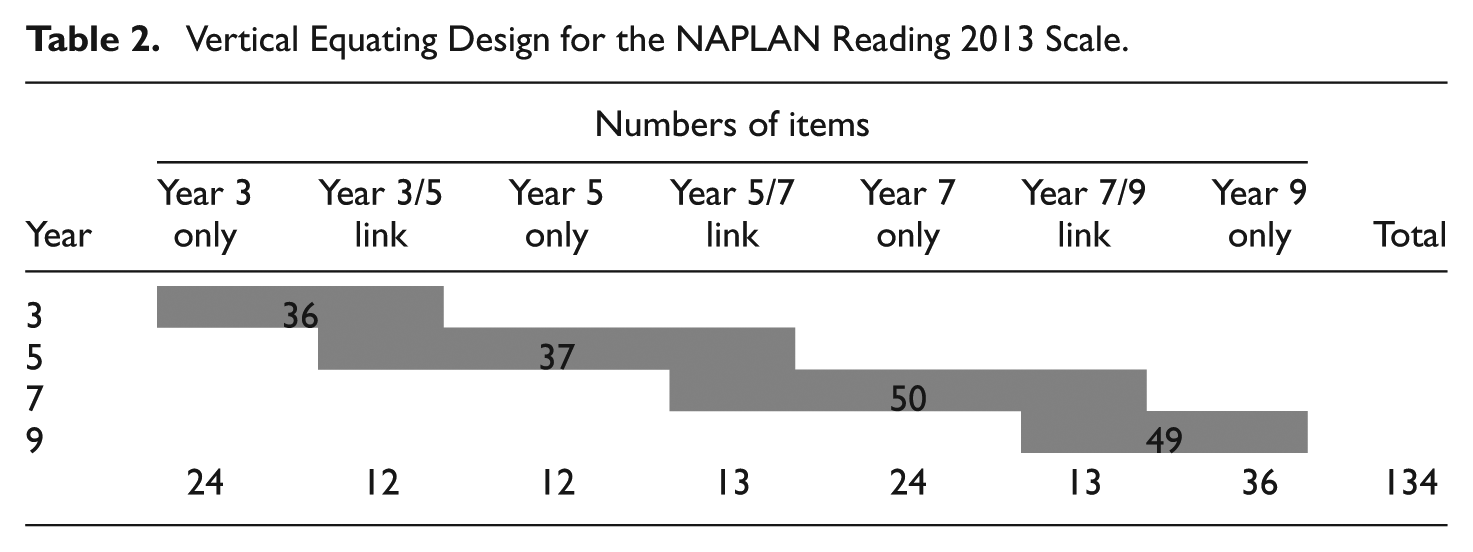
As shown in Table 2, the data matrix had structurally missing data with link items common to adjacent year groups. There are different approaches to analyzing the data with linked items among year groups, including first finding equating functions between successive year groups. In part for efficiency of exposition, the data for all year groups were analyzed simultaneously. The RUMM2030 program takes account of missing data, including structural missing data, and a simultaneous analysis of all groups takes advantage of the linked design, immediately creating a common scale with a common, specified origin.
Because only a relatively small number of items were not MC (6/134), in the item analysis stage, these items were treated in the same way as the MC items—that is, if based on the initial analysis a student had a probability less than 0.30 of answering a constructed response item correctly, then the answer was also converted to a missing response. Because the estimates are of relative difficulty which are independent of the student distribution, the effects of tailoring these items will have no statistically significant impact on the item difficulty estimates of all items.
Results
The first set of results compares item difficulty estimates from the different analyses, the second compares student proficiency estimates, the third compares the effects on the growth trajectories of students, and the fourth compares the fit of data to the RM in the different analyses.
Relationship Between Difficulties in the Origin-Equated and Tailored Analyses
The first comparison is between the origin-equated (initial data that include responses likely to be guessed) and the tailored analysis (tailored data that exclude responses likely to be guessed). The common origin was set to the mean of the four easiest items in the tailored analysis, Items 1, 2, 3, and 5 in the Year 3 sample. Figure 2 shows the relationship between the origin-equated and tailored difficulty estimates relative to a line of unit slope, which would indicate no effect of guessing.
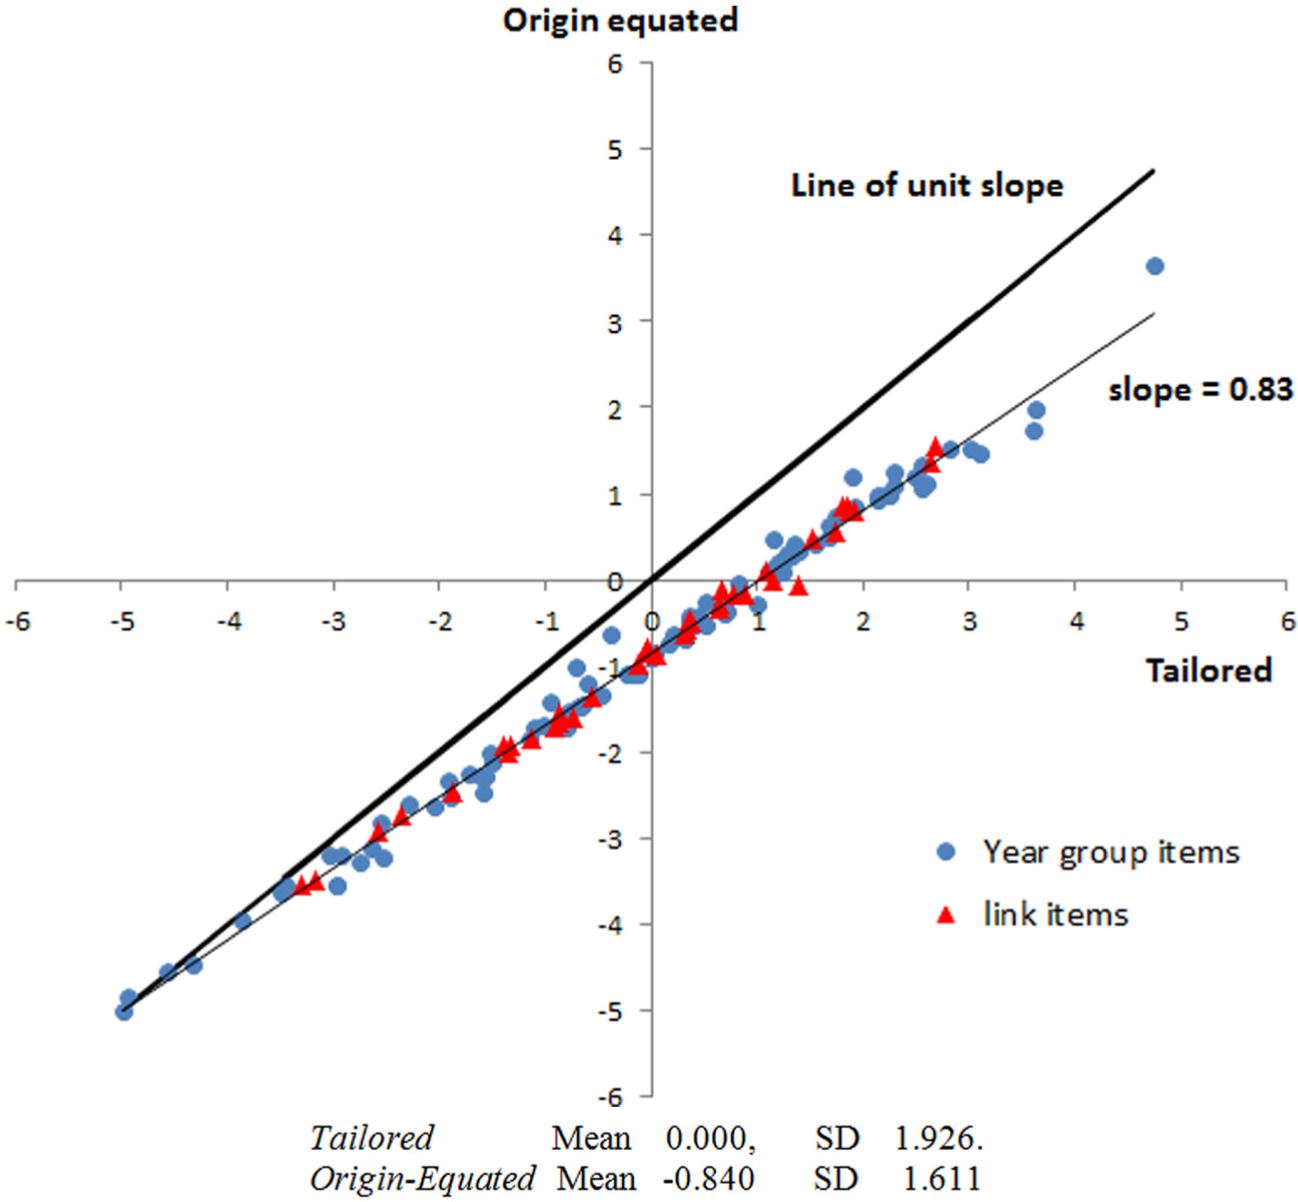
Origin-equated plotted against the tailored item difficulties.
First, Figure 2 confirms that the relative difficulties of the easy items, including the four easiest items, are on the line of unit slope and therefore equivalent in the two analyses. Second, the figure shows that as the difficulty estimates increase beyond the easiest items of Year 3, the differences between the estimates from the two analyses increase, with the difficulties greater in the tailored analysis. This relationship confirms the hypothesis that guessing is generally a function of difficulty relative to proficiency and therefore a matter of degree and not simply present or not.
Third, whether or not they have guessing, estimates of relatively difficult items on a scale will be affected in a tailored analysis. Thus, it is evident in Figure 2 that neither the easy items for the Year groups 5, 7, and 9, nor the CR items for these groups, are on the line of unit slope. This is because the change of scale that arises from the differences in difficulties between the tailored and the origin-equated analyses compounds across successive year levels and affects the estimates of all items other than the easiest items in Year 3. For example, because the scale of the Year 3 items is stretched in the tailored analysis in which the difficult items have even more difficult estimates, and because they are referenced to the same origin, all Year 5 items are more difficult in the tailored analysis, with the difficulty of the more difficult items increased even further by tailoring. This effect compounds with Year 7 items, and further with Year 9 items. It compounds, however, because there is a net effect of guessing on the more difficult items for each year group. If there were no guessing, then the estimates between the tailored and origin-equated analyses would not deviate systematically from each other. Finally, Figure 2 shows the regression of the origin-equated estimates on the tailored estimates in which the slope is substantially lower than 1.0, the criterion for no effect of guessing.
Consistent with the comparisons of difficulty estimates in Figure 2, the mean and standard deviation of the difficulties in the origin-equated analysis are both smaller than in the tailored analysis. The caption in Figure 2 shows these summary values. All estimates are reported directly in logits. In particular, the mean of the item difficulties (−0.840) of the origin-equated analysis is substantially less than the mean (0.000) for the tailored analysis. The relative easiness of the items in the origin-equated analysis arises directly from the relatively higher scores on the more difficult items induced by guessing.
In contrast to the arbitrary origin, the effect of the tailored analysis on the standard deviation of the difficulty estimates is not arbitrary. The standard deviation of the tailored analysis (1.926) is almost 20% greater than that of the origin-equated analysis (1.611). One interpretation of this difference is that the unit of scale in the latter, characterized by the inverse of the summary common discrimination among all items, is smaller than in the former, and therefore that the tailored analysis has greater precision (Humphry & Andrich, 2008). This interpretation is valid and, not surprisingly, does indicate that the data that include likely guessed responses is less precise than if there were no guessed responses. However, as is evident from Figure 2, this difference in unit is not constant across the continuum, but changes as a function of the relative difficulty of the items. In principle, because of guessing on difficult items, the precision is worse where they are located in the origin-equated analysis; then the tailored analysis restores the precision of estimates at the more difficult end of the continuum to be homogeneous with the discrimination at the easier end.
Relationship Between Student Estimates in the Origin-Equated and Tailored Analyses
Figure 3 shows proficiency estimates from the origin-equated analysis plotted against those from the all-anchored analysis (with both analyses with initial data). Figure 3 shows features similar to those in Figure 2. Thus, the greater the proficiency, the greater the difference between the two sets of estimates. The mean and standard deviations reported in the figure show that both are larger in the all-anchored analysis. The regression of the origin-equated estimates (item parameter estimates from all responses) on the all-anchored estimates (item estimates from the tailored analysis but person estimates from all responses) shows that the estimates from the origin-equated analysis become increasingly reduced as the proficiency increases.
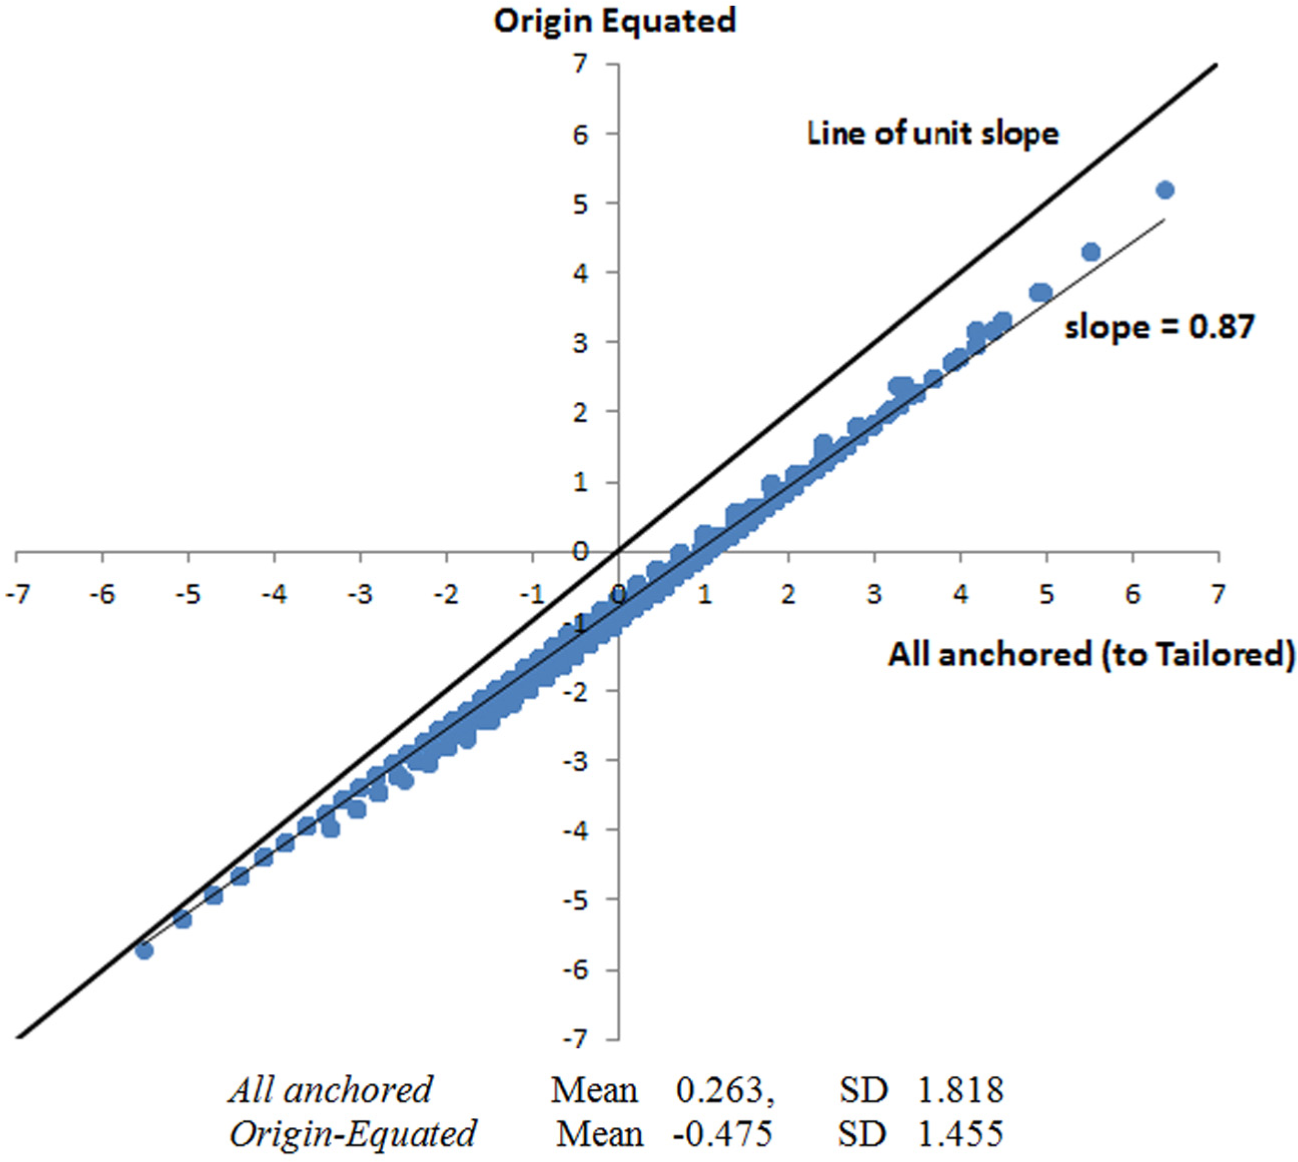
Origin-equated plotted against the all-anchored person estimates.
Effects on Growth Trajectories
From Figure 3, it can be predicted that the differences between the successive year group means will be greater in the all-anchored analysis than in the origin-equated analysis. These means are shown in Table 3. For completeness, and as a frame of reference, the means of the year groups from the tailored analysis, taken as the least biased, are also shown in the table. It can also be predicted that because the all-anchored analysis has all the responses, including those likely to be guessed correctly, its means will be greater than those in the tailored analysis. Relevant comparisons can be made between these three analyses because they have the same origin. The comparisons demonstrate the effect on the student estimates of the item bias in the origin-equated analysis.
Mean and Standard Deviations for Each Year Group From Different Analyses.
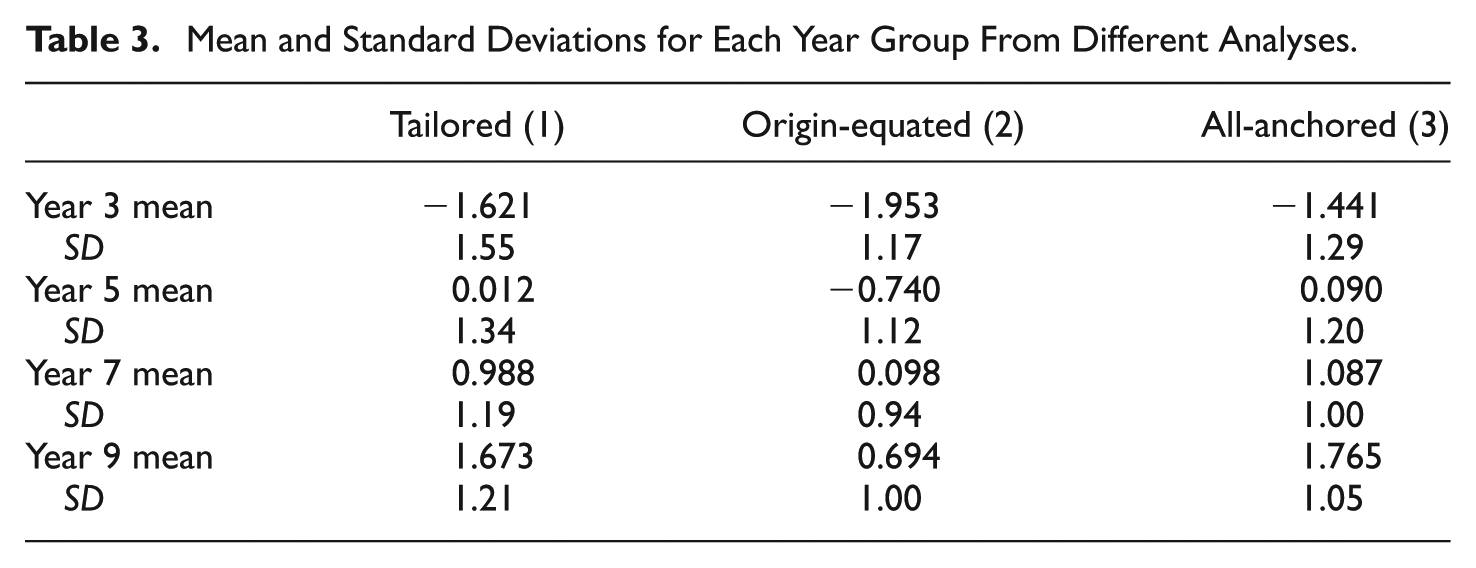
First, Table 3 shows that the student standard deviation of the tailored analysis is greater than that of the origin-equated analysis for all year groups. This results directly from the standard deviation of the item difficulties in the tailored analysis being greater than in the origin-equated analysis. Second, the standard deviation of the tailored analysis is also greater than that of the all-anchored analysis for all year groups. In this case, although the item difficulties are identical, the all-anchored analysis includes responses of the less proficient that might have guessed items correctly. As a result, the less proficient will have a relatively inflated estimate (while that of the more proficient is relatively unchanged), reducing the standard deviation relative to the tailored estimates. This effect is also consistent with, and further confirms, the hypothesis that guessing in general is a function of the student proficiency relative to the item difficulty.
Third, because the mean of the item difficulties is substantially less (−0.840) in the origin-equated analysis than in the tailored analysis (0.000) (even though the origin is the same), the means of the proficiencies in all year groups for the origin-equated analysis are also substantially less than in the other two analyses. This reflects the more accurate estimates of student proficiencies from the least biased item difficulty estimates in the tailored analysis. The means of the all-anchored analysis are slightly greater than in those of the tailored analysis. This difference was predicted above and can be attributed to the presence of guessed responses in the all-anchored analysis.
Figure 4 shows the information in Table 3 graphically. The horizontal axis is the Year of schooling of the students. The logarithmic regression of the means on the Year groups, simply represented by their years in school (3, 5, 7, and 9), fits remarkably well. The regression line is shown on the graph and demonstrates the deceleration of the means across year groups. Although an important result of this article, possible implications of this simple logarithmic deceleration with increasing age group are left for other occasions.
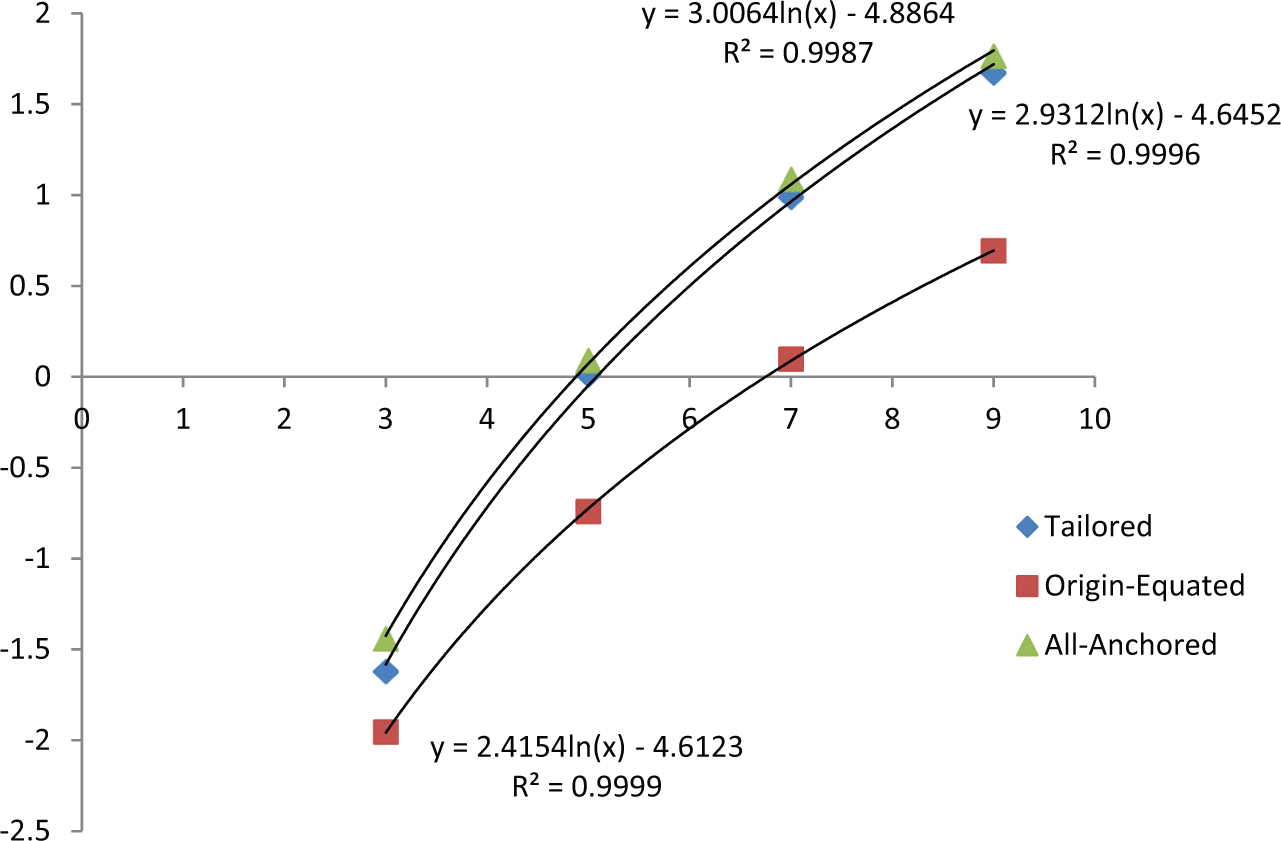
Year group means for three analyses.
However, the important result considered in this article, and shown in Figure 4, is that, because of the nonlinear shrinkage of the origin-equated scale relative to the tailored scale, the mean performances in the former analysis are consistently below the means of the latter analysis. The most salient point is that the differences between year group means increase as the grade level increases. The means of the all-anchored analysis are slightly greater than the tailored scale means that results from the all-anchored analysis including responses that might have been guessed correctly. Because of the compounding of the stretching of the scale across year groups, the effect is substantial for the older year groups with the difference between the all-anchored and origin-equated means for Year 9 being 1.071 logits. The overall conclusion is that the standard RM analysis, which does not eliminate the effect of guessing from the scale, gives an underestimate of the relative growth across the year groups, and when placed on the same origin and same scale, the underestimate compounds across year groups, thus lowering the trajectory of the growth.
It may be considered that the use of the item parameter estimates from the tailored analysis with all responses (initial data) in the all-anchored analysis unjustly benefits the lower proficiency students (potential guessers). Although this is true to some extent, the analyses also show that, because of the effect on the scale, the benefit for the less proficient (guessers) is less great with the all-anchored analysis than the punishment for the more proficient (nonguessers) with the typical analysis, here characterized as the origin-equated analysis because the origin is chosen to facilitate comparisons with other analyses. It is recognized, as discussed in more detail in Andrich and Marais (2014), that this result is initially counterintuitive. However, it is readily explained by appreciating that the more proficient students answer the more difficult items correctly at a greater rate than the less proficient, even when the less proficient guess. As a consequence, by having unbiased and more difficult item estimates for the already more difficult items from the tailored analysis, the more proficient are rewarded more than the less proficient (even though the former do not guess to the same degree as the latter). We stress that because the origin is arbitrary, the effects considered are relative and are revealed only through comparisons. Thus, when including all responses, the deflation of estimates of proficiency for the Year 9 group when the scale is not corrected for guessing (origin-equated analysis) is greater than the inflation of the Year 3 group when the scale is corrected for guessing (all-anchored analysis).
A Global Test of Fit
Because of the deletion of responses that might have a guessing component, it is expected that the data-model fit will be better in the tailored analysis than in the other analyses. A global test of fit of tailored and origin-equated analyses is instructive in comparing fit of the former relative to the latter. For this purpose, the differences between observed means in class intervals and their expected values as shown in the ICCs are used to calculate an approximate chi-square statistic. This statistic can be pooled across the items. The statistic is a test of deviation from perfection of the data from the model, and as in other tests of fit, is sensitive to sample size—with a large enough sample, and given no data will fit a mathematical model perfectly, misfit is inevitable. To avoid the mechanical use of significance values in these circumstances, various approaches have been proposed. Here, we are concerned with the comparison between the fit in the origin-equated and tailored analyses rather than with the fit of each.
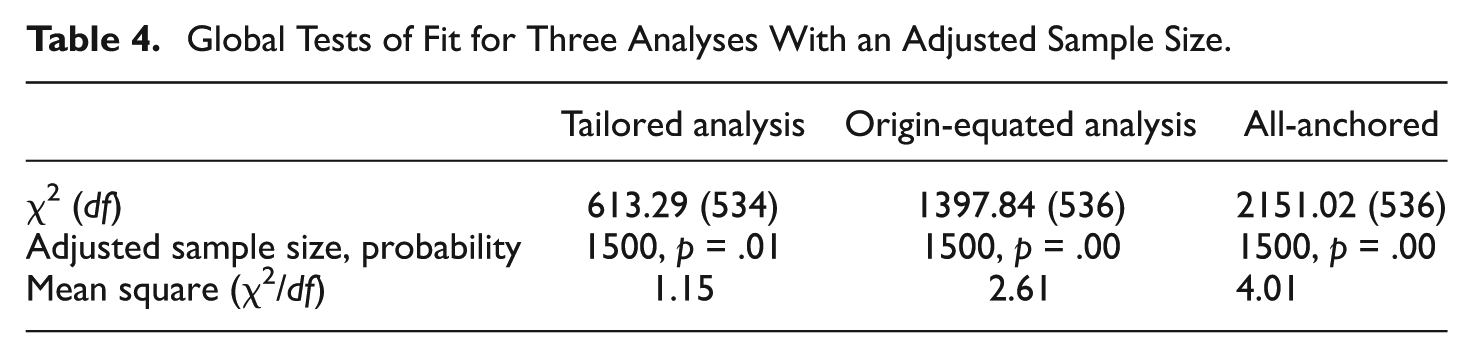
One approach to controlling the effect of sample size on fit in conjunction with the chi-square statistic is to take the estimates and deviations from the analysis of the large sample, but then adjust the fit statistic for sample size. That is, the approach retains the more stable estimates obtained from the large sample, but then considers the probability of the approximate chi-square so obtained as if it arose from a smaller sample (Andrich & Styles, 2011). Table 4 shows the chi-square and the probabilities for an adjusted sample size for the tailored and origin-equated analyses. The sample size (1,500) was chosen to show marginal fit of the data to the model, p = .01, for the tailored analysis. Then the chi-square and the probability for the same adjusted sample size were obtained for the origin-equated analysis. The slightly different degrees of freedom, 534 in the tailored analysis compared with the 536 in origin-equated analysis, arose from two items having only four class intervals in the tailored analysis. Clearly, the fit in the tailored analysis is substantially better than in the origin-equated analysis. In particular, the mean square value (1.15) of the former, which is close to its expected value of 1.0, is less than half (2.61) of the latter. This confirms that fit can be substantially improved by a tailored analysis, further confirming the hypothesis that guessing is a function of the difficulties of the items relative to the proficiencies of the students.
Global Tests of Fit for Three Analyses With an Adjusted Sample Size.
Appendix A shows the detailed graphical analysis of a link item between Years 3 and 5. As explained in Appendix A, an item that has guessing and no difference in discrimination from the item’s ICC will nevertheless appear to have a discrimination that is different from the ICC. This item does manifest, first, a difference in apparent discrimination from the ICC and guessing in the origin-equated analysis, which results in very poor fit to the ICC; second, an excellent fit to the ICC in the tailored analysis; and third, a clear guessing effect and no apparent difference in discrimination from the ICC in the all-anchored analysis. Most other items show the same patterns relative to their ICCs. Appendix A illustrates graphically the implication of Waller’s procedure in removing responses likely to have been guessed.
Appendix B shows the results of a simulation study. The purposes of the simulation study in which data were generated according a modified 3PL model are twofold: First, to confirm that the simultaneous analysis of all year groups estimates the generating difficulty and proficiency parameters accurately and therefore to provide assurance that there were no technical problems with the estimation. Second, to confirm that the dominant effect of misfit to the RM in the real data was that due to guessing and therefore to provide assurance that the interpretation of the effect of guessing on the growth trajectory was correct. This is confirmed by simulating data in which the only misfit to the RM is that of guessing, and then demonstrating that when the effect of guessing is controlled by the sequence of four analyses with the real data, the results from these four analyses have identical patterns, and virtually identical values, to those in the real data. In particular, it is intended to check if the bias in the item difficulties and student proficiencies present in the initial analysis is removed in the tailored analysis.
For this purpose, in the simulated data, student means and standard deviations (normally distributed) of the year groups were identical to those of the tailored analysis estimates in the real data, and the item difficulties were identical to those obtained from the tailored analysis. The estimates from the tailored analysis were chosen for the simulation because they are considered the least biased. The link structure was also identical to that in the real data. Importantly, guessing was introduced to be a function of the student and item difference according to the modified 3PL shown in Andrich et al. (2012) with its ICC shown in Figure 1. Thus, to stress, the only factor which affected the fit to the RM was the effect of guessing.
The analyses conducted on the simulated data showed identical patterns to corresponding analyses in the real data. In addition, the generating means and those obtained from the tailored analysis are virtually identical, showing that the tailored analysis gave unbiased estimates in the presence of guessing. Appendix B shows the key graphs for the simulation study. Figure B1 shows that the effect of guessing in the origin-equated analysis relative to the tailored analysis, in which the scale is shrunk in a nonlinear fashion, is virtually identical to that in the initial analysis of the initial, real data. Figure B2 shows that the group means from the origin-equated, tailored, and all-anchored analyses are also virtually the same as in the real data and that the simulated and tailored-analysis means are indistinguishable. This simulation confirms that even though all items in the real data, compared with the simulated data, cannot have exactly the same degree of guessing as a function of difficulty, the dominant and net statistical effect is equivalent to a general effect of guessing. The analyses from the simulation study also confirm that there are no technical problems in the simultaneous estimation of the parameters in the linking design.
The point of the simulation was to show the consistency of the results with the real data rather than to study any sampling distributions of estimates. Therefore, because the simulated sample was extremely large (9,382 in each year group), it was considered that one simulation was sufficient.
Discussion
This article studies the effect of removing the statistical bias due to guessing in parameter estimates from responses to MC items in a RM analysis of a high-profile national reading test in Australia administered to all Year 3, 5, 7, and 9 students. The standard RM is used for purposes of equating student proficiencies across year groups.
The removal of the statistical bias due to guessing was based on the hypothesis, consistent with the 3PL but approached differently, that students tended to guess on items they found difficult. To obtain difficulty estimates unbiased because of guessing, responses estimated to have a probability less than chance of being correct were eliminated from the data matrix. The analysis was referred to as a tailored analysis. With a common origin to that of a tailored analysis, the analysis of the complete data matrix was referred to as an origin-equated analysis. Because correctly guessed responses inflate the number correct, difficulty estimates in the tailored analysis increase nonlinearly as a function of the difficulty relative to those in the origin-equated analysis. The difficulty estimates from the tailored analysis are taken to be the least biased. That they are virtually unbiased can be seen from Figure B1 in Appendix B where the simulated item difficulties are known.
The article also demonstrates that because of the presence of guessing at all year groups, and because there is a compounding effect of the stretching of the scale across year groups, the difference in the mean proficiency estimates of the students between the origin-equated and tailored estimates increases as a function of year level. Because the effect is nonlinear, the effect of guessing cannot be accounted for simply by equating standard deviations.
Finally, student proficiencies were estimated using each student’s full complement of responses, as they are for policy reasons, using the unbiased tailored analysis difficulty estimates. The analysis providing these estimates was termed the all-anchored analysis. The means of the year groups are only slightly greater in the all-anchored than in the tailored analysis, with the pattern of means the same. Both the tailored and the all-anchored analyses suggest that the growth across year levels is substantially greater than appears using the origin-equated analysis, the analysis typically used.
The major implication of the article is that if the RM is used with MC items for equating across year groups, the effect of guessing, which produces biased difficulty estimates, should be removed and the item difficulties that are not biased used to obtain proficiency estimates. Otherwise, the growth trajectory across year groups evident in the data is substantially underestimated.
Footnotes
Appendix A
This appendix illustrates the effects of guessing on the ICC curves and the graphical test of fit for an item with guessing. For the purpose of fit, the proficiencies were placed into five class intervals, and the mean (observed proportion) of the responses in each interval plotted against the item ICCs. As indicated in the article, guessing in the responses will affect the fit to the RM, thus eliminating responses that are likely to be guessed should improve fit. To illustrate these effects tangibly, ICC curves in the initial and tailored analyses with a specific item are shown below.
Figure A1 shows the ICC from the initial analysis of Item 3.26, which is a link item between Years 3 and 5. The observed means are immediately disaggregated by Year groups showing that there is very little, if any, differential item functioning (DIF). However, the ICC and the observed means suggest the presence of guessing by the least proficient students. First, because of its inflated total score, its difficulty is underestimated, and the ICC is located further to the left than if its real difficulty were known. As a result, the observed means in the more proficient class intervals are below the ICC. On the other hand, despite the curve being further to the left than it should be, the observed proportion in the two least proficient class intervals for both Year groups are above the ICC. This inflated proportion of correct responses at the lower proficiency intervals suggests the presence of guessing. It also gives the impression that there is a difference in discrimination from the RM model. Although not the main focus of this article, it is noted that in designs such as the one reported in this article, where link items are used for vertical scaling, it is important that link items do not have DIF (Andrich & Hagquist, 2012; Looveer & Mulligan, 2009).
Figure A2 shows the ICC and observed means in five class intervals for the same item (Item 3.26), but for the tailored analysis, again immediately disaggregated by the two year groups. It is evident from this figure that the difficulty of the item is greater than in Figure A1 (1.388 compared with −0.073), and that the observed means in the five class intervals now show excellent fit in relation to the discrimination of the ICC with no evidence of guessing being present in the responses, and again no evidence of DIF.
To illustrate more strongly the manifestation of guessing, Figure A3 shows the ICC for Item 3.26 in the all-anchored analysis, where all items are anchored to their tailored analysis estimates, and the initial data reanalyzed to obtain student estimates. The figure immediately has the year groups disaggregated. Recall that the initial analysis includes possibly guessed responses by the least proficient in each year level. Because the item’s difficulty is greater in the all-anchored analysis than in the origin-equated analysis, and therefore located further to the right on the graph, two related features arise in Figure A3 in relation to Figure A2. First, the less proficient manifest guessing more clearly in Figure A3 with three class intervals from the least proficient having proportions correct above the ICC compared with only two in Figure A2. Second, for the class intervals for the most proficient, in Figure A3 the observed proportions are virtually on the ICC whereas in Figure A2 the observed proportions are below the ICC. This contrast indicates that the guessing, taken to be a function of the difference between difficulty and proficiency, manifests itself not only as guessing in the origin-equated analysis, but also as a different discrimination from the RMs ICC. Essentially, guessing and discrimination are confounded in the depiction of the ICC in the origin-equated analysis, which is the typical analysis. Figure A3 clearly confirms the hypothesis that guessing on Item 3.26 was a function of its difficulty relative to the students’ proficiencies.
There is no space in this article to present the complete details of the fit in the various analyses. However, it is noted that in all year groups there were difficult items which showed features of guessing similar to those of items 3.26, including items which were unique to each year group.
Appendix B
Appendix B shows the results of the simulation study described in the article. Figure B1 shows the item estimates from the tailored analysis compared with those of the generating parameters and the origin-equated estimates. The tailored estimates are virtually identical to the generated estimates, showing that Waller’s procedure removed the bias in the estimates. The origin-equated estimates show the same pattern as for the real data, with the origin-equated estimates showing a smaller variance than the tailored estimates.
Table B1 shows the simulated proficiency means and standard deviations for each year group, together with their estimates under three conditions. It is evident that the tailored analysis provides an excellent recovery of the simulated values of both the means and standard deviations, and that those from the other analyses show patterns consistent with the hypothesis of guessing as a function of proficiency and relative difficulty.
Figure B2 shows the graph of the proficiency estimates for each year plotted against years in school. The estimates from the tailored analysis are virtually identical to those simulated, again confirming that the bias from guessing has been removed. The origin-equated analysis again shows a substantially lower rate of change across year levels. The all-anchored analysis shows the same pattern as in the real data. As in the real data, all estimates are well approximated with a regression line which is a function of the logarithm of the Year group.
Acknowledgements
The data were made available by Australian Curriculum Assessment and Reporting Authority and Joshua McGrane assisted in preparing the data sets.
Authors’ Note
An earlier version of this article was presented at the Meeting of the National Council for Measurement in Education, Philadelphia, PA, USA, 2014.
Declaration of Conflicting Interests
The author(s) declared no potential conflicts of interest with respect to the research, authorship, and/or publication of this article.
Funding
The author(s) disclosed receipt of the following financial support for the research, authorship, and/or publication of this article: The research reported in this article was supported in part by an Australian Research Council Linkage grants (Grant LP140100567; Stephen Humphry and David Andrich, Chief Investigators) with the School Curriculum and Standards Authority of Western Australia and the Australian Curriculum Assessment and Reporting Authority as Industry Partners, and by Pearson Plc.