
Abstract
The development of technology-enhanced innovative items calls for practical models that can describe polytomous testlet items. In this study, we evaluate four measurement models that can characterize polytomous items administered in testlets: (a) generalized partial credit model (GPCM), (b) testlet-as-a-polytomous-item model (TPIM), (c) random-effect testlet model (RTM), and (d) fixed-effect testlet model (FTM). Using data from GPCM, FTM, and RTM, we examine performance of the scoring models in multiple aspects: relative model fit, absolute item fit, significance of testlet effects, parameter recovery, and classification accuracy. The empirical analysis suggests that relative performance of the models varies substantially depending on the testlet-effect type, effect size, and trait estimator. When testlets had no or fixed effects, GPCM and FTM led to most desirable measurement outcomes. When testlets had random interaction effects, RTM demonstrated best model fit and yet showed substantially different performance in the trait recovery depending on the estimator. In particular, the advantage of RTM as a scoring model was discernable only when there existed strong random effects and the trait levels were estimated with Bayes priors. In other settings, the simpler models (i.e., GPCM, FTM) performed better or comparably. The study also revealed that polytomous scoring of testlet items has limited prospect as a functional scoring method. Based on the outcomes of the empirical evaluation, we provide practical guidelines for choosing a measurement model for polytomous innovative items that are administered in testlets.
Introduction
With the increasing use of computers in recent testing, innovative items that make use of computer features have become increasingly popular. For example, items can deploy dynamic tools to present information more efficiently (e.g., audio, animation, video, simulation) or adopt interactive response mode to measure higher order skills or enhance task engagement (e.g., hot spot, graph, drag-and-drop). When innovative items are used in practice, they are often presented in testlets (e.g., lab scenario, case study, chart, table) and scored polytomously allowing partial credit (Betts et al., 2021; Davey et al., 1997; Jiao et al., 2012; Jodoin, 2003). These items are characterized as polytomous items embedded in testlets.
While testlets help enhance testing efficiency, they can induce local dependence among the items sharing the same testlets (Wainer & Kiely, 1987; Yen, 1984). The common stimulus attached to a testlet brings about extra correlation among the associated items, engendering local dependence beyond and above the relationship that could be explained by the primary latent factor. Studies have suggested that existence of local dependence among the testlet items can adversely affect psychometric inference. It can lead to overestimation of measurement precision (Marais & Andrich, 2008; Sireci et al., 1991; Wainer & Thissen, 1996), bias in item parameter estimation (Tuerlinckx & De Boeck, 2001; Wainer & Wang, 2000), item misfit (Marais & Andrich, 2008), linking and equating error (Lee et al., 2001; Li et al., 2005).
Several strategies have been discussed in the measurement literature to deal with the local dependence problem (e.g., Bradlow et al., 1999; Li et al., 2005; Wainer & Kiely, 1987; W.-C. Wang & Wilson, 2005). These studies were however mostly centered on binary-response items. Despite the increasing interest in polytomously scored innovative items, only scant attention has been given to polytomous testlet items (e.g., Li et al., 2010; Himelfarb et al., 2020). The purpose of this study is to fill in this void and investigate measurement models that can be used for polytomous testlet items. We in particular give special attention to innovative items that are emerging in recent operational assessments. These items are often tied to technology-rich stimuli (e.g., graphic, video, simulation) and require various interactive actions (e.g., matching, hot spot, drop-down). The items typically involve high degrees of multiplicity in response scores and face greater risk of convergence problems and scaling challenges. In this study, we conduct comprehensive evaluation of probable measurement models and document their relative performance in the model fit and trait inference. Four models are considered for investigation: the (a) generalized partial credit model (GPCM), (b) testlet-as-a-polytomous-item model (TPIM), (c) random-effect testlet model (RTM), and (d) fixed-effect testlet model (FTM). TPIM and RTM have been widely considered in the analysis of binary response data (Rosenbaum, 1988; Wainer & Kiely, 1987; X. Wang et al., 2002; Wainer et al., 2007). FTM is a new model suggested in this study.
The performance of the models is evaluated in multiple aspects. Earlier studies mostly drew on relative fit measures (e.g., log-likelihood, Akaike information criterion) to decide a comparatively better fitting model (e.g., DeMars, 2012; Glas et al., 2002; Hernandez-Camacho et al., 2017). These measures are, however, known to have high Type I error (De Champlain & Gessaroli, 1998; Hayashi et al., 2007). In addition, our empirical evaluation suggests that a better fitting model does not necessarily lead to better measurement outcomes. Notwithstanding the greater goodness-of-fit, a complex general model can result in poorer trait recovery than the simpler functional models. In applied settings, a general better-fitting model may not be always applicable to operational assessment—due, for example, to scaling, sample size, or score interpretability—and a simpler model that permits easy scaling and model-fitting can be more preferred if the latter does not show significant misfit. The goal of this study is to evaluate functioning of the models with such practical considerations, taking special note of practicality for large-scale operational assessment programs. Specifically, the study evaluates performance of the models in various aspects, including relative model fit, absolute item fit, recovery of item and person parameters, and classification accuracy. The study also suggests statistical inference methods relevant to those evaluations, such as significance tests of testlet effect, item calibration under FTM, and trait inference under the polytomous RTM. The outcomes of the study will provide important implications for operational testing programs that seek to include innovative items or polytomous testlet items.
The remainder of this article is organized as follows. The next section gives a brief outline of the measurement models considered in the study. This is followed by a section that presents statistical tests that evaluate significance of testlet effect. The subsequent two sections respectively provide simulation study and real data analysis that show empirical performance of the models. The final section discusses key findings and implications for real testing programs.
Modeling Framework
The study considers four measurement models for describing polytomous testlet items. All models are formulated for partial credit items given the prevalence in applied settings. Below outlines the assumptions and parameterization of each modeling framework.
Generalized Partial Credit Model
The first model, the generalized partial credit model (GPCM; Masters, 1982; Muraki, 1992), is one of the most widely used polytomous response models for partial credit items. The model assumes that all items on a test are conditionally independent given a latent trait parameter. It does not assume any local dependence within a testlet and models the response scores at the individual item levels. Specifically, for a response category
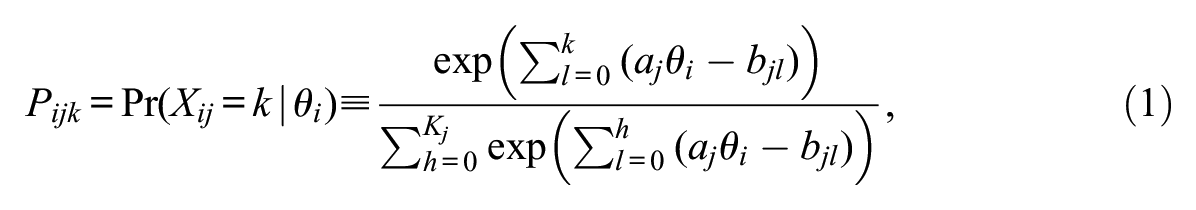
where
Testlet as a Polytomous Item
GPCM assumes conditional independence of individual items and does not give account for testlet effect. As a practical way of addressing the local dependence, Wainer and Kiely (1987) suggested scoring testlet items as a single polytomous item. By treating a testlet as a measurement unit, this strategy shifts the local independence assumption of individual items to that of testlets. Since the items within a testlet are treated as a fungible unit, this scoring is referred to as testlet-as-a-polytomous-item-modeling (TPIM).
The scoring procedure can be described as follows. For a testlet
where
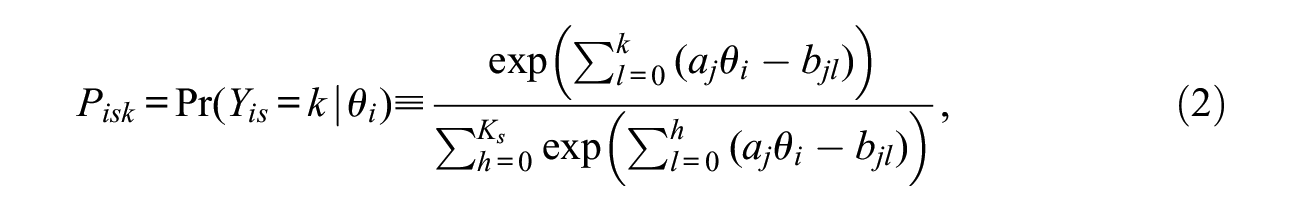
Random-Effect Testlet Model
The other way of addressing the local dependence problem is to use a parametric model that explicitly accounts for the testlet effect. One of the most commonly considered models in this approach is the random-effect testlet model (RTM; Bradlow et al., 1999; X. Wang et al., 2002; Wainer et al., 2007). The model assumes that extra dependence among the testlet items is due to random interaction between the testlet and testlet-takers. For example, items within a testlet can show stronger correlation because of individual’s unique background knowledge about the testlet stimulus, misunderstanding of the testlet information, or general frustration with the testlet. To model such interaction, RTM uses a random-effect term within the item category response function. Let
where
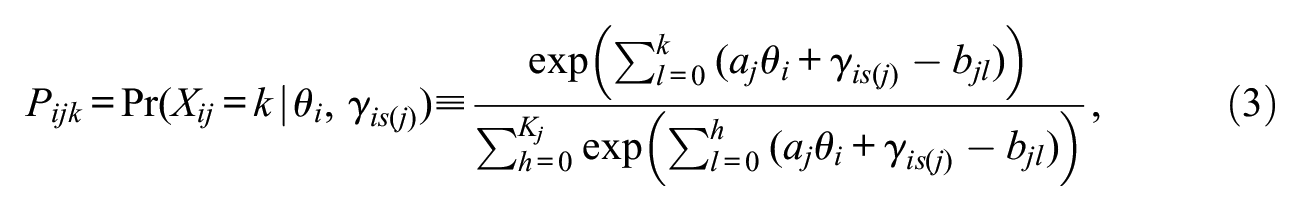
Fixed-Effect Testlet Model
RTM ascribes within-testlet dependence to individual’s trait level associated with the testlet stimulus. Alternatively, one may as well impute local dependence to testlet’s own characteristics, such as complexity of a scenario, added difficulty in processing the testlet information. In the context of GPCM, a fixed-effect testlet model (FTM) can be formulated as
where
We note that FTM in its current form is subject to nonidentifiability between
Evaluating Testlet Effects
The models in the previous section can be used to test significance of testlet effect. In this section, we present three statistical tests that evaluate significance of testlet effect under the GPCM, RTM, and FTM. All tests are performed based on the maximum likelihood (ML) estimates of the model parameters.
Likelihood Ratio Test
The first test, the likelihood ratio (LR) test, compares likelihoods of RTM and GPCM to determine significance of random interaction effect. If the likelihood of RTM, that assumes nonzero random testlet effects, is significantly larger than the likelihood of GPCM, that assumes zero testlet effect, it will suggest that the items within the testlets have strong random interaction with test takers. The dissimilarity between the likelihoods is measured by logarithm of likelihood ratio. Let

where
While the LR test provides uniformly greatest statistical power, it requires fitting of two models. If the fitted outcomes differ in estimation precision, or if any of the models has convergence problems, the test results will become questionable. In addition, the test can evaluate testlet effects only at the test level. Rejection of the null hypothesis suggests that there exists at least one testlet with significant random interaction; it does not inform which particular testlets had significant effects.
Score Test
The second statistical test, the Lagrange multiplier (LM) test (Aitchison & Silvey, 1958; Rao, 1948), makes use of only one model and can evaluate testlet effect for each item cluster. Although the test is not precisely designed for testlet effect evaluation, it can indicate local dependence within a testlet. In the present setting, the test is performed on a set of ML estimates of GPCM and examines if the score function at
The departure from the maximum likelihood is assessed by squared score function:

where

with

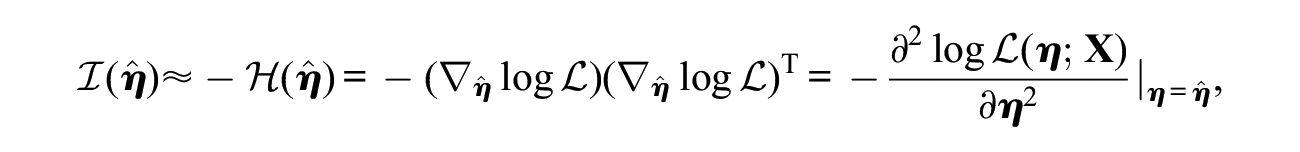
The present study obtains the information matrix as the observed Fisher information matrix:
where
Again it is to be noted that the LM test evaluates overall violation of the model assumptions. Since the test is performed without a specific alternative hypothesis, rejection of the null hypothesis does not inform whether the model misfit is a consequence of testlet effects or any other violations of the model assumptions (e.g., inappropriate parameterization, presence of other trait dimension(s), differential item functioning, within-person dependency, local dependence between item pairs).
Wald Test
The third test, the Wald test, can determine significance of testlet effects explicitly. The test is based on FTM and evaluates significance of the constant testlet effect. As with the LM test, the Wald test requires fitting of only one model—the alternative model that assumes nonzero testlet effect. Let

where
As with the LM test, the Wald test can be applied to individual testlets. Under the null hypothesis, items from different testlets become conditionally independent once the trait level and testlet effects are accounted for. One can capitalize on this result to evaluate significance of testlet effect separately for each item cluster. For example, the Wald statistic for a testlet
Simulation Study
Monte Carlo simulation was carried out to examine performance of the polytomous testlet models. The study in particular gave close attention to the relative performance of the models when the models were fit to different response data with varying testlet effects. With the known properties of the response data, the study examined advantages of fitting a correct model as well as consequence of fitting an ill-posed model. Below presents details of the simulation design, evaluation criteria, and simulation outcomes.
Design
Model
The study used three models to generate response data, GPCM, FTM, and RTM, and four models to analyze the observed data, RTM, FTM, GPCM, and TPIM.
Linear Test
Tests were created in linear forms with the fixed length of four testlets. Each testlet included six polytomous items (i.e., test length = 24) with varying maximum scores. The maximum item score was randomly determined between two and six with a constraint on the maximum testlet score (to be between 20 and 30). This setup makes the testlets comparable in the response scale as well as in the amount of testlet information. Given the fixed maximum item score, item parameters were randomly sampled from the uniform and normal distributions, respectively, as
Sample
Examinees’ trait parameters were drawn from the (multivariate) normal distribution with the fixed sizes,
Testlet Effect
Prior studies examining empirical binary-response data reported that real assessments tend to have small to moderate testlet effects (Boyd et al., 2013; Wainer et al., 2007). In this study, variance of testlet effects was systematically varied to model small, moderate, and large effects—
Model Estimation
Applying the parameters generated above, response data were simulated by rejection sampling, and four scoring models were fit to each observed data. All models were estimated by maximum marginal likelihood estimation with the expectation-maximization algorithm (Dempster et al., 1977). Specifically, for fitting RTM, GPCM, and TPIM, we used an R package, mirt (Chalmers, 2012). For fitting FTM, GPCM, and TPIM, an independently developed estimation routine was applied (see Supplemental Appendix A, available online, for estimation details). 1 GPCM and TPIM were fit twice to examine the comparability between the estimation programs. The simulation results suggested that two programs yield approximately equivalent outcomes. This article reports the outcomes from the hand-crafted program for simplicity.
Trait Estimation
Examinees’ trait levels were estimated by three estimators: (a) ML, (b) maximum a posteriori (MAP), and (c) expected a posteriori (EAP). The trait inference in the unidimensional models was performed similarly to earlier studies (e.g., Donoghue, 1994; Penfield & Bergeron, 2005; Muraki, 1993). The ML and MAP estimation under the polytomous RTM was performed under the bifactor modeling framework (see Supplemental Appendix B, available online, for details). EAP estimates under RTM were attained from the output of mirt that used stochastic nodes. Except for EAP in RTM, all estimation was performed in the independently developed estimation programs. The Bayesian estimation in RTM assumed
Replication
All simulation conditions were replicated 100 times and the results were summarized by the average of the observed statistics.
Evaluation
The outcomes of the simulation were evaluated in five aspects: (a) relative model fit, (b) absolute item fit, (c) testlet effects, (d) parameter recovery, and (e) classification accuracy.
Goodness of Fit
The model goodness-of-fit was assessed by relative model fit and absolute item fit statistics. The examined model fit measures include: Deviance (i.e., −2 log-likelihood), Akaike information criterion (AIC; Akaike, 1973, 1987), consistent AIC (CAIC; Bozdogan, 1987), Bayesian information criterion (BIC; Schwartz, 1978), and adjusted BIC (ABIC; Sclove, 1987). The absolute item fit was assessed by residual-based measures, including
Significance of Testlet Effect
To evaluate type and size of testlet effect, we conducted statistical tests based on the fitted model outcomes. We mention that each statistical test outlined in Section 3 serves a different purpose and carries different implications. The current study uses significance test results only to demonstrate the patterns across the different models and different response data.
Estimation Eccuracy
The accuracy of the parameter estimates was evaluated by absolute biasedness (ABias), root mean square error (RMSE), product-moment correlation (Cor), and standard error (SE). When examining the item parameter estimates from the ill-fitted models, estimation accuracy was evaluated based on SE only. The precision of person parameter estimates was similarly evaluated applying the absolute bias, RMSE, correlation, and SE. In addition to the trait recovery, we also examined classification outcomes when the examinees were categorized into two groups based on their estimated trait parameters. The evaluated criteria include false positive rate (Type I error), false negative rate (Type II error), sensitivity, and specificity.
Results
Below presents simulation results for each aspect. In each evaluation, we discuss relative performance of the four scoring models and impact of the design variables (e.g., data-generating model,
Relative Model Fit
Table 1 reports relative model fit statistics of the four models evaluated. Observe that TPIM yielded consistently larger log-likelihoods. This is because polytomous scoring of testlet items led to fewer item response category functions and multiplying fewer probability functions led to larger likelihoods. Due to the systematic difference in the likelihoods, we left out TPIM from the model comparison and used the results for reference only. The patterns concerning the other models varied depending on the response data. When data were drawn from GPCM or FTM, GPCM and RTM showed best fitness. GPCM yielded smallest CAIC and BIC; RTM produced smallest deviance statistics. The observed fit statistics were, however, overall comparable across GPCM, RTM, and FTM, and no particular model showed significant outperformance (p > .828). When data were derived from RTM, RTM performed notably better (p < . 001). It showed smallest deviance, CAIC, and BIC statistics across all nonzero
Relative Model Fit.
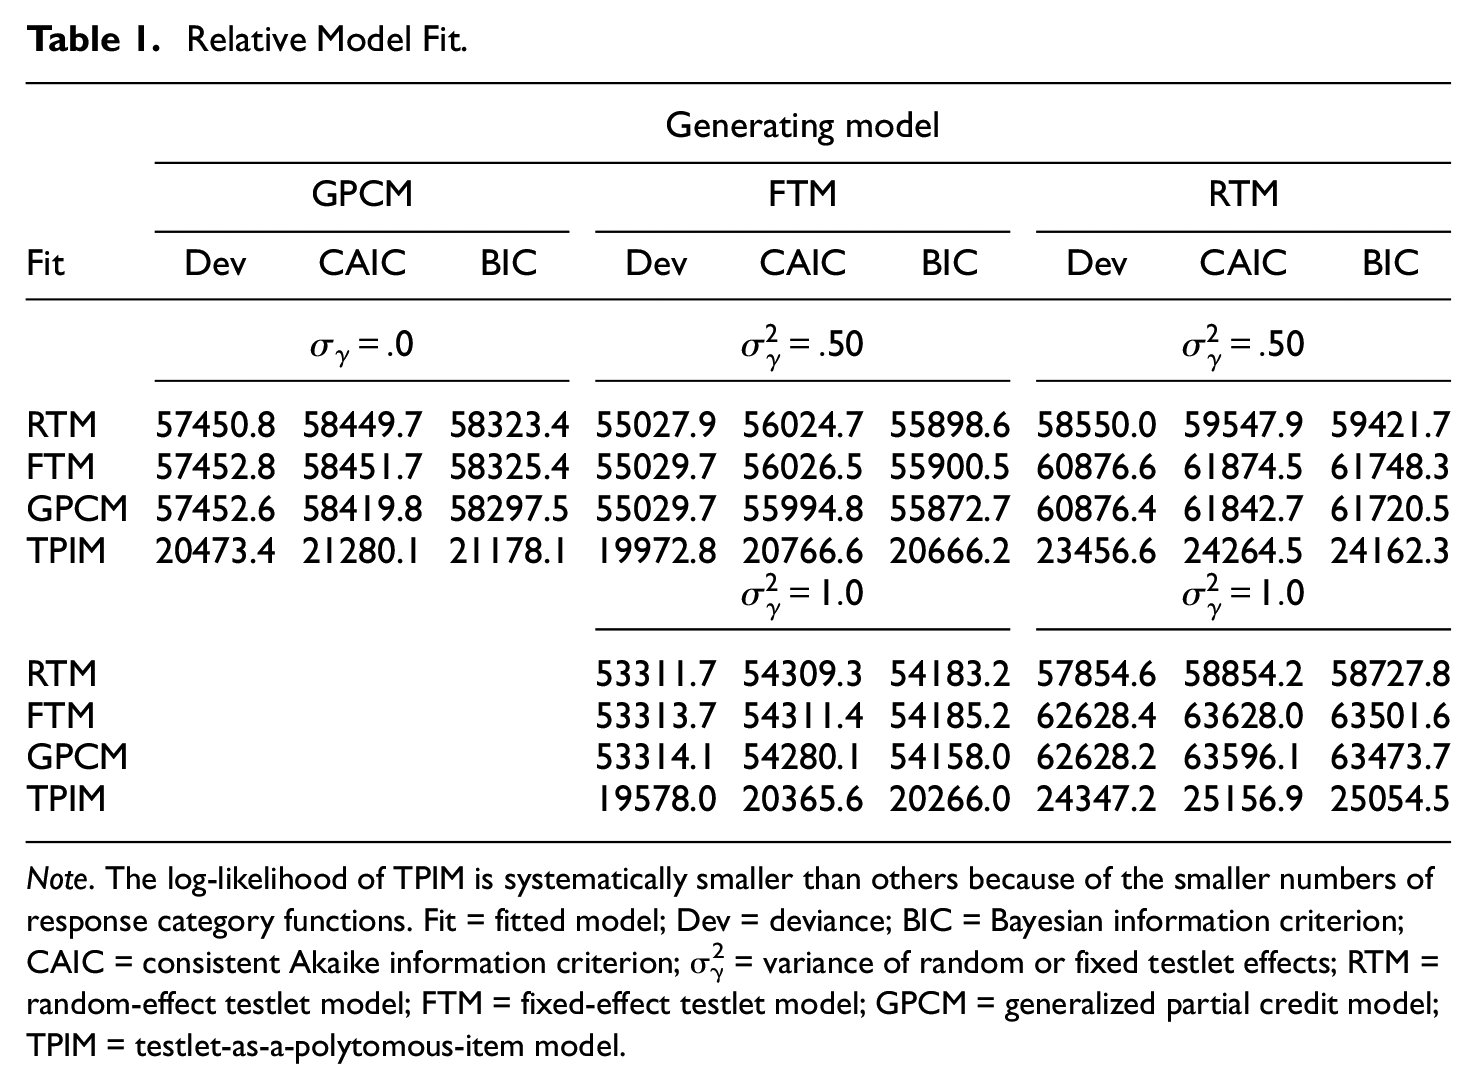
Note. The log-likelihood of TPIM is systematically smaller than others because of the smaller numbers of response category functions. Fit = fitted model; Dev = deviance; BIC = Bayesian information criterion; CAIC = consistent Akaike information criterion; σγ 2 = variance of random or fixed testlet effects; RTM = random-effect testlet model; FTM = fixed-effect testlet model; GPCM = generalized partial credit model; TPIM = testlet-as-a-polytomous-item model.
In Table 1, a consistent pattern was observed with respect to the testlet effect. Increase in
Absolute Item Fit
Presented in Table 2 are item-level fit statistics. The results show that the three models with standard scoring (i.e., GPCM, FTM, RTM) performed stably well. The models produced reasonably small deviance statistics and the proportions of ill-fitting items were maintained mostly below the nominal level. The three models performed comparably when data were obtained from GPCM or FTM (
Absolute Item Fit.
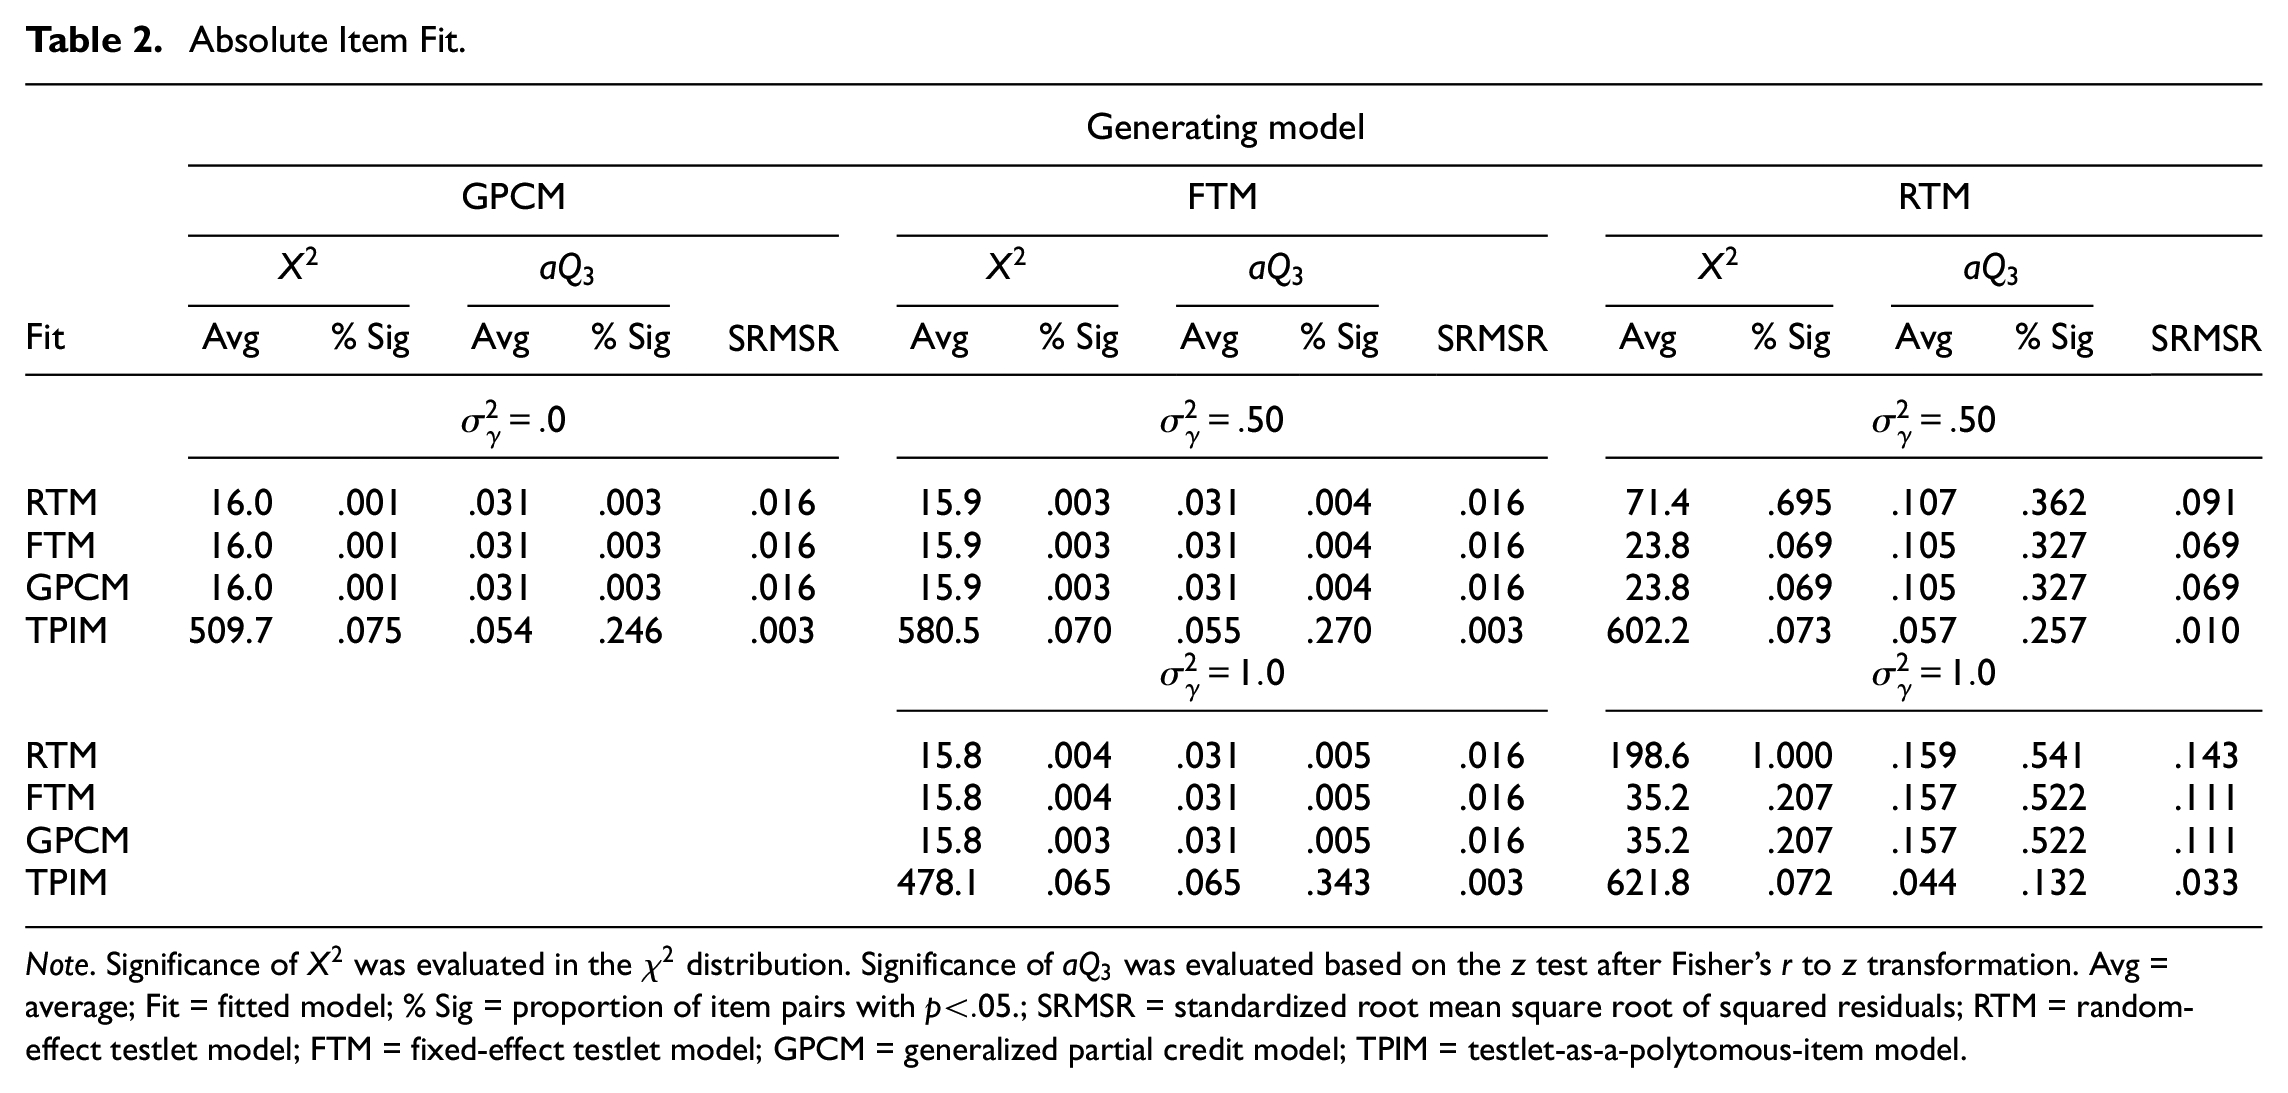
Note. Significance of
Also clear from Table 2 is that TPIM performed least favorably in retrieving the observed data. The items calibrated under the TPIM framework showed largest deviance statistics and highest proportions of misfitting items (i.e., testlets). Although it produced small standardized root mean square residuals, this was largely due to the response scale of the input data. The more the score categories, the more stable computation of product-moment correlation and thus less variation in the correlation coefficients. Together with RTM, while both the models were devised to address random testlet effects, they actually tended to underperform the simpler models in handling the residuals or extra correlations.
Item Parameter Estimation
Table 3 evaluates accuracy of item parameter estimates of the generating models. As can be noted, the true item parameters were well recovered with adequate accuracy. The estimates showed small biasedness and RMSEs and displayed strong positive correlation with the generating parameters. The
Item Parameter Recovery.
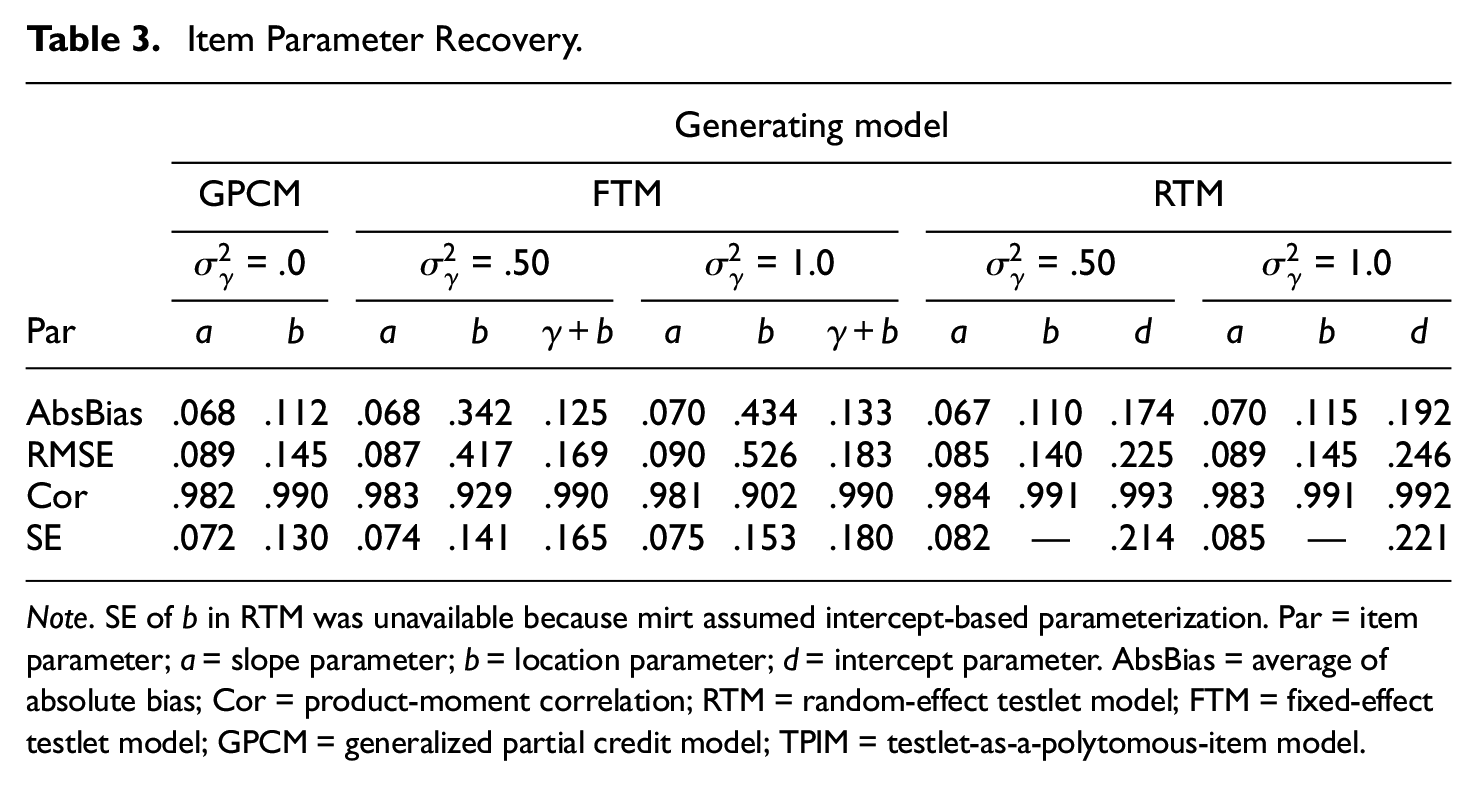
Note. SE of
Table 4 reports average SEs of the item parameter estimates when the models were misfit. The SEs from the correct generating models are repeated for comparison. On the whole, the models maintained errors adequately small despite the mis-specification. Although the models entailed somewhat large SEs in the location parameter estimation, the overall size of the errors was reasonably small. We note that in Table 4, the trends across the design variables are not directly comparable. Since each condition involved unique item parameterization and different testlet effect, the outcomes can only be evaluated within each cell in absolute values.
Average Standard Errors of Item Parameter Estimates When the Models Were Misfit.
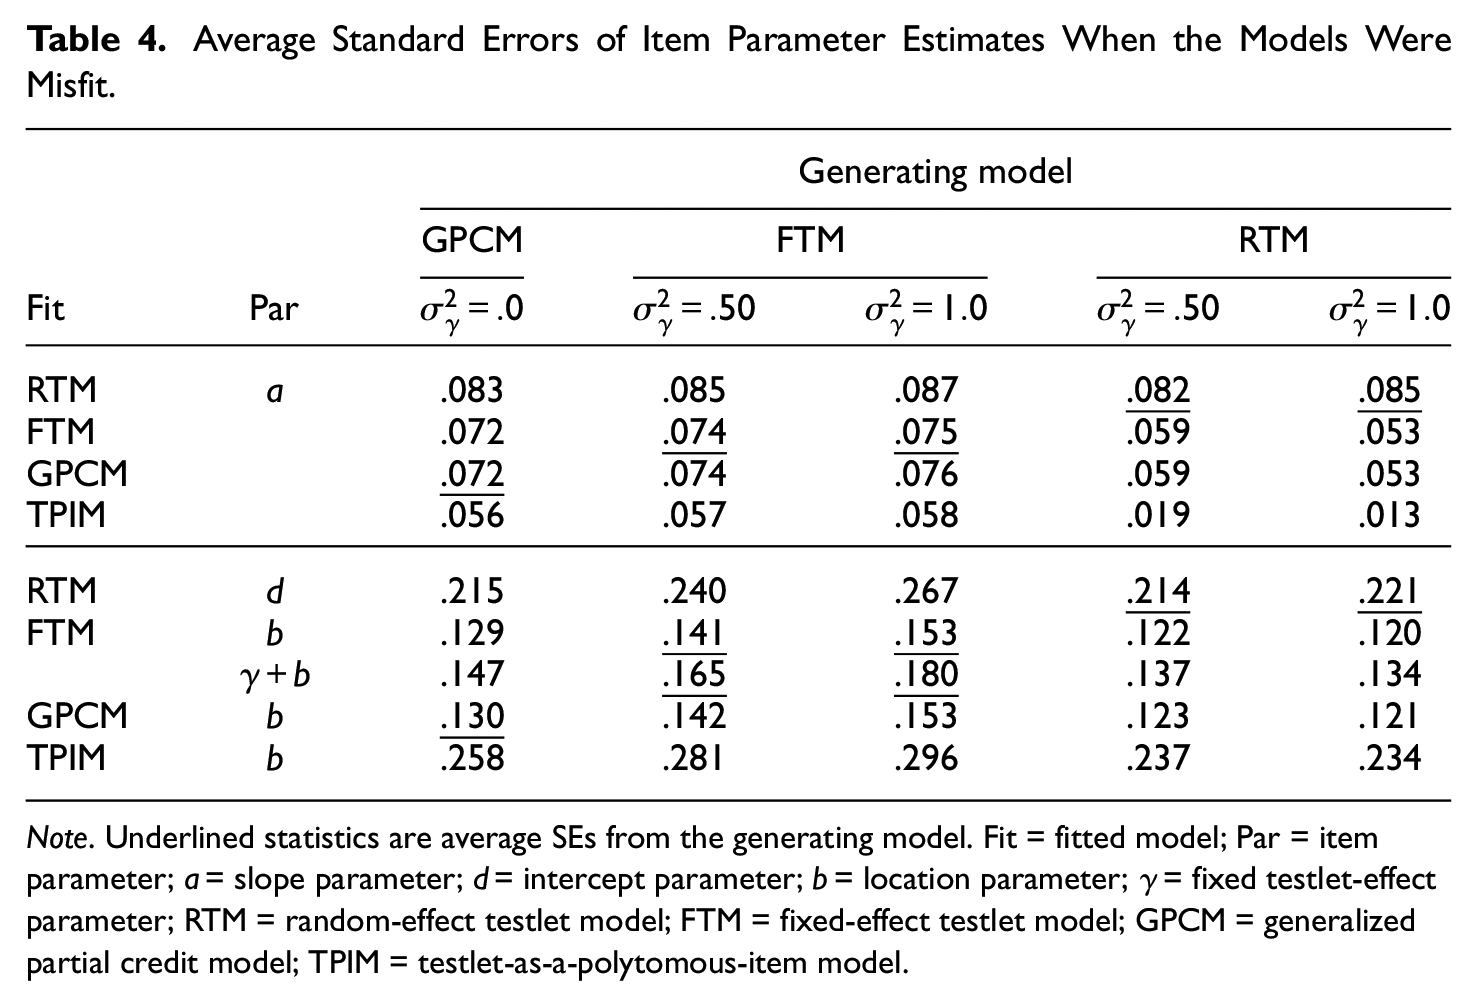
Note. Underlined statistics are average SEs from the generating model. Fit = fitted model; Par = item parameter;
Testlet Effect
The outcomes of the significance tests are reported without tabulation. The likelihood ratio test showed perfect detection rate whenever
Person Parameter Estimation
Table 5 summarizes trait inference results. All in all, the true trait levels were adequately estimated across the different modeling scenarios. While the performance of the scoring models varied depending on the response data and the trait estimator, the overall comparison suggests that GPCM achieved highest accuracy, followed by FTM, TPIM, and RTM. Putting concretely, when data were drawn from GPCM or FTM, GPCM led to most desirable outcomes. The error statistics (i.e., ABias, RMSE) were substantially smaller than those from RTM and TPIM (p < .001) and marginally smaller than FTM (p = .741). When response data followed RTM, GPCM or RTM delivered best performance. In particular, when the ML estimator was used, GPCM and FTM showed substantially smaller error statistics and higher correlation coefficients. When the Bayesian estimators were applied, RTM produced moderately better outcomes. We note that the performance of GPCM and FTM in the ML inference was significantly better than RTM (p < .001), whereas the outperformance of RTM in the Bayesian inference was marginal (p > .140 compared with GPCM, p > .051 compared with FTM). The present results on the whole seemed to suggest that, when there exists little to no random testlet effect, GPCM and FTM are more serviceable as an operating scoring model. When testlets have moderate to large random interaction effects, scoring under RTM with the Bayesian estimators appears more desirable. The detailed relative performance was however strongly dependent on the trait estimator.
Trait Recovery.
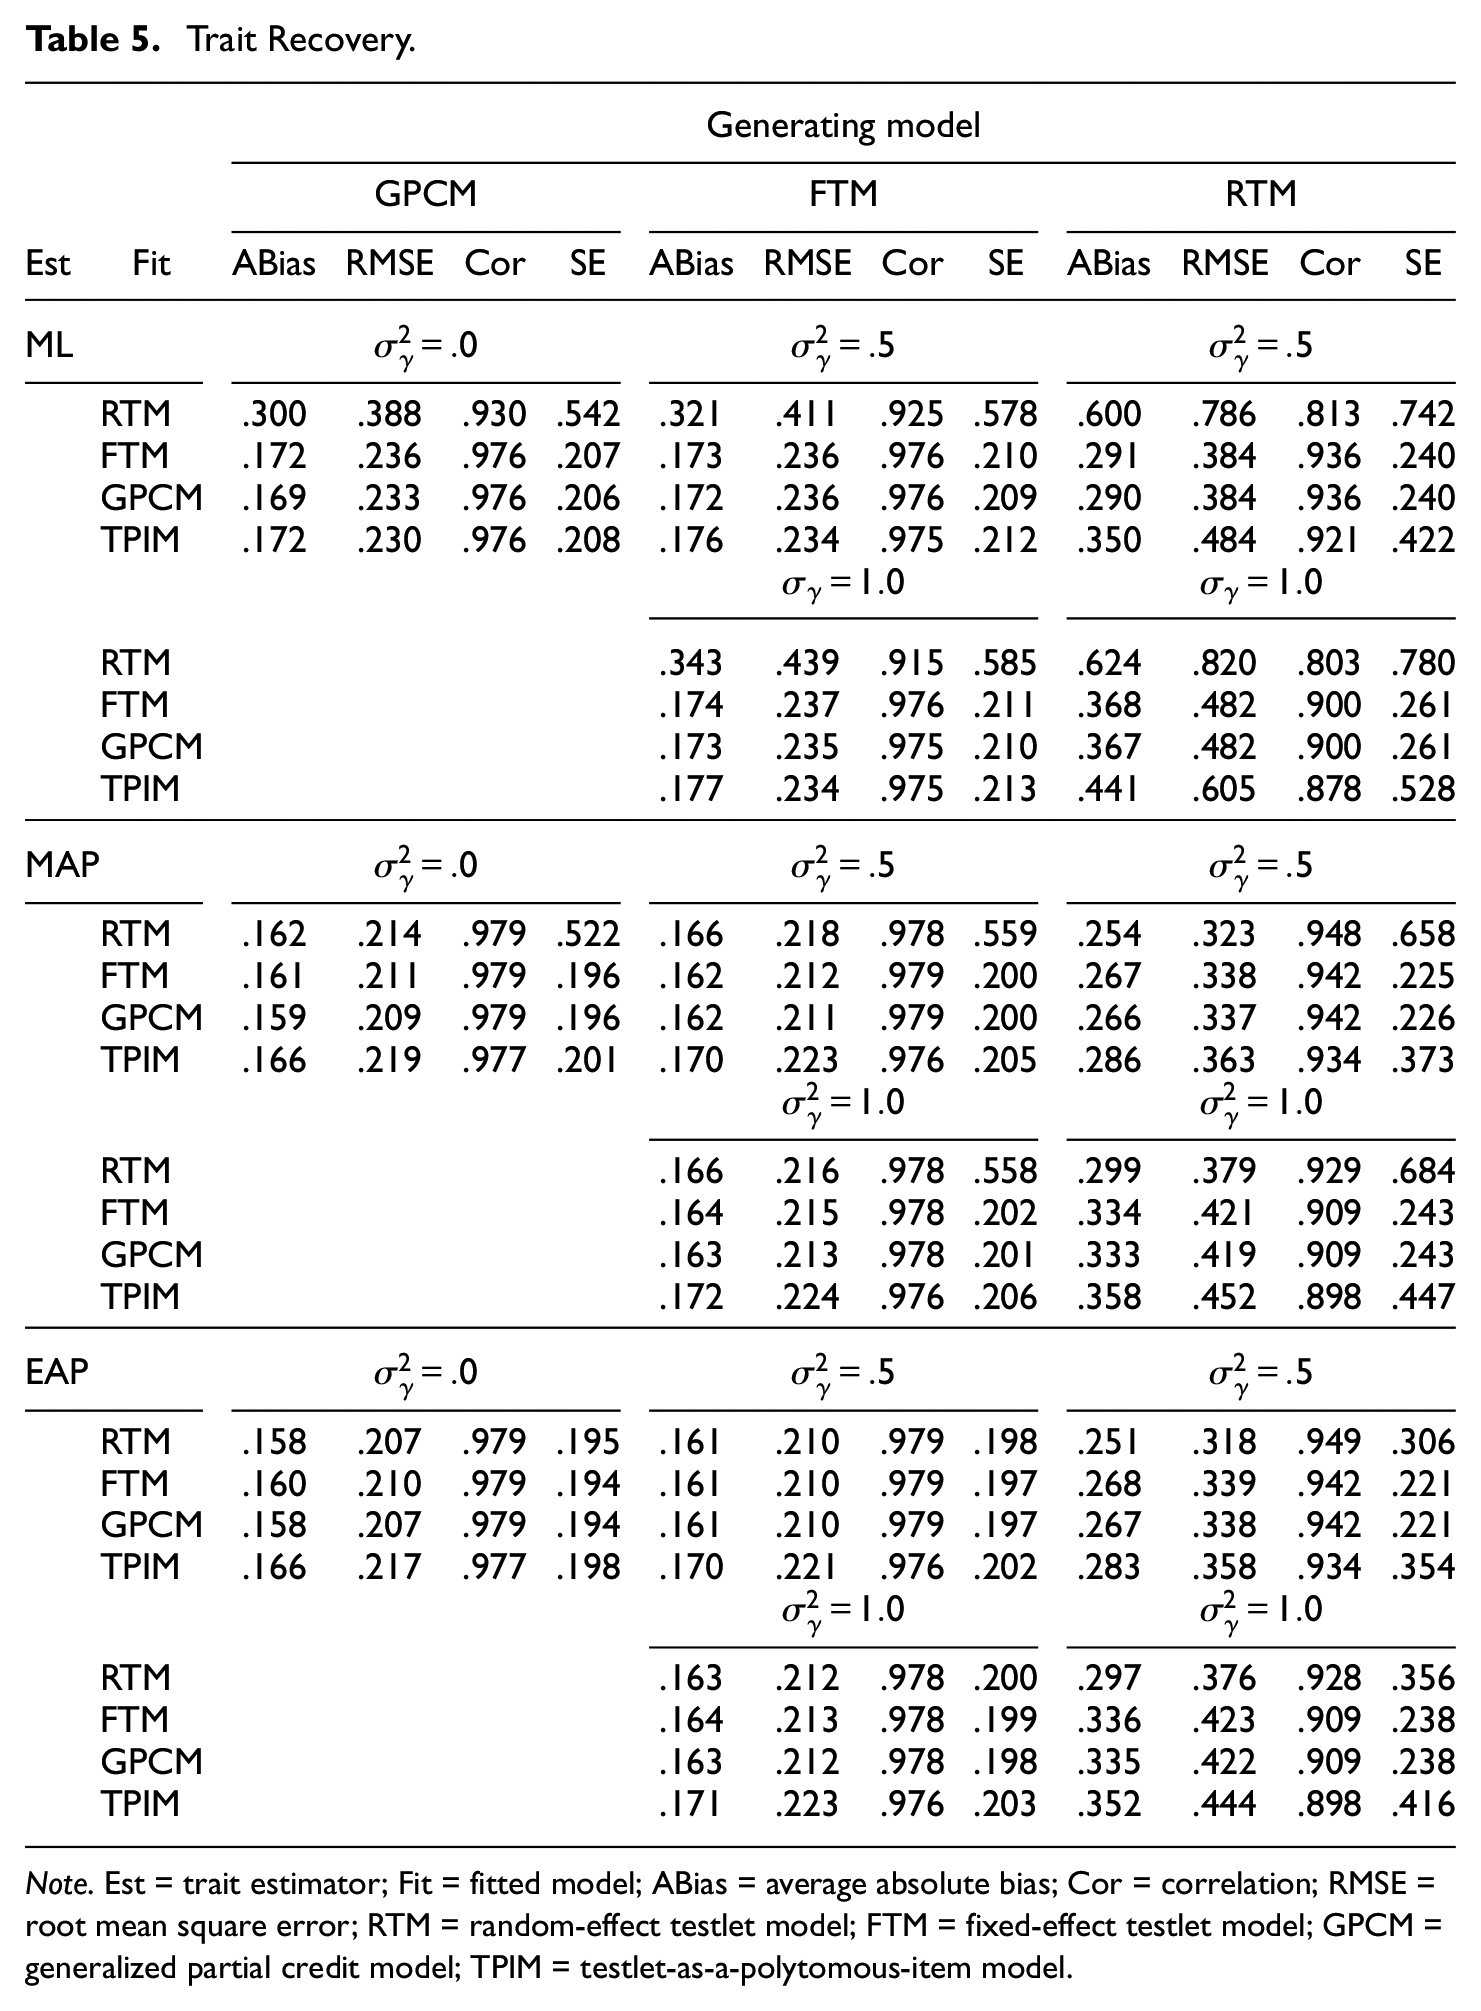
Note. Est = trait estimator; Fit = fitted model; ABias = average absolute bias; Cor = correlation; RMSE = root mean square error; RTM = random-effect testlet model; FTM = fixed-effect testlet model; GPCM = generalized partial credit model; TPIM = testlet-as-a-polytomous-item model.
In Table 5, all design factors had significant impact on the trait recovery. Among the generating models, GPCM- and FTM-generated data entailed smallest error, while RTM data induced relatively larger error. The impact of
Examinee Classification
Table 6 reports classification outcomes when the examinees were classified into two groups based on the estimated trait levels (cutoff = 0). The results show that the scoring models maintained false classification rates adequately low (.039 on average) and correct classification rates reasonably high (.922 on average). On the whole, GPCM and FTM performed significantly better than TPIM and RTM. The difference between GPCM and FTM was marginal (p > .757) whereas those between FTM and TPIM, and between TPIM and RTM were significant (p < .001). As with the trait recovery, Table 6 suggested strong interaction between the models and the trait estimator. When the response data were generated from GPCM or FTM, using each corresponding generating model led to best classification outcomes. Across the evaluation criteria, GPCM, FTM, and TPIM tended to give parallel outcomes (p > .088), while RTM showed substantially subpar performance. When data displayed random interaction effects, the scoring models showed substantially different patterns depending on the trait estimator. When the ML estimator was used, GPCM and FTM consistently outperformed TPIM (p < .001) and RTM (p < .001). Despite the distinct random testlet effects, RTM yielded subnormal classification outcomes throughout. When the Bayesian estimators were applied, RTM yielded distinctly accurate classification results. Especially when
Classification Accuracy.
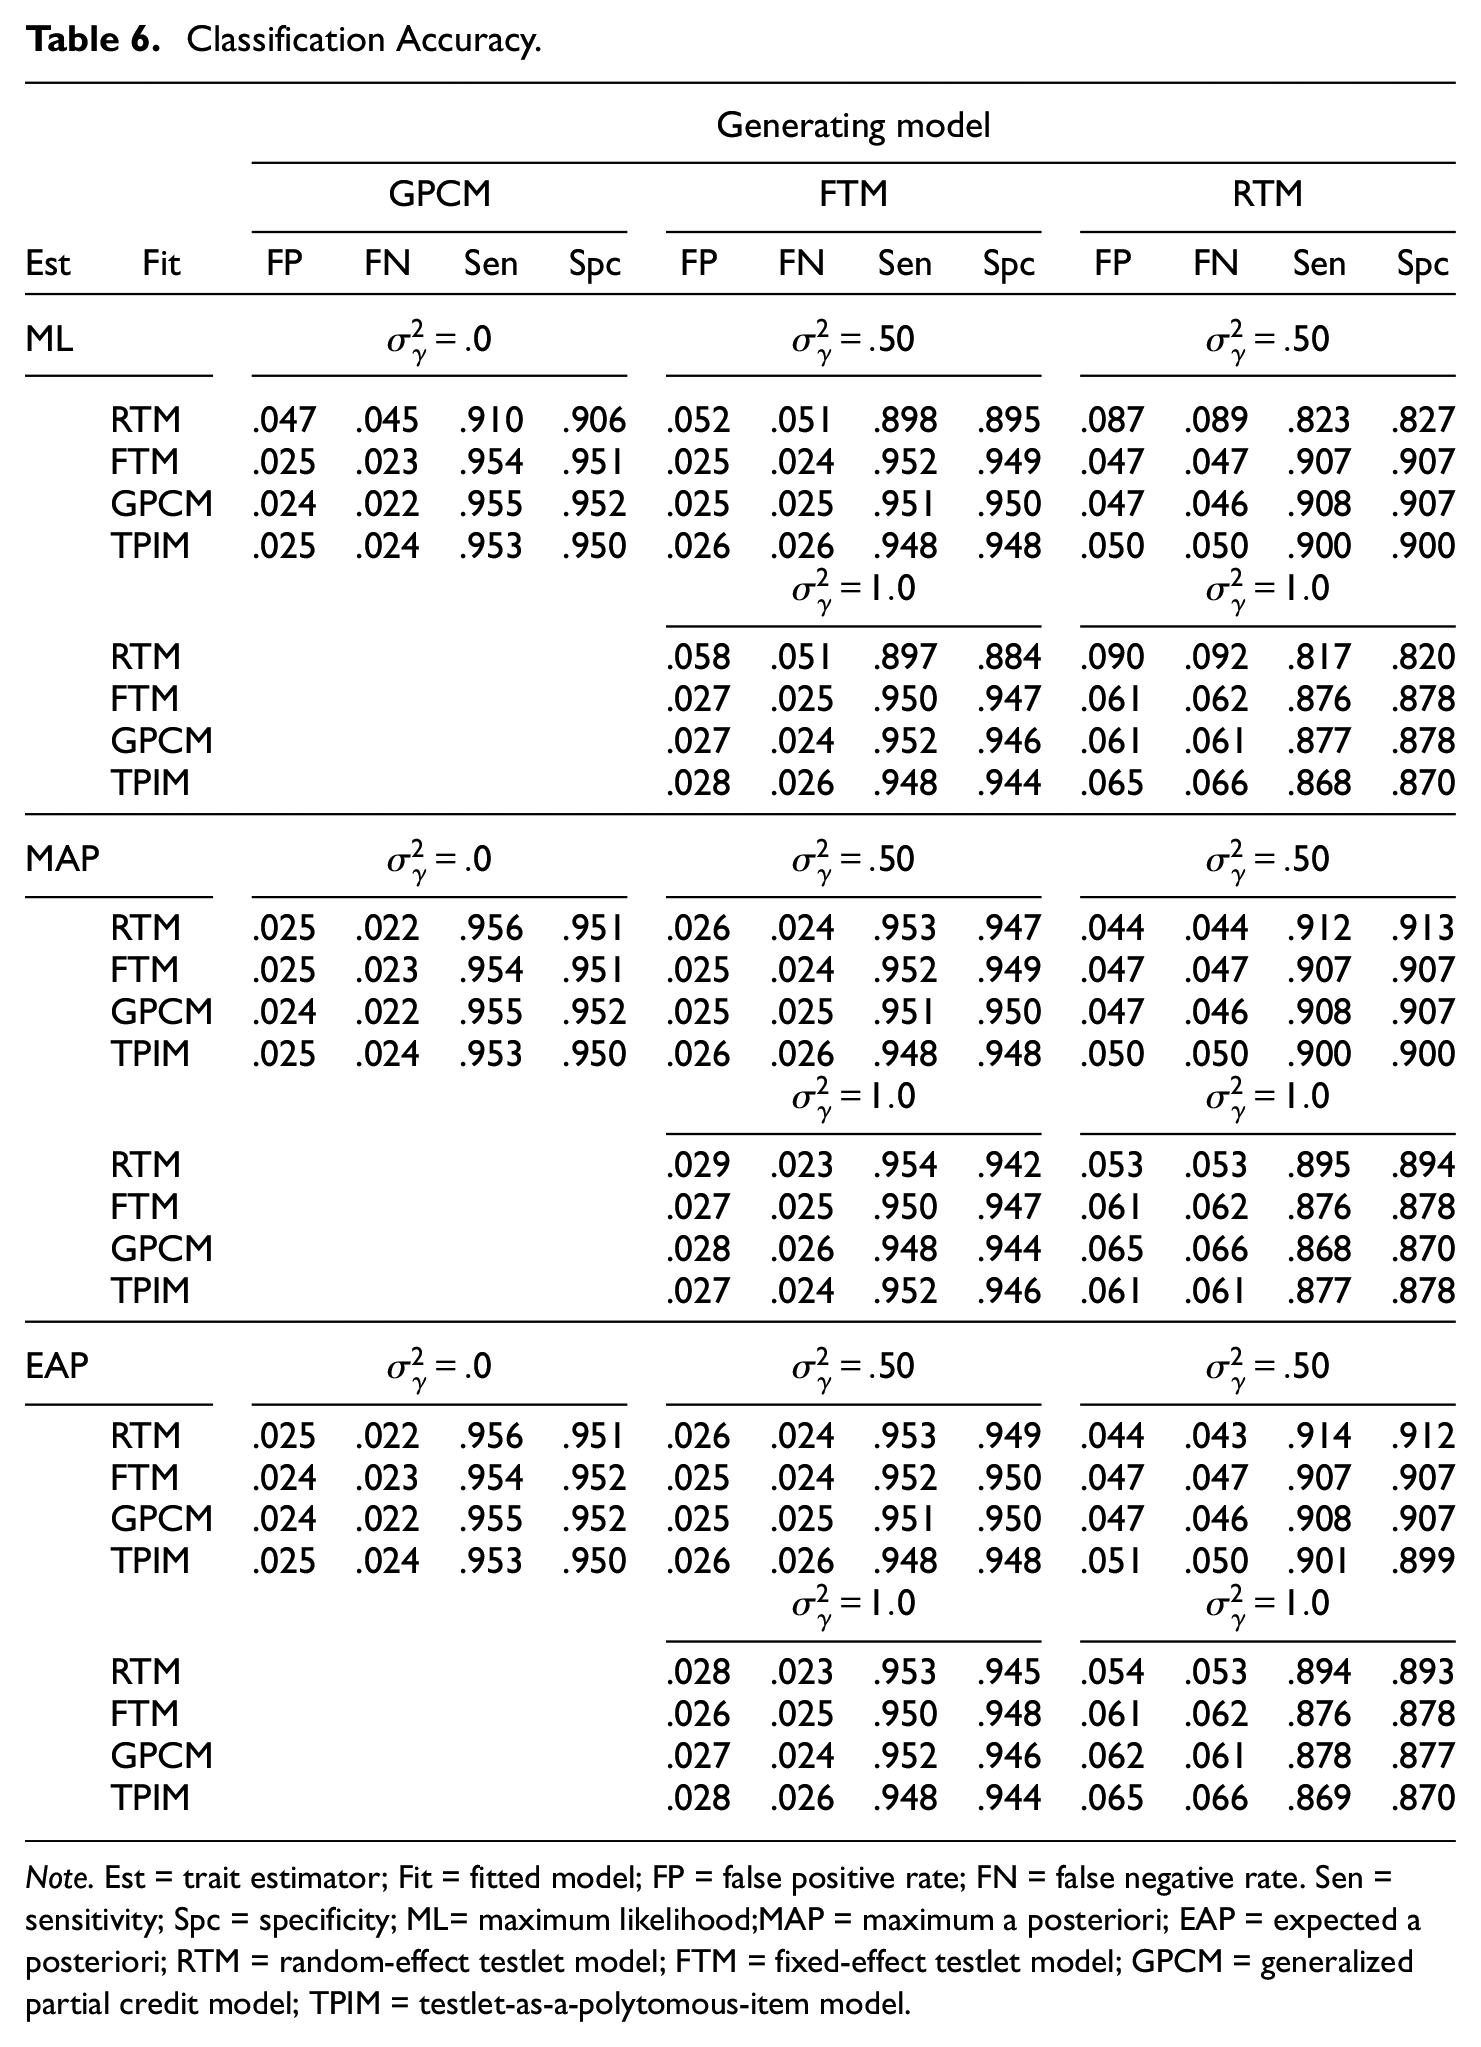
Note. Est = trait estimator; Fit = fitted model; FP = false positive rate; FN = false negative rate. Sen = sensitivity; Spc = specificity; ML= maximum likelihood;MAP = maximum a posteriori; EAP = expected a posteriori; RTM = random-effect testlet model; FTM = fixed-effect testlet model; GPCM = generalized partial credit model; TPIM = testlet-as-a-polytomous-item model.
The trends relating to the estimator and the testlet effect-size were consistent with those reported earlier. The MAP and EAP estimators showed smaller classification errors (.036 on average) and higher success rates (.927) than the ML estimator (.044 and .911 each; largely attributable to RTM). Increase in the testlet effect-size negatively affected the classification accuracy. For each increasing
Empirical Data Analysis
In this section, we present an example analysis of empirical data to demonstrate the application of the models in real test settings. The data were obtained from a large-scale standardized licensure assessment program in the United States. We analyzed five test forms that were administered as a part of field-testing of technology-enhanced innovative items. We conducted analysis similarly to the previous section—fitting four measurement models and carefully examining the fitted outcomes. The results were overall consistent across the test forms. This section presents the results of one test form as an illustrative example.
Data
The data set contained 1,316 examinees’ responses to 12 innovative items. The items were administered in two testlets with each containing six items. Each testlet had a total score of 16 and 24, and the items had maximum scores between two and six. We note that the data were collected as a part of voluntary field-testing, and the examinee sample was somewhat homogeneous in the ability distribution.
Analysis
The study applied the four polytomous testlet models to analyze the response data. As with the simulation study, we applied mirt to fit RTM, GPCM and TPIM; and the independently developed estimation program to fit FTM, GPCM, and TPIM. The outcomes of the two calibration programs were almost identical when the model was conditioned on GPCM and TPIM. For simplicity, we report the results from the handcrafted program only. The results were evaluated in three aspects: (a) the relative and absolute goodness-of-fit, (b) the type and size of testlet effect, and (c) parameter agreement between the scoring models. The specific evaluation criteria followed those reported in Section 4.
Results
Goodness of Fit
Table 7 reports model and item fit statistics. TPIM again showed distinctly smaller model fit statistics as a result of fewer response category functions. Among the three models that applied regular scoring, RTM was most preferred by Deviance and ABIC, and GPCM was most preferred by CAIC. The preference for GPCM in CAIC was chiefly due to the smaller number of free parameters. Table 7 also shows that item-level fit statistics similarly pointed RTM as a best fitting model. RTM yielded smallest deviance statistics and maintained the lowest proportions of ill-fitting item pairs. GPCM and FTM produced somewhat larger statistics but the values were generally comparable to those of RTM.
Model Fit Evaluation in Real Data.
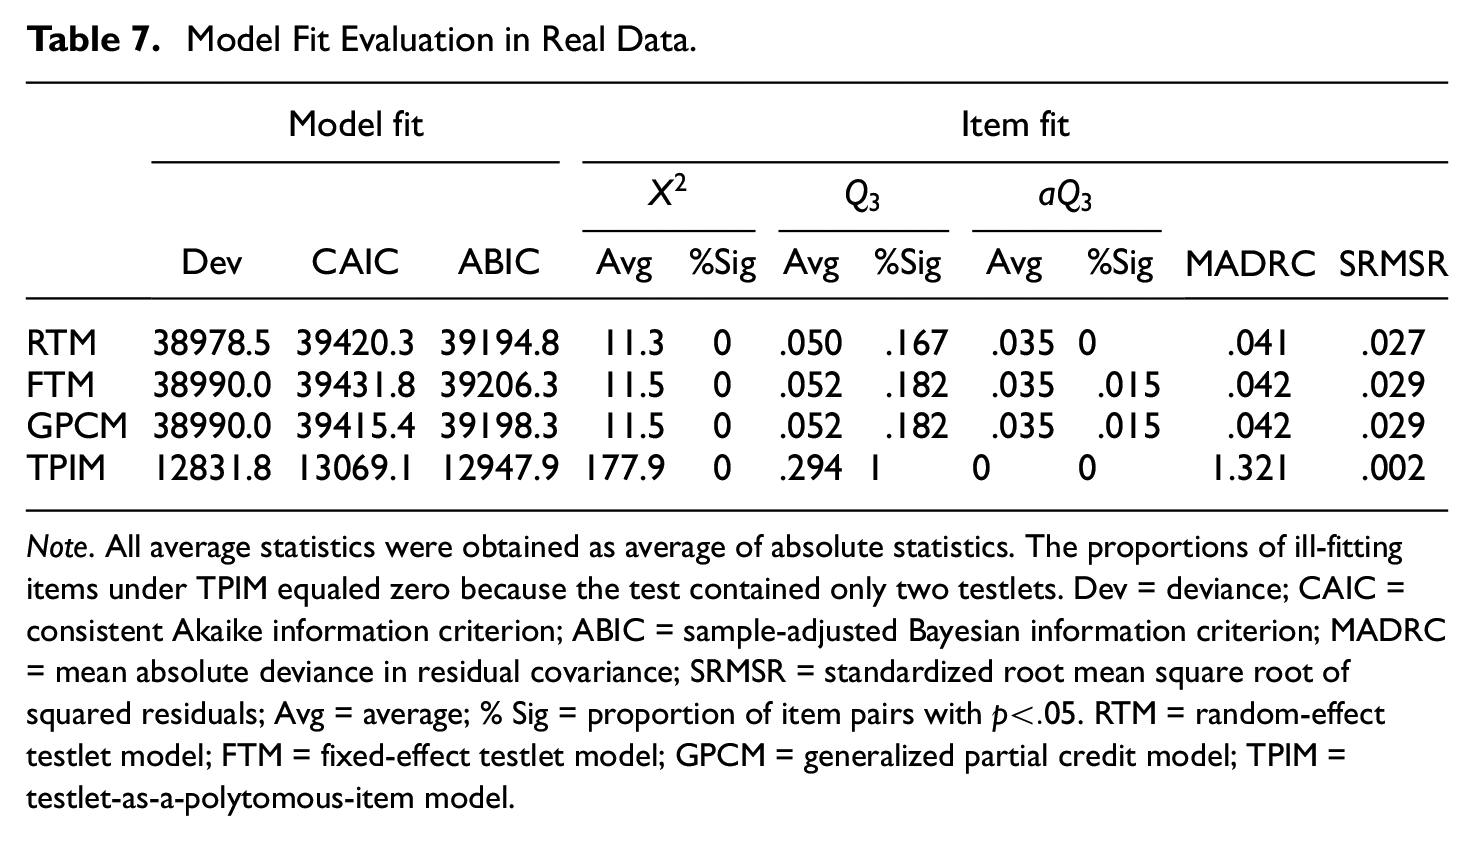
Note. All average statistics were obtained as average of absolute statistics. The proportions of ill-fitting items under TPIM equaled zero because the test contained only two testlets. Dev = deviance; CAIC = consistent Akaike information criterion; ABIC = sample-adjusted Bayesian information criterion; MADRC = mean absolute deviance in residual covariance; SRMSR = standardized root mean square root of squared residuals; Avg = average; % Sig = proportion of item pairs with
Testlet Effect
Table 8 reports outcomes of significance testing that evaluates testlet effects. The likelihood ratio test suggests that RTM achieved significantly better fit over GPCM, indicating strong random interaction effects (p < .012). Note that the test can evaluate testlet effects only at the test level. It remains unclear which testlet had significant interaction. The score test indicated somewhat different conclusions. Both the testlets showed no significant violation of the assumptions of GPCM. It seemed that, despite the better fitness of RTM, the ML estimates of GPCM reasonably achieved zero score without significant disparity. The Wald test similarly indicated that testlets had no significant fixed effects. Although the second testlet showed a
Testlet Effect Evaluation in Real Data.
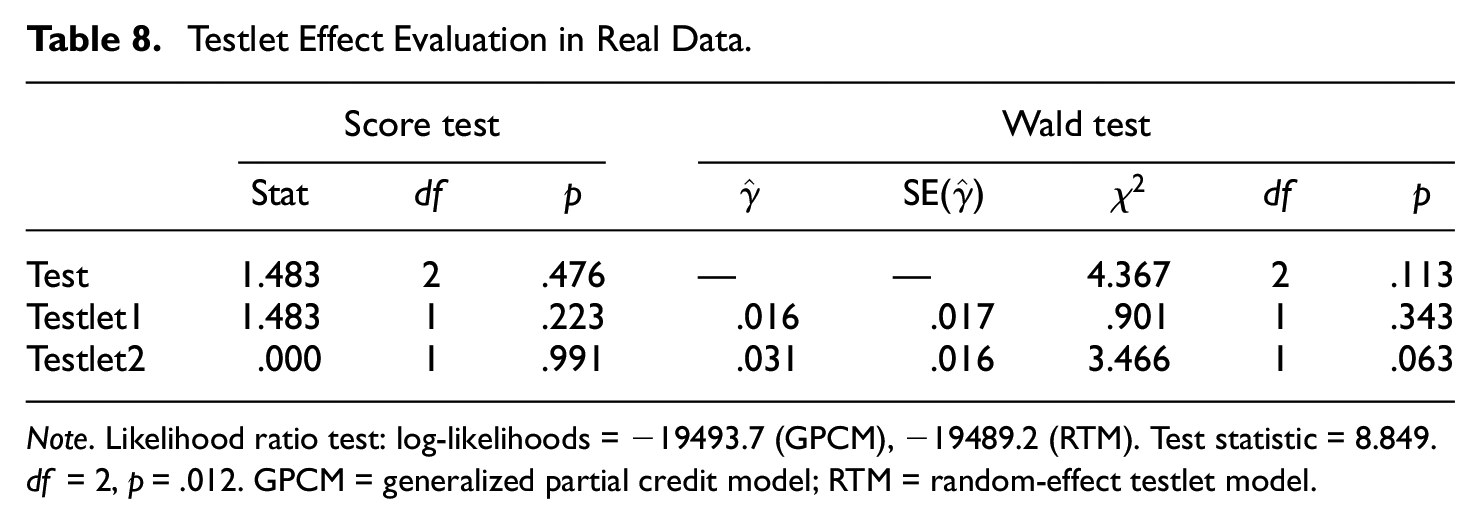
Note. Likelihood ratio test: log-likelihoods = −19493.7 (GPCM), −19489.2 (RTM). Test statistic = 8.849.
Item Parameter Estimates
Figure 1 compares item parameter estimates across the different fitting models. As can be noted, the three models showed close correspondence in the parameter values. The estimates from GPCM and FTM closely resembled those from RTM despite the significant random testlet effects. The comparable item parameter values in particular suggest that the three models are likely to perform similarly in trait inference.
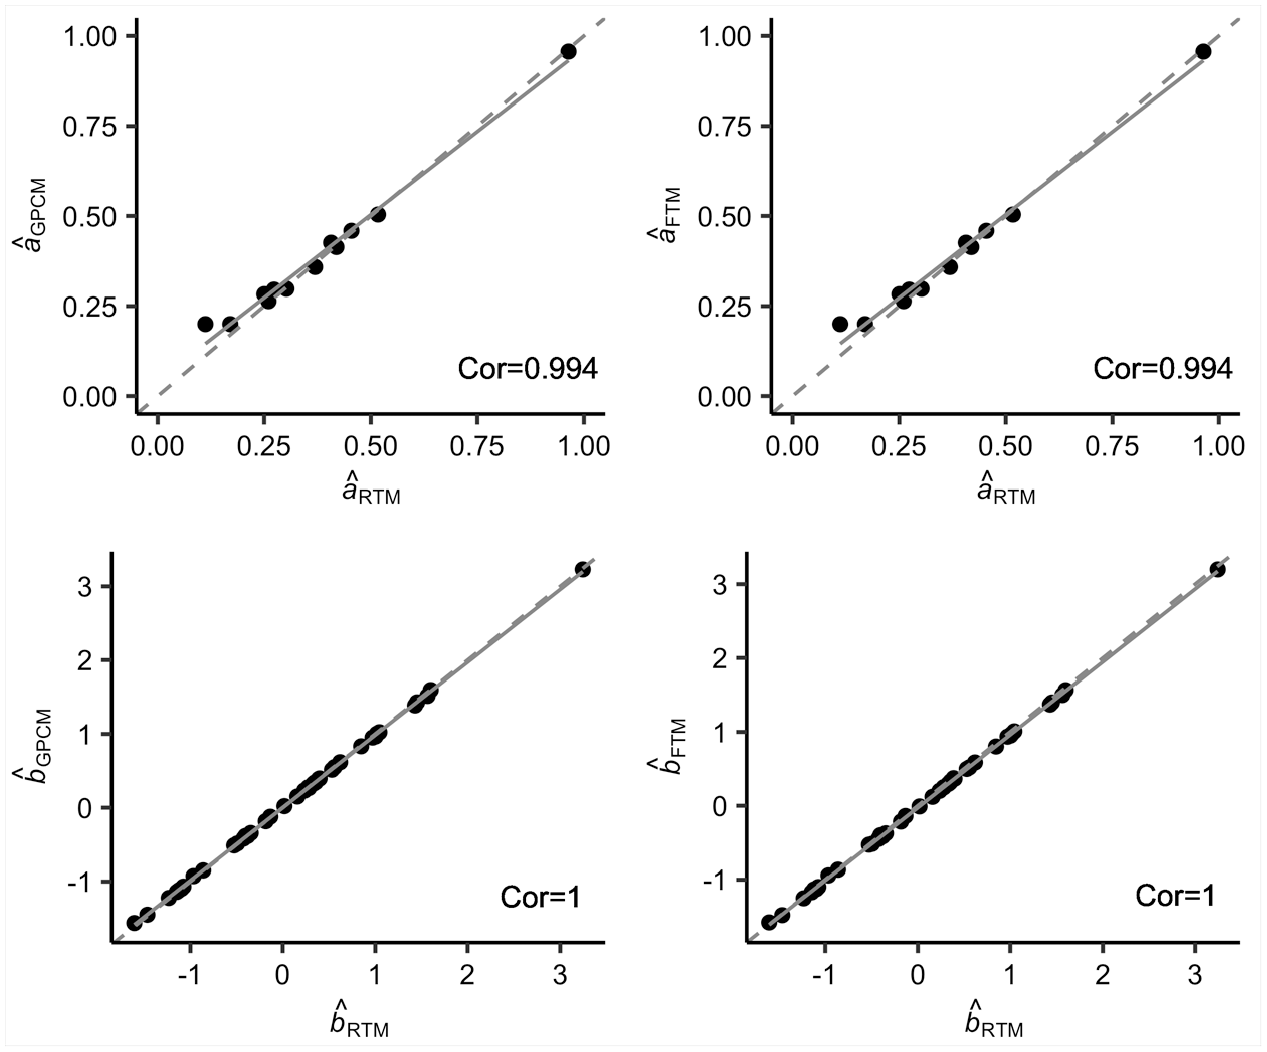
Correspondence of item parameter estimates
Person Parameter Estimates
To examine the patterns in trait inference, we compared the ability estimates from the four scoring models. Figure 2 plots the ability levels estimated from the three trait estimators. As can be seen, the performance of the models varied depending on the estimator. When the ML estimator was used, RTM showed distinctly different patterns from the alternative scoring models, exhibiting correlations between .268 and .462 with the other models. The unidimensional models showed very comparable performance with average correlation of .981 in the same setting. We surmise that the distinct performance of RTM is due to increased uncertainty from the testlet factors as well as the sampling error entailed by the real data. When the simulated data were examined, RTM performed comparably to other models, showing average correlations of (.901, .888, .871) with the other models under each
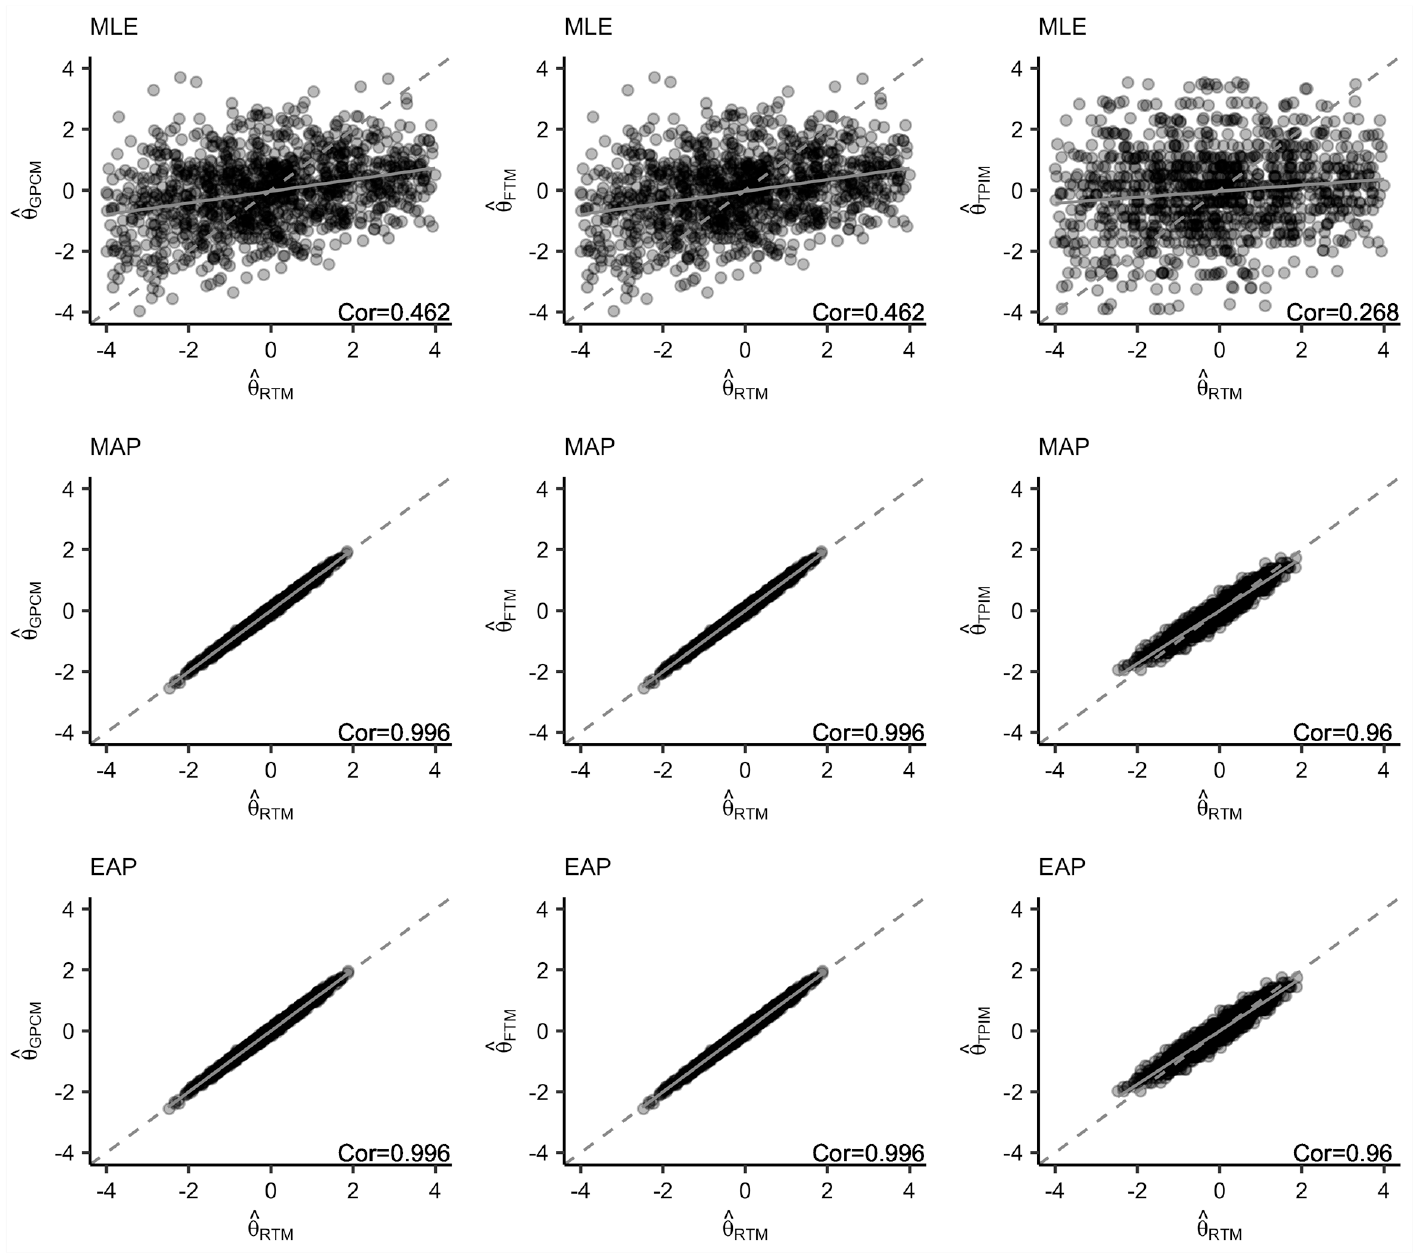
Correspondence in Person parameter estimates.
Conclusion
The purpose of this study was to investigate practical scoring models for polytomous testlet items and evaluate their performance in various test response data. The study considered four models for investigation: GPCM, TPIM, RTM, and FTM. The response data were simulated from GPCM, FTM, and RTM—each assuming no, fixed, and random testlet effects. The study also used the empirical assessment data to examine the performance in real test settings. The behavior of the models was evaluated broadly in five aspects: relative model fit, absolute item fit, significance of testlet effects, item and trait parameter recovery, and classification accuracy.
The empirical experimentation suggests that the three models with standard scoring overall perform comparably. While the specific performance varied depending on the data-generating model, trait estimator, and
The two particular models considered in this study, TPIM and FTM, deserve further comments. Throughout the study, we found that TPIM has limited promise as a practical alternative to RTM. Apart from the limitations documented in the literature (e.g., loss of information, unfair equating of items), TPIM tended to experience a frequent convergence problem due to data sparsity. The fitted outcomes also showed substantially different patterns from those of the item-level measurement models. In addition to the estimation problem, coalescing multiple polytomous items made it difficult to interpret the item parameters while also impeding item-level analysis (e.g., item difficulty, information, differential item functioning). Taken altogether, we conclude that TPIM is the least favored approach for scoring polytomous testlet items.
The second comment concerns FTM. We noted that simultaneous estimation of
We conclude the article with limitations of the study and future research directions. First, the current study fixed some of the design factors to keep the scope of work manageable. A more systematic study may be conducted in the future investigating interaction between the scoring models and different design factors. For example, in applied settings, tests are commonly administered in a mixture of independent items and testlet items and testlets can vary in the composition of items (e.g., the type and number of items, testlet effect-size). A future study may examine the performance of the models under varying levels of these factors and consequence of using a simpler and more practicable scoring model. Second, our experience from the current study suggests that the use of TPIM generally leads to unsatisfactory outcomes when items have many response categories and/or testlets include large numbers of items. When polytomous scoring of testlet items involves high degree of multiplicity in response scores, one may consider continuous response models (Mellenbergh, 1994; Müller, 1987; Samejima, 1974) as an alternative to TPIM. For example, our analysis of real innovative items suggests that polytomous scoring of polytomous testlet items can have response scores on quite wide scales (e.g., 20-50). In these cases, it may be more desirable to apply the continuous response models to circumvent the convergence problems and to retain the information across the response scores. For appropriate applications of the continuous response models, substantive scientific evidence must be precedented that the continuous models can adequately address the local dependence within testlets.
Supplemental Material
sj-pdf-1-epm-10.1177_00131644211032261 – Supplemental material for Polytomous Testlet Response Models for Technology-Enhanced Innovative Items: Implications on Model Fit and Trait Inference
Supplemental material, sj-pdf-1-epm-10.1177_00131644211032261 for Polytomous Testlet Response Models for Technology-Enhanced Innovative Items: Implications on Model Fit and Trait Inference by Hyeon-Ah Kang, Suhwa Han, Doyoung Kim and Shu-Chuan Kao in Educational and Psychological Measurement
Supplemental Material
sj-zip-2-epm-10.1177_00131644211032261 – Supplemental material for Polytomous Testlet Response Models for Technology-Enhanced Innovative Items: Implications on Model Fit and Trait Inference
Supplemental material, sj-zip-2-epm-10.1177_00131644211032261 for Polytomous Testlet Response Models for Technology-Enhanced Innovative Items: Implications on Model Fit and Trait Inference by Hyeon-Ah Kang, Suhwa Han, Doyoung Kim and Shu-Chuan Kao in Educational and Psychological Measurement
Footnotes
Declaration of Conflicting Interests
The authors declared no potential conflicts of interest with respect to the research, authorship, and/or publication of this article.
Funding
This work was supported by the National Council of State Boards of Nursing, UTA19-000392.
Supplemental Material
Supplemental material for this article is available online.
Notes
References
Supplementary Material
Please find the following supplemental material available below.
For Open Access articles published under a Creative Commons License, all supplemental material carries the same license as the article it is associated with.
For non-Open Access articles published, all supplemental material carries a non-exclusive license, and permission requests for re-use of supplemental material or any part of supplemental material shall be sent directly to the copyright owner as specified in the copyright notice associated with the article.