
Abstract
The purpose of this study is to introduce a functional approach for modeling unfolding response data. Functional data analysis (FDA) has been used for examining cumulative item response data, but a functional approach has not been systematically used with unfolding response processes. A brief overview of FDA is presented and illustrated within the context of unfolding data. Seven decision parameters are described that can provide a guide to conducting FDA in this context. These decision parameters are illustrated with real data using two scales that are designed to measure attitude toward capital punishment and attitude toward censorship. The analyses suggest that FDA offers a useful set of tools for examining unfolding response processes.
Functional data analysis (FDA) is an approach to statistics that focuses on families of functions or smooth curves (Kokoszka & Reimherr, 2017; Levitin et al., 2007; Ramsay & Silverman, 2005). Some recent applications of FDA include modeling COVID-19 prevalence (Oshinubi et al., 2022), forecasting demand for electricity (Shah et al., 2022), visualizing weather patterns (Suhaila, 2021), analysis of neural networks related to Alzheimer’s disease (S. Wang et al., 2021), and identification of hospitalization rates related to dialysis (Li et al., 2021). Applications to data in education and psychology are less well developed, although there are some exceptions including the modeling of longitudinal data (Marcoulides & Khojasteh, 2018), nonlinear growth curve modeling (Suk et al., 2019), and cumulative item response models (Woods, 2006).
In psychometric applications, the data are typically discrete and consist of zeros and ones indicating incorrect/correct or disagree/agree answers to test items. These discrete responses are assumed to arise from underlying smooth functions that are reflected in various item response models (Baker & Kim, 2004; De Ayala, 2013; Van der Linden, 2019). Examples of these underlying smooth functions include item and person response functions. FDA can be used to model these smooth functions from the discrete response patterns obtained from educational and psychological tests. In psychometrics, functional analyses have been used to analyze item response functions (Ramsay, 2016; Woods, 2006).
Unfolding models are also referred to as ideal point models (Engelhard & Yuan, in press). These models involve the estimation of smooth curves designed to represent item and person responses that are noncumulative in form. These curves were called maximum probability responses by Thurstone (Thurstone & Chave, 1929), and he distinguished them from increasing or cumulative probability responses. Figure 1 shows an increasing probability item in Panel A and two maximum probability items in Panel B. In dichotomous unfolding models, the probability of endorsing an item (x = 1) is a function of the distance between the person and item locations on the underlying latent variable (Coombs, 1964; Engelhard & Yuan, in press).
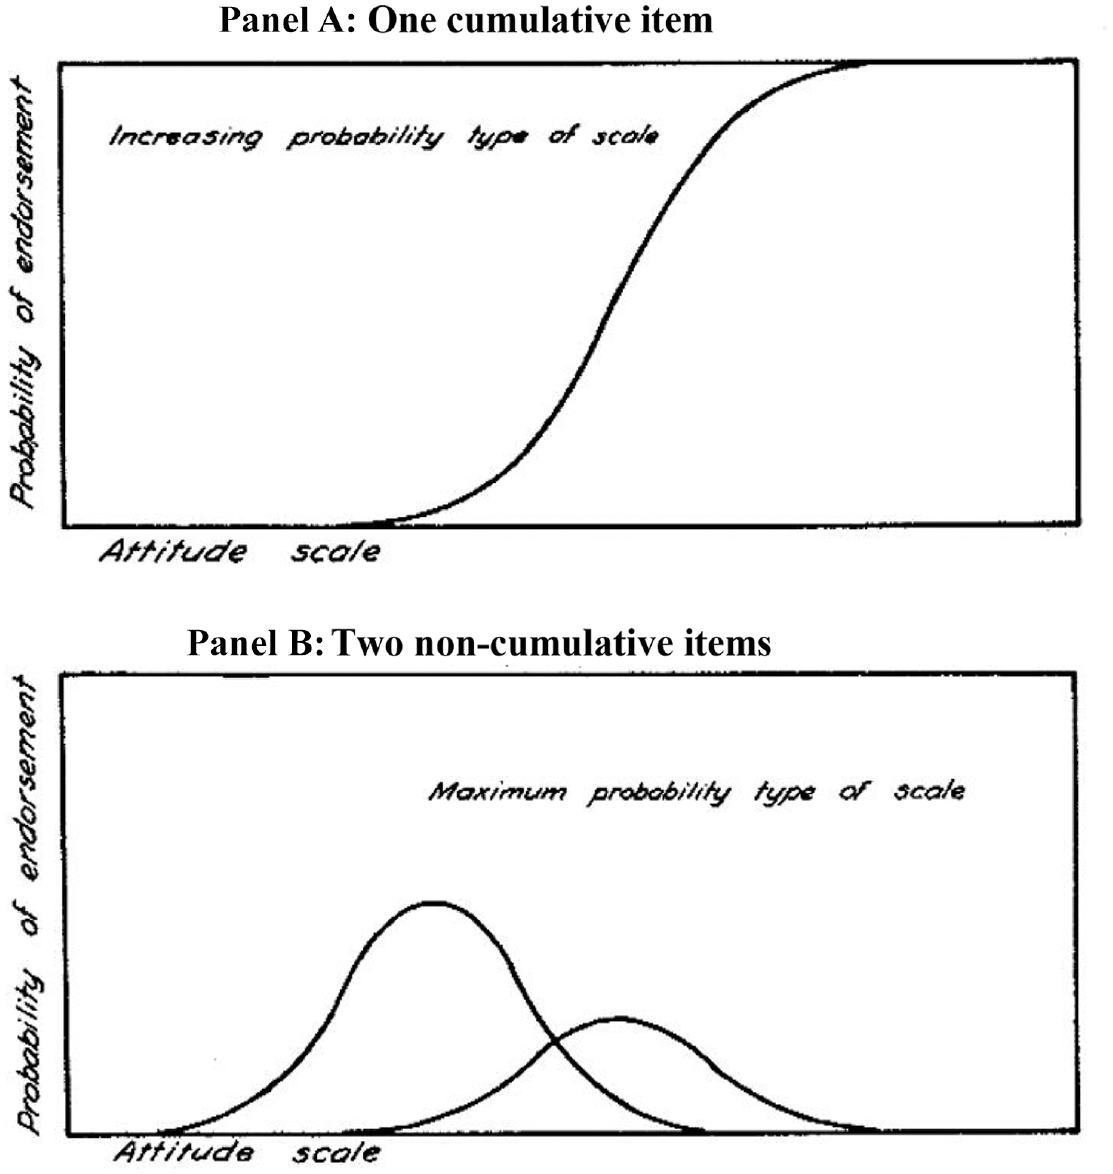
Increasing Probability (One Item) and Maximum Probability (Two Items) Scales
The purpose of this study is to describe and illustrate functional approaches for modeling unfolding data. The study is structured in the following way. First, FDA is briefly presented including functional clustering. Next, the unfolding response process is described with a short illustration of a functional approach. This is followed by two applications of FDA to attitude scales designed to measure attitudes toward capital punishment and censorship that reflect unfolding response processes. In essence, the goal is to provide evidence to support future research and applications of FDA with unfolding data.
Functional Data Analysis
Functional data occur when the observations are collected from a smooth curve or function (Kokoszka & Reimherr, 2017; Ramsay & Silverman, 2005). These observations can be discrete measurements that reflect smooth variation in the underlying variable. Functional data analysis extends the ideas and aims of traditional statistical analyses to samples of curves represented by functions. The smooth curves are assumed to have similar shapes, and, therefore, can be approximated as a linear combination of K-independent basis functions expressed as
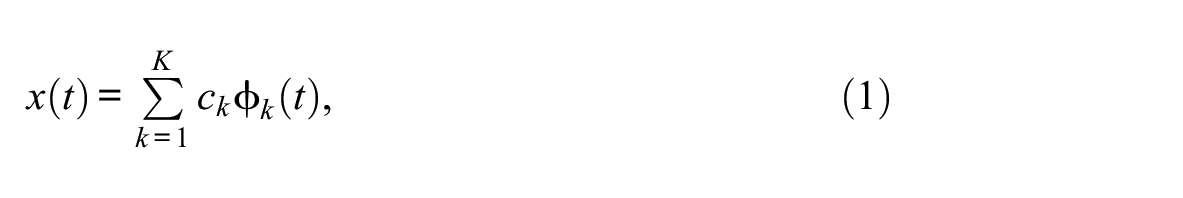
where
In the case of B-splines, the functions are expressed as piecewise polynomial functions joined together at knots that separate the x-axis into subintervals. Figure 2 illustrates the structure of B-splines that are used in this study. B-splines are based on piecewise polynomials that can be combined to represent a flexible set of functions. The B-splines are shown in the last panel with equally spaced knots (vertical gray lines). The functions shown in Panels A to E are weighted by spline coefficients (
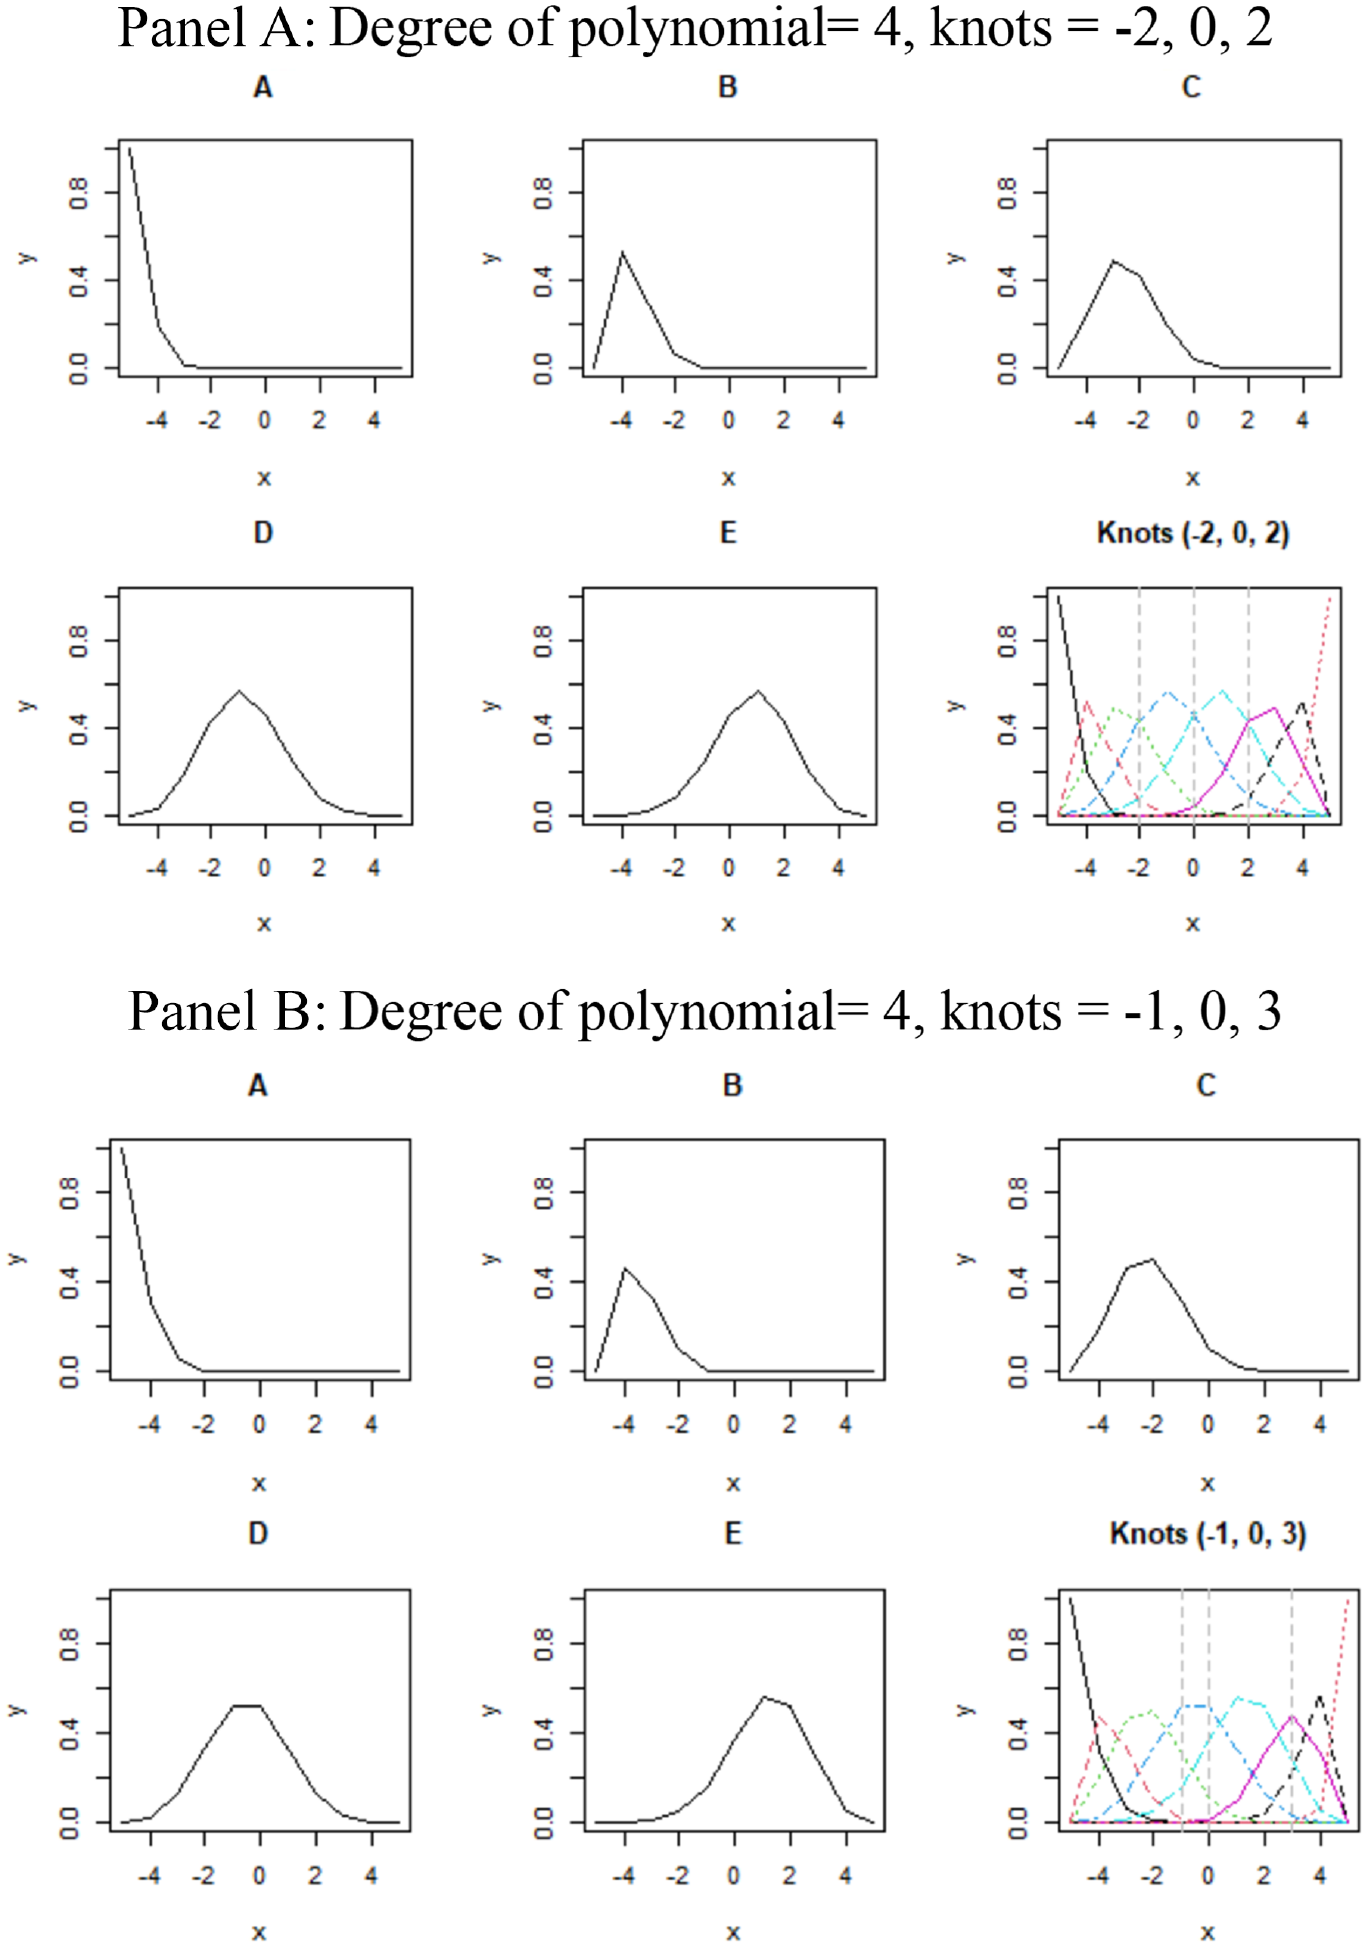
Basis Function Based on B-Splines With Different Locations of the Knots
The polynomials can be of different degrees, and the researcher can control the shape and flexibility of the estimated function by changing the degree of the polynomials in the B-spline basis expansion. Figure 3 illustrates examples of several choices of degrees for the polynomials that can be used in the B-splines. Displays A, B, and C illustrate linear, quadratic, and cubic polynomials, respectively, that have been fit to eight random data points. It should be noted that increasing the degree of a polynomial leads to a better fit of the data points.
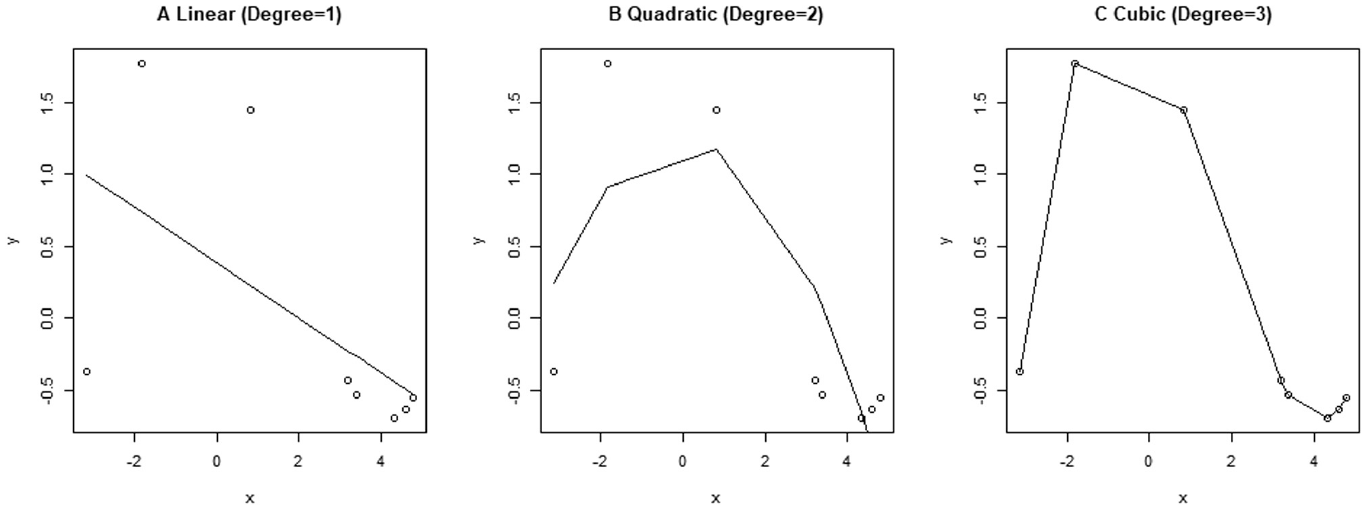
Illustration of Linear, Quadratic, and Cubic Polynomials
The locations of the knots along the x-axis also affect the shape and flexibility of the estimated functions. The knots mark the change points for the estimated functions because the piecewise polynomials are joined together at the knots. Figure 2 (Panel A) shows the B-splines with knots placed at −2, 0, and 2 (vertical gray lines). This can be contrasted with Figure 2 (Panel B) where the knots are at −1, 0, and 3.
Finally, a common approach to smoothing includes the use of penalty that can tune the roughness of displays that may exhibit too much variability. Roughness is particularly problematic when smoothing discrete data points and may result in curves that are too responsive to variation in the discrete observations The roughness penalty (
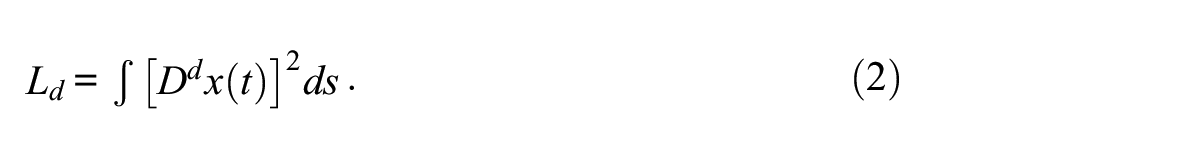
This roughness penalty and a fit criterion, such as the sum of squares error (SSE), can be combined to yield a penalized sum of squares. The penalized sum of squares is defined as
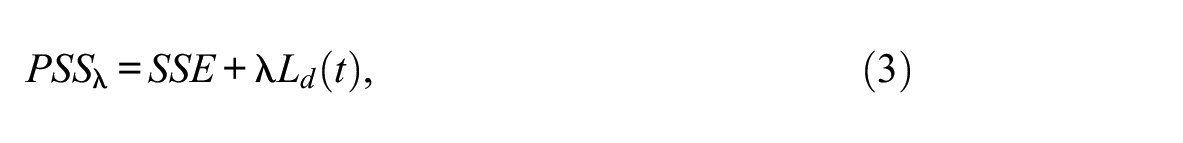
where
Figure 4 shows the effects of two different penalty derivatives: third order (Panels A, B, and C) and fourth order (Panels D, E, and F). As might be expected, a larger penalty derivative results in a smoother curve. Figure 4 also illustrates the effects of varying the smoothing parameter with
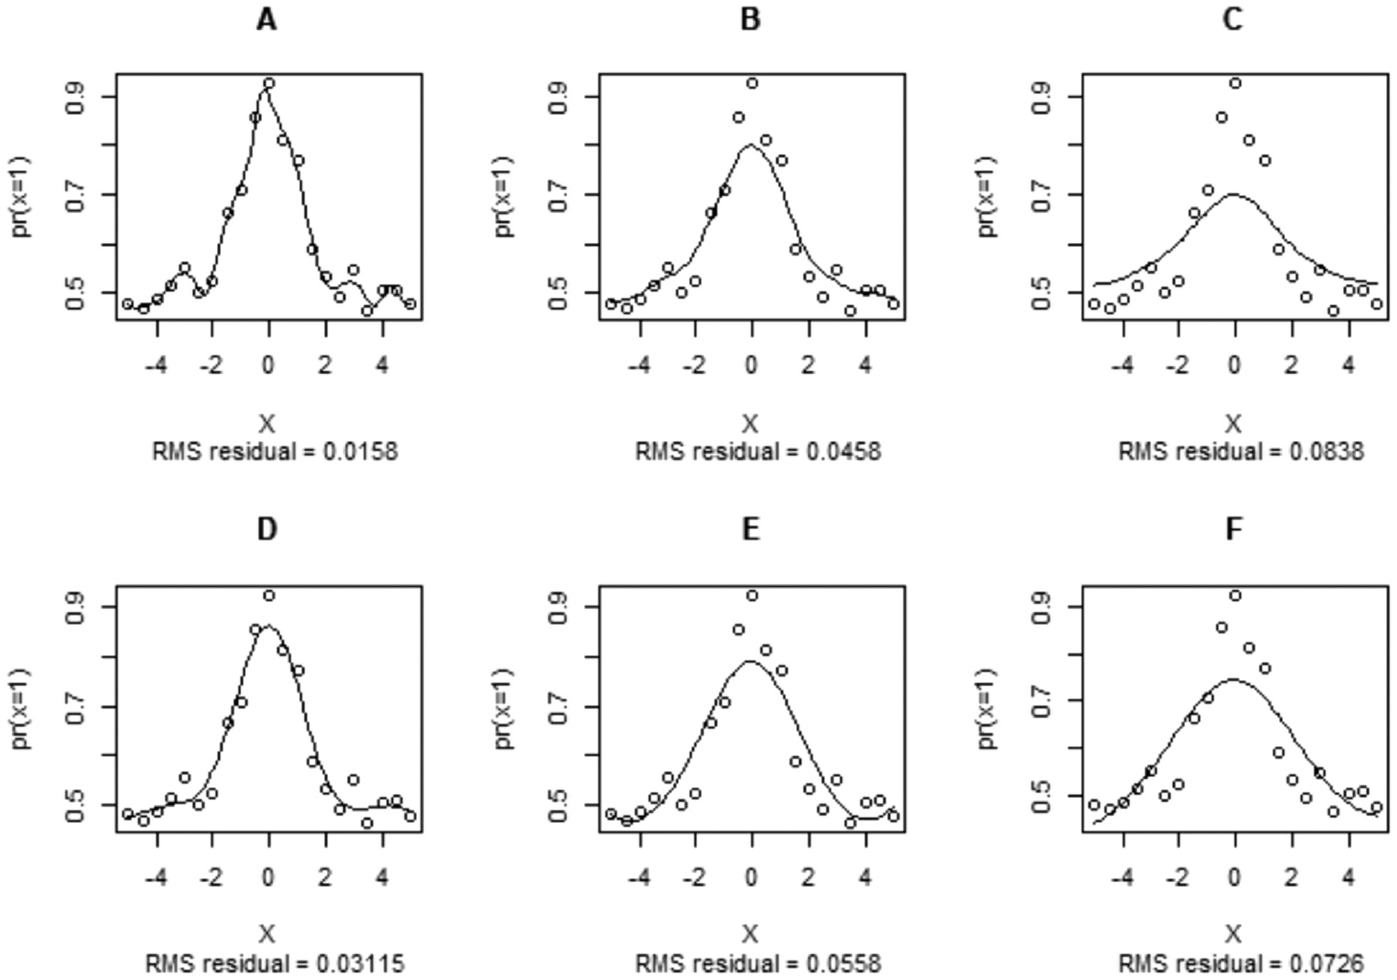
Examples of Smoothing With Different Penalized Derivatives and Smoothing Parameters
In summary, researchers can control the smoothness of curves used in FDA by choosing the degree of the polynomial, the location of the knots, the degree of the derivative to penalize the fit criterion, and the value of the smoothing weight (Kokoszka & Reimherr, 2017; Ramsay & Silverman, 2005). Overall, this process is exploratory and judgmental in nature. Cuevas (2014), Kokoszka and Reimherr (2017), and Levitin et al. (2007) are useful resources for a more detailed discussion of these topics.
Functional Clustering
Functional clustering is a process in which functional curves are grouped based on having similar attributes and form. The goal of functional clustering is to produce clusters of curves that maximize within-cluster homogeneity and between-cluster heterogeneity. Functional clustering is based on the spline coefficients (
To determine the number of clusters, there are several methods that can be used (Charrad et al., 2014). A simple approach is to plot the within-cluster sum of squares on the number of clusters. This plot can be interpreted in a way analogous to scree plots that are used in exploratory factor analysis. The number of clusters can be identified by the location of the elbow in this plot. Identification of an elbow is somewhat ambiguous, but it can be useful for guiding exploratory analyses.
Once a preliminary number of clusters are identified, the
One of the key features of the funFEM algorithm is that it produces a visual representation of the clustered curves. In this study, the smooth person response functions (PRFs) are placed into clusters based on their shape using the funFEM algorithm. There have been many recent developments in the area of functional clustering (Abraham et al., 2003; Bouveyron et al., 2015; Jacques & Preda, 2013; James & Sugar, 2003; Tarpey & Kinateder, 2003). Jacques and Preda (2013) provide a comprehensive overview of common functional clustering techniques.
In addition to the clustered functional curves, it is helpful to visualize the data as hierarchical clusters using a dendrogram or tree diagram. Technically, the clusters are not conceptualized as having a hierarchical structure; however, it may be useful to examine hierarchical clusters of persons in order to consider hypotheses about underlying explanatory structure that can be explored in future research.
In summary, there are seven key decision parameters that underlie FDA and functional clustering as used in this study. These are as follows:
Basis Function: Set of known functions that can be combined to approximate any function (e.g., B-splines)
Degree of polynomial: Linear, quadratic, cubic, etc.
Knots: Sequence of values that separate the function into polynomial segments on the x-axis (e.g., item locations)
Penalized Derivative: The derivative of the function used for smoothing.
Smoothing Parameter: A weight applied to the penalized derivative.
Number of Clusters: Number of subgroups identified in data (k).
Functional Clustering: Clustering method applied to matrix of spline coefficients (c) obtained from FDA.
These seven key decision parameters guide the judgments made in analyzing unfolding data for the purposes of this study.
Unfolding Models
The basic structure of an unfolding process can be illustrated through displays created by Coombs (1964). Figure 5 shows his conception of unfolding. Figure 5 (Panel A) shows the rank order locations of Items A to G, while Figure 5 (Panel B) shows the unfolding order of items for Person 1 (Ideal point). Person 1 has the item ordering of C, D, B, E, A, and F on the underlying unfolding scale. It is important to note that the underlying joint scale (J scale) is common for all persons.
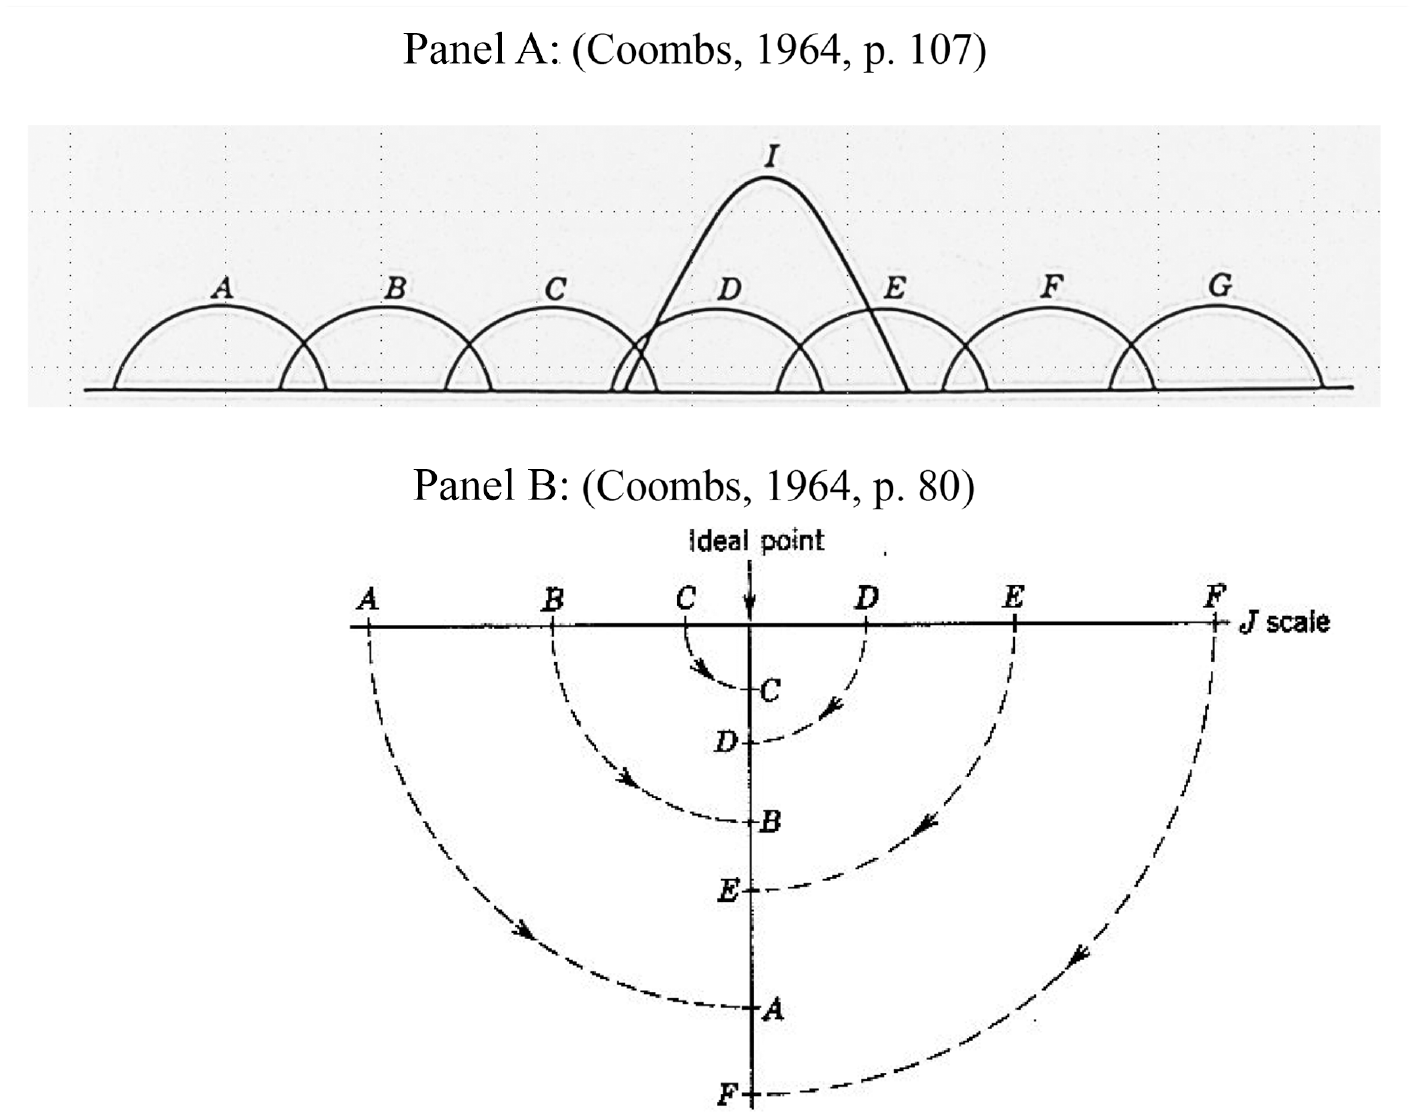
Views of Unfolding (Coombs, 1964)
There are a variety of unfolding models that can be categorized in different ways. In this study, the focus is on modeling dichotomous judgments (e.g., disagree and agree) with FDA. Unfolding models can be grouped in terms of deterministic and probabilistic characteristics (Engelhard & Yuan, in press). Important deterministic unfolding models were proposed by Coombs (1964) that include parallelogram analysis (Chapter 4) and the unfolding technique (Chapter 5). Thurstone & Chave (1927), Andrich (1988, 2016), Hoijink (1993), and Roberts (1995) proposed unfolding models that can be classified as probabilistic and parametric in structure. The Mudfold Model proposed by van Schuur (1984) is an example of a probabilistic unfolding model that is nonparametric. It was extended by Post (1992) and Post and Snijders (1993). Mudfold is an R package for that can be used to estimate the dichotomous Mudfold model (Balafas et al., 2020). Liu and Chalmers (2018) and Luo (2001) provide discussions of other general Item Response Theory (IRT) unfolding models including methods of parameter estimation.
A probabilistic view of the unfolding process is presented in Figure 6. These three response functions fit an unfolding process that can be described as monotonically increasing Figure 6 (Panel A), monotonically decreasing Figure 6 (Panel B), and monotonically symmetric Figure 6 (Panel C). Misfitting response patterns will not have a good match to any of these three general unfolding patterns. These patterns play an important role in the guiding the exploratory analyses described in this study.
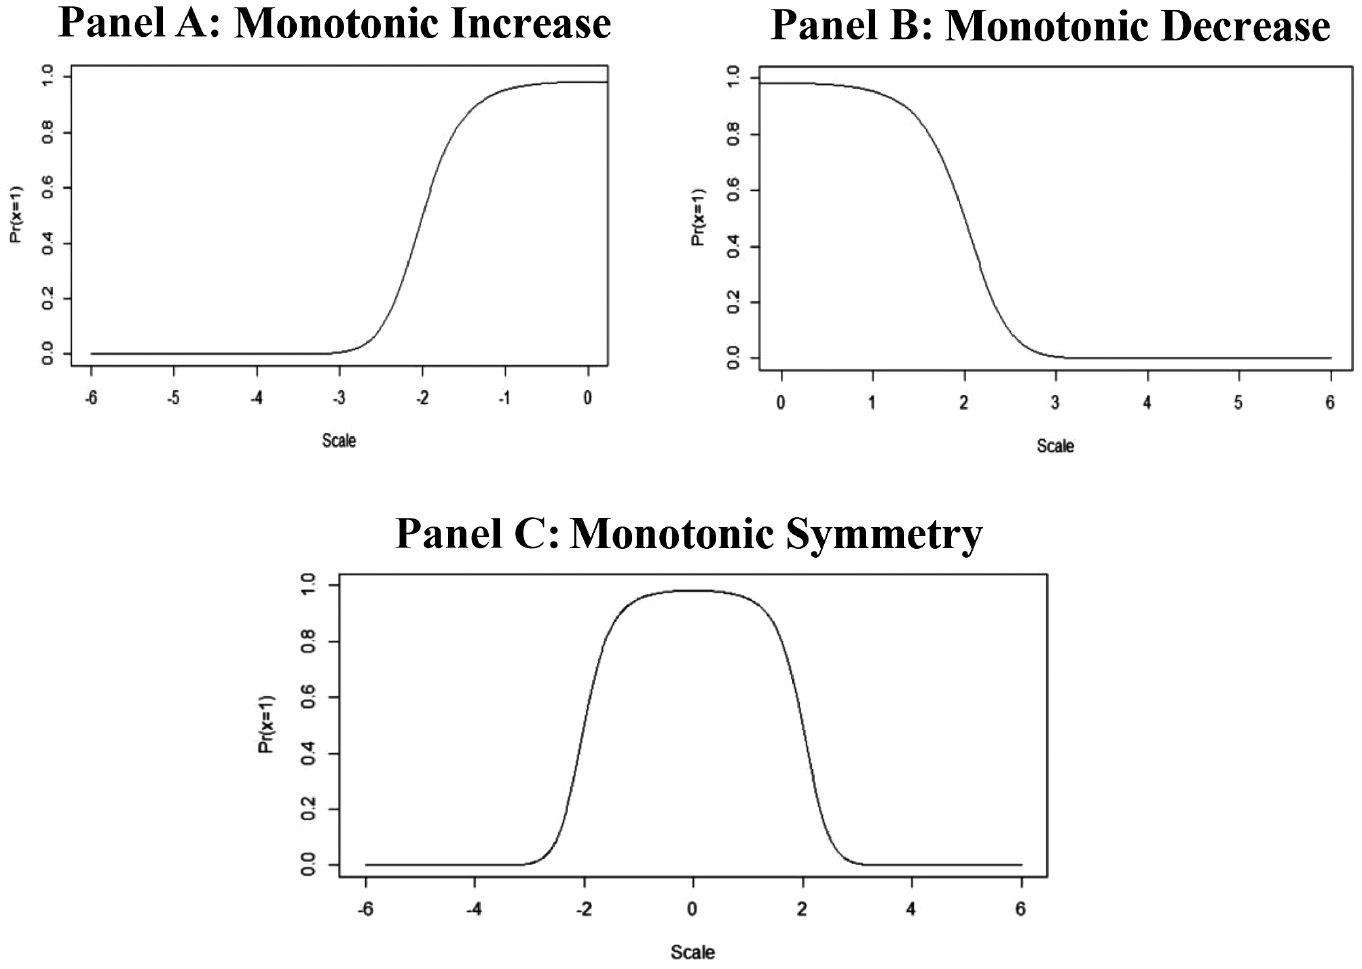
Probabilistic View of the Unfolding Process
Illustration
Table 1 is an example of a data set with unfolding response patterns. Seven persons responded dichotomously to Items A, B, C, D, E, F, and G (disagree = 0 or agree = 1). The items are ordered from low to high (−3.00 to 3.00) on the underlying scale. The distinctive parallelogram pattern described by Coombs (1964) for unfolding data is evident in Table 1.
Illustrative Data With An Unfolding Pattern (Parallelogram)
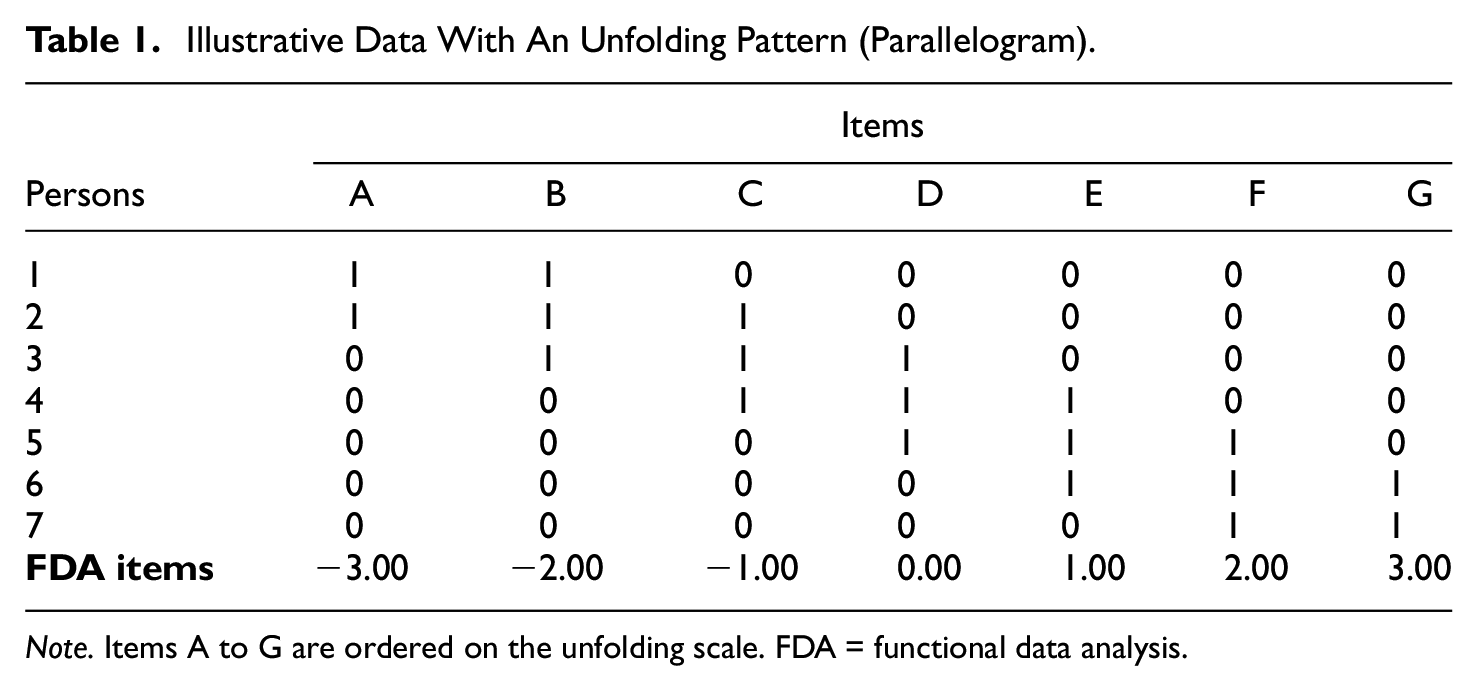
Note. Items A to G are ordered on the unfolding scale. FDA = functional data analysis.
FDA was applied to the illustrative data in Table 1. The following decision parameters were used for the FDA:
Basis Function: B-splines
Degree of polynomial: fourth-degree polynomial
Knots: Item locations (−3 to 3)
Penalized Derivative: third derivative
Smoothing Parameter: λ = 5 (weight)
Number of Clusters: k = 3
Functional Clustering: k-means and FunFEM.
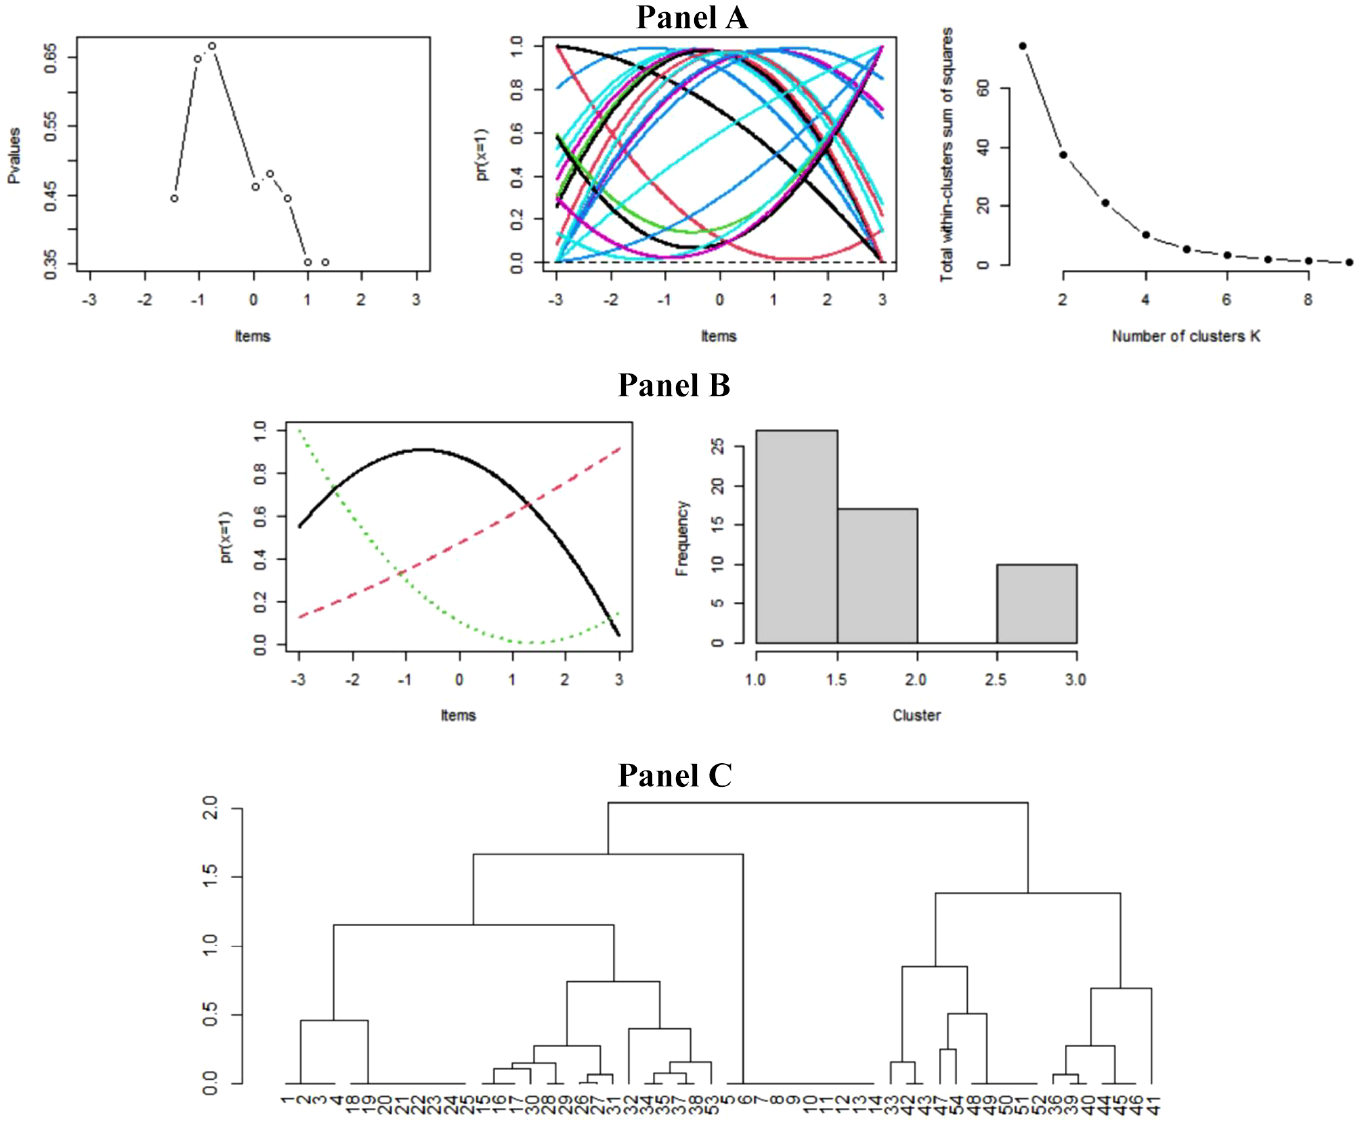
Figure 7 shows the plots for the illustrative data that emerge from a functional approach to these data. Panel A illustrated the relationship between the observed p values based on the order of the items. Next, the seven PRFs are displayed for these data. This plot with all of the PRFs can be busy and hard to interpret when the number of persons is large. Finally, Panel A also shows the scree-like plot for the within-cluster sum of square. The elbow appears at k = 3, and this suggests three clusters for these data. Panel B displays the three mean PRFs that reflect the three clusters (monotonically decreasing, monotonically symmetric, and monotonically increasing). The histogram for the three clusters is also shown in Panel B.
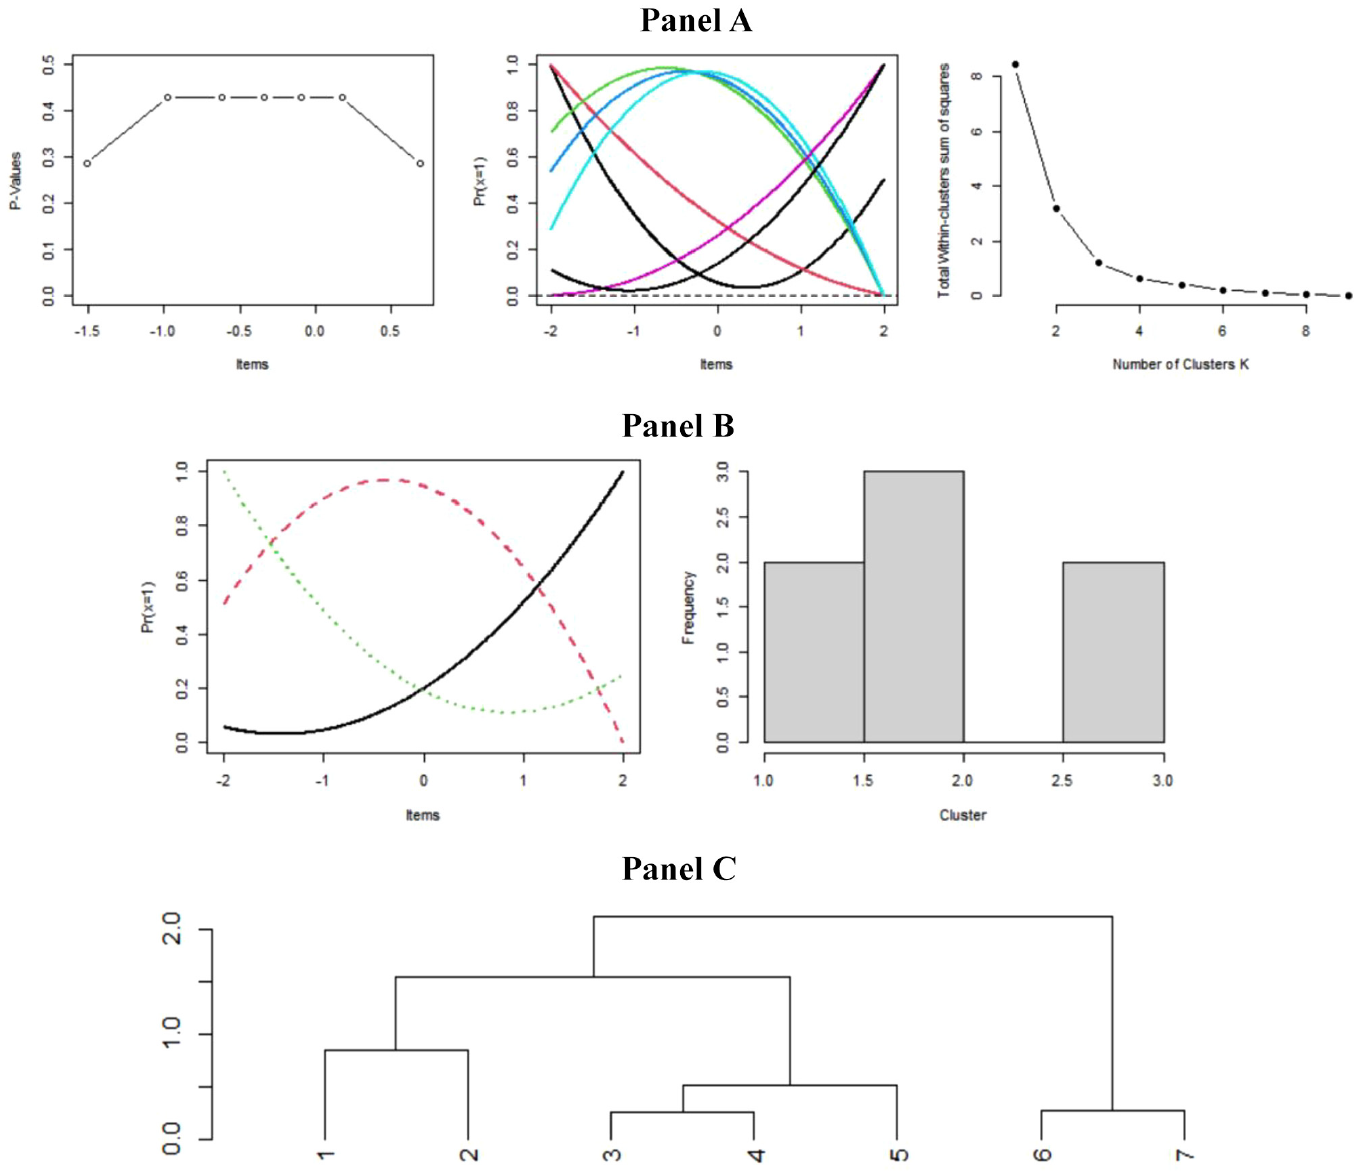
Illustrative Data With Three Clusters
The shape of these curves is reminiscent of Figure 2 (Panel A) from Coombs (1964). Panel C in Figure 7 (Panel C) shows a dendrogram for these data. The three clusters identify persons who tended to disagree from below (Persons 1 and 2), agree (Persons 3, 4, and 5), and disagree from above (Persons 6 and 7).
This illustration gives an analysis of a simple unfolding data set. It shows how clusters can be created with FDA to identify groups of persons for further interpretation and analysis. The analysis of these data with a known unfolding structure can be useful in interpreting the empirical data analyzed in the next two sections.
In the next two sections, these ideas are applied to real data using scales designed to measure attitude toward capital punishment (Andrich, 1988; Peterson, 1931) and attitude toward censorship (Roberts, 1995; Rosander & Thurstone, 1931).
Study 1: Attitude Toward Capital Punishment
In the first study, attitudes toward capital punishment (Andrich, 1988) are analyzed. There are eight items in this scale. These data were collected from 54 graduate students taking an introductory course in educational measurement and statistics (Andrich, 1988). The responses were scored dichotomously: 0 = disagree and 1 = agree.
Analyses
Table 2 lists the items included in the attitude toward capital punishment scale. The Thurstone values for the items are also shown in Table 2. These Thurstone values were obtained from Peterson (1931), and they were also reported by Andrich (1988) and Wohlwill (1963). The x-axis for the FDA was defined by standardized Thurstone values (FDA-T) with M = 0 and SD = 1. The researcher can select different ways to define the x-axis, and the FDA-T values are used in Study 1. The substantive results are expected to vary depending on how the x-axis and scale are define. The data set is the same one used in Andrich (1988).
Attitude Toward Capital Punishment
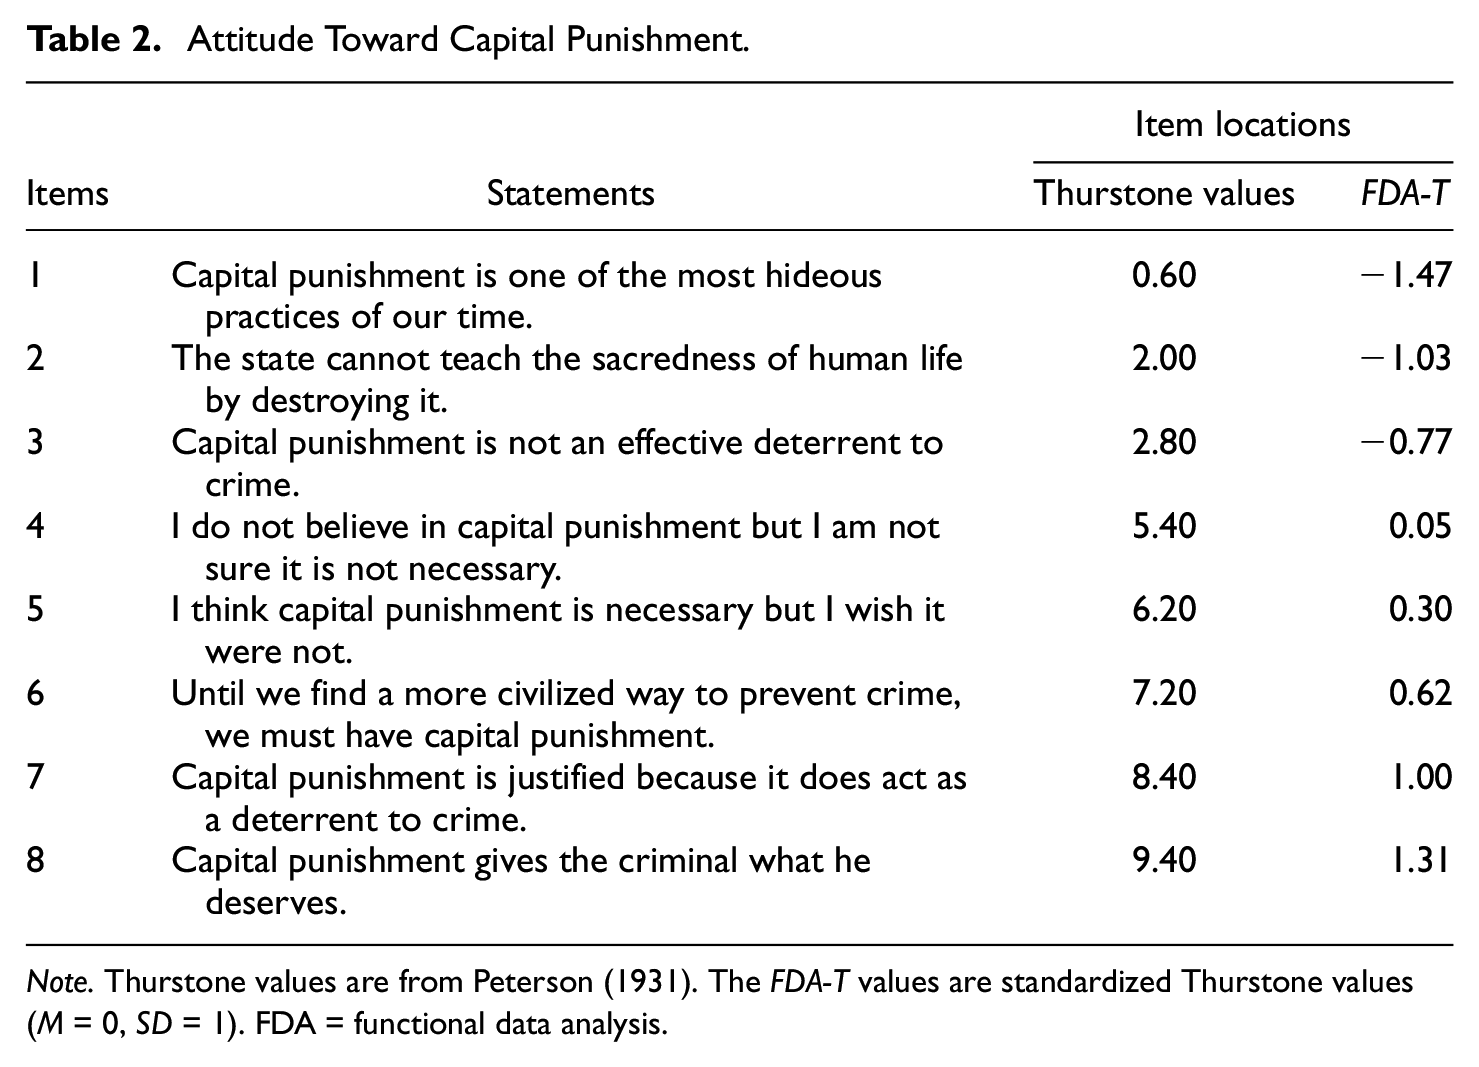
Note. Thurstone values are from Peterson (1931). The FDA-T values are standardized Thurstone values (M = 0, SD = 1). FDA = functional data analysis.
The following decision parameters were used for the FDA:
Basis Function: B-splines
Degree of polynomial: fourth-degree polynomial
Knots: Item locations based on standardized Thurstone Scale Values (FDA-T)
Penalized Derivative: third derivative
Smoothing Parameter: λ = 5 (weight)
Number of Clusters: k = 3
Functional Clustering: k-means and FunFEM
These decision parameters are the same as those used in the illustration.
Results
Figure 8 shows the results of the FDA. Figure 8 (Panel A) shows the plot of the item averages (p values) on the items. Overall, the suitability of the data for unfolding analyses looks reasonable. Next, the 54 PRFs (N = 54) are shown. As noted earlier, this plot is quite busy, and it is difficult to interpret. Finally, the scree-like plot of the within-clusters sum of squares is displayed. As was found with the illustrative data, an elbow appears at k = 3 suggesting three clusters. Panel B in Figure 8 illustrates the average FDA curves for each cluster based on k = 3 appears for these data. Next, a histogram shows the grouping of the 54 persons into three clusters. Panel C presents a dendrogram that displays clustering for the 54 persons. As was found with the illustrative data, there seem to be three clusters reflecting disagree from below, agree, and disagree from above.
Attitudes Toward Capital Punishment (Andrich, 1988): Three Clusters
In summary, the analyses of these data reflect unfolding patterns that approximate the three expected patterns as shown in the illustrative data. The PRFs are clustered into three clusters that appear to match the expectations for an unfolding response process.
Study 2: Attitude Toward Censorship
In Study 2, a scale designed to measure attitude toward censorship is analyzed. These items were first published by Rosander and Thurstone (1931), and reprinted in Shaw and Wright (1967). Table 3 lists the items included in the attitude toward censorship scale.
Attitude Toward Censorship
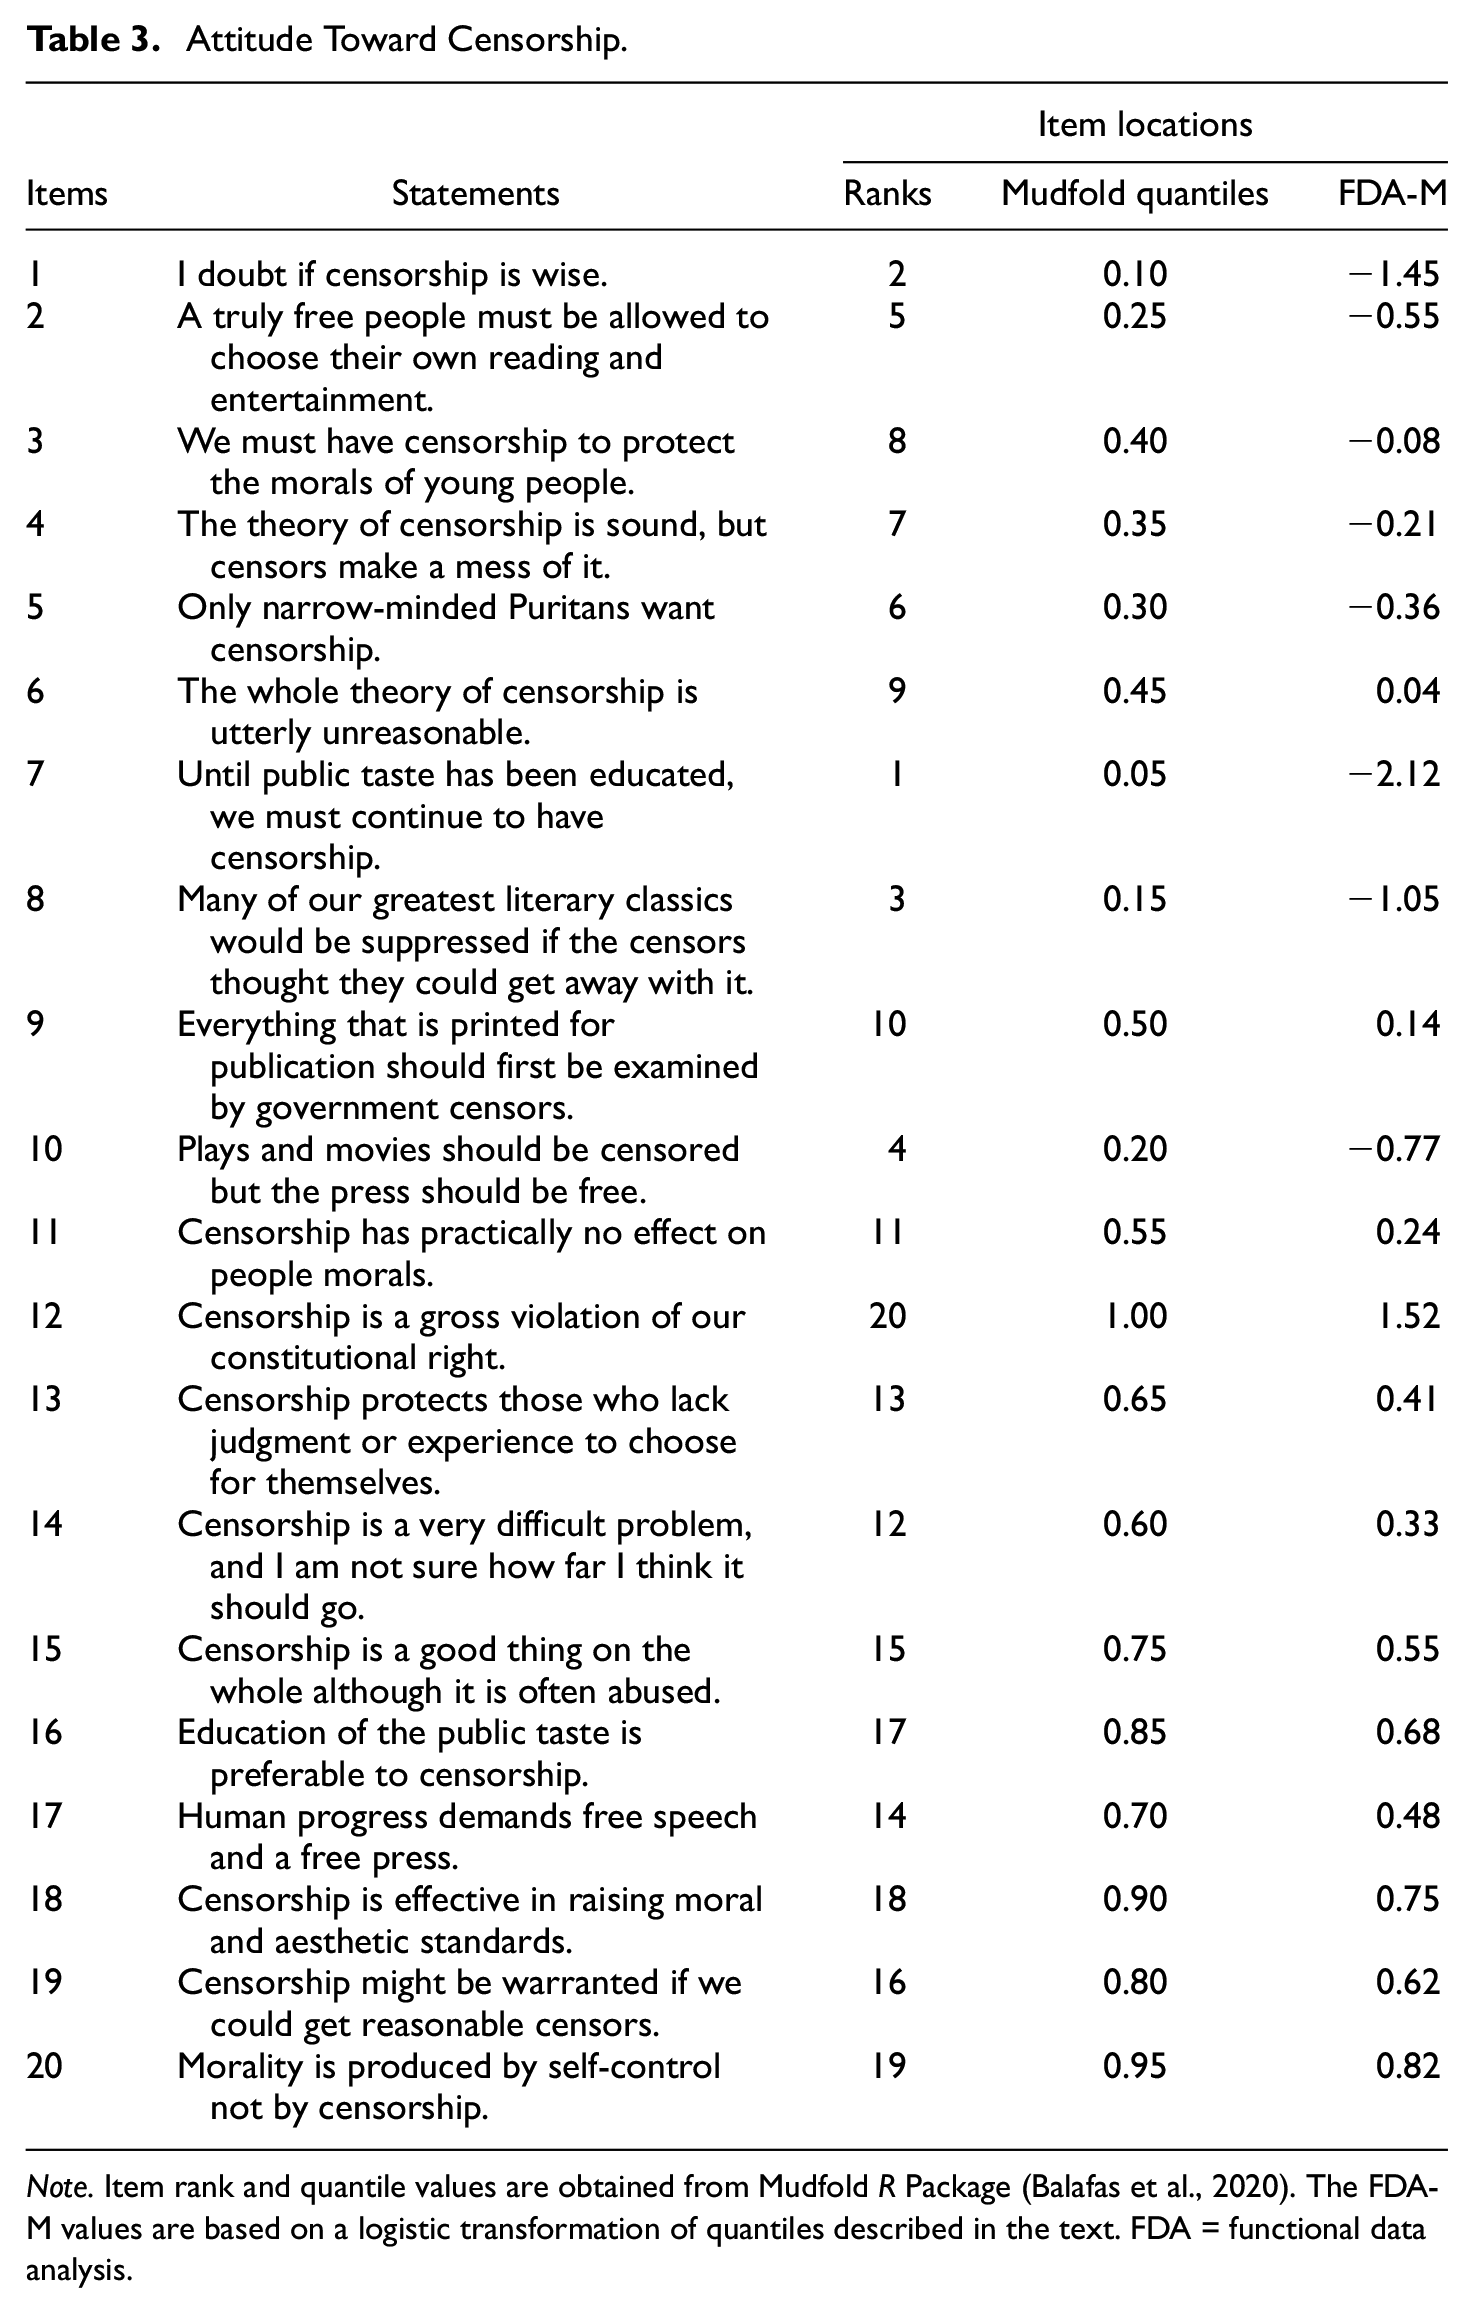
Note. Item rank and quantile values are obtained from Mudfold R Package (Balafas et al., 2020). The FDA-M values are based on a logistic transformation of quantiles described in the text. FDA = functional data analysis.
There were 223 students who indicated the extent that they agreed with each of the 20 statements (Roberts, 1995). Responses were on a 6-point rating scale where 1 = Strongly Disagree, 2 = Disagree, 3 = Slightly Disagree, 4 = Slightly Agree, 5 = Agree, and 6 = Strongly Agree. As this study focuses on dichotomous data, these ratings were dichotomized (0 = 1, 2, or 3, and 1 = 4, 5, or 6).
Analyses
To define items values for the x-axis, the data were analyzed with the Mudfold R Package (Balafas et al., 2020). The ranks and quantiles obtained from fitting a Mudfold model are shown in Table 3, as well as the transformed values used in the FDA. Thurstone Mudfold values (FDA-M) were based on a transformation of item ranks to quantiles (Johnson, 2006). These quantiles (κ) are transformed into FDA-Mudfold (FDA-M) values as follows:
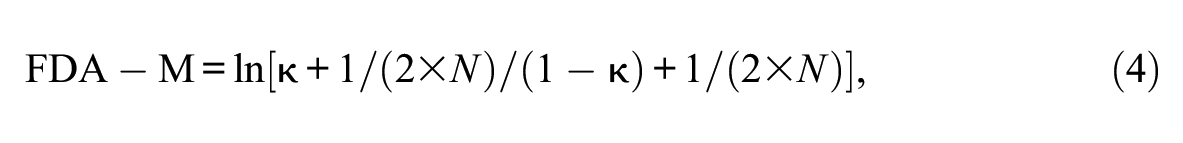
where N is the number of persons and κ is the item quantile. Next, these FDA-M values are standardized (M = 0, SD = 1) for the purposes of this study. This transformation is designed to reduce bias in the case of small N and also provides a reasonable adjustment for perfect scores (Anscombe, 1956). It should be stressed that the definition of the x-axis influences the substantive results because the interpretation is expected to vary depending on how the x-axis and scale are defined. This provides another example of how to define the x-axis for a functional approach to unfolding data. The data set is the same one used in Roberts (1995).
The following decision parameters were used for the FDA:
Basis Function: B-splines
Degree of polynomial: fourth-degree polynomial
Knots: Item locations based on transformed Mudfold values (FDA-M)
Penalized Derivative: third derivative
Smoothing Parameter: λ = 5 (weight)
Number of Clusters: k = 3, 4
Functional Clustering: k-means and FunFEM.
These decision parameters are the same as those used in the illustration with the exception of the number of clusters (three and four clusters were examined).
Results
Figure 9 shows the results of the FDA. Figure 9 (Panel A) shows the plot of the item averages (p values) on the items. Two items appear to be outliers on this curve: Item 7 (Until public taste has been educated, we must continue to have censorship) and Item 12 (Censorship is a gross violation of our constitutional right). These items may be outliers because they may be confusing to respondents. An alternative explanation is that the Mudfold analyses used to define the x-axis are “content” free, and so, these items are not constrained to match the substantive ordering that may be expected. Next, the individual PRFs (N = 223) are plotted. As expected, this plot is busy and difficult to interpret. Finally, the scree-like plot of the within clusters sum of squares is shown. In this case, there are two potential elbows (k = 3 and k = 4). The functional cluster model was fit to three and four clusters. The BIC was 1741.289 for three clusters, and the Bayesian Information Criterion (BIC) was 355.631 for four clusters. This suggests that using four clusters is a better fit for these data.
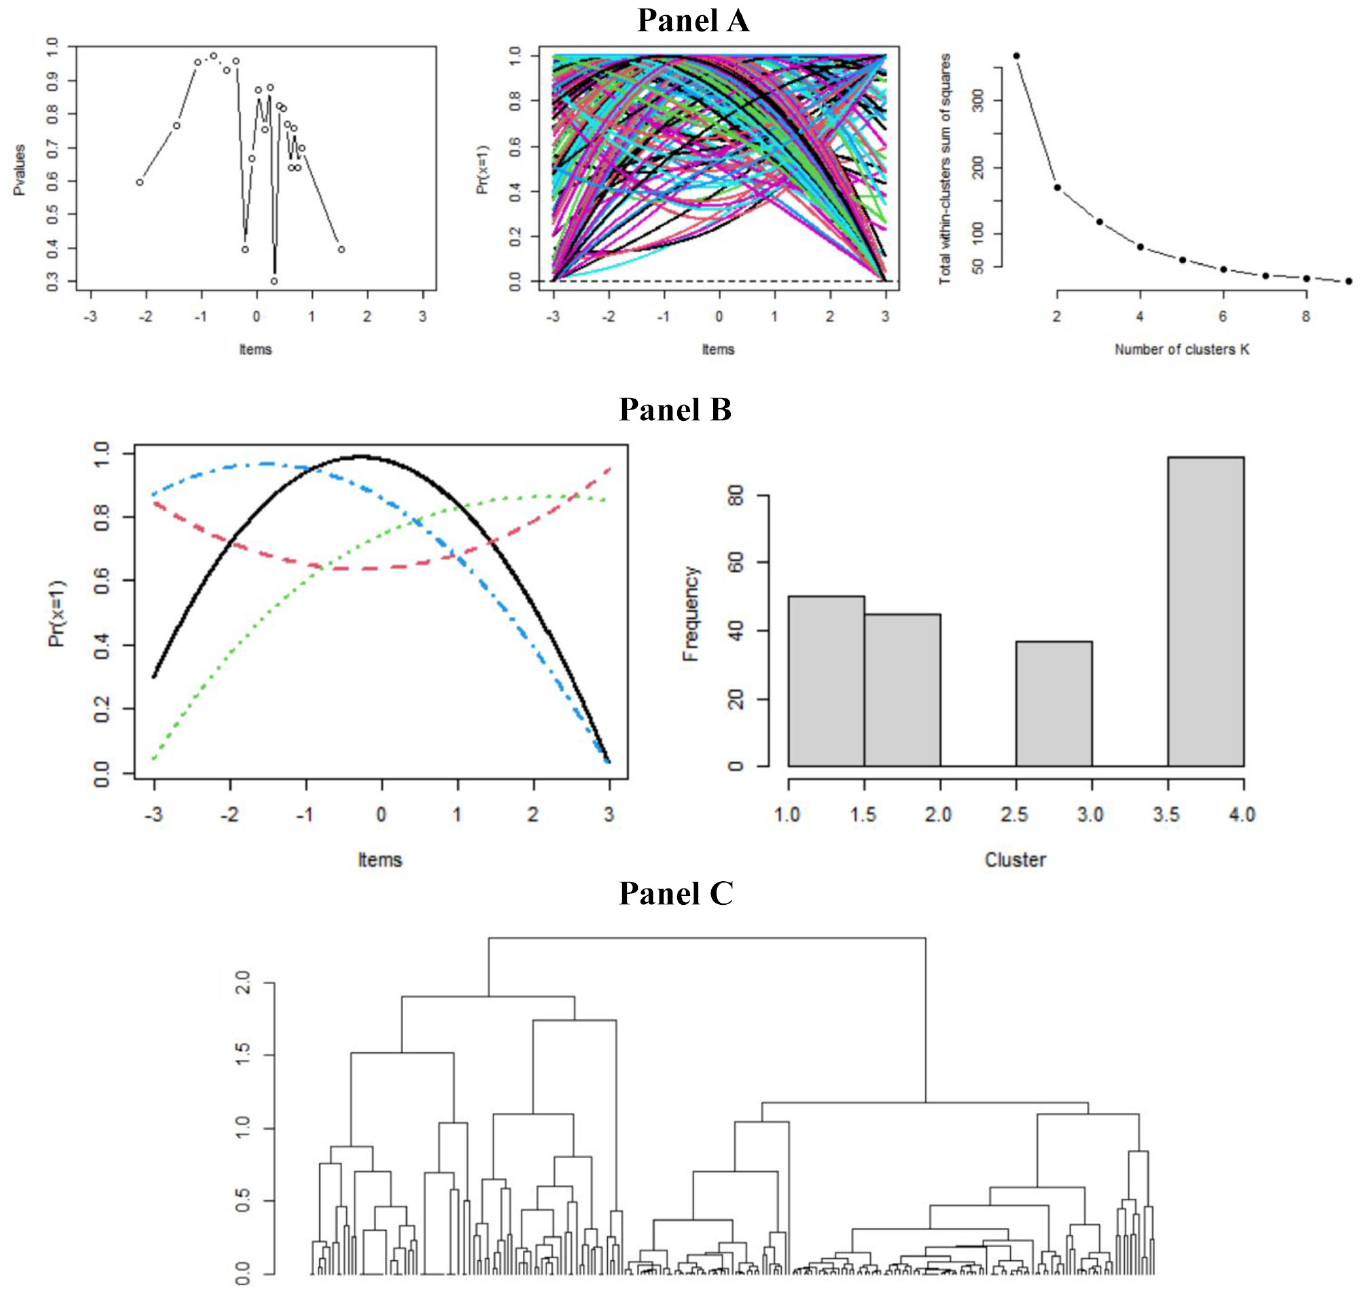
Attitude Toward Censorship (Roberts, 1995): Four Clusters
Panel B illustrates average FDA curves for each of the four clusters. It is interesting to note that the use of four clusters yields a curve that does not fit the expected pattern for unfolding data. Three clusters appear to have expected shapes for unfolding data, while the fourth curve (concave up—red) suggests persons in this cluster were not responding as expected. Additional analyses are needed to explore why the fourth cluster appears to not reflect an unfolding process for these respondents. The histogram for the four clusters is shown next. Panel C presents the dendrogram for these data. The person numbers are not shown in this display because of the large sample size.
In summary, four clusters offer a potentially useful interpretation of person response functions with the censorship data. The fourth cluster may indicate aberrant PRFs that require additional analyses.
Discussion
The purpose of this study was to introduce FDA as a promising approach for modeling unfolding response data. Functional data analysis was discussed with seven decision parameters identified that can be used to guide FDA within the context of unfolding data. The use of functional clustering as a strategy for summarizing the smoothed curves obtained from FDA was also described. The use of k-means clustering in combination with a funFEM algorithm (Bouveyron, 2015) shows promise as a strategy for grouping person response functions obtained from the functional analysis.
It is important to recognize that FDA serves the same purposes as other statistical methods. The goals of FDA Ramsay and Silverman (2005) include the following:
• Representation of the data in ways to suggest further analyses,
• Visualization of data to highlight various characteristics,
• Identification of patterns and variation within the data,
• Exploration of relationships between dependent and independent variables, and
• Comparison of two or more data sets.
This study primarily focused on illustrating the representation of unfolding response data with visual displays of the data.
There are several areas for future research on the use of FDA in the context of unfolding response processes. It is important to consider the application of FDA to polytomous data within the context of unfolding models. Another area for future research focuses on the interpretation of clusters. This study started with the strong idea of response patterns that exhibit good fit, and this may guide interpretation of clusters. Another set of topics for future research is to examine item and person fit from the perspective of FDA with unfolding items.
Future research should explore the consequences of specifying the x-axis in different ways. The substantive interpretations of the analyses are expected to vary depending on how the x-axis is defined. The x-axis can be defined based on a specific unfolding model, such as hyperbolic cosine model (HCM; Andrich, 2016), generalized graded unfolding model (GGUM; Roberts, 2016), or multiple unidimensional unfolding (MUDFOLD; van Schuur, 1984). Study 1 uses previously defined scale values to define the x-axis, while Study 2 uses modified item values from MUDFOLD.
It is also important to recognize that FDA and FDA clustering in general are rapidly growing areas of research. This study illustrated several methods from FDA, and future research should examine other tools from FDA to examine response data. Unfolding models offer another general area that is open for additional conceptual and statistical work. Unfolding models are underutilized for exploring item responses. The theoretical underpinnings of unfolding models may be less familiar for some researchers. The development of new software (Balafas et al., 2020; J. Wang et al., in press) should provide additional opportunities for exploring new application areas. A combination of new ideas regarding unfolding in conjunction with new methods within FDA offer an exciting space for future research.
Seven key decision parameters were identified in this study with various options. It is important to conduct future research using simulated data to examine the effects of varying these parameters. As these choices are based on judgment, it is inevitable that as Tukey (1977) said “different users are always likely to prefer different choices” (p. 215). Choice can be viewed as a double-edged sword because it can be viewed as an advantage of a functional approach to unfolding data because of the flexibility. However, choice can also be viewed as a disadvantage because judgments are difficult to make when there are no definitive or correct answers. The researcher is primarily guided by the usefulness and meaning that may accrue from using FDA to model the data. FDA as used in this study is essentially an exploratory data analysis. Exploratory analyses depend in a fundamental way on choices and judgments by researchers who have substantive knowledge regarding the data and research problem. Of course, these characteristics play an important in all statistical analyses of data.
In summary, the use of FDA with unfolding data offers a promising set of tools for examining unfolding response processes. The major goal of this study was to offer proof-of concept support for a combination of FDA and unfolding analyses. This study is intended as an invitation to other researchers to investigate the utility of FDA for unfolding data.
Footnotes
Declaration of Conflicting Interests
The author declared no potential conflicts of interest with respect to the research, authorship, and/or publication of this article.
Funding
The author received no financial support for the research, authorship, and/or publication of this article.