
Abstract
To mitigate the potential damaging consequences of rapid guessing (RG), a form of noneffortful responding, researchers have proposed a number of scoring approaches. The present simulation study examines the robustness of the most popular of these approaches, the unidimensional effort-moderated (EM) scoring procedure, to multidimensional RG (i.e., RG that is linearly related to examinee ability). Specifically, EM scoring is compared with the Holman–Glas (HG) method, a multidimensional scoring approach, in terms of model fit distortion, ability parameter recovery, and omega reliability distortion. Test difficulty, the proportion of RG present within a sample, and the strength of association between ability and RG propensity were manipulated to create 80 total conditions. Overall, the results showed that EM scoring provided improved model fit compared with HG scoring when RG comprised 12% or less of all item responses. Furthermore, no significant differences in ability parameter recovery and omega reliability distortion were noted when comparing these two scoring approaches under moderate degrees of RG multidimensionality. These limited differences were largely due to the limited impact of RG on aggregated ability (bias ranged from 0.00 to 0.05 logits) and reliability (distortion was ≤ .005 units) estimates when as much as 40% of item responses in the sample data reflected RG behavior.
Test-taking effort is a necessary condition to support the validity of score-based inferences from all social science measures. When examinees fail to put forth their maximal effort, inferences made from such measures may likely not reflect the assessed constructs. Assuming that examinees have had the opportunity to learn what is being assessed, can fully access the test content, and possess sufficient time to answer all items, disengagement for a given item may occur when the resource demands of that item exceeds the effort that an examinee is willing to expend (Wise & Smith, 2011). For example, Asseburg and Frey (2013) found a positive linear relationship between the ability-difficulty balance and individuals’ test-taking effort. In such circumstances, examinees can disengage in various ways, such as omitting item responses, providing responses with intentional disregard for item content (i.e., noneffortful responding), or both (e.g., Ulitzsch et al., 2020).
Although disengagement of any form is undesirable, noneffortful responding is particularly concerning because it introduces psychometrically distortive information into scores. To mitigate the potential damaging consequences of noneffortful responding, researchers have proposed leveraging behavioral indicators of disengaged behavior, such as item multimedia interactions (e.g., Harmes & Wise, 2016), eye tracking (e.g., Lindner et al., 2017), electroencephalography (e.g., Halderman et al., 2021), retroactive video evaluations of emotional ratings (e.g., Lehman & Zapata-Rivera, 2018), cursor movements (Pokropek et al., 2022), and response times (see Wise, 2017), to identify potential construct-irrelevant responses. 1 Of these indicators, response times have been most utilized in applied research (Silm et al., 2020) and operational testing contexts (Wise & Kuhfeld, 2020). This behavioral indicator is advantageous because it allows for disengagement to be assessed for each examinee-by-item interaction and is collected unobtrusively, which limits potential observer effects.
Using this proxy measure, any response provided in a timeframe that is incommensurate with the amount of time needed to thoroughly read the item stem and response options and solve the presented problem is deemed to be a noneffortful response (for a description of methods used to identify noneffortful responding using response times, see Rios & Deng, 2021). Within the literature, this form of noneffortful responding is referred to as rapid guessing (RG) and has been studied predominantly within the context of cognitive assessments that possess multiple-choice keyed response options, given that correct rates can be used to help validate inferences of disengagement (Soland et al., 2019). 2 RG has been documented to occur at high-rates for assessment contexts in which there are little to no personal consequences for examinee performance (i.e., low-stakes tests), due to a diminished sense of task value, which limits some examinees’ effort capacity (Penk & Schipolowski, 2015). In a recent meta-analytic investigation, Rios et al. (2022) found that across 25 independent studies, an average of 28% of examinees were found to engage in RG on at least one item, while the mean percentage of RG responses across data matrices was equal to 7%.
RG has been found to generally underestimate test performance (Rios et al., 2022), which leads to bias in both measurement properties, such as item characteristics (e.g., van Barneveld, 2007) and measurement invariance (e.g., Deng & Rios, 2022), as well as score-based inferences, including aggregated ability estimates (e.g., Rios et al., 2022), subgroup comparisons (e.g., Rios, 2021) and growth estimates (e.g., Yildirim-Erbasli & Bulut, 2020), to name a few. Given the potential deleterious effects of RG, researchers have proposed various recoding and modeling approaches for handling this form of noneffortful responding. In the following sections, a review of these approaches is provided as a means to set the foundation for the objective of the present manuscript, which is to examine the robustness of the most popular of these approaches, the effort-moderated (EM) scoring procedure, to multidimensional RG (i.e., RG that is linearly related to examinee ability).
Response Time Scoring Approaches for Handling RG
There are currently two main categories of scoring approaches for contending with RG, which differ in classifying RG and estimating ability: (a) item response theory (IRT) mixture modeling; and (b) two-stage scoring.
IRT Mixture Modeling
The most recent set of scoring procedures for handling RG leverage item response theory (IRT) mixture modeling to distinguish between unique, latent response strategies (RG and effortful responding). Within this approach, a probabilistic model is employed to estimate the likelihood that an item response belongs to a latent class that reflects RG, based on the assumption that response times reflect different data-generating processes associated with RG and effortful responding. IRT mixture modeling advantageously avoids the need for dichotomous classifications of RG and instead utilizes the RG class probability to weight the observed item responses, which avoids the potential for fully misclassifying effortful responding as RG (see Rios, 2021). In addition, this general approach simplifies the modeling process by simultaneously estimating class membership probability and model parameter estimates.
With these advantages noted, many IRT mixture models assume that examinees possess a constant speed when effortfully responding, regardless of item characteristics (e.g., reading load) or cognitive fatigue, which is an assumption found to be untenable in applied testing contexts (Bolsinova et al., 2017; Domingue et al., 2021; Meng et al., 2015; van der Linden & Glas, 2010). Second, many models presume that response times reflective of RG follow a lognormal distribution with a common mean and variance across all items (this assumption is relaxed by Nagy & Ulitzsch, 2022). However, if this assumption is violated, prior research suggests that class membership probabilities may be biased, a potential outcome given idiosyncratic RG response time patterns between- and within-examinees (Molenaar et al., 2018; Wise & Kingsbury, 2016). Beyond these theoretical limitations, there are a number of practical constraints that have restricted the application of IRT mixture models. These limitations include model convergence issues when small sample sizes and/or proportions of RG are present. In addition, these models require specialized software that are capable of employing Bayesian estimation, which can lead to estimation times that are quite extensive (see Pokropek, 2016). 3 These combined constraints have led some researchers to suggest that IRT mixture models are impractical for operational use and instead are best utilized as sophisticated tools for investigating the occurrence of RG in small-scale research efforts (Ulitzsch et al., 2022).
Two-Stage Scoring
Due to the limitations associated with IRT mixture models, an increasingly popular tactic to mitigate bias from RG is to employ a two-stage scoring approach. Within this general approach, a response to item i for examinee j is defined as a RG response (F ij = 1) if the associated response time, RT ij , is less than a predetermined response time threshold, T i , that distinguishes the minimal time associated with solution behavior. A host of procedures have been proposed for establishing T i based on heuristic rules (e.g., 3 seconds), the form of response time distributions, and/or response accuracy or item information accumulated over time (for more details, see Rios & Deng, 2021). Regardless of the procedure used to establish T i , if F ij = 1, the observed item score for item i by examinee j, Y ij , is recoded, Y* ij ; otherwise, if F ij = 0, Y ij is unaltered (i.e., Y ij = Y* ij ). Researchers have transformed Y ij to Y* ij by treating a RG item score as either incorrect (Deribo et al., 2021; Wright, 2019) or missing (Liu et al., 2019; Wise & DeMars, 2006). This process is completed for each i ×j interaction to create a transformed item response matrix for the total sample, Y*.
Recoding RG item scores as incorrect (e.g., Penalized scoring; Wright, 2016) innately presumes that an examinee engages in RG due to a low true response probability, and thus, strategically guesses to increase the likelihood of correctly answering an item. This assumption requires an examinee to accurately identify that they have an expected probability below chance, and provide an answer in less time than T i , which may be untenable in applied settings. On one hand, a quick evaluation from test-takers seems hardly possible; on the other hand, prior research has shown that RG is likely most strongly associated with low task value in low-stakes testing contexts (i.e., examinees with high true response probabilities engage in RG due to a lack of interest in the presented task; Goldhammer et al., 2017; Penk & Schipolowski, 2015). Furthermore, recent simulation research suggests that imputing incorrect item scores for RG responses leads to greater error in both item and person parameters than naïvely ignoring the presence of RG (Rios & Deng, 2024). Due to strong impractical assumptions and poor psychometric performance, it is recommended that treating RG item scores as incorrect should be avoided where possible.
To account for the possibility that examinees may engage in RG for idiosyncratic reasons, an alternative recoding strategy is to treat all RG item scores as missing data (this approach was proposed in relation to aberrant responding by Waller [1974]). The rationale for this approach is that RG represents a response process that is unreflective of the assessed construct(s), and thus, provides psychometrically uninformative information. This strategy is advantageous because it does not make strong assumptions about the underlying rationale for RG behavior, and furthermore, avoids imputing responses that may increase bias in parameter estimates, such as assigning incorrect item scores (Rios & Deng, 2024). To date, recoding RG item scores as missing has been extensively researched and is the only approach to be employed in operational settings (see Wise & Kuhfeld, 2021). Two modeling approaches have been proposed once recoding RG responses as missing data: EM (Wise & DeMars, 2006) and Holman–Glas (HG; Liu et al., 2019) scoring. 4
EM Scoring
This scoring approach simply applies a user-defined unidimensional IRT model to Y*, such as the three-parameter logistic (3PL) model, which can be expressed in the slope-intercept form as:

where
EM scoring has been generally shown to mitigate bias in ability parameter estimates when compared with ignoring the presence of RG (particularly as the rate of RG increases), be robust to nonidiosyncratic patterns of RG, and yield proficiency estimates that are significantly associated with self-report measures of effort (Rios et al., 2017; Rios & Soland, 2021a, 2021b; Wise & DeMars, 2006; Wise & Kuhfeld, 2021). However, it is susceptible to nonconvergence and increased standard errors in ability estimation as RG rates rise (Rios & Soland, 2021b). Furthermore, by converting RG item scores to missing, EM scoring presumes that the propensity to rapid guess is not systematically related to item and examinee characteristics, given that examinee ability is modeled unidimensionally. The tenability of the latter assumption is particularly questionable because prior research has demonstrated a negative relationship between RG propensity and ability in certain testing contexts (i.e., low ability examinees are more likely to engage in RG than high ability examinees; Deribo et al., 2021; Rios et al., 2017). With that noted, EM scoring is the most researched scoring approach to date (e.g., Rios & Soland, 2021a, 2021b; Wise & DeMars, 2006; Wise & Kuhfeld, 2021) and is the only known method currently employed in operational settings (Wise & Kuhfeld, 2021).
HG Scoring
To account for the potential linear relationship between RG propensity and ability, Liu et al. (2019) extended the missing data model of Holman and Glas (2005). In this scoring approach, examinee ability (
Upon arranging the data matrix, the latent construct relationship can be expressed within a multidimensional IRT (MIRT) framework by specifying a user-defined unidimensional measurement model separately for Y* and F. For instance, Liu et al. (2019) conceptualized the prediction of F by

where
HG scoring has the potential to provide improved ability estimation when RG is multidimensional (e.g., latent ability and propensity for RG are correlated). In addition, it provides a flexible procedure for investigating correlates of examinees’ latent propensity for RG via structural equation modeling. However, applying HG scoring to datasets in which RG is ignorable (e.g., with minor RG rates) could lead to model overparameterization and biased parameter estimates. This arises from incorporating more parameters into the model than what the data justifies, leading to unnecessary complexity. In addition, if covariates (e.g., item content) account for differential RG among examinees with the same ability level, parameter estimates from this model may be biased and ultimately alter the interpretation of ability inferences, due to the assumption that
Study Rationale
Contending with RG is important for operational testing programs given the high rates of noneffortful responding previously observed (Rios & Deng, 2021). However, practitioners are presented with multiple options of RG scoring approaches, with each providing its own strengths and limitations. For instance, EM scoring is a simple method that can be easily integrated into operational workflows, as it relies on unidimensional IRT models that are readily employed by many testing programs. This approach has been shown to be robust to nonidiosyncratic patterns of RG (Rios & Soland, 2021b); however, it is less understood how robust parameter estimates are when missing data are nonignorable due to a linear relationship between
To address the limitations in the literature, we conducted a simulation study to investigate model fit, ability parameter recovery, and factor analytic reliability between the EM and HG scoring approaches under various conditions. Specifically, these outcomes are examined when manipulating test difficulty, the proportion of RG present within a sample, and the strength of association between
The findings from this study have the potential to inform practitioners about whether a unidimensional approach to mitigating bias from RG is robust to underlying multidimensionality.
Method
Data Generation
Data were generated for a 50-item multiple-choice test using a two-factor correlated traits simple structure model. A multivariate normal distribution was employed to sample 2,000

where
Upon sampling


where

where
The next step in the data generation process consisted of manipulating the percentage of RG responses in Y. This step required two stipulations, the proportion of simulees engaging in some degree of RG and the average percentage of within-disengaged simulee RG. Concerning the former, five levels were varied ranging from .10 to .50 in increments of .10, while the average rate of RG within-disengaged simulees was equal to one of four levels: 10%, 20%, 40%, and 80%. However, to address the fact that examinees can differ in the degree to which they employ RG (Wise & Kingsbury, 2016), the number of RG responses for each disengaged simulee was allowed to vary based on sampling from a multinomial distribution. Within each disengaged simulee, RG was generated for the items with the highest probabilities obtained from equation 5. Therefore, if examinee j was stipulated to engage in RG on three items, noneffortful responding would be imputed for the three items with the highest
In summary, the following four independent variables and their respective levels were included in the simulation design:
Covariance between
Test difficulty: easy and moderately difficult
Proportion of disengaged simulees in sample: .10, .20, .30, .40, and .50
Average percentage of within-disengaged simulee RG: 10%, 20%, 40%, and 80%
These independent variables were fully crossed resulting in 80 conditions, with each condition replicated 100 times.
Model Estimation
Prior to jointly estimating item and ability parameters, missing data were imputed for known RG responses to create Y*, while F was created by reflecting the true generating RG classifications. After that, item and ability parameters were concurrently estimated for EM and HG scoring in the mirt R package (Chalmers, 2012). To serve as a baseline measure, a naïve 3PL model (hereon referred to as the naïve approach) was also estimated in which the presence of RG was ignored. Across scoring procedures, the Newton–Raphson estimation algorithm was utilized to determine the maximum of the likelihood function, with the starting value and convergence criterion established at 0 and 0.0001, respectively. Nonconverged estimation occurred if the convergence criterion established was not met after reaching 100 iterations. In addition, RG’s impact on factor analytic reliability was investigated using the Green and Yang’s (2009) formula with the semTools R package (Jorgensen et al., 2016) to account for categorical indicators and possible violations to tau-equivalence. Given that EM and HG scoring possess the same item response indicators, reliability was identical between these approaches.
Outcomes
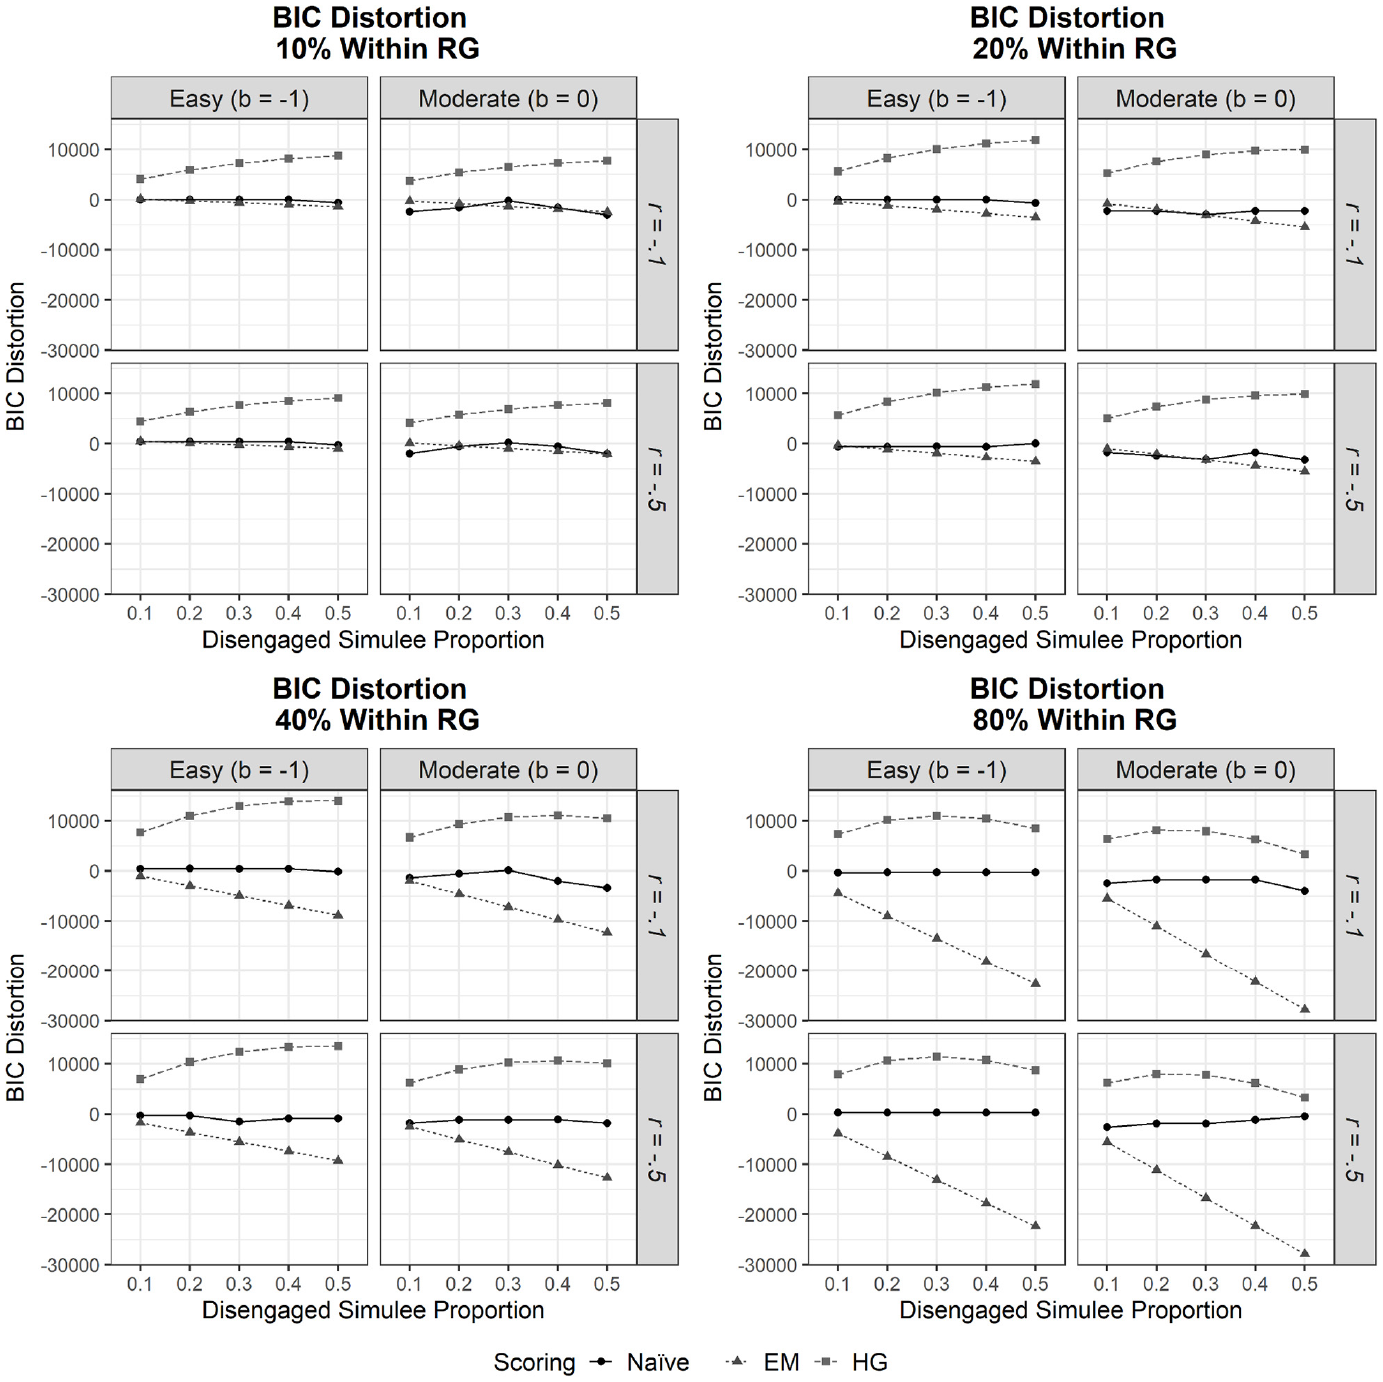
To examine whether HG scoring tends to overfit data under small RG proportions, the Bayesian information criterion (BIC) was collected for each condition and compared with the BIC value obtained when no RG was present (this latter value was calculated separately in baseline conditions by test difficulty level). While the manipulated and baseline conditions differ only in terms of the presence of rapid guessing responses, both conditions originate from the same underlying simulated data structure. Therefore, this comparison of BIC provided a means of assessing distortion in model fit due to RG.
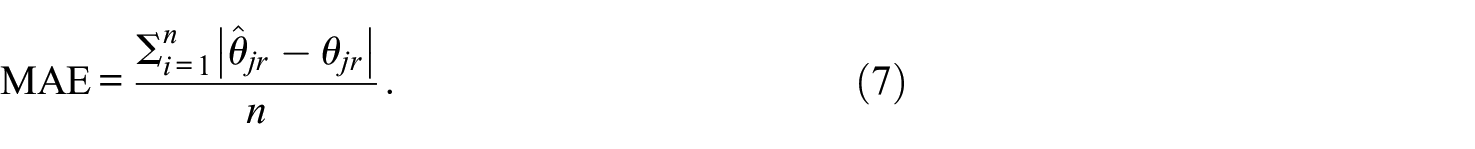
Addressing the second research question within this study, both ability estimate bias and mean absolute error (MAE) were calculated to gauge ability parameter recovery. Bias was defined for each replication as follows:

where
These outcomes were evaluated separately for engaged and disengaged simulees, which aims to investigate the impact of RG on the two subgroups. To assist in data interpretation, an analysis of variance model was fit in which bias was treated as the outcome, while scoring approach (EM and HG scoring), test difficulty, the covariance between
Results
Across conditions, both the naïve and HG scoring approaches were found to converge for every replication; however, EM scoring was susceptible to nonconvergence, with rates ranging from 0% to 6%. The highest rates of nonconvergence were generally noted for conditions under moderate test difficulty with minimal rates observed for easy test difficulty conditions (ranged from 0% to 1%). All nonconverged replications were removed from the analyses presented below.
Does HG Scoring Overfit Data When RG Proportions Are Small?
Figure 1 presents model fit distortion by scoring procedures disaggregated by test difficulty, the proportion of disengaged simulees in the sample, the percentage of within-disengaged simulee RG, and the covariance between
Model Fit Distortion by Scoring Procedure
How Robust Is EM Scoring to Multidimensional RG?
Figures 2 and 3 respectively provide ability estimate bias and MAE across conditions for both engaged and disengaged simulees. Focusing first on engaged simulees, results demonstrated that ability estimate bias was slightly higher when test difficulty was easier compared with moderately difficult; however, within these levels, this outcome was not found to vary across the proportion of disengaged simulees in the sample, the percentage of RG responses within-disengaged simulees, nor the covariance between
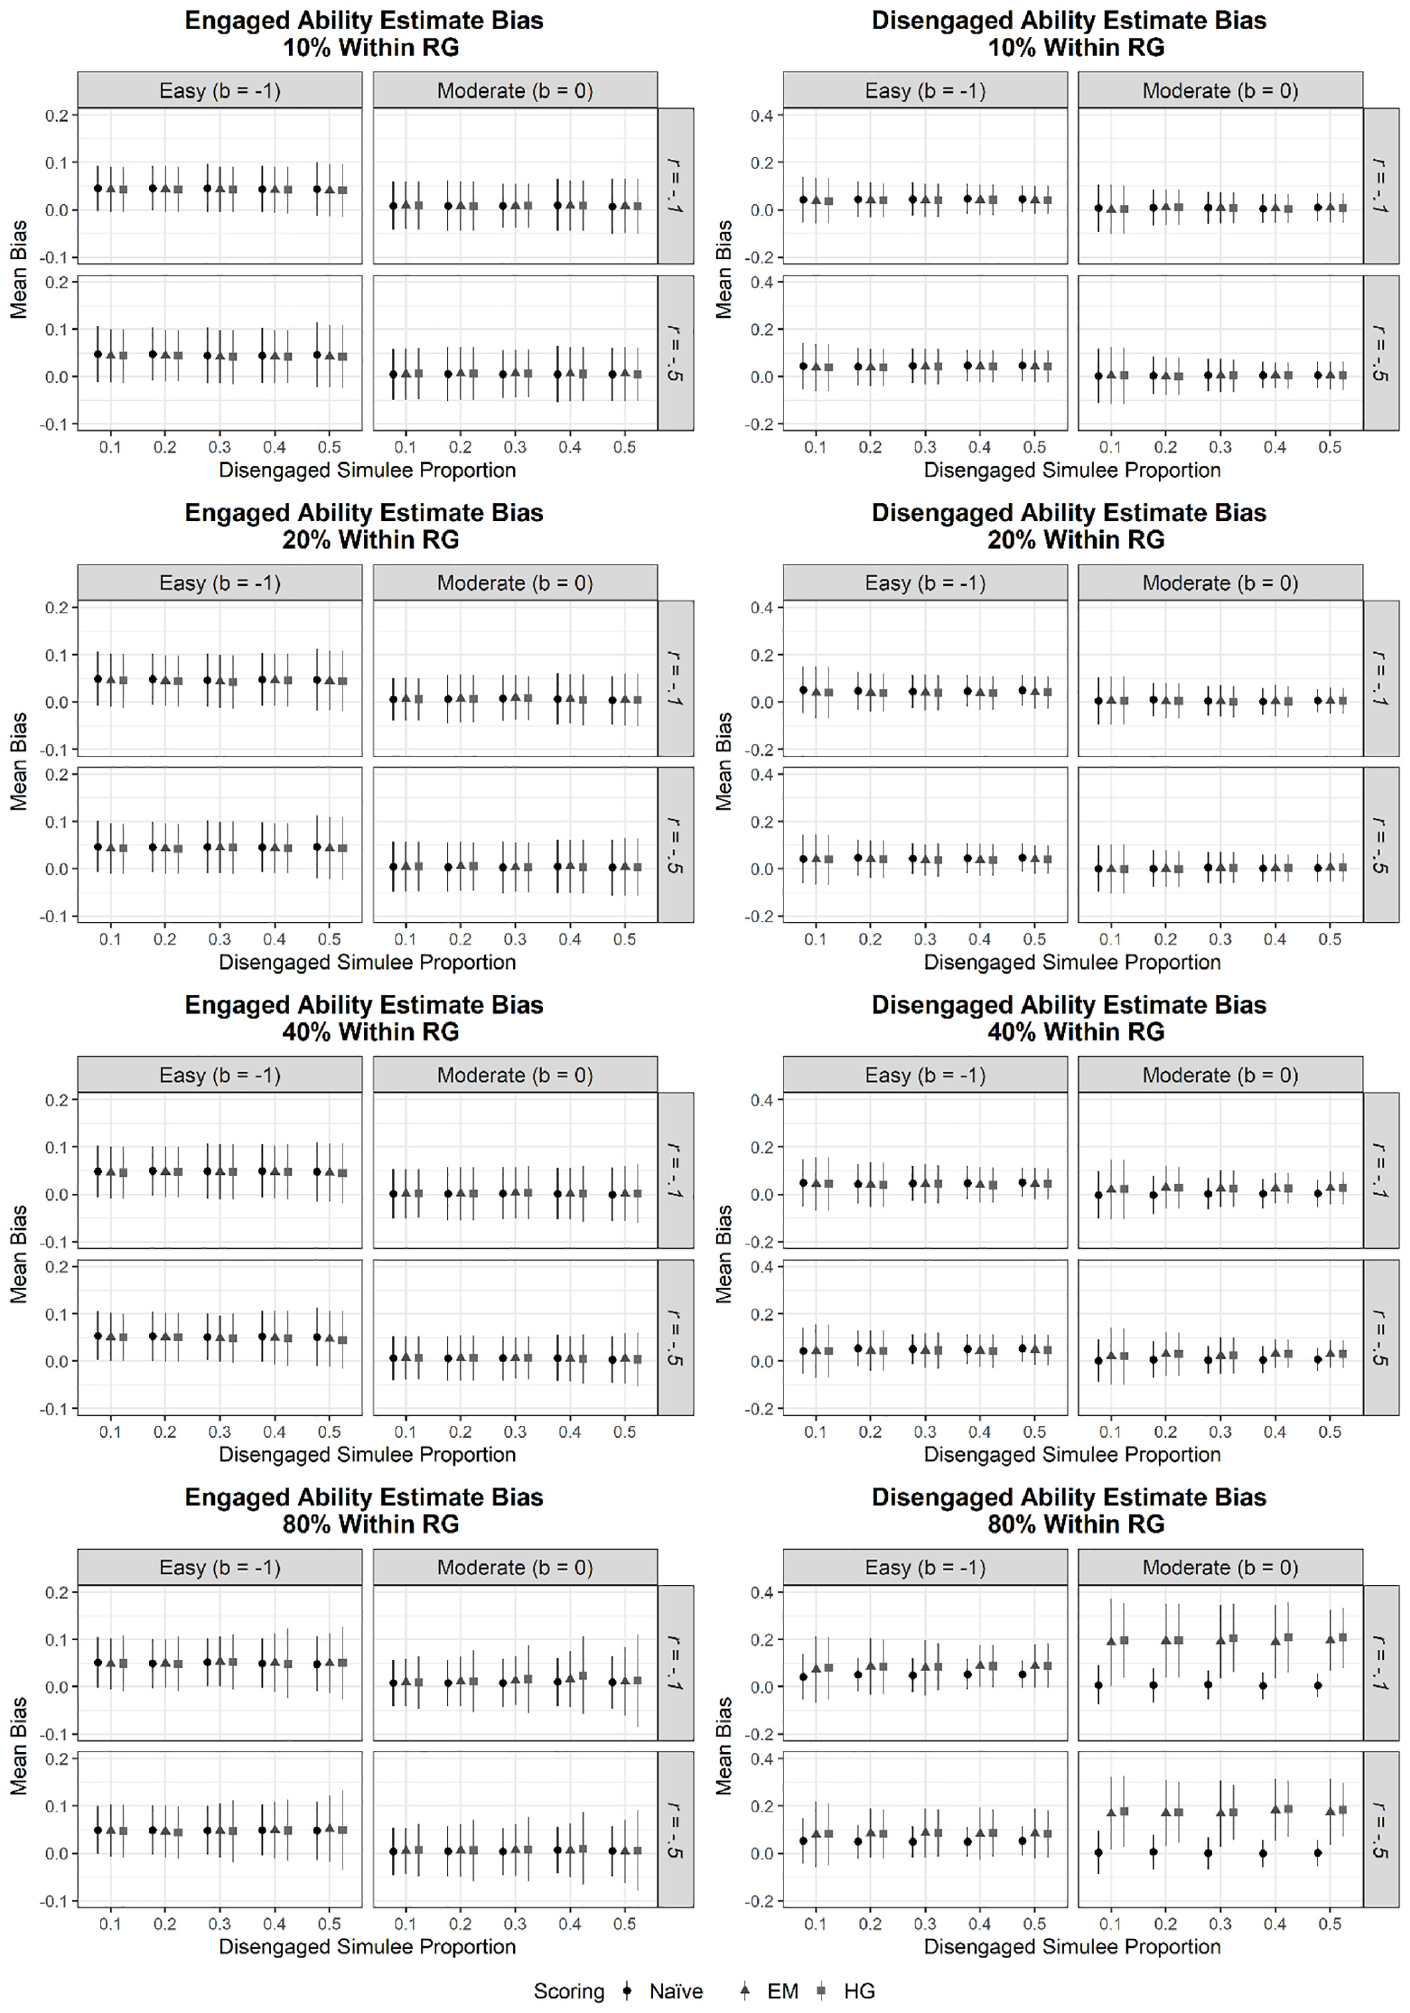
Ability Parameter Estimate Bias Disaggregated by Engagement Type and Scoring Procedure
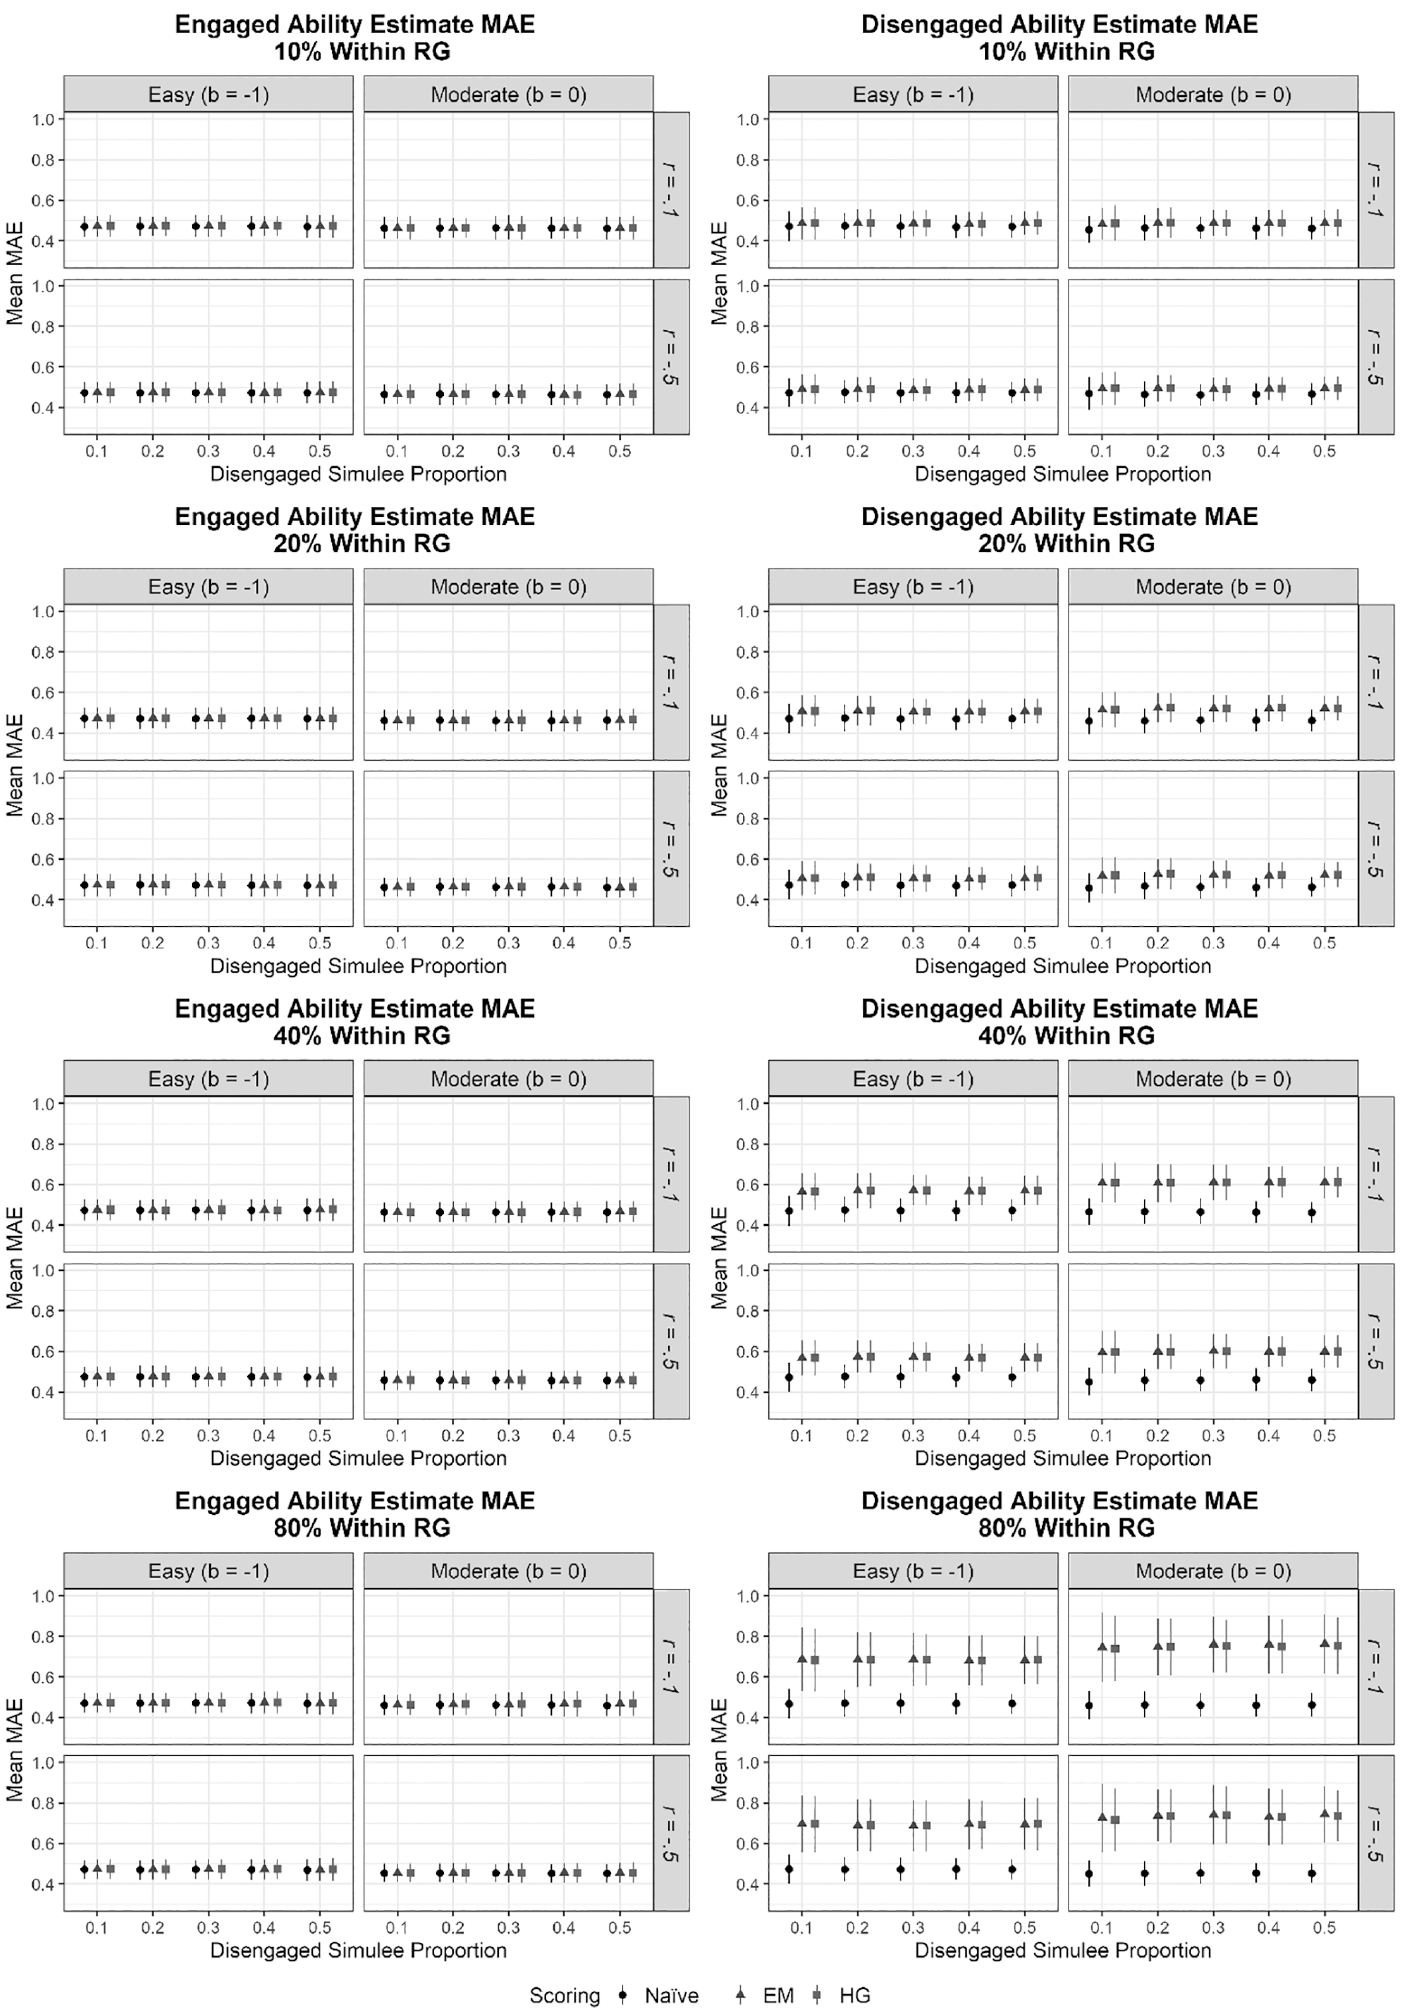
Ability Parameter Estimate Mean Absolute Error Disaggregated by Engagement Type and Scoring Procedure
ANOVA Results Investigating the Effects of Study Factors on Ability Parameter Estimate Bias
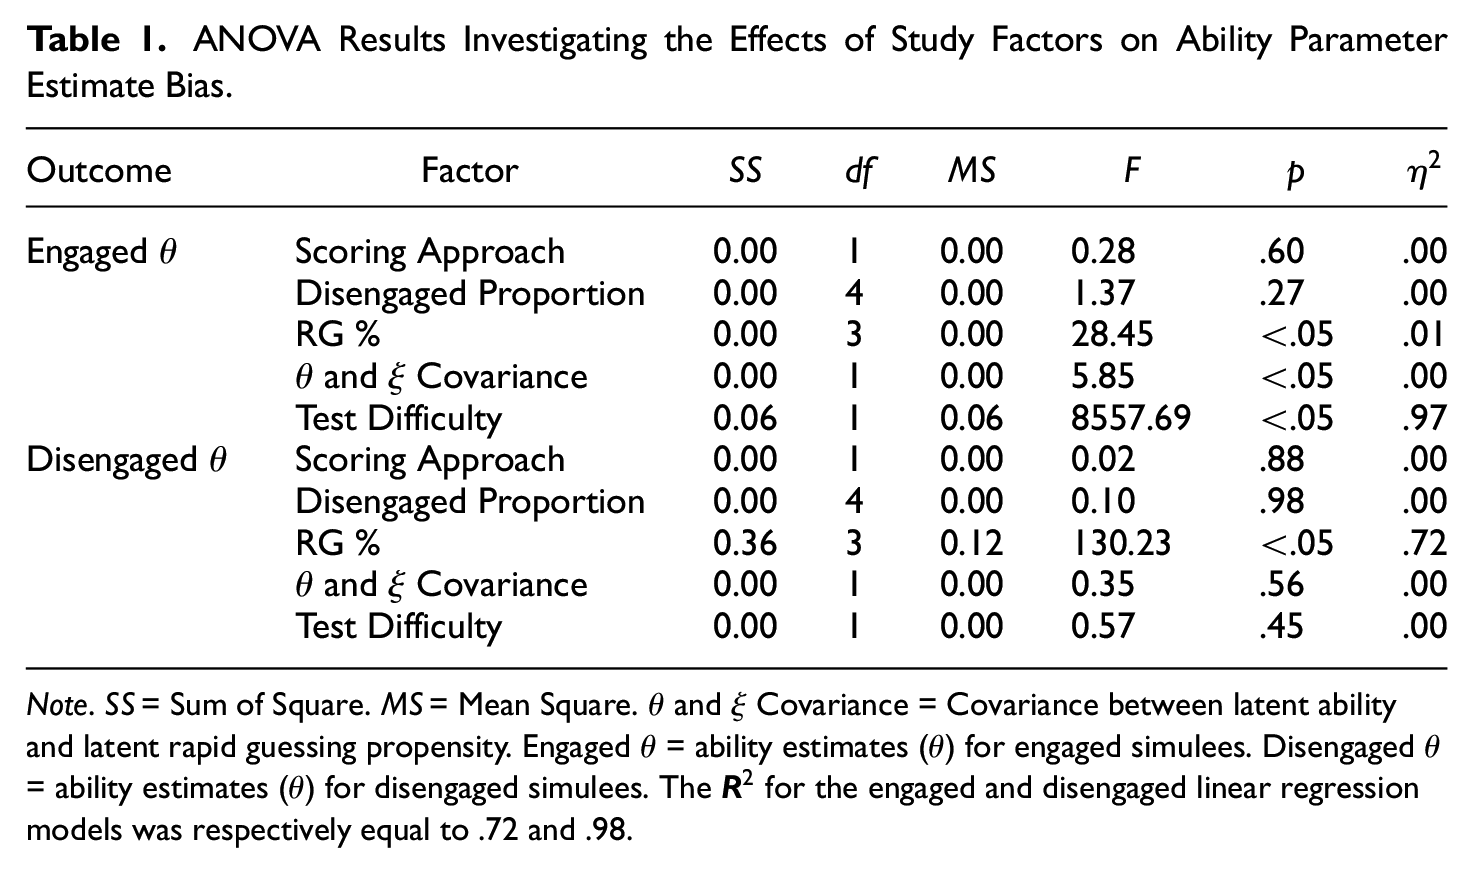
Note.
Turning to disengaged simulee ability estimate bias, no significant differences were noted across levels of test difficulty (p = .45), the proportion of disengaged simulees (p = .98), nor the covariance between
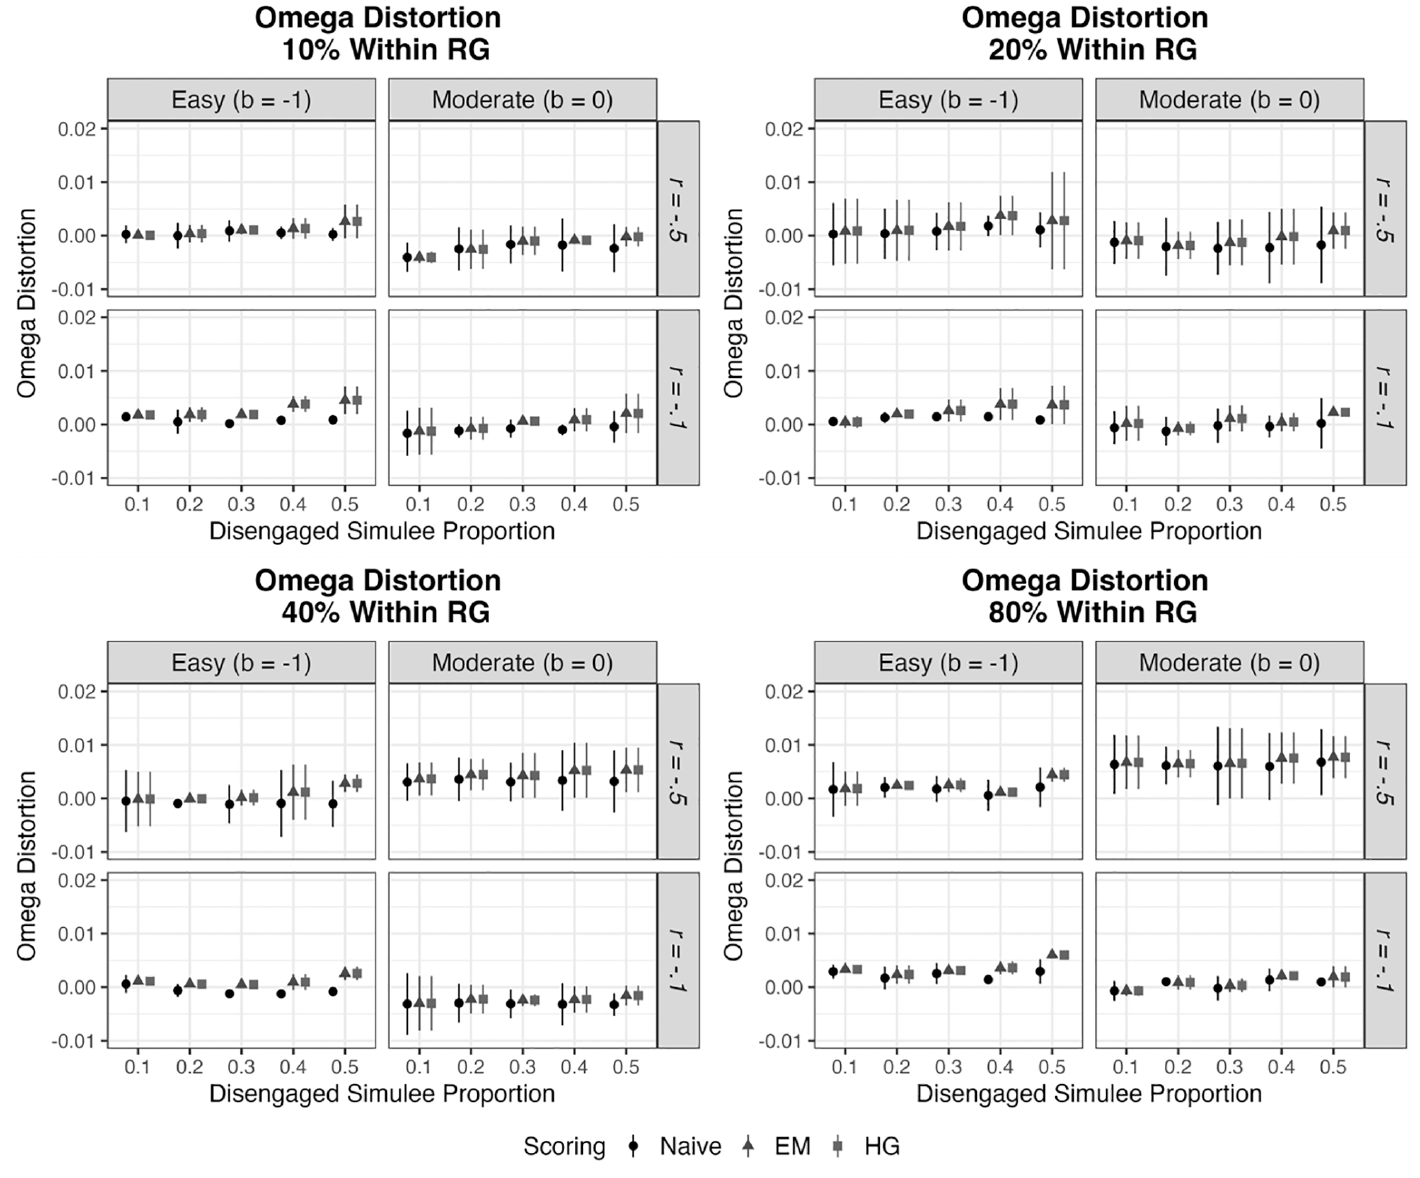
Omega Reliability Distortion Disaggregated by Scoring Procedure
Discussion
The objective of the present manuscript was to examine whether EM scoring, a unidimensional RG scoring approach, is robust to multidimensional RG in terms of model fit distortion, ability parameter recovery, and omega reliability distortion. To this end, a comprehensive simulation investigation was conducted. Overall, the findings of this study indicate that EM scoring provided less model fit distortion compared with HG scoring when the percentage of RG responses comprised as much as 12% of all responses across the total sample. In fact, HG scoring was susceptible to positive BIC value distortion under low rates of RG (1%), due largely to overparameterization. However, benefits were noted in mitigating model fit distortion as the percentage of RG responses in the total sample increased beyond 12% when employing the multidimensional HG approach. With this noted, both RG scoring approaches were found to provide greater absolute BIC value distortion compared to naïvely ignoring the presence of RG, particularly as the average rate of within-disengaged simulee RG grew.
In addition to model fit, this study investigated ability estimate parameter recovery to determine whether EM scoring was robust to multidimensional RG. Although the data generating model was equivalent to HG scoring, ability parameter estimate bias and MAE were equivalent between EM and HG scoring for both engaged and disengaged simulees across levels of test difficulty, proportions of disengaged simulees, within-disengaged simulee RG rates, and most importantly, the covariance between
With these findings noted, naïvely ignoring the presence of RG was not found to lead to significantly worse ability parameter recovery when compared with either RG scoring approach. In fact, when the percentage of RG responses in the total sample was quite large (40%), the naïve approach provided significantly lower mean bias in contrast to HG scoring. In addition, ignoring the presence of RG notably reduced combined systematic and random error (i.e., MAE) when within-disengaged simulee RG rates were high (40% and 80%). This is likely because while the EM and HG scoring attempt to address the issue of RG by imputing missing data, this act of imputation itself can limit available information and inadvertently lead to biases when the RG percentage is high (i.e., greater than 40%). Overall, the naïve approach was associated with minimal bias in average ability estimates for both engaged and disengaged simulees, with absolute bias ranging from 0.00 to 0.05 logits, and similarly led to negligible degrees of distortion in omega reliability estimates (ranging from ≤ .|0025|). This latter finding adds further support that RG generally has minimal impact on reliability estimates (Rios & Deng, 2022).
Limitations and Areas for Future Research
A number of limitations should be noted when interpreting the results from this study. First, only one form of noneffortful responding was examined, and thus, the findings are limited to contexts in which examinees solely disengage by employing RG. However, it is quite possible that within a singular testing event, examinees may display disengagement in a variety of ways, such as both RG and omitting item responses. To address this possibility, recent work by Ulitzsch et al. (2020) has attempted to incorporate both response time information and item responses to evaluate engagement based on RG and item omission by employing a hierarchical latent response model. Efforts such as these are promising as they consider the complexity of accounting for multiple disengaged behaviors simultaneously. Clearly, more research is needed in this area.
An additional limitation associated with this study was related to the data generation process. First, that data were generated based on a bivariate normal distribution, which assumed that RG propensity and ability were linearly associated. However, this assumption may be untenable when differential RG rates are observed within examinees with similar true abilities — a situation that may arise when RG correlates unassociated with ability are present (for a review, see Rios & Soland, 2022; Wise, 2017). If the assumption of a linear association is violated, biased parameter estimates will likely result (Liu et al., 2019). Thus, future research may benefit from employing more nuanced data generation approaches that employ structural equation models to combine both measurement and path models that better encapsulate RG behavior. Furthermore, this simulation considered only a weak and a moderate relationship between latent ability and RG propensity. Future studies should also encompass scenarios reflecting a stronger correlation between latent ability and RG propensity.
The final limitation associated with the present study is that only aggregated sample inferences were investigated. Although this level of aggregation is common in many low-stakes testing contexts (e.g., international comparative studies and educational accountability measures), the results highlighted in this paper do not generalize to situations where inferences are made at the individual level (e.g., formative assessments). Greater focus on this latter context is needed given that the preponderance of research on RG has been limited to aggregated sample contexts (see Wise, 2017), with limited exceptions (e.g., Rios, 2022).
Practical Implications
The findings from this study provide a number of insights for practitioners. First, fitting a multidimensional model to data with minimal RG responses can lead to poor model fit due to model overparameterization. Compared with the EM approach, HG scoring appears to only provide improved model fit when the percentage of RG responses in the total sample is equal to 12% or more. Second, when data are missing not at random (e.g., when latent ability and RG propensity is correlated in this simulation) and as the rate of missing data rises, practitioners should be cautious in interpreting model fit indices, such as BIC, as a means for model selection, as they may be increasingly biased (Davey, 2005). Third, when RG is multidimensional (with the covariance between
Finally, under the conditions investigated, RG was found to have a negligible impact on average ability estimates for both engaged and disengaged simulees as well as on omega reliability estimate distortion. Therefore, when aggregating scores for large samples, inferences concerning reliability and examinee ability may be robust to considerable rates of RG in the data (up to 40%), supporting prior analyses (e.g., Wise et al., 2020). With this noted, it is important to consider that this finding does not generalize to contexts in which inferences are made about individual examinees and between subgroups that differ in RG (see Rios, 2021, 2022). Thus, as recommended by the Standards for Educational and Psychological Testing (American Educational Research Association et al., 2014; Standard 1.12), testing programs reporting scores aggregated at the sample-level may still benefit from continually gauging examinee engagement and documenting the degree and impact of construct-irrelevant responses on score-based inferences (American Educational Research Association et al., 2014).
Footnotes
Author Contributions
J.A.R. conceived of the present study, designed the simulation study, interpreted the findings from the simulation, and wrote the majority of the manuscript. J.D. wrote the R syntax for the simulation and created all tables and figures. All authors conducted critical revisions of the article throughout the review process and approved of the final version to be published.
Declaration of Conflicting Interests
The authors declared no potential conflicts of interest with respect to the research, authorship, and/or publication of this article.
Funding
The authors received no financial support for the research, authorship, and/or publication of this article.