
Abstract
Misreporting and other forms of aberrant responding can undermine the validity of survey-based inferences. Person-level evaluation of aberrant responses is rarely conducted because inspecting individual response patterns is time-intensive. This study proposes an integrated approach for identifying, classifying, and interpreting misfitting response patterns using nonparametric visualizations of person response functions combined with clustering of person response functions. The first step is to calibrate the survey items using an IRT model, such as the Rasch model, to establish an interpretable latent continuum with item-location ordering. Next, person-fit statistics, such as infit and outfit mean square error statistics, are examined, and a smaller subset of response patterns is flagged as misfitting. The third step is to use a nonparametric Hanning procedure to create person response functions, followed by clustering misfitting person response functions using Partitioning Around Medoids (PAM). The advantage of PAM over other clustering methods is that an observed response pattern is identified as a representative case for each cluster. Clusters can then be identified that correspond to an appropriate interpretation for the cluster, such as underreporting, inconsistent reporting, and overreporting patterns. Finally, decisions can be made about how to address aberrant person response patterns. The Household Food Security Survey Module from the U.S. Census is used as an illustration. These visualizations can support transparent data-quality evaluation with the potential for survey improvements.
Keywords
Introduction
Questionnaire-based surveys are among the most widely used tools in social and behavioral sciences. Surveys provide researchers with the opportunity to collect information about the thoughts, behaviors, and experiences of respondents in a structured way (Rubenfeld, 2004). Surveys offer several advantages, including fast data processing, low cost, reduced interviewer bias, greater anonymity, higher standardization, and less training burden compared to interviews (Tourangeau & Yan, 2007). Importantly, surveys can also be used to measure latent constructs such as depression or mathematical ability. Beyond research purposes, surveys play a central role in informing public policy and administrative decision-making across fields such as education, health care, and intervention programs (Bertot et al., 2014; Kromer & Blake, 2024; Rabbitt et al., 2023).
Survey data is foundational to empirical research, especially when dealing with sensitive topics, such as the eligibility of government benefits or participation in intervention programs, where even modest misreporting can meaningfully bias estimates and conclusions. Hence, the quality of survey responses is critical for producing valid inferences and supporting evidence-based interventions. However, surveys are inherently vulnerable to misreporting because they rely on self-reports, and previous work links such data-quality issues to aberrant response behaviors, such as inattentiveness, reduced motivation, inconsistent answers, carelessness, etc. (Doval & Delicado, 2020; Ferrando, 2015; Karabatsos, 2003). These behaviors can undermine the validity of survey-based inferences and, therefore, motivate diagnostic approaches that can detect and interpret irregular response patterns for targeted follow-up.
To clarify why misreporting diagnostics are needed, we first define misreporting and summarize common respondent- and instrument-related sources of misreported survey answers. Misreporting occurs when respondents provide answers that do not reflect their true behaviors, attitudes, or circumstances. It introduces considerable bias into survey findings as it brings errors in interpretation and further reduces the reliability of the conclusions derived from them (Deming, 1944). It can arise from multiple sources, including but not limited to concerns about eligibility for benefits, social norms or expectations, fear of judgment, confusion about item wording, carelessness, guessing, fatigue, or lack of interest (Althubaiti, 2016; Bradburn et al., 1987; Galesic & Bosnjak, 2009; Meade & Craig, 2012; Mittag, 2019; Tourangeau & Yan, 2007).
Misreporting may also stem from instrument-related measurement issues, such as poor item validity or differential interpretation across subgroups (e.g., measurement non-invariance/differential item functioning). Together, these respondent- and instrument-level factors mean that misreporting remains a significant and persistent concern for survey research (Ansolabehere & Hersh, 2017; Böckenholt, 2014; Tourangeau & Yan, 2007).
Researchers have long examined misreporting issues in survey research. Broadly speaking, this literature can be organized into two approaches for examining evidence of misreporting: comparing survey responses with external benchmarks and analyzing response patterns directly. For external benchmarking, prior work compared survey responses with administrative records to demonstrate misreporting in earning inequality (Moore et al., 2000; Valet et al., 2019); validated self-reports against voter records and election administration quality indicators to show systematic overreporting exists for politically engaged non-voters on socially desirable items (Ansolabehere & Hersh, 2017); and used estimated energy requirements as an external benchmark to identify energy intake misreporting and recovered more accurate diet-obesity associations by accounting for reporting status (Jessri et al., 2016). Similarly, Mittag (2019)’s study on government benefits validated survey reports against administrative records and revealed substantial underreporting of SNAP (food assistance program) participation, which biases economic analyses.
In addition to linking survey reports to external benchmarks to identify misreporting, another approach is to examine respondents’ response patterns directly. Instead of relying on external benchmarks such as administrative records or physiological constraints, model-based approaches grounded in item response theory (IRT), including Rasch models, focus on detecting aberrant response patterns within the instrument itself using person-fit statistics and response-function diagnostics. In this context, Meijer (1996) provided a detailed classification of atypical response behaviors based on individual response patterns, including careless answering, lucky guessing, dishonest or deceptive responding, creative or imaginative responses, and random answering. Among these, careless answering, creative responses, lucky guessing, and random responding are particularly common in survey data.
Subsequent methodological work showed that person-fit approaches derived from classical test theory and IRT can be used to detect such misreporting-like patterns, with the Rasch model offering a particularly useful framework for generating stable and interpretable person-fit indices (M. F. Li & Olejnik, 1997; Meijer, 1996; Sijtsma & Meijer, 2001).
Building on this index-based tradition, Meade and Craig (2012) focused on a specific form of aberrant responding, careless or inattentive responding patterns, including both random and non-random forms, and argued that the choices and effectiveness of detection indices depend on the nature of the data. In a related line of research, Sijtsma and Meijer (2001) explored the use of person response functions (PRFs) to identify non-fitting item score patterns through visual inspection. More recently, this graphical approach has been extended by incorporating functional data analysis and clustering methods, allowing researchers to classify distinct misfit patterns and more precisely characterize how individuals deviate from model-based expectations (Turner & Engelhard, 2024).
Besides classifying studies according to whether they rely on external benchmarks or respondent-based diagnostics, methods for detecting misreporting from response patterns can also be organized by analytic strategy. A common distinction is between descriptive approaches and statistical or model-based approaches. Descriptive approaches summarize response behaviors using relatively simple indicators, such as long-string analysis, which flags repeated responses across items (Johnson, 2005); intra-individual response variability (IRV), which captures within-person dispersion in responses (Dunn et al., 2018); and observational indices, such as attention-check items (Meade & Craig, 2012) and unusual response times (Wise & Kong, 2005). These methods are often used as preliminary screening tools.
In contrast, statistical or model-based approaches define expected response patterns within a measurement or probabilistic framework and then assess the extent to which observed responses depart from those expectations using person fit statistics, outlier measures, or person response function diagnostics.
Because many surveys are designed to measure latent constructs such as stress, engagement, or food insecurity, a methodological framework is needed that captures the relationship between item responses and the underlying trait. Item response theory (IRT) provides such a framework and is widely used to scale surveys intended to measure latent constructs (Embretson & Reise, 2013). Within this tradition, Rasch measurement theory (RMT) is particularly valuable because, when model-data fit is adequate, it supports invariant measurement by yielding item-invariant person estimates and person-invariant item calibrations (Engelhard & Wang, 2020).
Within the Rasch framework, person response functions (PRFs) provide one useful way to detect aberrant or unexpected response patterns at the individual level. A PRF represents a respondent’s probability of endorsing items as item location shifts toward the right side of the continuum, where higher item locations indicate lower endorsement likelihood. The Rasch model’s expected curve serves as the benchmark for evaluating unexpected response patterns. Deviations from that expected pattern may indicate inconsistent or aberrant responding and, therefore, possible misreporting. In addition, model-based statistical indices such as person infit and outfit mean square errors (MSE), likelihood-based indices such as standardized log-likelihood statistics
In survey research on misreporting, a variety of methods have been used to identify irregular response patterns. For example, consistency-based indices such as Guttman errors flag violations of an expected hierarchical item structure (Meijer, 1996), whereas multivariate outlier methods such as the Mahalanobis distance identify unusual response profiles by quantifying how far an observation lies from the center of the sample while accounting for the covariance structure among variables (Mahalanobis, 2018). Although these methods are useful for screening unusual cases, the present study focuses on a Rasch-based framework as it allows unexpected responding to be evaluated relative to an underlying latent continuum and supports more interpretable person-level diagnostics.
At the same time, simply detecting misfit is often not sufficient for understanding how or why respondents deviate from expected patterns. In many applications, model-based indices indicate whether unusual responding is present, but they do not by themselves provide an easily interpretable characterization of the form that misfit takes across the item location continuum. For this reason, graphical and pattern-based methods can play an important complementary role in diagnosis. In particular, visual inspection of PRFs can help reveal whether misfit reflects irregular responding concentrated among easy items, difficult items, or particular sections of the scale.
However, descriptive or visualization methods used alone may also be limited, especially when items reflect less meaningful locations on the continuum. For example, a long string of “0” responses may represent a genuinely low trait level rather than careless responding, and intra-individual response variability (IRV) may confound valid consistency with inattentiveness. In addition, a case-by-case review becomes impractical when many respondents are flagged for misfit. Thus, although both model-based and graphical approaches are useful, each provides only partial information when used in isolation.
To address these limitations, we propose an integrated framework to identify and diagnose misreporting in surveys and to classify misreporting behaviors. Specifically, the framework combines Rasch analysis, PAM clustering to group misfitting response patterns into distinct response-behavior categories, and a Hanning smoothing procedure applied to person response functions (PRFs) to support visual diagnosis. Within this framework, the Rasch model places persons and items on a common latent continuum, and the resulting model-based expectations are used to compute person-fit statistics that flag respondents whose observed patterns deviate from model expectations. Next, PAM (also known as K-medoids; Kaufman & Rousseeuw, 1990) clustering is applied to the misfitting response patterns to identify distinct groups and a representative case (the medoid) for each cluster. In the final step, a Hanning smoothing procedure is applied to PRFs to visualize the resulting response-pattern profiles and support diagnosis of misfitting behaviors. The proposed approach focuses on identifying general patterns of misreporting in relation to respondents’ positions on the latent continuum and their endorsement behaviors across items (e.g., over-, under-, and inconsistent endorsement), rather than diagnosing specific response styles such as straightlining or extreme responding.
The purpose of this study is to illustrate an integrated framework for identifying, diagnosing, and classifying aberrant responses in survey data, while also providing group-level diagnosis of misfitting response behaviors. Using the USDA Household Food Security Survey Module (HFSSM) as a case demonstration, this study answers the following guiding questions:
Can person-fit statistics serve as an initial screening tool for detecting potential misreporting response patterns in survey data?
Can meaningful categories of misreporting response behaviors be identified through PAM clustering?
How can Hanning-smoothed person response functions (PRFs) support the interpretation and diagnosis of the misfitting response patterns identified in survey data?
Methodology
Participants
This study used secondary data from households that responded to the Household Food Security Survey Module (HFSSM) in 2019 (
Instrument
The Household Food Security Survey Module (HFSSM) was initially administered as part of the U.S. Census in 1995. The full survey consists of 18 items: 10 questions (items 1-10) for all households and 8 (items 11-18) for households with children (U.S. Department of Agriculture, Economic Research Service, 2026). Items in the HFSSM were originally calibrated with the Rasch model. The survey module has been included in several studies (Engelhard et al., 2018; Rabbitt & Coleman-Jensen, 2017; Rabbitt et al., 2021; Tanaka et al., 2020). For the present analysis, all item responses are binary indicators (0=non-endorsement, 1=endorsement), as used by the USDA.
Rasch Model
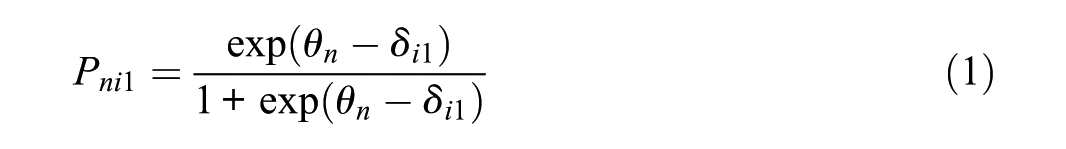
The Dichotomous Rasch Model (Rasch, 1980/1960) was used for this study to estimate person and item locations on the same scale. Under the Rasch model, the conditional probability of scoring 1 on the item
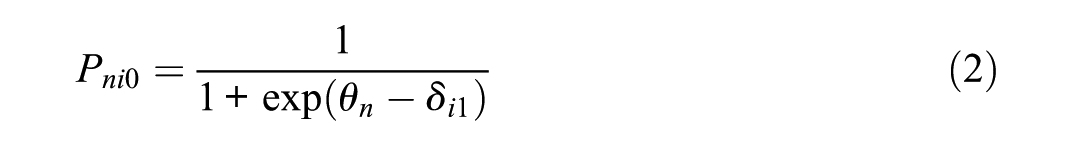
With the sum of total probability of 1, we can calculate the conditional probability of scoring 0 on the item
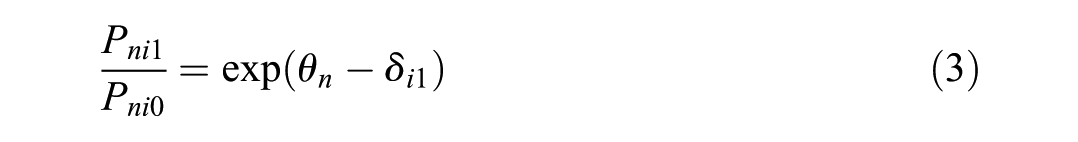
Further, the odds of scoring 1 versus scoring 0 can be written as:
If we apply the logarithm to formula (3), then we can obtain the
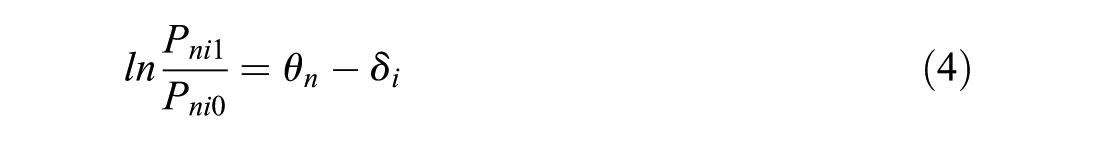
On the left is the log-odds of endorsing an item. On the right side,
In the present survey context, item location is interpreted as endorsement likelihood along the latent continuum, where lower-location items are more frequently endorsed, and higher-location items are less frequently endorsed, reflecting more severe levels of the underlying construct.
This formulation shows that the Rasch model can be viewed as a logistic regression model, where the log-odds are the predicted values, and the predictors are person and item location together explain the likelihood of endorsing an item.
Person Infit and Outfit Mean Square (MSE)
Under RMT, person-fit indices like Infit and Outfit mean square error (MSE) can also be used for persons and items to detect misfit. Both Infit and Outfit statistics are used to quantify the deviation between observed response and expected probabilities, and can be calculated using the following formulas (Engelhard & Wang, 2021):
Person Infit MSE (
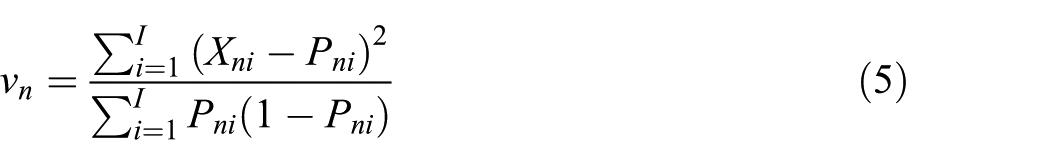
Person Outfit MSE (
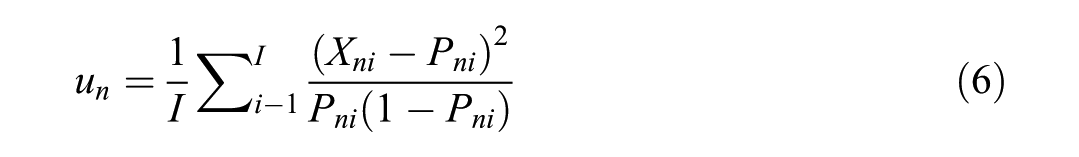
In which
The fit statistics obtained above can be classified into four categories: (A) responses that are productive for measurement, (B) those that are less productive, (C) responses that are unproductive, and (D) responses that distort the measurement process. We present the interpretive guideline shown in Table 1, adapted by Engelhard and Wang (2021) and originated from Wright and Linacre (1994).
Person-Fit Indices Interpretation Guideline.
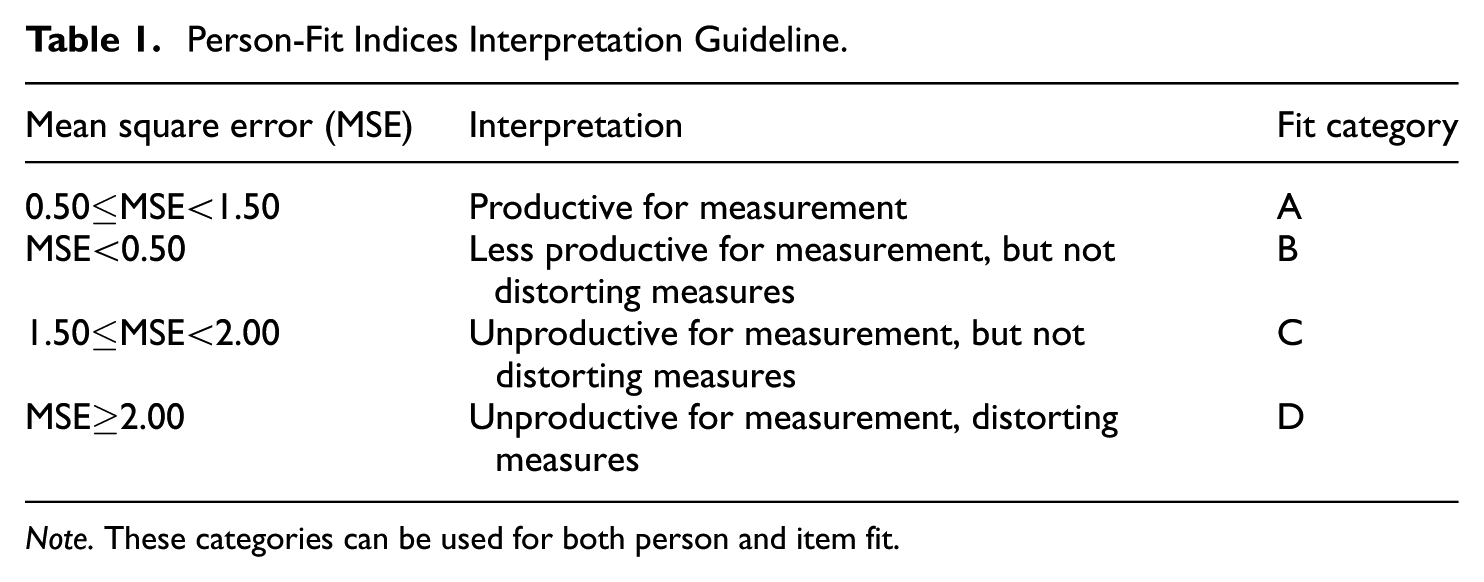
Note. These categories can be used for both person and item fit.
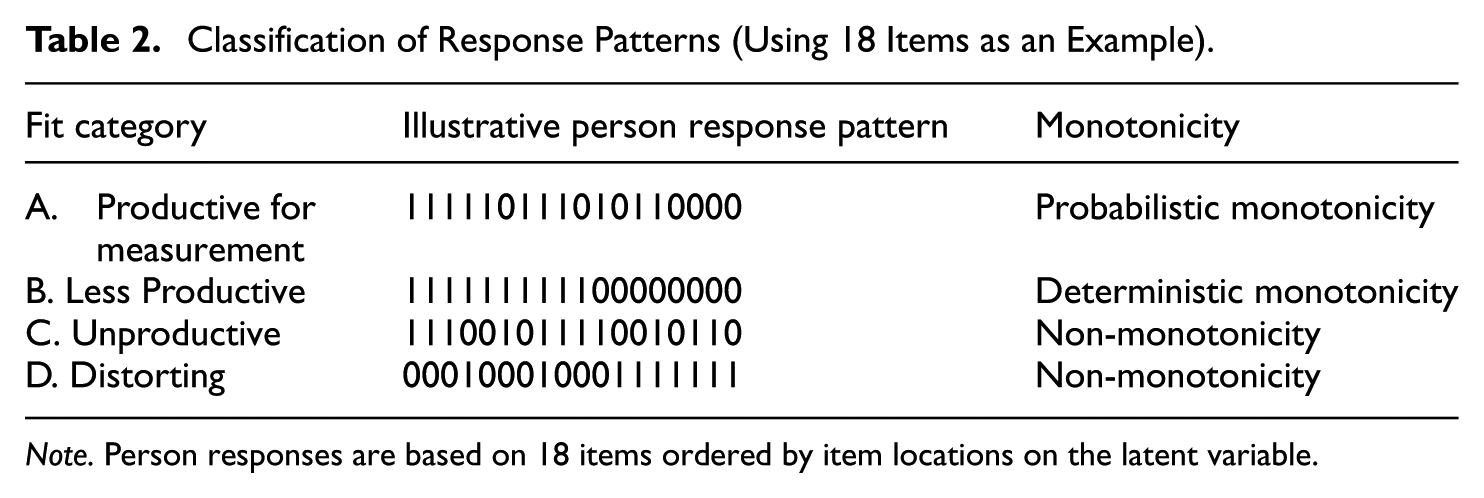
Table 2 presents an illustrative classification of person response patterns using 18 survey items ordered by item location on the latent continuum. In the present survey context, item location reflects the relative likelihood that an item will be endorsed rather than answered correctly. Items lower on the continuum are more frequently endorsed, whereas items higher on the continuum are less frequently endorsed and reflect more severe levels of the underlying construct. This ordering allows response patterns to be evaluated in terms of whether respondents endorse items in a manner that is consistent with the expected progression across the continuum.
Classification of Response Patterns (Using 18 Items as an Example).
Note. Person responses are based on 18 items ordered by item locations on the latent variable.
The table organizes these patterns into four fit categories and links each category to its corresponding monotonicity characteristic. Category A, labeled productive for measurement, reflects probabilistic monotonicity, indicating that as the latent trait increases, the probability of endorsing or correctly answering more difficult items generally increases, although some variability in individual responses is still expected. Category B, labeled less productive, reflects deterministic monotonicity, indicating a stricter and more predictable ordering of responses across the item continuum.
In contrast, Categories C and D are characterized by non-monotonicity. Category C, labeled unproductive, represents response patterns that do not follow a consistent progression across the latent continuum and therefore contribute less useful information for measurement. Category D, labeled distorting, also shows non-monotonicity, but in a way that may be more problematic because the response pattern can distort interpretation of the underlying trait. In the present survey context, these non-monotonic patterns may reflect inconsistency, under- or over-endorsement relative to the expected ordering of item endorsement along the latent continuum.
In the context of the present study, Categories C and D are of particular interest because they represent the types of response patterns most likely to reflect aberrant or misfitting responding at the initial screening stage. This focus is consistent with prior research showing that person-fit statistics provide a useful basis for identifying misfitting response patterns in survey and assessment data (Engelhard et al., 2018; Ferrando, 2015; Meijer & Sijtsma, 2001; Niessen et al., 2016).
PAM (k-Medoids) Clustering
After identifying misfitting responses using person fit criteria (infit or outfit values exceeding the selected threshold), we adapted a distance-based clustering procedure to group similar misfitting responses and summarize each group with a representative observed response profile.
Let
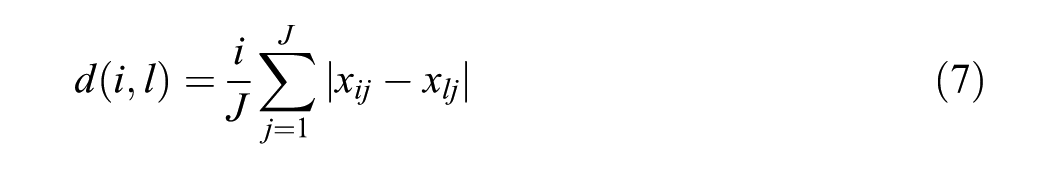
For example, with 18 items, if the responses for a person
We used Partitioning Around Medoids (PAM; Kaufman & Rousseeuw, 1990; Rousseeuw, 1987) to partition respondents into
For each cluster
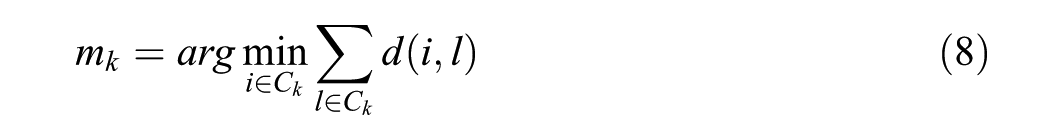
Thus, medoids serve as interpretable “prototype” response patterns that can be examined and visualized directly.
To select k, we evaluated candidate solutions (
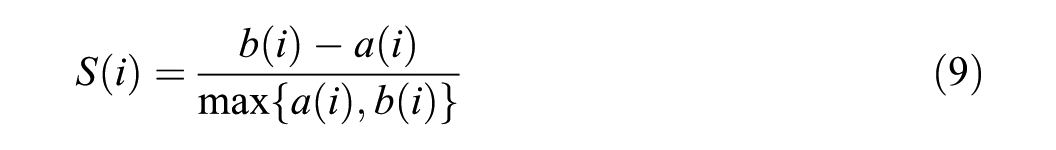
Values near 1 indicate strong separation, values near 0 indicate overlapping clusters, and negative values suggest potential misassignment. Following common guidelines, mean silhouette values
Although the full dataset included 2,582 households, the PAM clustering analysis was conducted only on the 114 response patterns flagged as misfitting during the person-fit screening stage. Thus, the effective sample size for clustering was substantially reduced, which mitigated the computational burden typically associated with PAM in large datasets. Nevertheless, because PAM has relatively high computational complexity, its application to substantially larger case-level datasets may require approximate or alternative clustering methods (Schubert & Rousseeuw, 2021).
Hanning (Smoothing) Algorithm
Building on person response functions (PRFs), we apply the Hanning (smoothing) algorithm as a simple nonparametric tool to make localized irregularities in response patterns easier to see, especially “hills” and “valleys” along the item-location continuum (Engelhard, 2013; Engelhard & Wang, 2024). The Hanning approach is commonly attributed to Tukey (1977) and traces back to a three-point running weighted average introduced by Von Hann and Ward (1903). Conceptually, it smooths noisy item-level responses without imposing a parametric functional form, which makes it well-suited for diagnostic, person-level visualization.
For dichotomous items, a widely used three-point Hanning smoother is (Tukey, 1977; Velleman & Hoaglin, 1981; Von Hann & Ward, 1903):
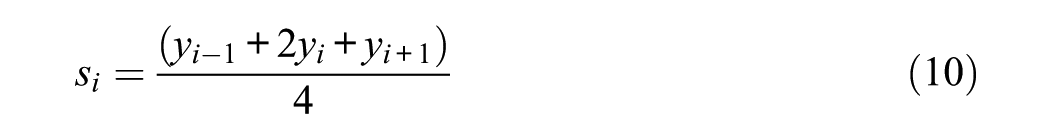
In which
Applied to PRFs, we plot
Analytic Procedure
We implemented a staged workflow that links Rasch-based person-fit screening to nonparametric diagnosis and practice-oriented follow-up. We began with preliminary data cleaning and Rasch model checks to ensure the instrument provided an interpretable continuum for PRF diagnostics, including evidence related to unidimensionality, targeting (Wright map), and item-level fit and reliability. Using the fitted Rasch model with the joint maximum likelihood estimation method (TAM package in R; Robitzsch et al., 2024), we then computed person infit and outfit mean square errors (MSEs) and flagged respondents for follow-up when either statistic fell into Category C or D as step 1 (selecting criteria can be seen in Table 2).
For flagged respondents, we clustered them using PAM (k-medoids) to group the misfitting respondents into distinct patterns and identify a representative case (medoid) for each cluster in step 2 (using the cluster package in R; Maechler et al., 2026). For those representative cases identified in step 2, we applied a three-point Hanning smoothing procedure to obtain smoothed (nonparametric) PRFs, which make localized “peaks” and “valleys” easier to interpret than global fit statistics alone (Engelhard, 2013). Finally, we diagnosed the misfitting response patterns (e.g., underreporting, inconsistent reporting, and overreporting), emphasizing diagnosis and documentation rather than automatic deletion.
Results
We fitted a dichotomous Rasch model to examine the psychometric quality of the scale (Table 3). Overall, the Rasch model explains 59.48% of the variation in responses, providing strong support that the items largely reflect a single underlying construct. This exceeds the commonly used guideline that at least 20% of the variance should be explained to support unidimensionality (Reckase, 1980/1960).
Rasch Analysis Summary Statistics.
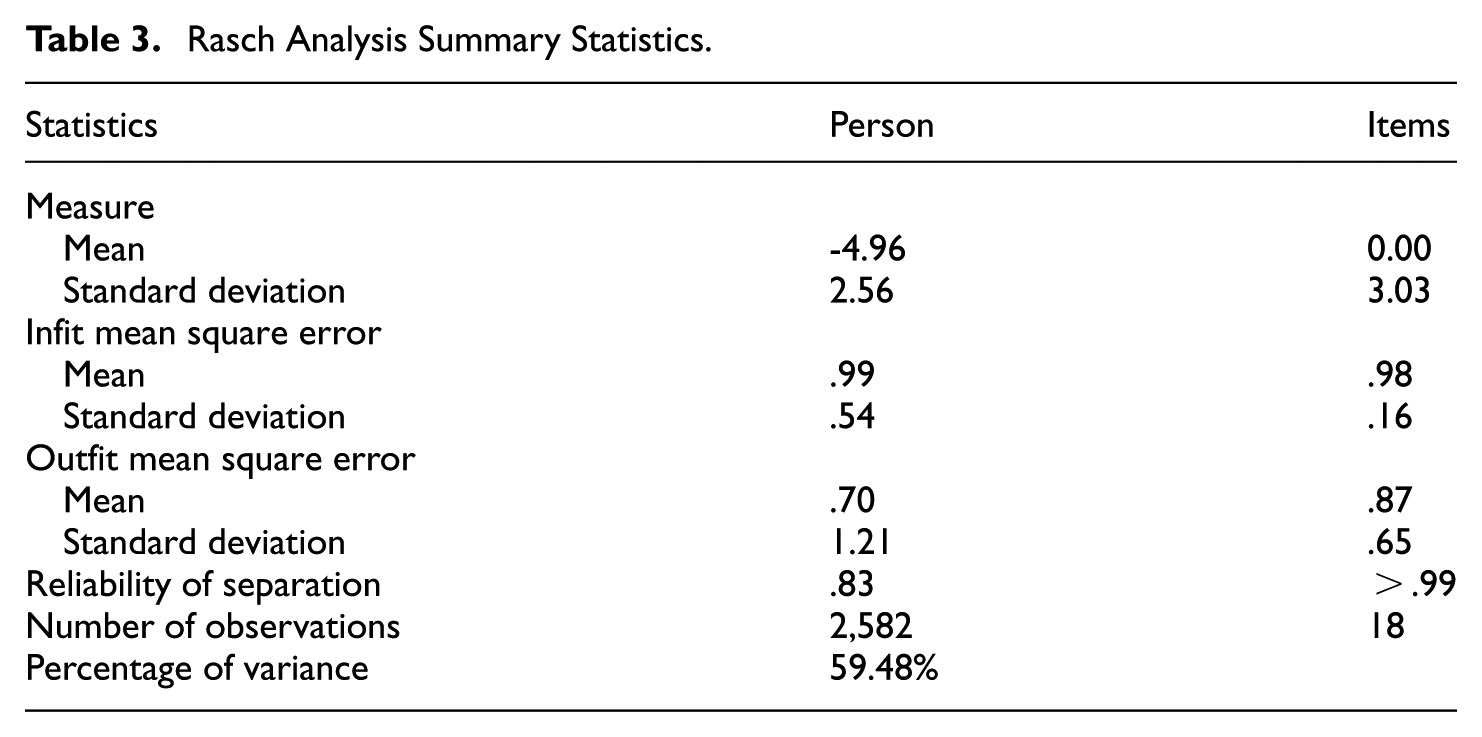
On average, respondents had relatively low person measures (
Table 4 summarizes each item’s location on the measurement scale, its uncertainty (standard error), and two fit indicators (infit and outfit MSE). Using the guideline in Table 1, we grouped items into four fit categories (A-D), where categories A and B reflect acceptable or orderly response patterns, and categories C and D suggest potential misfit. These latter categories indicate items that deviate from the expected endorsement ordering along the latent continuum. Most items fit the model well, but two items showed signals of unexpected responding based on outfit: item 1 (“Worried food would run out”) and item 11 (“Relied on low-cost foods for children”). Because outfit MSE is sensitive to unusual responses that occur infrequently, these results suggest that a small number of households may have responded to these items in ways that do not align with the scale’s general pattern, motivating further person response analysis.
Summary of Item Statistics for HFSSM (18 Items).
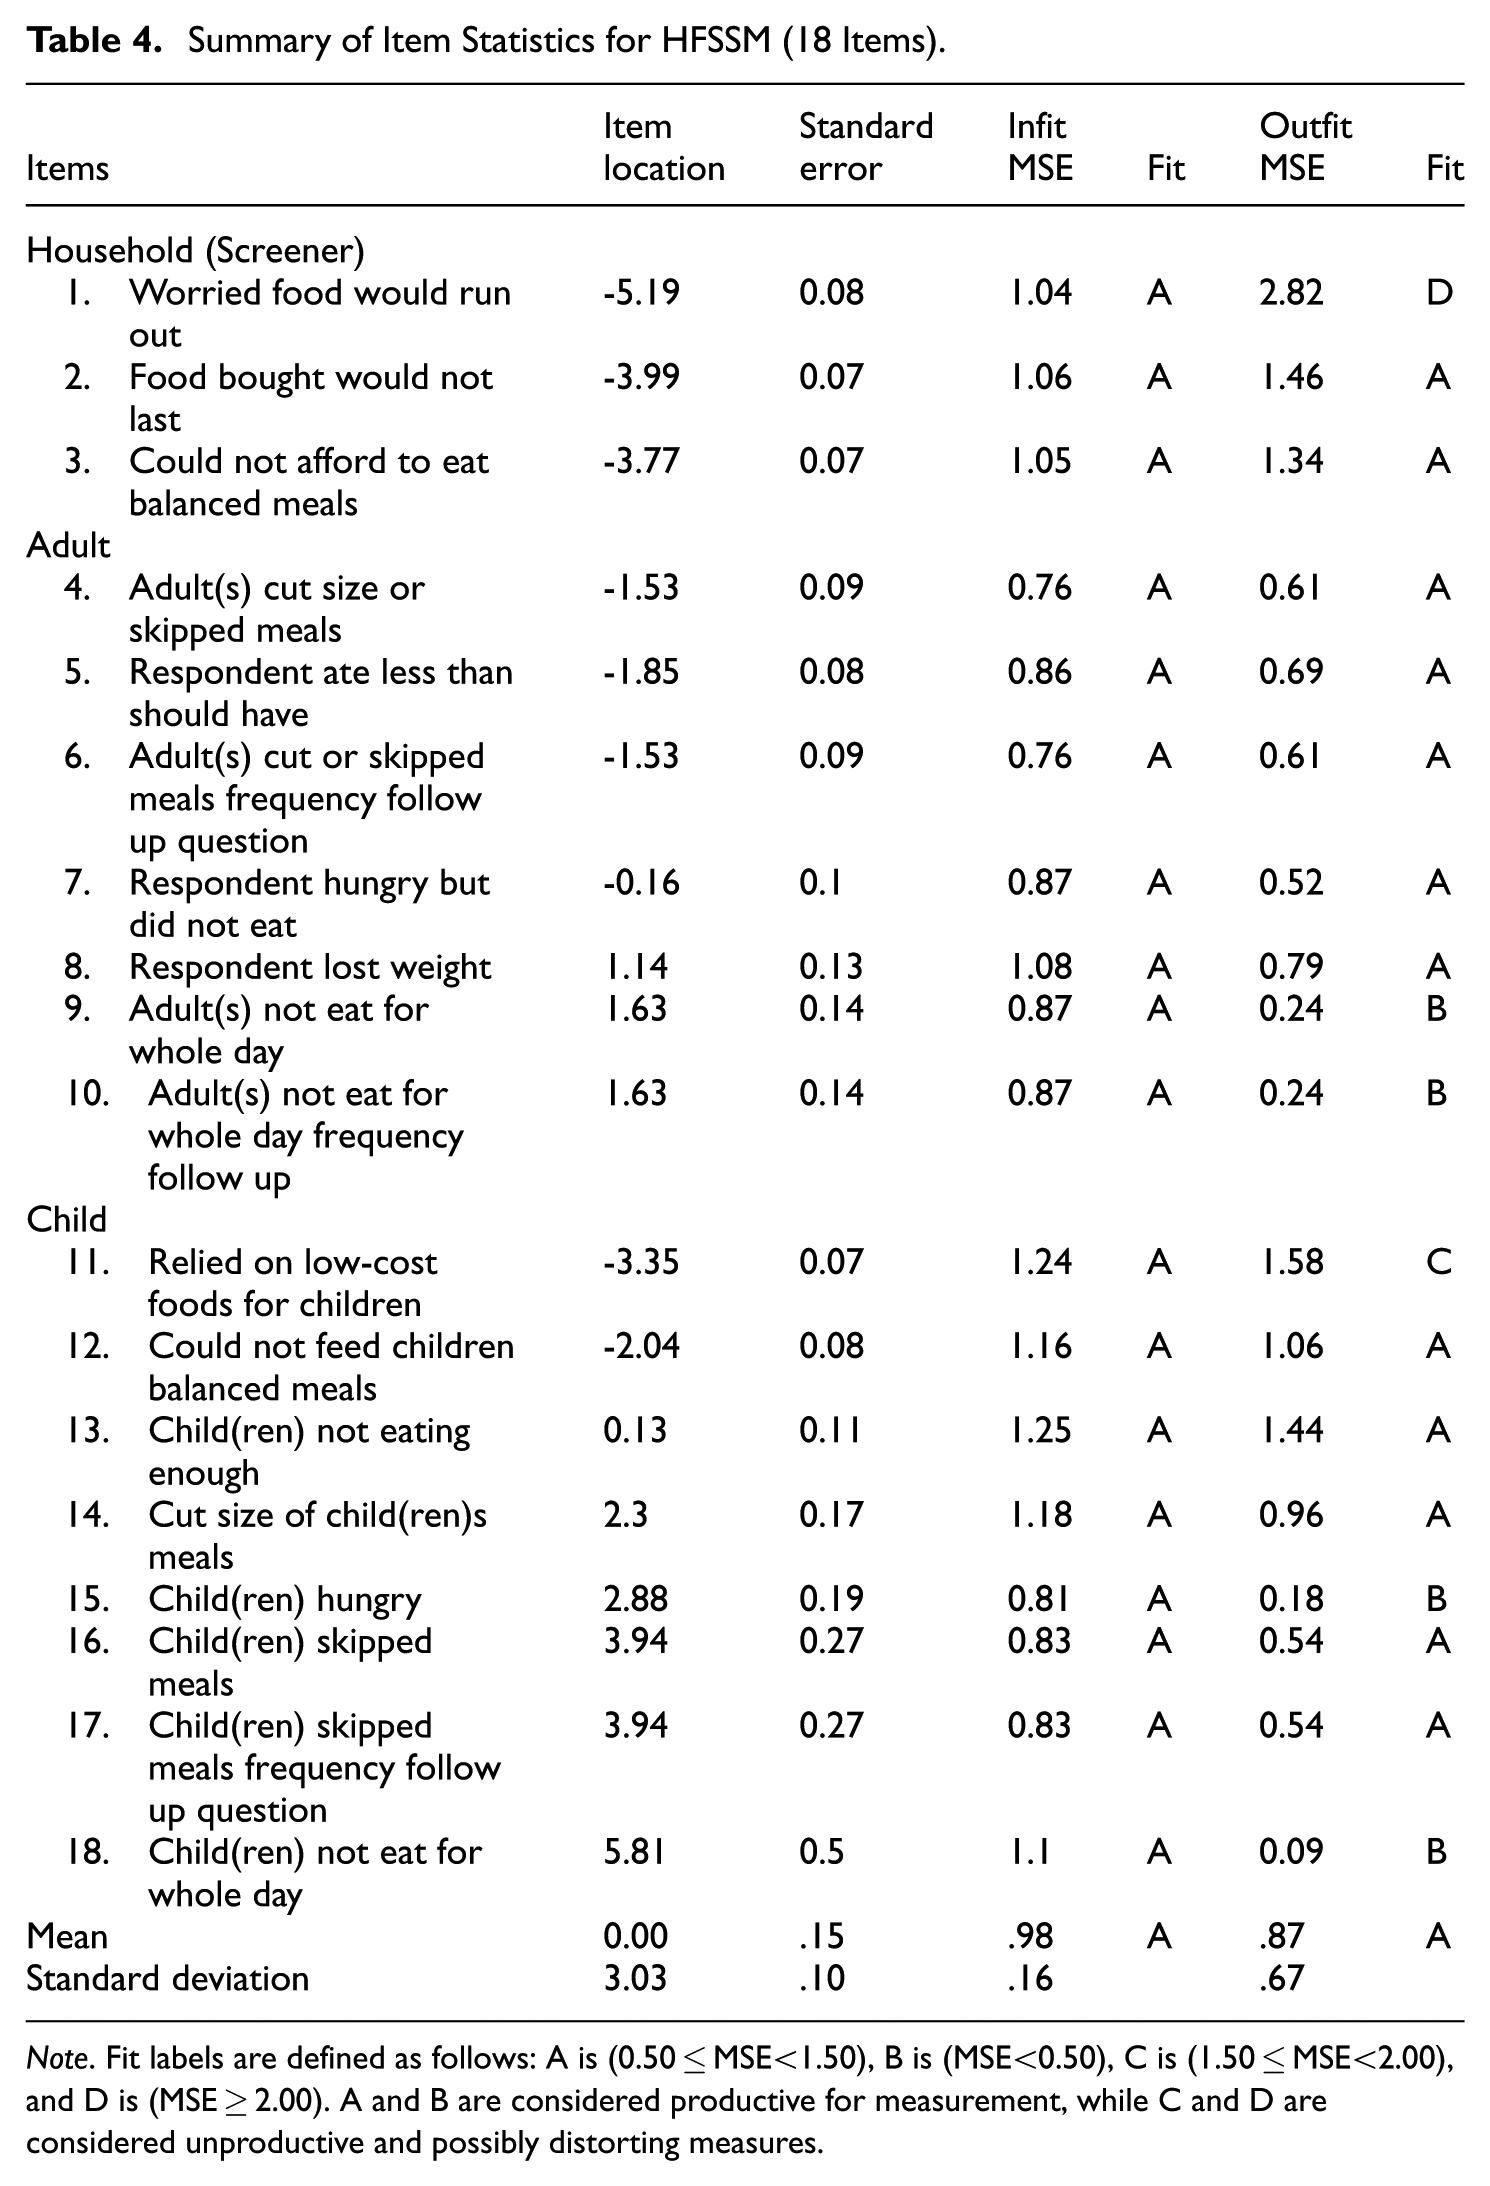
Note. Fit labels are defined as follows: A is (0.50≤MSE<1.50), B is (MSE<0.50), C is (1.50≤MSE<2.00), and D is (MSE≥2.00). A and B are considered productive for measurement, while C and D are considered unproductive and possibly distorting measures.
Figure 1 (the Wright map) places both households and items on the same logit scale representing household food insecurity. Items are ordered from harder to endorse (top) to easier (bottom). The items are well distributed across the scale, indicating that the HFSSM covers a wide range of severity levels. Child-related items appear harder to endorse than adult/household items, which is consistent with the idea that severe child food insecurity tends to occur at higher levels of overall insecurity. The household distribution is concentrated toward the lower end of the scale, with most households below about 2 logits, suggesting a skewed sample with many households at relatively lower levels of food insecurity, which is common in this food insecurity-related context. Overall, HFSSM demonstrated adequate psychometric quality.
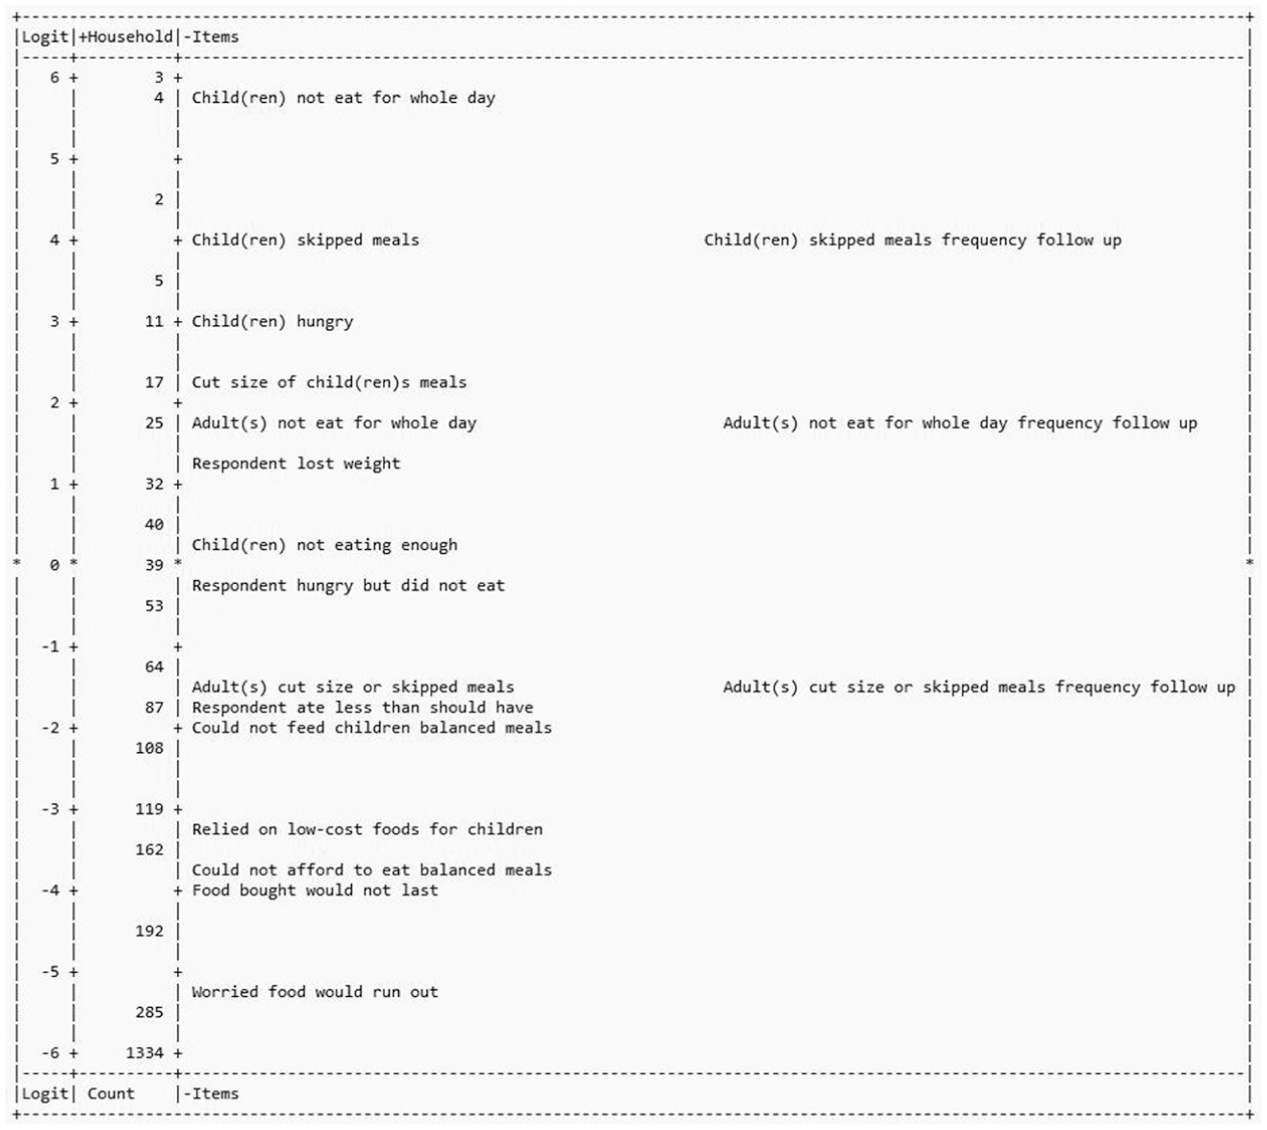
Wright map.
We then used person-fit statistics as an initial screen for potentially irregular response patterns. Households were flagged when either infit or outfit exceeded 1.5 (categories C and/or D). Under this rule, 114 of 2,582 response patterns (4.4%) were flagged for follow-up clustering to examine group-level patterns.
For the clustering analysis, the silhouette results showed modest differences across candidate PAM solutions, with the overall mean silhouette increasing from k= 3 (M= .299) to k= 4 (M= .312) and k= 5 (M= .327). In particular, solutions were evaluated based on (a) silhouette values as an objective measure of cluster separation and (b) interpretability and reproducibility of the resulting clusters. Although the five-cluster solution achieved the highest overall mean, it contained a clearly weak cluster (Cluster 5, M=.167), suggesting over-partitioning and reduced interpretability; by contrast, the three-cluster solution produced consistently moderate cluster separation (Cluster means = .233 – .349) and offered the most parsimonious and interpretable structure, so we selected k= 3 for subsequent analyses and pattern diagnosis. The clustering visualization for k= 3 is shown in Figure 2.
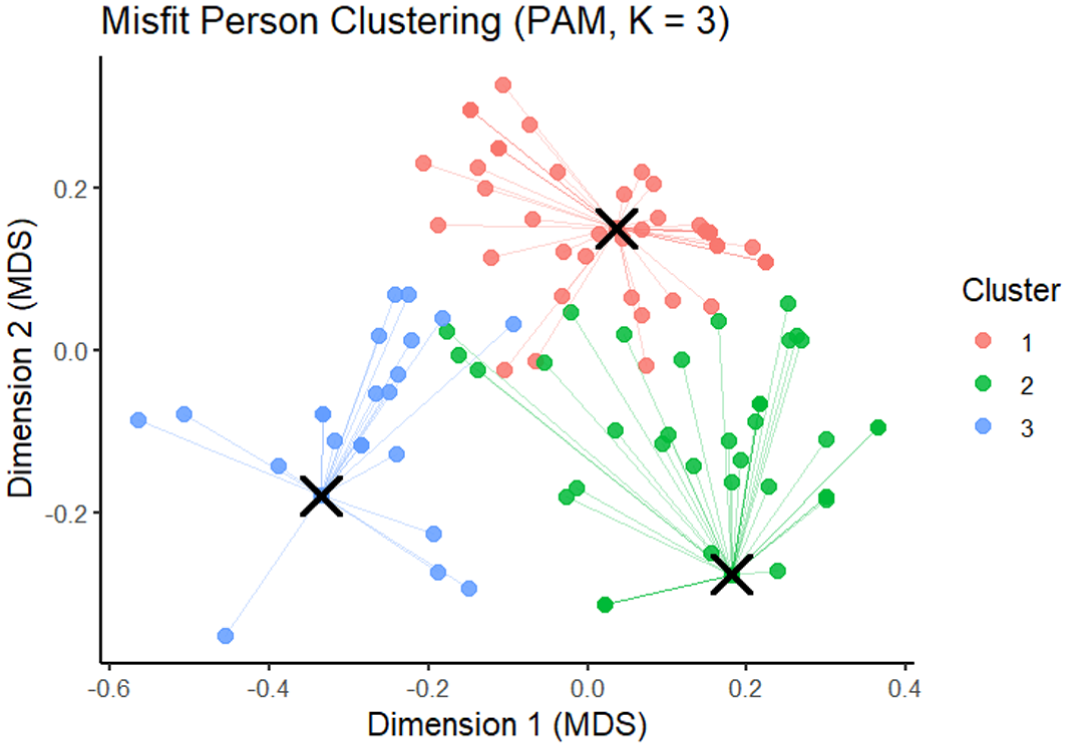
Misfit person clustering using PAM (k = 3).
We further evaluated the clustering quality for the three-cluster solution. Cluster 1 contained 48 cases, with 2% showing negative silhouette values (indicating they are closer to another cluster than to their assigned cluster) and 69% showing silhouette values greater than .25, which we used as a rule-of-thumb threshold for reasonable separation.
Cluster 2 showed the weakest separation among the three clusters, with 42 examples (mean silhouette = .23), and 17% of cases exhibited negative silhouette values, indicating that a notable subset of respondents may be closer to another cluster than to their assigned cluster. Nevertheless, 57% of cases in Cluster 2 had silhouette values greater than .25, suggesting moderate structure but overall greater overlap relative to the other clusters.
Cluster 3 demonstrated comparatively strong clustering quality, with 24 samples (mean silhouette = .35), and only 4% of cases showed negative silhouette values. In addition, 63% of cases exceeded the .25 threshold, indicating that Cluster 3 is reasonably well separated and more internally coherent than Cluster 2.
After identifying an appropriate number of clusters, we visualized the representative case (medoid) for each cluster using Hanning-smoothed PRFs to aid interpretation, and the results are shown in Figure 3. In the visualization, the x-axis represents item location (higher values indicate harder items) and the y-axis represents the probability of endorsing an item.
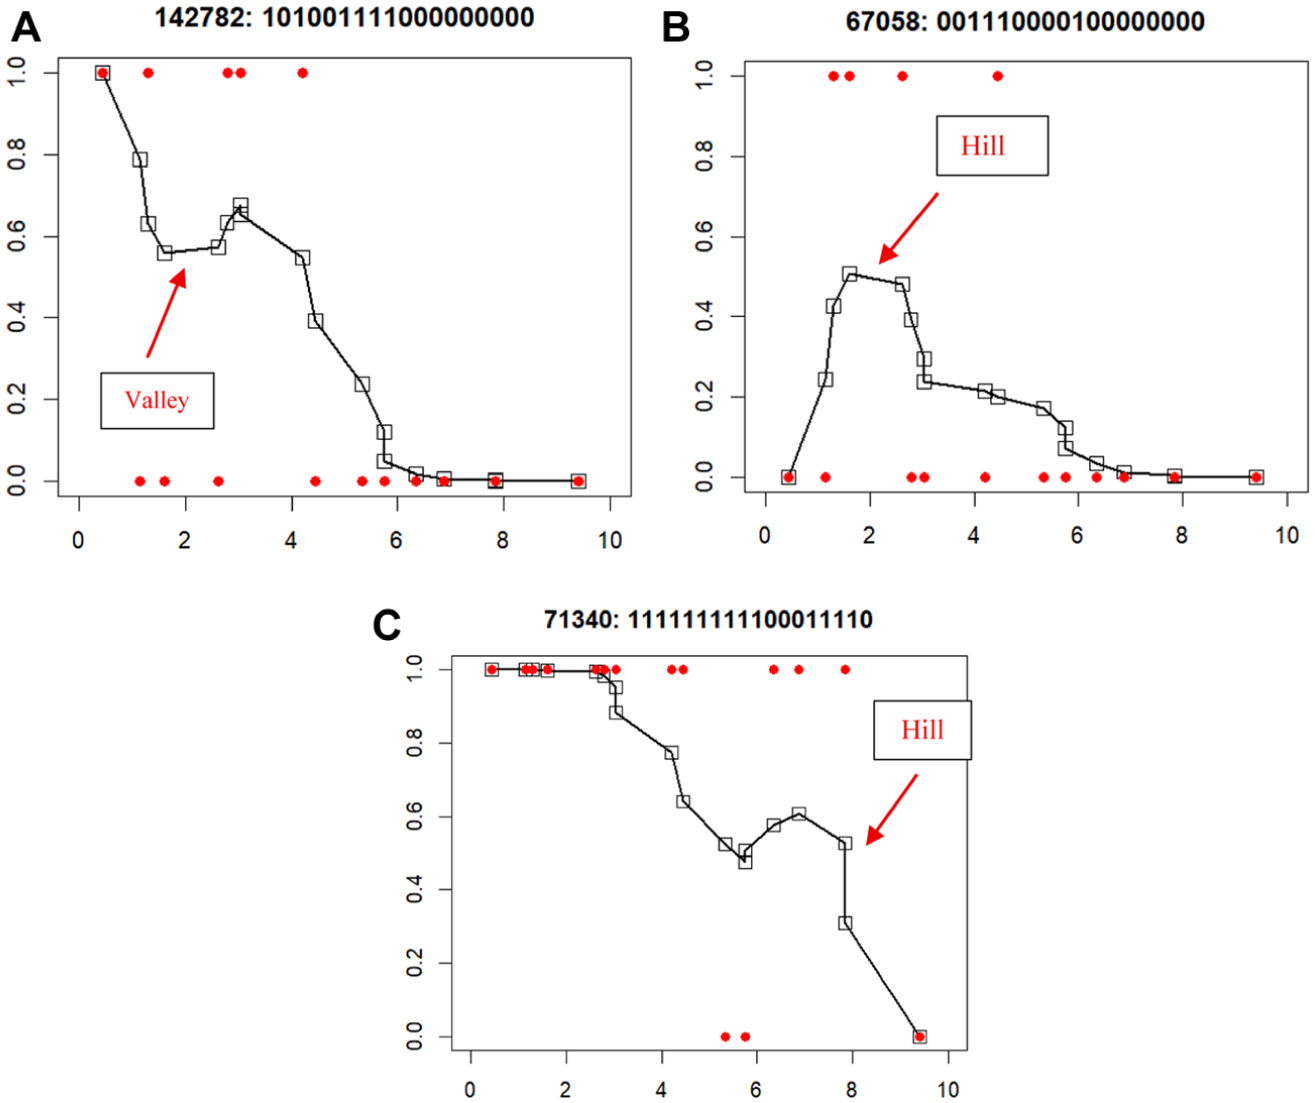
Nonparametric PRFs of medoids. Panel (A) Cluster 1: underreporting. Panel (B) Cluster 2: inconsistent reporting. Panel (C) Cluster 3: overreporting.
In detail, the medoid in Panel A (Cluster 1; underreporting) shows a pronounced valley among items that are typically more frequently endorsed, indicating unexpectedly low endorsement on relatively common food insecurity items, followed by a rapid decline for items that are less frequently endorsed. In Panel B (Cluster 2; inconsistent reporting), the medoid exhibits an irregular, nonmonotonic trajectory with a localized peak around the middle of the endorsement continuum and fluctuations across adjacent items. This pattern reflects unstable responding concentrated in the middle of the continuum, rather than a systematic increase or decrease in endorsement.
In Panel C (Cluster 3; overreporting), the medoid maintains relatively high endorsement across items and shows a right-shifted elevation extending into the region of less frequently endorsed items, with a noticeable hill at the more severe end of the continuum. This pattern indicates unexpectedly high endorsement of items that are typically less frequently endorsed, consistent with overreporting. The distinction between Panel B and C is based not only on the presence of a local elevation, but also on where the elevation occurs along the endorsement continuum and whether it appears localized or more sustained. The Hanning-smoothed medoid response functions revealed three interpretable misfit patterns: underreporting, inconsistent reporting, and overreporting, and these three clusters represent distinct forms of misreporting behavior among respondents. It is important to note that more detailed qualitative analyses of individual response patterns can be conducted after the general misfit groupings are identified if desired.
Discussion
This study highlights the value of combining person-fit statistics, nonparametric Hanning-smoothed person response functions, and PAM clustering to identify, classify, and interpret distinct misreporting patterns in survey data. Using the HFSSM as a case demonstration, Rasch measurement theory provided an interpretable latent continuum and model-based expectations that support person-fit screening, while PAM (k-medoids) and Hanning-smoothed PRFs enabled pattern-based diagnosis of misfit at both the individual and group levels. Together, this staged workflow offers researchers a clear and practical process for detecting misfitting responses, classifying patterns of misreporting, diagnosing underlying misreporting behaviors, and informing how these responses can be addressed in subsequent analyses.
Results first indicate that the HFSSM demonstrated adequate psychometric quality under the Rasch model, supporting the use of calibrated item difficulties for meaningful ordering in PRF diagnostics. The good fit of the Rasch model to the HFSSM responses is consistent with the measurement history of this instrument: since its establishment in 1995, it has been calibrated using Rasch measurement theory and examined by multiple research groups over many years (Engelhard et al., 2018; Hamilton et al., 1997; J. Li et al., 2024; Marques et al., 2015; Nord, 2012; Rabbitt et al., 2023).
Person-fit statistics then flagged only a small subset of response patterns (4.4%) with significant misfits on either infit or outfit MSE statistics (Categories C or D), suggesting that misreporting is present but not pervasive in this dataset. At the same time, prior research has shown that misreporting in surveys involving government programs and benefit receipt can be common and sometimes widespread (Celhay et al., 2021; Meyer et al., 2009; Mittag, 2019). Further, we found item-level outfit signals implied that unexpected responses may occur infrequently for certain items, motivating person-level investigation rather than relying solely on the global fit summary.
Clustering the flagged response vectors revealed a parsimonious three-cluster solution that balanced interpretability with acceptable separation. Although the five-cluster solution achieved a slightly higher overall mean silhouette, it included a poorly separated cluster, indicating potential over-partitioning. In contrast, the three-cluster solution showed a consistently moderate cluster structure and yielded behaviorally meaningful response patterns. Cluster-level silhouette summaries suggested that Cluster 2 had greater overlap, potentially reflecting more heterogeneous or borderline response behaviors. Clusters 1 and 3 were more internally coherent.
Overall, clustering flagged response vectors with PAM/k-medoids reduces the burden of individualized diagnosis by summarizing many misfitting cases into a few interpretable patterns, while preserving a real, observed representative respondent (the medoid) in each cluster for transparent follow-up and interpretation.
Further visualization of the representative cases of three clusters using Hanning-smoothed PRFs provided diagnostic details. The nonparametric curves revealed localized “valleys” and “hills” corresponding to underreporting, inconsistent reporting, and overreporting patterns, respectively.
Cluster 1 (underreporting) reflected selective non-endorsement of items that would typically be endorsed given the respondents’ overall level; cluster 2 (inconsistent reporting) reflected more mixed or borderline responding, with responses that don’t follow the expected item-location ordering very closely; while cluster 3 (overreporting) has responses endorsed across many items and are even more likely to endorse on harder items, suggesting over-endorsement of relatively severe or rare experiences.
The proposed framework offers practical value for core psychometric goals in applied measurement, including reliability, validity, and fairness, in both survey research and educational assessments. Although we demonstrate the workflow using a survey-based case example, the same screening, clustering, and Hanning-smoothed PRF diagnostic steps can be readily applied to education settings (e.g., classroom tests and large-scale assessments) to identify and interpret irregular response behaviors.
During pilot or field testing, person-fit flags and PRF diagnostics can point to items or testing conditions that repeatedly create localized anomalies, helping guide revisions to wording, response options, or instructions. In operational use, pairing a reproducible screening rule with diagnostic evidence supports transparent data-quality checks and promotes sensitivity analyses and documentation, rather than automatic case deletion. Over time, recurring PRF “signatures” can flag items for review or replacement, and subgroup comparisons of misfit and PRF patterns can support fairness checks by highlighting possible construct-irrelevant barriers.
Several limitations should be noted. First, the empirical illustration relies on dichotomous HFSSM responses, which supports a clear demonstration of Rasch-based person-fit screening and PRF diagnostics, but it may not generalize directly to polytomous survey ratings. Future work could extend the same workflow to polytomous IRT/Rasch-family models and corresponding PRF diagnostics when needed. Second, our clustering results suggested that Cluster 2 showed relatively greater overlap and weaker separation than the other two clusters, indicating that some flagged respondents may exhibit more heterogeneous or borderline patterns that are difficult to partition cleanly.
Additional research could also evaluate alternative distance-based clustering options (e.g., different dissimilarity metrics for binary vectors, hierarchical clustering, or model-based approaches) to improve separation and stability. In addition, PAM may be less efficient for very large datasets, although this concern was reduced in the present study because clustering was applied only to the 114 flagged response patterns rather than the full sample. Third, the case demonstration is situated in survey research. Still, the staged screening–clustering–nonparametric PRF visualization framework is designed to be broadly applicable. Researchers aiming to use it in educational testing contexts (e.g., classroom or large-scale assessments) should validate its performance in those settings, including the suitability of the item ordering, fit thresholds, and cluster interpretability under test-specific conditions.
In conclusion, this study contributes to the existing literature on misreporting detection in survey research in four ways: (1) it proposes an integrated, staged framework that combines Rasch-based model expectations with pattern-based visualization to move from initial screening to interpretable diagnosis; (2) using the HFSSM as a case demonstration, it shows how person-fit statistics can efficiently flag a small subset of potentially misfitting response patterns for targeted follow-up rather than relying on exhaustive inspection; (3) it introduces a PAM/k-medoids clustering approach to organize flagged response vectors into a parsimonious set of behaviorally meaningful misreporting types, thereby reducing the demanding work of individualized, case-by-case diagnosis; and (4) it highlights the diagnostic value of nonparametric Hanning-smoothed PRFs, which can reveal localized “valleys” and “hills” that are often masked by parametric PRFs constrained to a smooth monotonic form, making distinct misfitting response patterns more visually interpretable.
Footnotes
Ethical Considerations
Ethics approval was not required for this study because it involved secondary data analysis.
Consent to Participate
Not applicable.
Author Contributions
Jing Li: Conceptualization, methodology, formal analysis, and writing of the original draft and revision.
Xiao Yang: Methodology, review, and editing.
George Engelhard, Jr.: Methodology, workflow guidance, review, and editing.
Funding
The authors received no financial support for the research, authorship, and/or publication of this article.
Declaration of Conflicting Interests
The authors declared no potential conflicts of interest with respect to the research, authorship, and/or publication of this article.
Data Availability Statement
The data that support the findings of this study are available from the corresponding author upon reasonable request.
Code Availability
The code used in this study is available from the corresponding author upon reasonable request.