
Abstract
The authors estimate the relationship between trees and three crime aggregates (all crime, violent crime, and property crime) and two individual crimes (burglary and vandalism) in Portland, Oregon. During the study period (2005-2007), 431 crimes were reported at the 2,813 single-family homes in our sample. In general, the authors find that trees in the public right of way are associated with lower crime rates. The relationship between crime and trees on a house’s lot is mixed. Smaller, view-obstructing trees are associated with increased crime, whereas larger trees are associated with reduced crime. The authors speculate that trees may reduce crime by signaling to potential criminals that a house is better cared for and, therefore, subject to more effective authority than a comparable house with fewer trees.
Introduction
Research has shown that urban trees provide a range of benefits to communities, including moderating storm-water runoff (McPherson, Simpson, Peper, Maco, & Xiao, 2005), reducing heating and cooling costs (Akbari, Kurn, Bretz, & Hanford, 1997; Donovan & Butry, 2009), and increasing property values (Anderson & Cordell, 1988). However, less attention has been focused on the potential of urban trees to affect another important determinant of urban quality of life: crime occurrence. Results from studies that have looked at the effect of trees and other vegetation on crime have been mixed; some have shown that vegetation can increase fear of crime (Nasar & Fisher, 1993; Nasar, Fisher, & Grannis, 1993), whereas others have shown that it can reduce the fear of crime (Kuo, Bacaicoa, & Sullivan, 1998) or crime occurrence (Kuo & Sullivan, 2001).
We believe there are two related reasons for the apparent contradictions in the literature.
First, vegetation can vary widely in the degree of cover it provides to a potential criminal and the amount of surveillance cover it provides to a potential victim: for example, a bush that obscures the view of a house’s front door may have a different effect than a non–view-obstructing tree. Statistical methods that exploit a more detailed characterization of trees and other vegetation could help untangle these competing influences. Second, vegetation may be correlated with other variables that can confound some of the simple statistical models reported in the literature. For example, income, occupancy patterns, construction features, and features that harden structures (e.g., window bars) or facilitate surveillance (e.g., street lights) could explain some of the observed effects. More complete specification of the hypothesized drivers of crime, based on crime theory, could alleviate these kinds of confounding influences. The goal of this study, therefore, is to evaluate the effects of different types of vegetation on crime in Portland, Oregon, while accounting for other relevant variables.
A considerable number of studies have examined the relationship between vegetation and crime. We review a sample of these studies to help place our work in context. In studies examining the link between vegetation and the fear of crime, attention has been focused on how trees and other vegetation are perceived as providing cover for criminals and barriers to victim escape. Shaffer and Anderson (1985) showed subjects 180 pictures of parking lots. Study participants ranked those with the most vegetation as the least safe. Nasar and Fisher (1993) found similar results on university campuses. Other research suggests that the influence of vegetation on fear of crime depends on the type of vegetation. Specifically, Kuo et al. (1998) found that view-obstructing vegetation, such as bushes and shrubs, induces more fear than non–view-obstructing vegetation such as mature trees. The above studies involved vegetation in public spaces. However, studies on trees in residential settings found that they can reduce fear of crime (Brower, Dockett, & Taylor, 1983; Nasar, 1982).
Although research has identified some linkages between fear of crime and vegetation, only one published study (that we could find) has examined the relationship between vegetation and crime occurrence. Kuo and Sullivan (2001) studied the effect of vegetation on crime in 98 apartment buildings in Chicago’s Ida B. Wells public housing development. They found that, after controlling for number of apartments per building and building height, vegetation was associated with lower violent crime and lower property crime. Vegetation level was measured on a 5-point scale and was based on aerial and ground-level photographs. Any study on urban trees faces the problem of confounded statistical relationships due to omitted variables. More desirable neighborhoods may also have more trees, for example. Not controlling for factors besides trees that are linked to both desirability and crime could render modeled relationships statistically biased or inconsistent. Although Kuo and Sullivan control for number of apartments per building and building height, they mainly use the unique attributes of the housing development to address the issue of omitted variables. Specifically, residents are randomly assigned to apartment buildings, so there should be no systematic demographic differences between building residents, although this assignment does not ensure that there is no systematic difference between buildings within the development, such as different security measures.
The results of Kuo and Sullivan (2001) have significant policy implications, seeming to boost support for tree planting and retention in urban settings. However, like any ground-breaking study, it is important to validate initial results and to see whether they generalize beyond the unique circumstances of the study. In particular, do trees affect crime in the same way in neighborhoods with different economic circumstances and ethnic makeup (93% of the residents of the Ida B. Wells housing development were unemployed and 97% were African American)?
We extend and deepen the results of the earlier literature relating crime to vegetation by (a) studying crime occurrence in single-family homes, (b) using a multivariate description of vegetation, (c) controlling for property features besides vegetation that have been shown to affect crime, and (d) assessing the relationship between vegetation and various measures of crime and not just indices of aggregate violent and property crime.
Theoretical Model
The choice of variables for our empirical analysis was guided by routine activity (RA) theory (Cohen & Felson, 1979), a widely accepted model of crime motivation, drawing heavily on the early work of Becker (1968). RA theory states that three conditions must be met before a crime can occur. First, there must be a potential criminal. Second, there must be a potential victim. Third, there must be a lack of effective authority that can both observe and respond to a crime. These three conditions are necessary but not sufficient conditions for crime occurrence. A criminal also weighs the expected costs and benefits of a crime before deciding whether to act.
Numerous studies have used RA theory as a basis for empirically investigating the causes of crime. For example, the number of potential criminals has been indexed by the number of young males in a population (Imai, Katayama, & Krishna, 2006). Potential targets have been represented by the number of single-family homes in an area (Farrell, Clark, Ellingworth, & Pease, 2005). The presence of an effective authority has been represented by police arrest rates (Davis, 2006). The costs and benefits of crime (accruing to the criminal) have been represented by variables describing target hardening, such as burglar alarms (Clark, 1995; Cohen & Felson, 1979), and by labor-market conditions (Gould, Weinberg, & Mustard, 2002; Grogger, 1998).
In the context of RA theory, trees could affect crime in a number of ways. If trees are view obstructing, then they could reduce the probability that a criminal is observed, which would reduce the expected cost of crime to the criminal. Similarly, view-obstructing trees could reduce the effectiveness of police or other forms of surveillance. However, trees may also draw people into public spaces, increasing the probability of a criminal being observed and providing the “authority” that would increase the expected cost of crime.
The size and location of a tree determine view obstruction. Therefore, by measuring tree size, we distinguished between trees in a house’s yard and street trees in the parking strip between the sidewalk and the street. We made this distinction for two reasons. First, street trees tend to be farther from a house than yard trees. Second, street trees typically do not block the view of a house from the sidewalk.
Although our empirical analysis is largely motivated by RA theory, other crime models may provide insight into the mechanisms by which trees affect crime. For example, the broken windows theory suggests that criminals are attracted to poorly maintained neighborhoods, because evidence of neglect—broken windows, for example—provides visual cues that an area may not be subject to effective law enforcement (Wilson & Kelling, 1982). Therefore, if trees help a neighborhood appear well maintained, they may deter crime. (Although several small-scale experiments support the broken window theory [Braga & Bond, 2008; Keizer, Lindenberg, & Steg, 2008], its use to explain larger changes in crime so far remains controversial.)
Both RA theory and the broken windows theory explain crime motivation in terms of a criminal cost-benefit calculus. However, trees may also affect crime by affecting criminals’ state of mind. Kuo and Sullivan (2001) noted that research has shown that trees can reduce stress (Ulrich, 1976), and newer research supports this idea (Grahn & Stigsdotter, 2003; Hansmann, Hug, & Seeland, 2007; Park et al., 2008). Furthermore, other research suggests that stress may trigger violent criminal acts (Kaplan, 1987). Therefore, Kuo and Sullivan speculate, consistent with Ulrich, that trees may reduce crime by reducing the stress of potential criminals. This could include stress linked to violent acts perpetrated by one member of a household against another.
We add to the literature on trees and crime by testing the following two hypotheses. First, we hypothesize that trees influence crime. Second, we hypothesize that the degree of influence depends on the size and location of trees.
Method
Data and Study Area
Portland is a city in northwest Oregon near the confluence of the Willamette and Columbia Rivers with a population of 537,000 (U.S. Census Bureau 2006 Population Estimate). Metropolitan Portland, which includes surrounding communities, has a population of approximately 2 million (the 23rd largest metropolitan area in the United States). The city is divided into five police precincts. 1 The study was confined to the southeast precinct, which was chosen for its high proportion of single-family homes and for the pragmatic reason that one of the authors lives within the precinct.
Crime data for 2002 to 2007 2 were obtained from the Portland Police Bureau. Crimes were divided into seven categories: (a) aggravated assault, (b) burglary, (c) larceny, (d) motor-vehicle theft, (e) robbery, (f) simple assault, and (g) vandalism (murder and forcible rape were excluded for privacy concerns, and their occurrence was probably too low to estimate separate models anyway). Report data and address were provided for each crime. However, in some cases, the address was an intersection (e.g., 1st Ave. and Main St.) or a block (100 Block of Main St.). This may be because the crime took place on the street rather than at a specific address or because of a data-entry error. Because we are concerned with the effects of parcel-level variables (house size, number of trees, and so forth) on crime, we excluded all crimes not associated with an address. Data on a house’s assessed value, age, size, and lot size were obtained from Multnomah County Assessor’s Office.
Other variables were collected by visiting each house in the sample 3 (Table 1). Our choice of variables was driven by the literature (see “Theoretical Model” section) and consultations with local crime-prevention officers.
Variable Definitions and Descriptive Statistics

Tree-crown variables (SIZE_TREES_ON_LOT, SIZE_TREES_ON_STREET, and SIZE_TREES_ON_BLOCK in Table 1) were measured from aerial photographs, because measuring the crown 4 of street trees 5 on site is laborious and potentially inaccurate. In addition, we did not have access to trees on private property. We treated the crown of a tree as a circle; we calculated its area using the average of two measurements of crown diameter. We measured crown areas after the first round of site visits. This helped us differentiate between trees and other vegetation on aerial photographs, as we had already recorded the number of street trees and most yard trees.
In many cases, a tree’s crown crossed property lines. However, we did not attribute fractions of a tree’s crown to multiple houses. Rather, we attributed a tree’s entire crown to the property in which the tree’s stem fell. We determined which property a tree fell on by overlaying aerial photographs with a cadastral layer. However, in some cases, determining where a tree’s stem fell from aerial photographs was still difficult. We resolved these and other ambiguities by visiting these sites a second time.
Crime can have a spatial component related to long-run criminal activity of multiple types by many people or to short-run serial criminal activities of a particular type exercised by specific individuals or groups (Beauregard, Proulx, & Rossmo, 2005; Boggs, 1965; Godwin & Canter, 1997). We accounted for both types of spatial patterns using two types of variables. First, we used Geographic Information System (GIS) to determine how many crimes were committed in 50-m (Euclidean distance), 100-m, and 200-m buffers around each house in the sample during the 3 years immediately preceding (2002 through 2004) the study period (2005 through 2007). These buffers were designed to capture factors that influence crime occurrence at a relatively small scale: criminals living close by, for example. (We did not use crime occurrence data from the study period [2005 through 2007] to calculate the buffer variables, because they would then include the crime we were trying to predict plus crimes that had yet to occur.) We also used neighborhood dummy variables to explain spatial patterns of crime occurrence. These variables were included to capture factors that could affect crime occurrence at a larger scale than the buffer variables (e.g., neighborhood demographics).
The types of structures surrounding a house may affect crime occurrence. A neighborhood of single-family homes may present different crime risks than a neighborhood with multiple-family homes, for example. Therefore, using data from Multnomah County Assessor’s Office, we categorized every building in the southeast precinct as single-family, multiple-family, commercial, or industrial. We then calculated the number, and proportion, of different building types in 50-, 100-, and 200-m buffers around each house. These buffer variables were used in a first-stage regression to control for the endogeneity of BURGLAR_ALARM, NBHD_WATCH_STICKER, and WINDOW_BARS, and, therefore, the buffer variables do not appear in the final model.
Fences, walls, and bushes that delineate the boundary of a property may be real or psychological barriers to entry. However, they may also provide cover for criminals. Therefore, we used three categories to describe barriers in the front and back of a house. First, if a barrier was less than 3-feet tall, we categorized it as low, because a criminal could easily step over it (e.g., a low rock wall). Second, if a barrier was solid and taller than 3 feet, we categorized it as high (e.g., a wooden fence with continuous wooden slats). Third, if a barrier was taller than 3 feet and not completely view obstructing, we categorized it as partial (e.g., a wrought iron fence).
Additional variables (Table 1) described property hardening (BURGLAR_ALARM and WINDOW_BARS), surveillance (NBHD_WATCH_STICKER), visibility of a house (PORCH, #_PORCHES_ON_BLOCK, HOUSE_HIDDEN, FRONT_DOOR_VISIBLE, #_VISIBLE_SIDES, and STREET_LIGHT), attributes of a house (HOUSE_AGE, LOT_SIZE, HOUSE_SIZE, HOUSE_VALUE, GARAGE, DRIVEWAY, GOOD, AVERAGE, POOR, CORNER, DOG, and STEPS), number of trees (#_TREES_FRONT, #_TREES_ HOUSE, and #_TREES_BLOCK), and neighborhood characteristics (DIST_TO_BUSY_STREET, CONV_STORE, and BAR).
Empirical Model
The dependent variable in all models was the number of crimes of a specified type that occurred at an address between January 1, 2005, and December 31, 2007. In the case of individual crime, models were specified as a binary process: in no cases were multiple crimes of the same type reported at the same address within the study period. Therefore, we estimated Probit models for the two most commonly occurring crimes: burglary and vandalism. For aggregates of crime, we estimated three Poisson models 6 : (a) the sum of all crimes reported on the property, (b) the sum of four property crimes reported for the property (burglary, motor vehicle theft, larceny, and vandalism), and (c) the sum of three violent crimes reported for the property (robbery, simple assault, and aggravated assault). For a more detailed discussion of the mechanics of estimating binary choice and count models, see Greene (2000) and Hilbe (2007).
The nature of our data meant we had to consider two statistical issues. First, because crime is a spatial process, the error terms of estimated models can exhibit spatial correlation, which can result in biased, inconsistent, or at least inefficient parameter estimates. However, a preliminary assessment of model residuals using semivariogram analysis found no evidence of spatial autocorrelation in any models. 7
A second factor is endogeneity of potential regressors. In particular, although BURGLAR_ALARM, NBHD_WATCH_STICKER, and WINDOW_BARS may influence crime occurrence, these variables may also be influenced by crime, especially considering the temporal sampling window for our crime data (3 years), in which the implementation of a hardening measure may postdate the crime being modeled. To address this potential endogeneity, we used a control-function approach, an instrumental variables method that is suitable for use in nonlinear estimation. The control function method involves two stages of estimation. First, potentially endogenous variables (BURGLAR_ALARM, NBHD_WATCH_STICKER, and WINDOW_BARS in our case) are each (separately) regressed against all independent variables plus instruments, which are chosen because they explain variation in the potentially endogenous variables but are not directly related to the dependent variable in the second stage of the regression (crime occurrence in our case). Residuals from the first stage are then included as additional regressors in the second-stage estimate of the binary or Poisson model of crime occurrence. Our instruments included counts of the type of structures at varying distances around a house and the value of the house.
Results
Our sample consisted of 2,813 single-family homes. We limited our analysis to single-family homes because the relationship between trees and crime may be fundamentally different for multiple-family homes. The average house was 77 years old, 1,311 sq. ft., and located on a 5,161 sq. ft. lot. Between January 1, 2005, and December 31, 2007, 431 (394 property and 37 violent) reported crimes occurred in the sample. For the houses in the sample, 39% had at least one tree on their lot, and the mean canopy cover for these houses was 802 sq. ft. Most houses were fronted by at least one street tree (78%). Those with a street tree had an average 530 sq. ft. of canopy cover.
Table 2 contains regression results for the all-crime Poisson model. The covariance matrix was estimated using a White-Huber heteroscedasticity correction. Results show that crimes in 2002 to 2004 within 100 m are associated with a reduction in total crime, and those within 50 m had the greatest effect. This suggests that past crime occurrence may encourage residents to take crime-prevention measures (changes in behavior of the residents, additional surveillance activities, or other kinds of hardening) not observable by the analyst and, therefore, not fully captured by other variables in our models. The presence of a street light, proximity to a convenience store, and being in neighborhood 116 were also associated with decreased total crime. A street light may increase the chance that a criminal is observed, and houses close to a convenience store may have more passing foot traffic, which would also increase the probability of being observed (i.e., greater presence of an authority, in RA theory terminology). In contrast, older houses, houses on a corner, houses in better condition, and houses in neighborhood 112 were more likely to experience crime. The effect of HOUSE_AGE may be due to a number of factors. Older homes may have poorer security measures, or HOUSE_AGE may be a proxy for features that criminals find desirable. Perhaps, older homes tend to have more valuable contents, for example, and, therefore, are considered more lucrative targets. The positive effect of being on a corner may be because houses at the intersection of two streets have more passing traffic than houses in the middle of a block. The positive effect may be the net of a greater likelihood that a criminal is observed (negative effect) and the greater likelihood that the house is seen by multiple criminals and, therefore, targeted (a more than counterbalancing positive effect). Finally, houses in better condition may be perceived by criminals as richer targets.
All Crime Regression Model (Poisson Count Model)
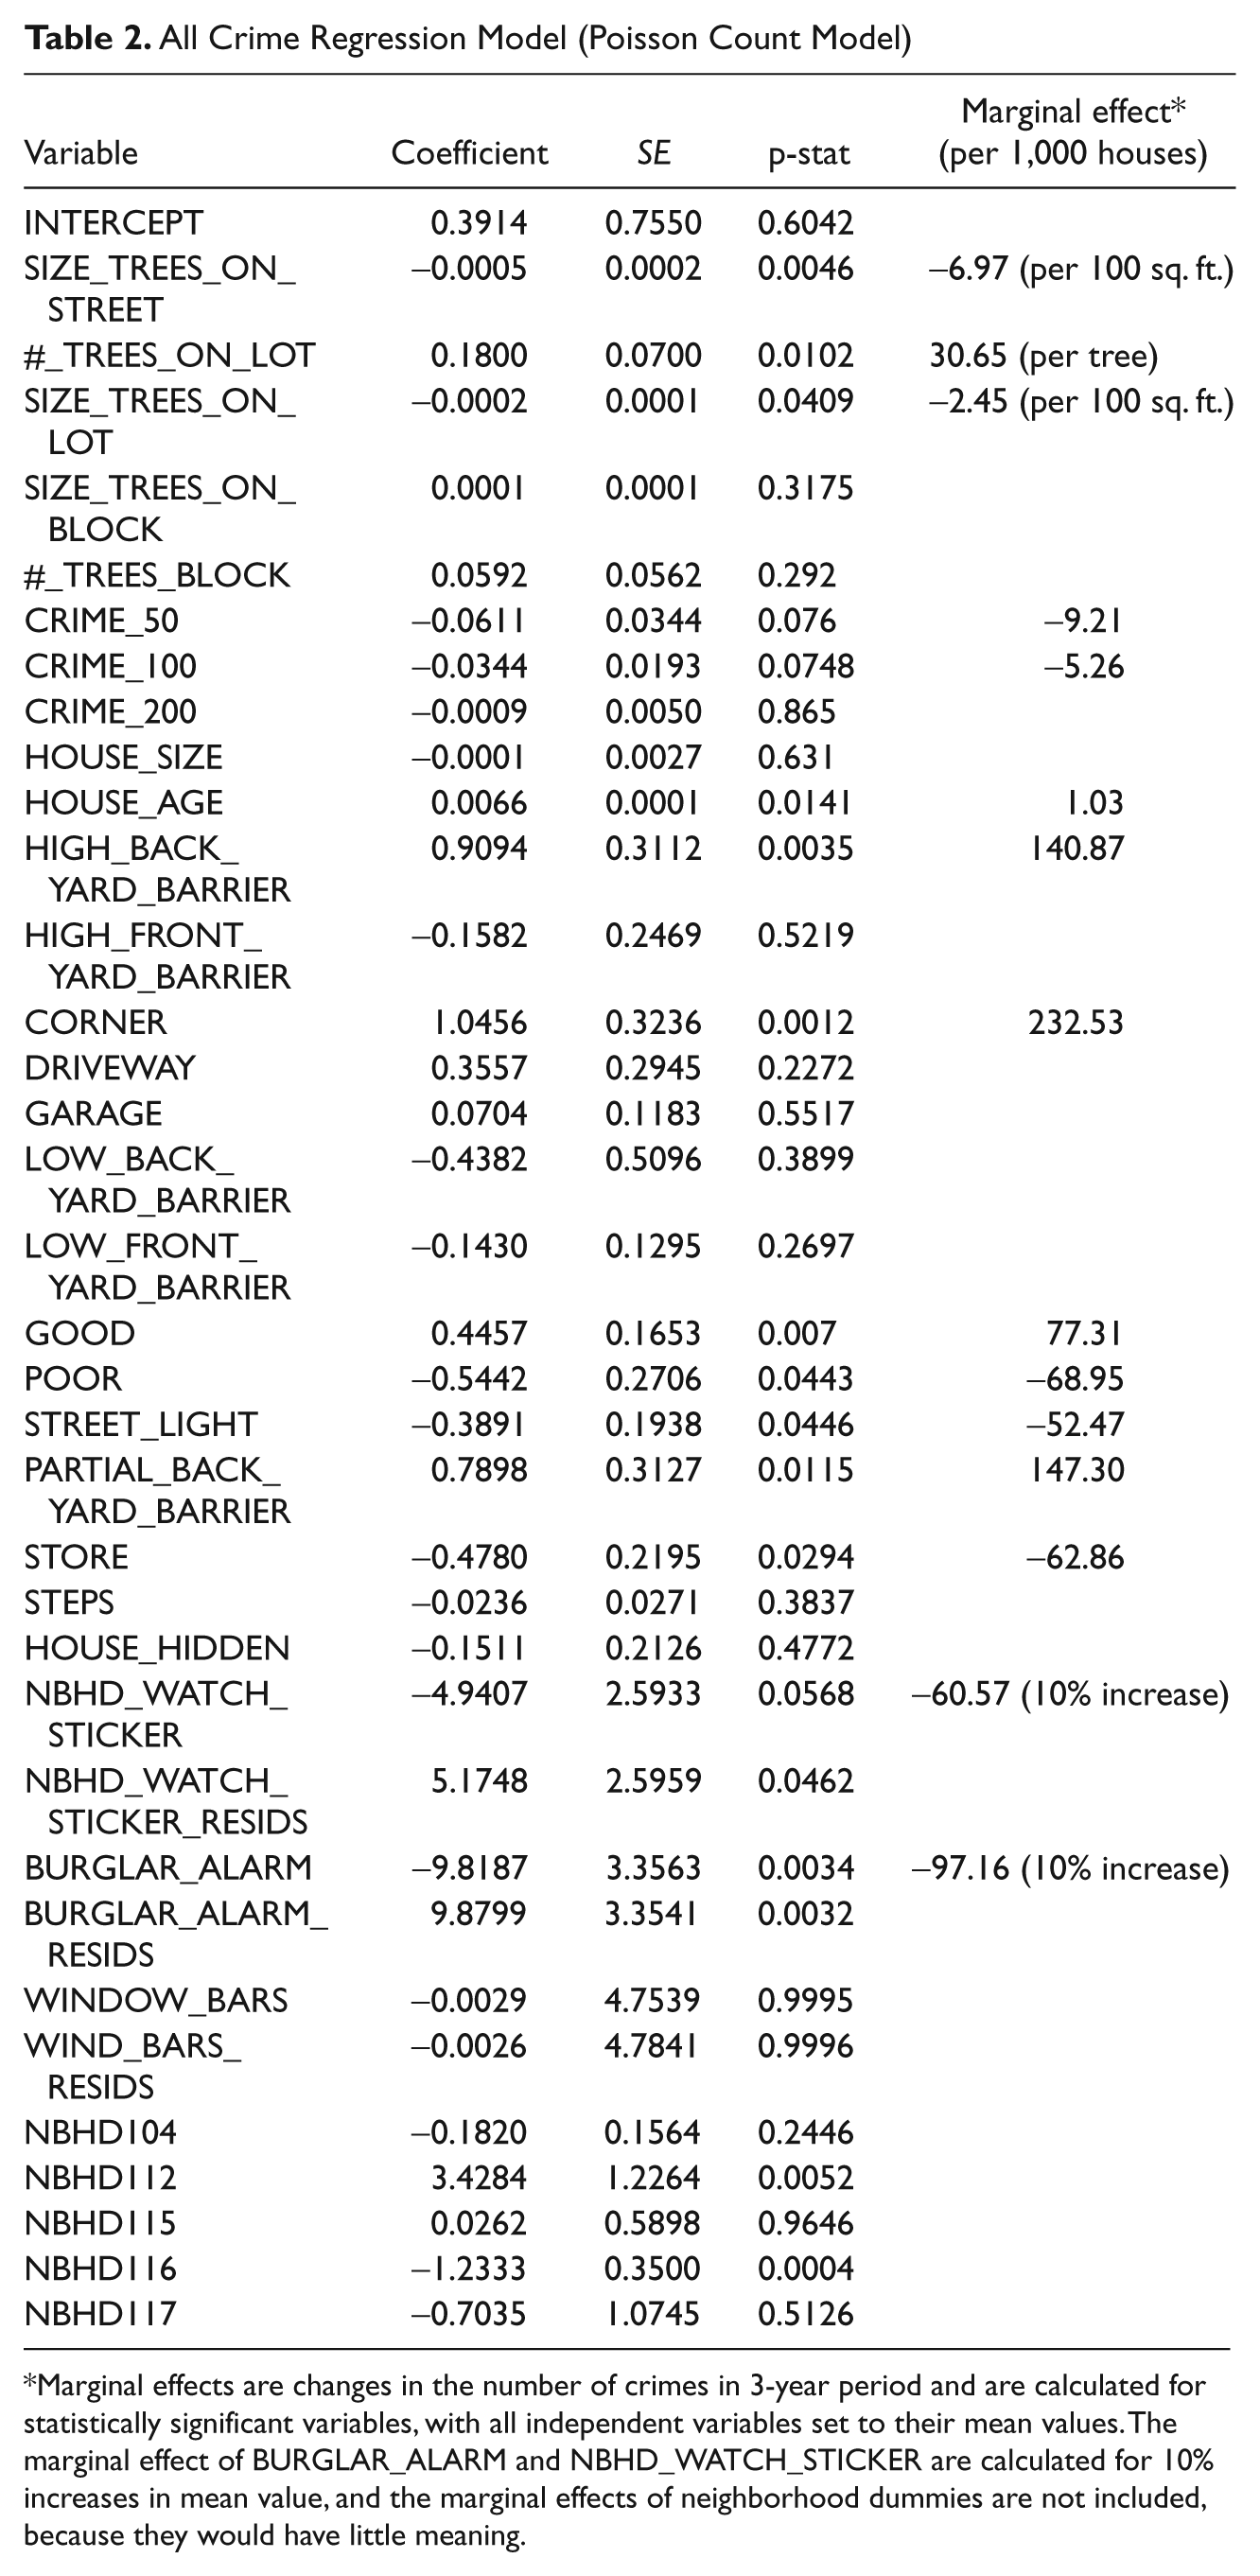
Marginal effects are changes in the number of crimes in 3-year period and are calculated for statistically significant variables, with all independent variables set to their mean values. The marginal effect of BURGLAR_ALARM and NBHD_WATCH_STICKER are calculated for 10% increases in mean value, and the marginal effects of neighborhood dummies are not included, because they would have little meaning.
Barriers, taller than 3 feet, in the back of a house were associated with increased crime occurrence, although the latter effect was somewhat smaller if the barrier was not view obstructing. The positive effect of barriers in the back of a house may be because these barriers provide cover to criminals, which also explains why non–view-obstructing 8 barriers have a lesser effect on crime occurrence.
Of the three potentially endogenous variables included in our models (NBHD_WATCH_STICKER, BURGLAR_ALARM, and WIND), both the presence of a neighborhood watch sticker and the presence of an alarm were significant. In both cases, coefficients on these variables were negative and statistically different from zero, supporting some of the work reviewed by Rosenbaum (1986) and reported by van der Voordt (1987), which examined the success of neighborhood crime watch groups. Likewise, the residuals from the first-stage control function equations for these two measures are statistically significant and positively related to crime incidence, evidence that they captured existing endogeneity of the modeled variable. 9 Care should be taken interpreting these results, however. In particular, the negative coefficient on NBHD_WATCH_STICKER does not necessarily mean that neighborhood watch programs decrease crime. The negative effect found could be capturing (a) the deterrent effect of a neighborhood watch sticker or (b) other hardening or surveillance measures taken by homeowners that were not otherwise captured by variables included in our models. See Austin (1991) for further discussion of the reasons for and effects of participation in neighborhood watch programs.
Of the tree variables evaluated, the crown area of street trees fronting a house and the crown area of trees on a house’s lot were associated with decreased crime occurrence (these two variables are uncorrelated: correlation coefficient is .016), whereas the number of trees on a lot was associated with increased crime occurrence. To interpret these results, consider the mechanisms by which trees could affect crime. The most obvious is that trees could increase crime occurrence by providing cover to criminals. However, the degree of cover provided by a tree depends on its size and location. In general, larger trees are less view obstructing than smaller trees, because it is primarily the crown of a tree that obstructs views, and larger trees have higher crowns. Similarly, the farther a tree is from a house, the less view obstructing it will be for the resident of the house. Indeed, Brown and Altman (1983) found that burglary was less likely if a house could be seen from neighboring houses. The mechanisms by which trees reduce crime are less intuitive. It may be that trees encourage people to spend more time in public spaces, which increases the probability that criminals are observed. It is also possible that trees provide a signal to potential criminals: a house is more secure, for example. Given these mechanisms, it is not surprising that street trees, which are farther from a house than lot trees, decrease rather than increase crime. In combination, the coefficients on #_TREES_ON_LOT and SIZE_TREES_ON_LOT indicate that smaller trees increase crime occurrence, but larger trees decrease it. 10 The break-even point is a crown area of 1,379 sq. ft. To understand the significance of this break-even point, we must first convert crown area to tree height, which we did not measure in the study. A good rule of thumb for deciduous trees (the majority of the trees in our sample) is that tree height equals crown diameter (Simpson & McPherson, 1996). Using this rule, a crown area of 1,379 sq. ft. corresponds to a tree height of 42 feet. It is only the crown of a tree that is significantly view obstructing, so we measured the height and crown height (the height at which the tree crown starts) of 100 random trees in the sample. We found that, on average, a tree’s crown starts at 22% of its height. For a 42-feet tree, this corresponds to a height of 9.1 feet. We also measured the height of the top of first-floor windows for 100 random houses in the sample. On average, the height was 8.7 feet. This strongly suggests that the reason trees shorter than 42 feet increase crime is that they obstruct the view from first-floor windows. This finding has clear practical implications. Homeowners should prune existing trees to prevent them from obstructing views. In addition, they should select the species and locations of future trees with care.
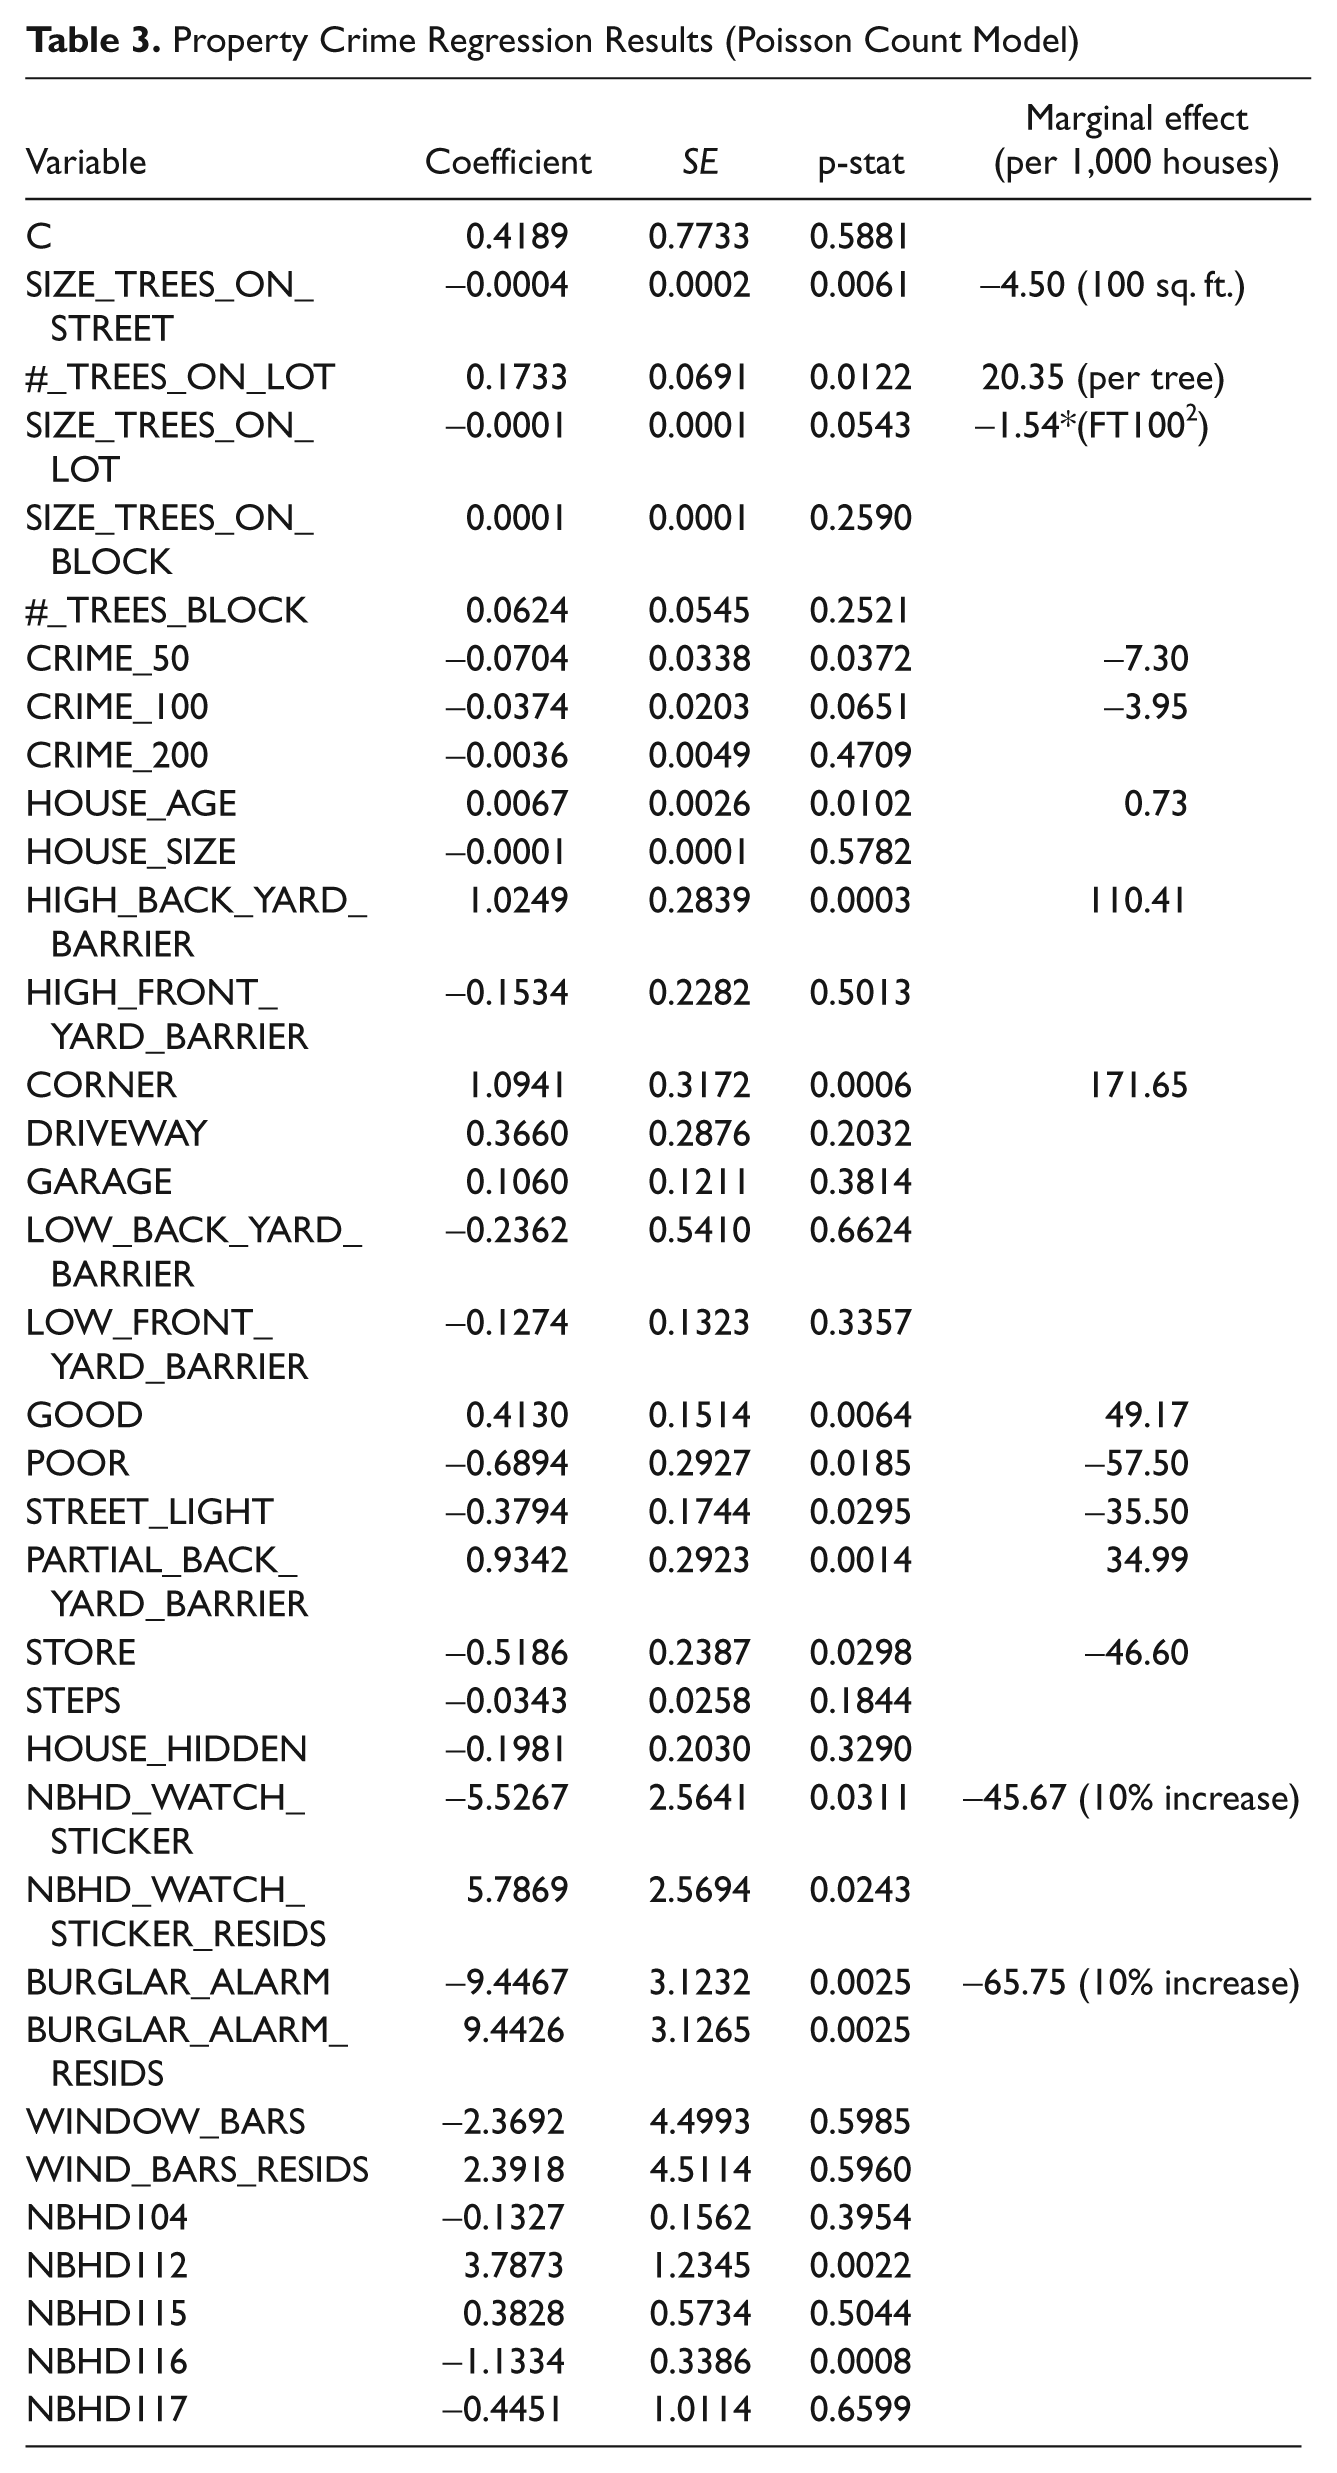
The aggregate property-crime model was estimated as a Poisson model; the signs on the coefficients, and their significance, are the same as in the all-crime model (Table 3). The violent-crime model was also estimated as a Poisson process, but, in contrast to the all-crime model, only four variables were significant: (a) the crown area of trees on a lot, (b) the number of crimes within 200 m, (c) window bars, and (d) neighborhood 115 (Table 4). 11 The effect of crown area on a lot is consistent with the all-crime model. The effect of crimes within 200 m, however, is positive, which is not consistent with the all-crime model. This may be because violent crimes are fundamentally different from property crimes. For property crimes, it is rare that a perpetrator and a victim live in the same house. Few people steal their own cars or vandalize their own homes. In contrast, victims of violent crime may often live in the same house as the perpetrators. Consider domestic abuse, for example. This difference is also reflected in the way people respond to crimes in their immediate neighborhood. If your neighbor’s house is burgled, for example, you might fit window locks or install an alarm. However, if your neighbor becomes a victim of domestic abuse, then you cannot respond in the same way.
Property Crime Regression Results (Poisson Count Model)
Violent Crime Regression Model (Poisson Count Model)
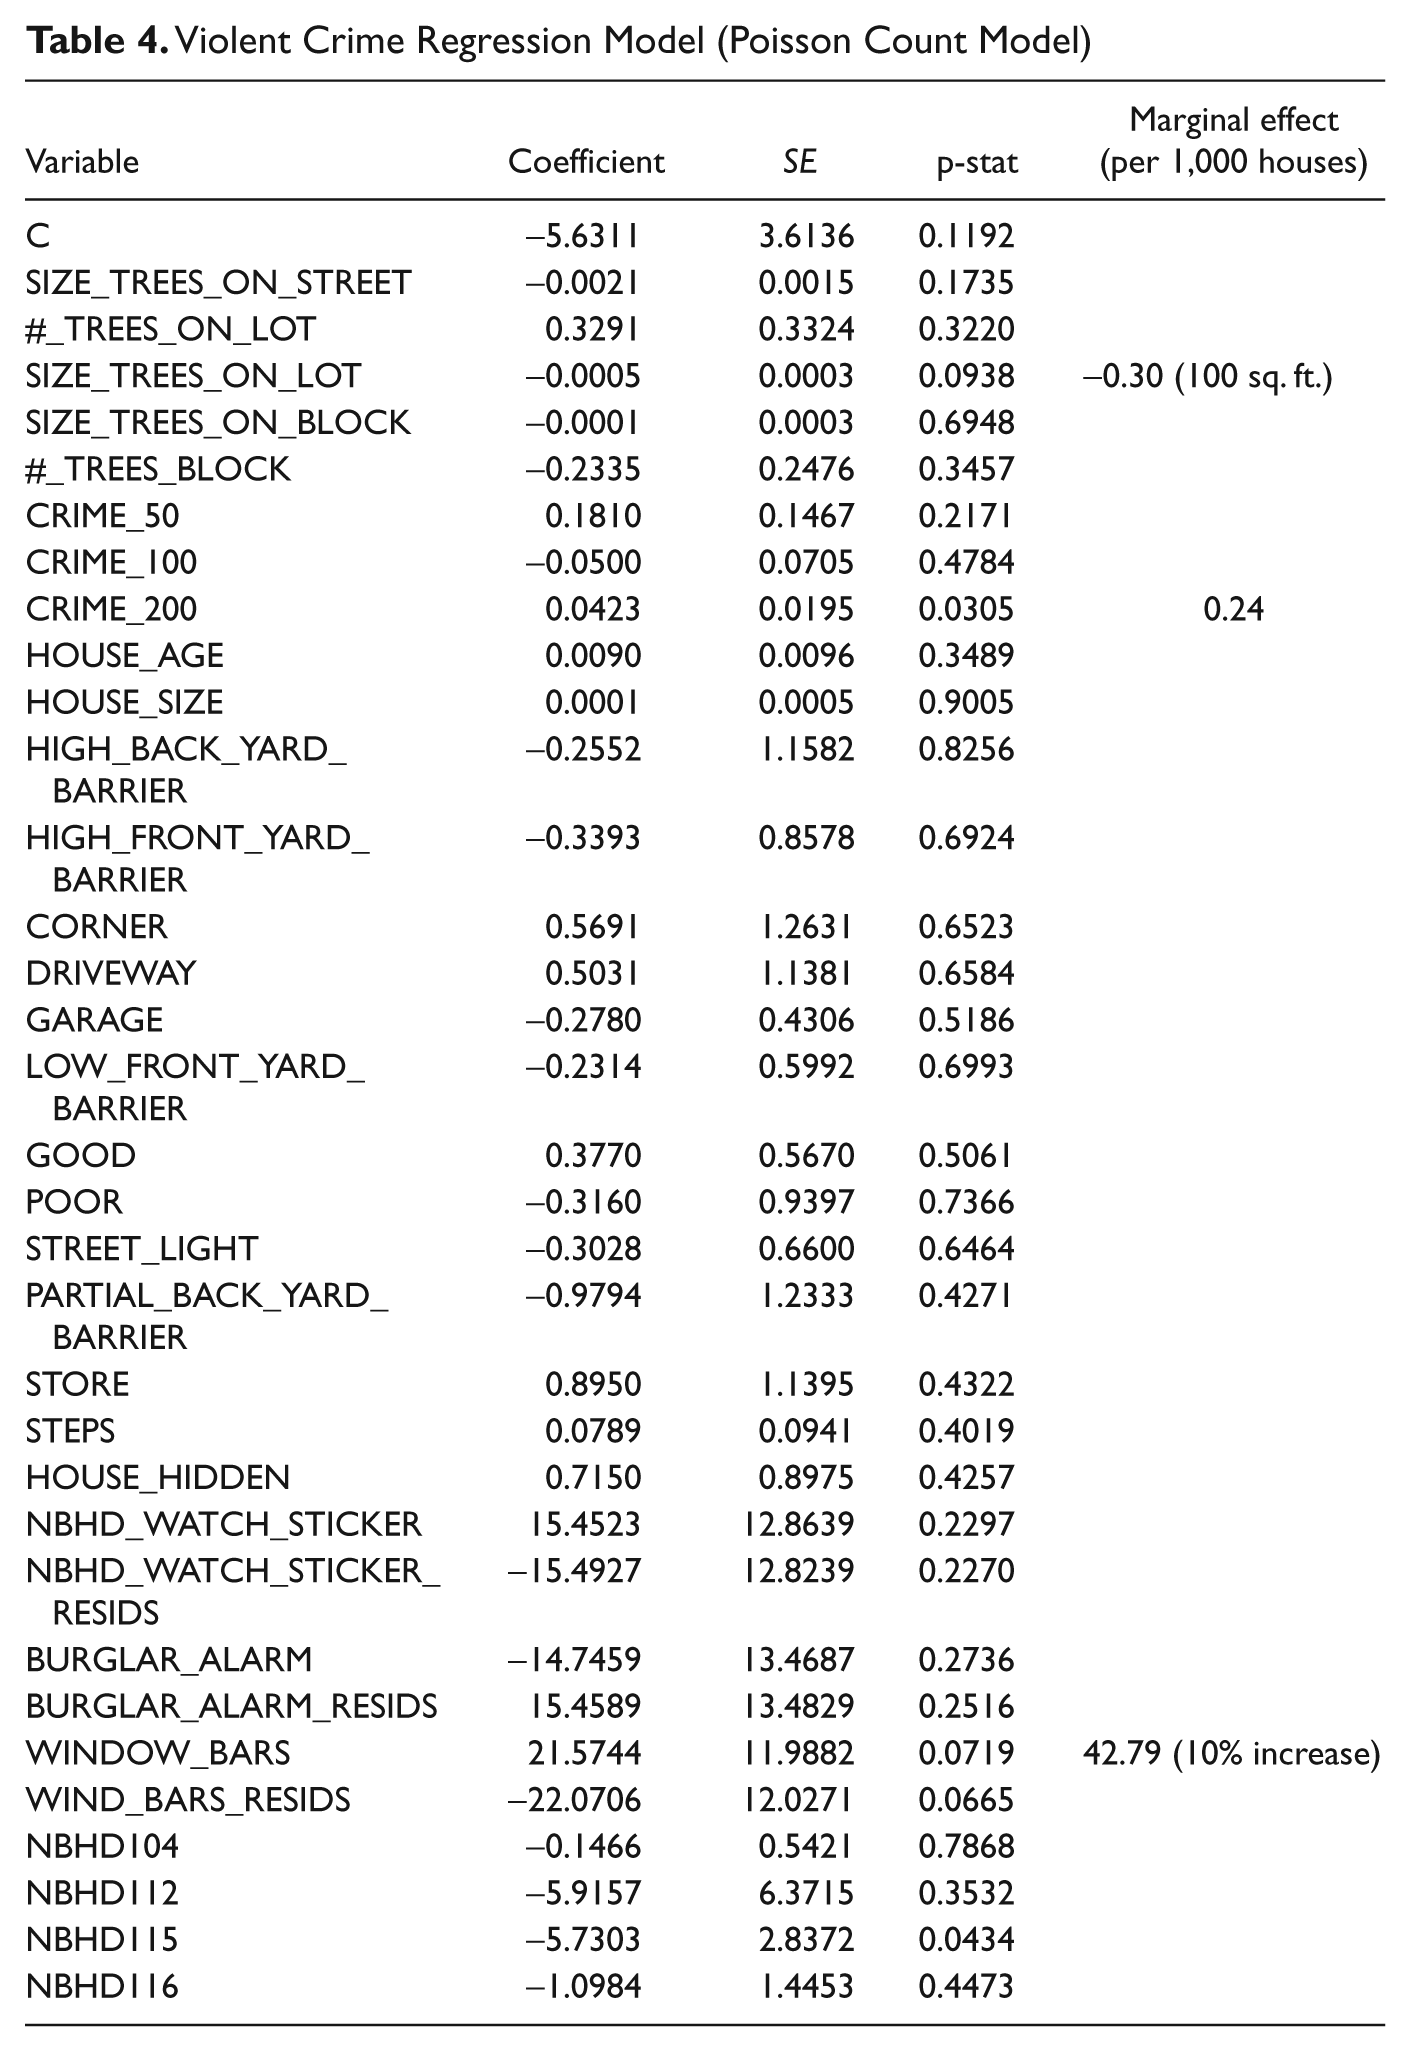
The positive effect of window bars on violent crime was unexpected, and we can offer no explanation beyond speculating that window bars are a proxy for an omitted variable or simply that the result is a statistical anomaly.
The results of the burglary Probit model are generally consistent with the all-crime model, although some variables lost their significance: crown area on the lot, crimes within 50 m, corner house, condition variables (good and poor), street light, neighborhood watch sticker, and neighborhood 112 (Table 5). This loss of significance may be because these variables do not affect burglary, or it may be because burglaries comprised only one fifth (87) of the crimes in our sample, and less information implies larger standard errors. The lack of significance on the neighborhood watch sticker is consistent with DeFrances and Titus (1993), but the finding of a crime-reducing effect of an alarm is not.
Burglary Regression Model (Binary Probit Model)

The vandalism Probit model was also consistent with the all-crime model except for the loss of significance of some variables: trees on a lot, crimes within 100 m (CRIME_50 and CRIME_100), age, barriers in the back of a house (HIGH_BACK_YARD_BARRIER and PARTIAL_BACK_YARD_BARRIER), good condition, proximity to a store, and alarm (Table 6). As with the burglary model, variables may have lost significance simply because of the limited number of nonzeroes (91) in the sample. However, there may also be specific reasons why some variables lost significance. For example, the insignificance of barriers in the back of a house may be because vandalism often does not require access to a house, so cover may be of less importance. Similarly, if access to a house is not required, then an alarm would provide little deterrent.
Vandalism Regression Model (Binary Probit Model)
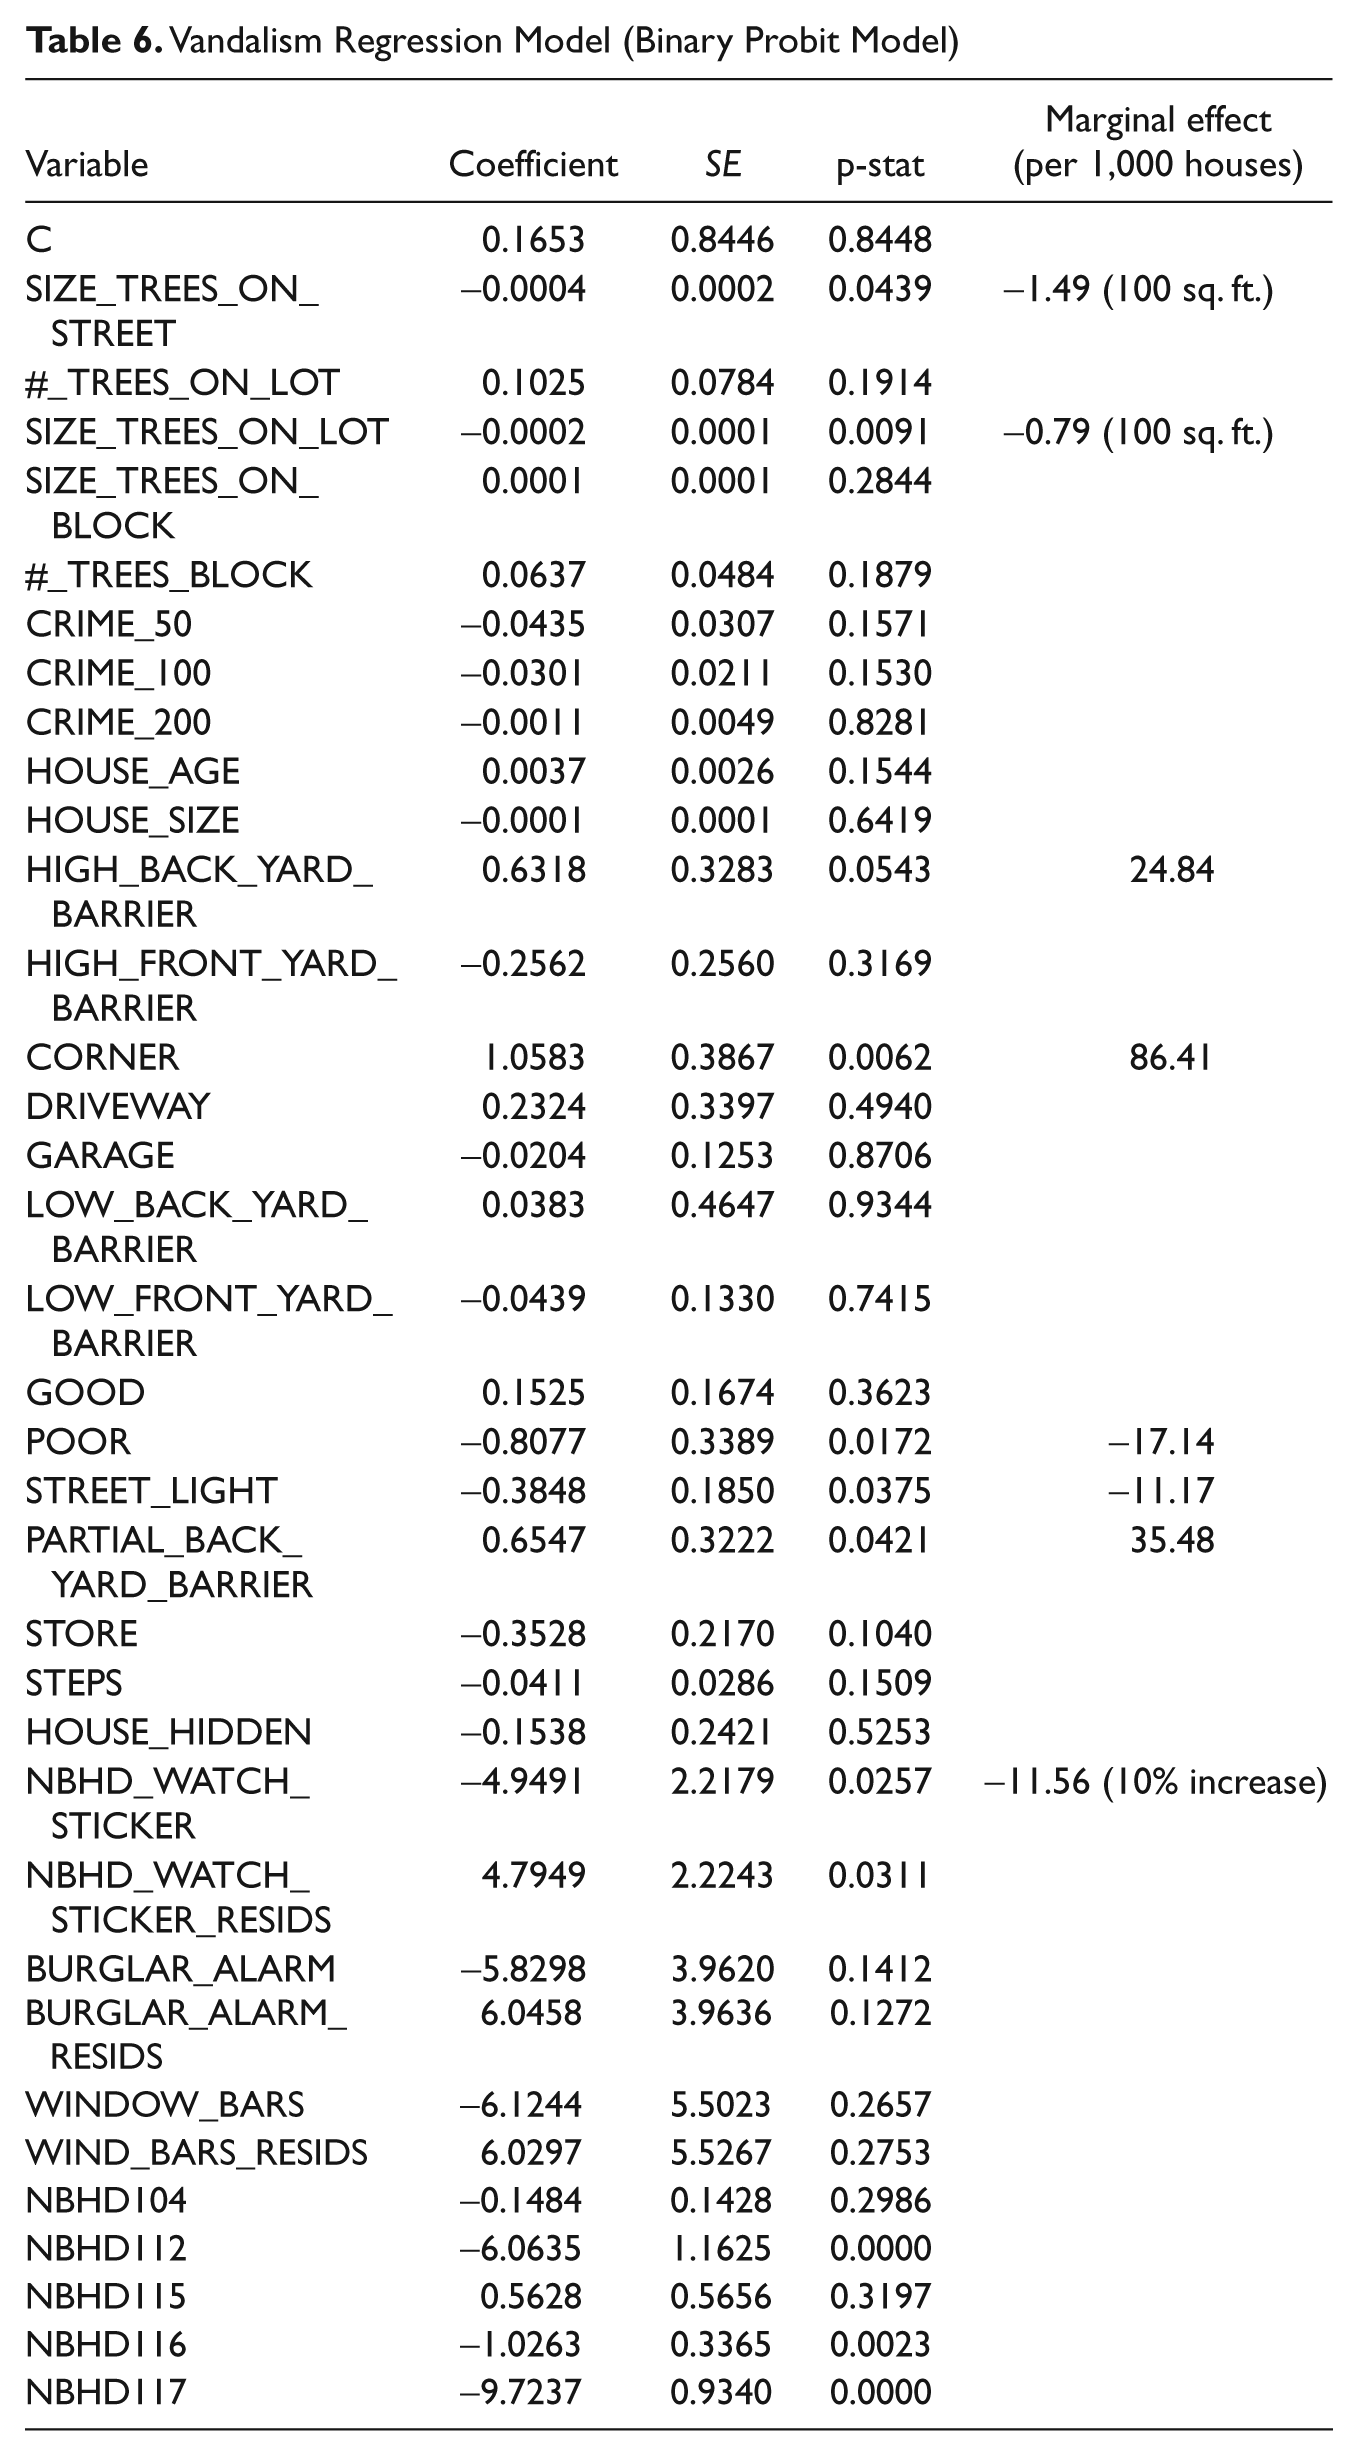
Table 7 compares the results of the five crime models. The only discrepancy among them is that although neighborhood 112 has higher rates of overall crime and property crime, it has a lower vandalism rate. The crown area of street trees fronting a house was associated with reduced crime in four of the five models as was the crown area of trees on a house’s lot. In contrast, the number of trees on a house’s lot was associated with increased crime in three models.
Summary of Crime Regression Models
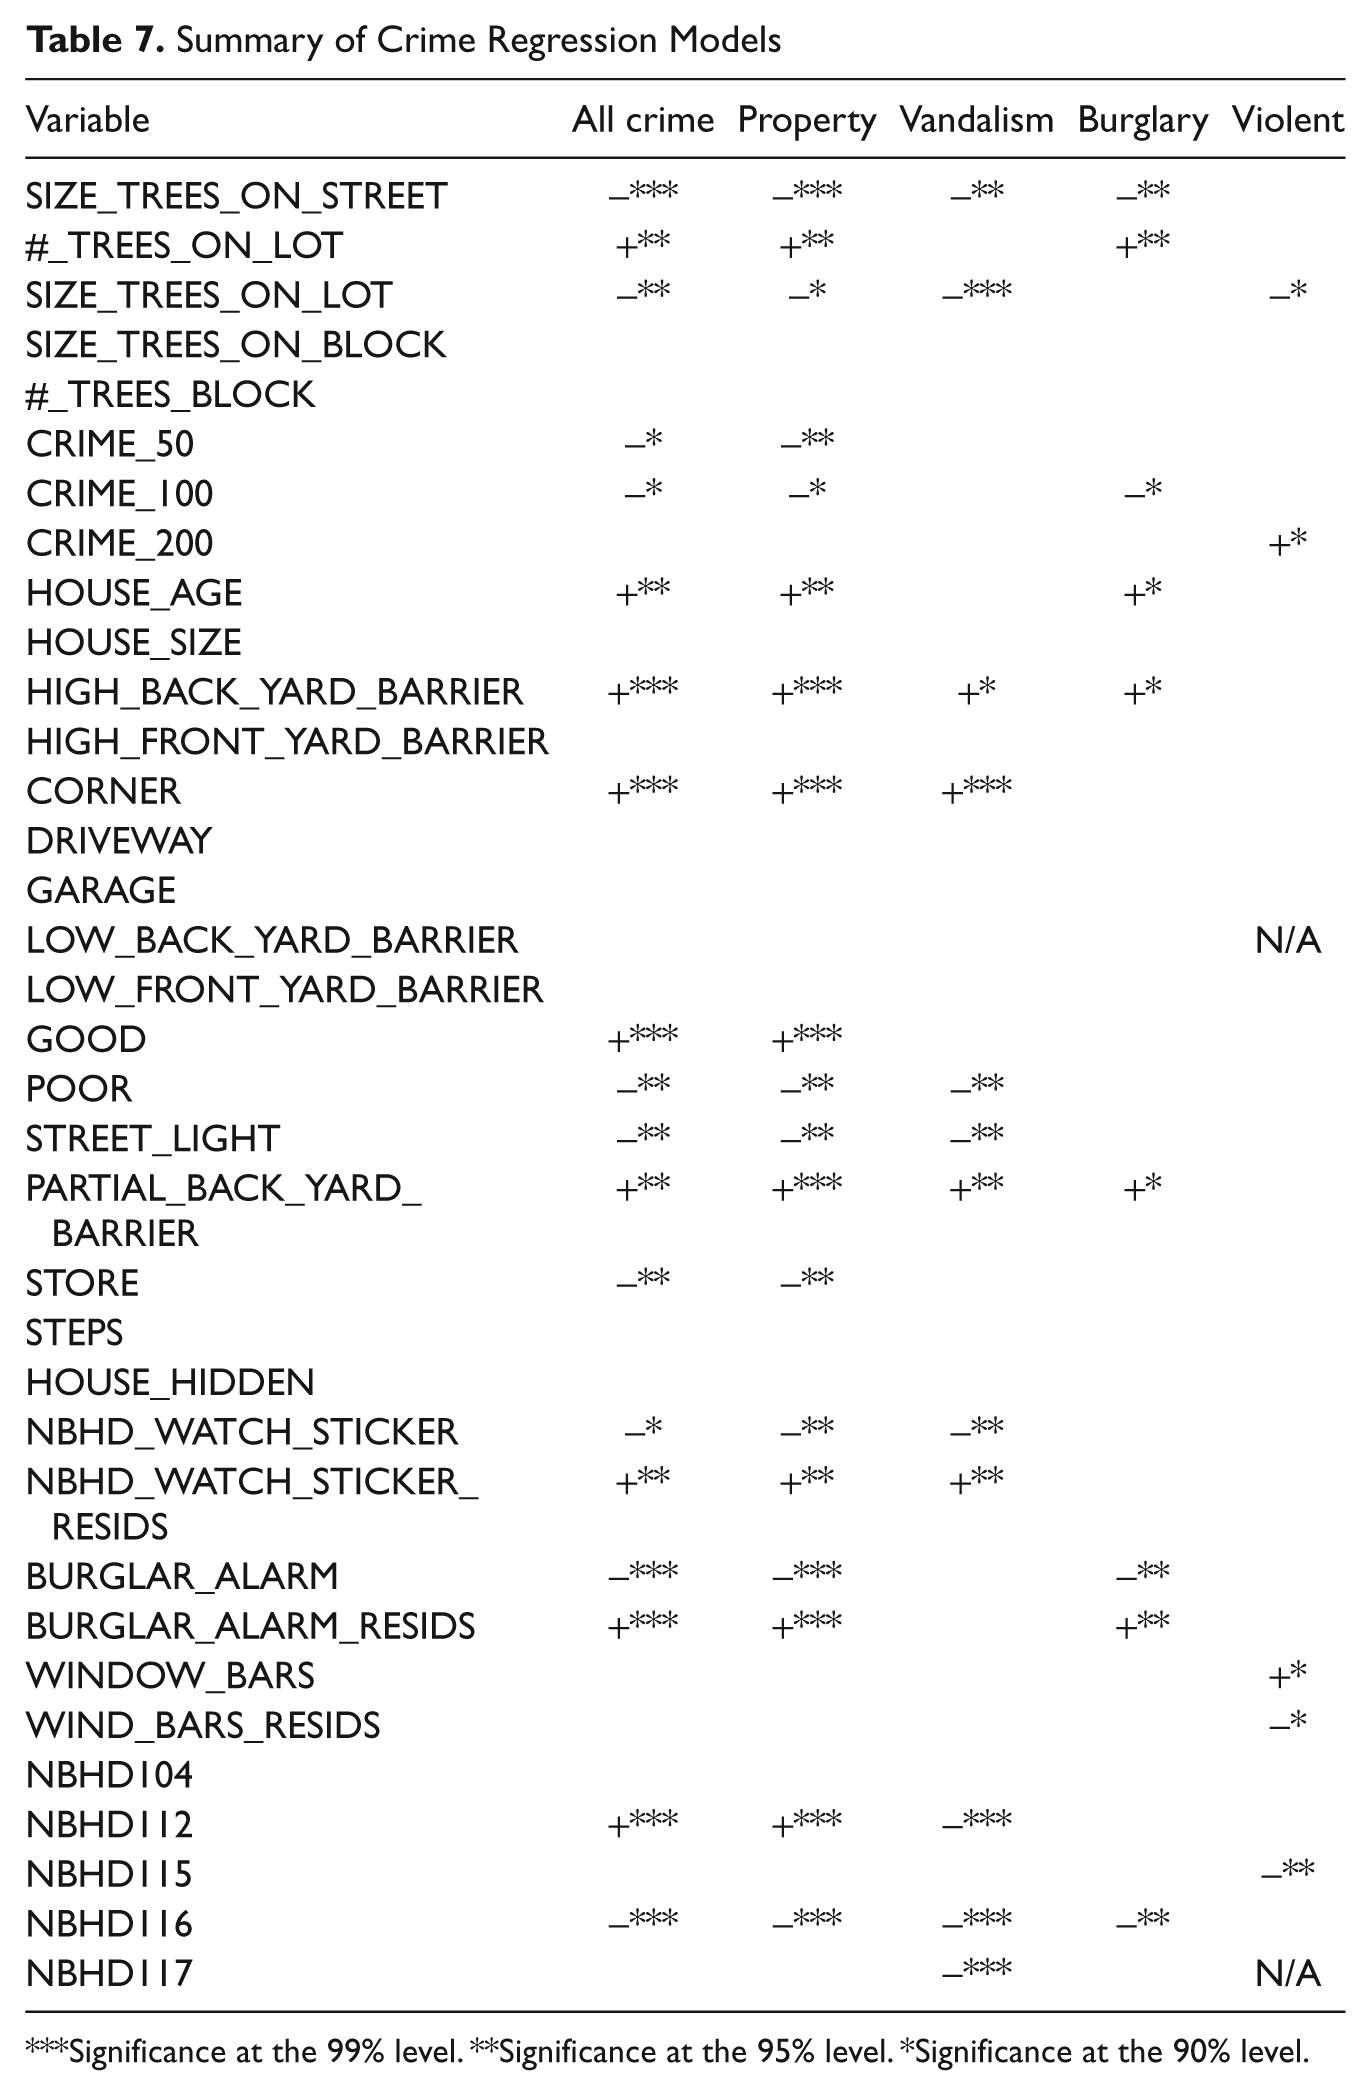
Significance at the 99% level. **Significance at the 95% level. *Significance at the 90% level.
The marginal effects of the statistically significant variables in each crime model are documented in the last columns of Tables 2 through 6. These marginal effects broadly show that the statistically significant relationships are of economic significance, as well. For example, in the all-crime model, a 10% increase in the number of street lights would have caused (if we accept causality) a reduction of 52 crimes in our sample of houses, reducing the number of reported crimes in our sample by 12%.
The marginal values reported in Tables 2-6 are per 1,000 houses. Therefore, to estimate the effect of each tree variable on overall crime in our sample of 2,813 houses, we multiplied the marginal values by 2.813. We found that street trees fronting a house reduced overall crime occurrence by 44 (again, assuming causality). The crown area of trees on the lot reduced crime by 50, and the number of trees on a lot increased crime by 61. Therefore, the net effect of lot trees was an increase of 11 crimes, and the net effect of all trees was a reduction in crime by 33. These numbers should be interpreted with care, as some of the observed reduction in crime may be by crime displacement (Reppetto, 1976). However, displacement is likely to result in some absolute reduction in crime (Weisburd et al., 2006). If a criminal is displaced from his preferred target, then he may select a less desirable target—which may increase the chance of being apprehended—or he may simply choose not to commit a crime.
Discussion
We estimated the effect of trees and other relevant variables on crime occurrence in Portland, Oregon. In general, our results were consistent with RA theory. For example, variables that decreased the probability of a criminal being observed (HIGH_BACK_YARD_BARRIER and #_TREES_ON_LOT) or increased the probability that a criminal would encounter a house (CORNER) increased crime occurrence. In contrast, variables that increased the probability of a criminal being observed (STREET_LIGHT, NBHD_WATCH_STICKER, STORE, and BURGLAR_ALARM) decreased crime occurrence. The effect of trees was mixed. Lot trees small enough to block the view from a first-floor window increased crime occurrence, which is consistent with RA theory. However, larger lot trees and street trees decreased crime occurrence. This result can be explained by RA theory (trees make public spaces more desirable, which increases the probability of a criminal being observed), but it is also consistent with the principles underlying the broken windows theory: attributes of a neighborhood may provide information to criminals about the effectiveness of authority. Specifically, trees may indicate that a neighborhood is more cared for and, therefore, a potential criminal is more likely to be observed by an authority. Finally, we reiterate that just because a variable was not significant in our analysis does not mean that it does not affect crime occurrence. Small sample sizes might have limited our abilities to make inferences (Type II error rates are inflated relative to larger samples).
Our finding that trees can be associated with increased crime may seem to be inconsistent with the work of Kuo and Sullivan (2001), which only found a negative relationship between trees and crime. However, we do not believe that this is the case. The trees in the study by Kuo and Sullivan were on common property surrounding apartment buildings. Therefore, although the parallel is not exact, we would consider these street trees, and, when significant, we always found that street trees were associated with reduced crime. We contend that our study, which had a different design and was conducted in a different area, bolsters the findings of Kuo and Sullivan. However, we were also able to identify circumstances in which trees may increase crime, which suggests that vegetation-induced fear of crime (Nasar & Fisher, 1993), for example, may sometimes be well founded.
As with any observational study, our regression results demonstrate correlation and not causation. However, for three reasons, we believe that our results strongly suggest causation. First, our choice of tree variables was guided by established theories of crime motivation. Second, we controlled for a wide range of other variables that may affect crime occurrence (our choice of covariates was guided by the crime literature and by consultations with local crime-prevention officers). Third, our results are consistent with Kuo and Sullivan (2001), who studied the effect of trees on crime occurrence in a very different residential environment using different statistical tools. However, it remains possible that our findings resulted from unmeasured third factors correlated with crime as well as the tree variables.
The effects of trees on crime we identified were relatively modest. However, trees have multiple benefits other than potential crime reduction (energy conservation, storm-water reduction, etc.), and the results of this study should be interpreted in this light. It is unlikely that anyone would choose to plant a tree solely for its crime-reduction benefits. However, in combination with the other benefits of trees, crime reduction may provide a spur to tree planting. In addition, our study provides guidance on how to minimize the crime-increasing effects of trees. Finally, our results provide some more general insights into crime reduction and criminal psychology. Specifically, some crime-prevention measures may not appear to have a direct link to crime occurrence, but, nonetheless, they may effectively reduce crime by giving signals to potential criminals.
Footnotes
The authors declared that they had no conflicts of interests with respect to their authorship or the publication of this article.
The authors received no financial support for the research and/or authorship of this article.