
Abstract
The neighborhood influences on walking are well recognized, yet less is known about how the environment impacts sedentary behaviors. This study used a social-ecological model to examine the correlates of sitting time, independent of walking behavior. Objective built environment measures and self-reported community participation were examined for associations with sitting time for 1,179 residents in Perth, Western Australia. Neighborhood built environment and social factors were significantly associated with women’s sitting time only. In particular, the presence of community infrastructure was negatively associated with women’s weekday sitting (relative reduction = 0.951; p = .037), but statistical significance weakened after accounting for community participation (relative reduction = 0.951; p = .057). Community participation was independently associated with both women’s weekday and weekend sitting (both p < .001). More walkable neighborhoods may help limit women’s sitting time by providing better access to community infrastructure, as local venues may afford additional opportunities for social interaction and participation.
Introduction
There is now considerable evidence that “walkable” environments, as characterized by higher residential densities, street connectivity and mixed land-uses, can promote walking (Durand, Andalib, Dunton, Wolch, & Pentz, 2011; Giles-Corti et al., 2013; Ogilvie et al., 2007; Owen, Humpel, Leslie, Bauman, & Sallis, 2004; Saelens & Handy, 2008). The widespread acceptance of this evidence is demonstrated by extensive advocacy to change the planning, transport, and urban design policies that dictate the location and accessibility of activities required for day-to-day living (Centers for Disease Control and Prevention, 2007; Gebel, Bauman, Owen, Foster, & Giles-Corti, 2009; Kopelman, Jebb, & Butland, 2007; National Heart Foundation, Planning Institute of Australia, & Australian Local Government Association, 2009; National Institute for Health and Clinical Excellence, 2008; National Preventive Health Taskforce, 2009). It has also been proposed that built environments could influence the sedentary behavior of local residents, as “environmental barriers that discourage participation in outdoor physical activity may make sedentary behaviors an easier default option” (Sugiyama, Salmon, Dunstan, Bauman, & Owen, 2007, p. 444).
Sedentary behavior, as distinct from physical inactivity (i.e., performing insufficient amounts of moderate to vigorous physical activity), is now recognized as an independent risk factor for chronic disease (Boyle, Fritschi, Heyworth, & Bull, 2011; Hamer, Stamatakis, & Mishra, 2010; Tremblay, Colley, Saunders, Healy, & Owen, 2010). Sedentary behavior is defined as “any waking behaviour characterized by an energy expenditure of ≤1.5 METs while in a sitting or reclining posture” (Sedentary Behaviour Research Network, 2012, p.540) and includes behaviors such as television viewing, screen-based entertainment, occupational sitting, and vehicle travel (Yates et al., 2011). Notably, even for those who meet recommended levels of physical activity; extended periods of sitting still appear to compromise their health (Owen, Healy, Matthews, & Dunstan, 2010).
Evidence indicating that the built environment can impact sedentary behaviors is relatively scant. Although several studies have examined the premise that a more walkable built environment might also limit residents’ sitting time, results are mixed (Coogan, White, Evans, Palmer, & Rosenberg, 2012; Frank, Andresen, & Schmid, 2004; Kozo et al., 2012; Lee, Scherezade, Mama, & Adamus-Leach, 2012; Sugiyama et al., 2007; Van Dyck et al., 2010; Van Dyck et al., 2012). For instance, a study using pooled data from several settings (i.e., Australia, United States, Belgium) found a scale including perceived aesthetics and destination proximity was negatively correlated with overall self-report sitting time, although the association was stronger for men than women, and was non-significant for Belgian adults (Van Dyck et al., 2012). Indeed, evidence suggests that Belgian residents in high walkable neighborhoods (as rated by objective measures) actually sit more than their counterparts in less walkable neighborhoods (Van Dyck et al., 2010).
Others have focused on specific dimensions of sitting time, such as vehicle travel time or TV watching. Van Dyck et al. (2012) reported that neighborhoods perceived to be more “activity friendly” were negatively associated with motorized transport time, and in this instance their finding was consistent across countries and gender. Similarly, Frank et al. (2004) found a negative correlation between the objectively measured components of a walkable neighborhood and vehicle travel in the United States. In contrast, Coogan et al. (2012) found no association between neighborhood walkability and TV viewing for African American women, whereas Sugiyama et al. (2007) identified a significant negative association between walkability and TV watching for Australian women (Sugiyama et al., 2007). Although walkable neighborhoods are theorized to limit sitting time by promoting physical activity, Sugiyama and colleagues controlled for physical activity. This may hint at an alternative pathway through which built environments might affect sitting, other than simply through the mechanism of increased walking or physical activity.
One plausible pathway connecting more walkable neighborhoods with less sedentary behavior may be via the social environment. For instance, the higher residential densities that characterize walkable neighborhoods could also provide residents with a greater variety of community activities and more social infrastructure, and these social opportunities may themselves contribute to reducing sitting time. Yet few studies have examined the relationship between the built environment, social factors, and sedentary behavior (Prince et al., 2011; Teychenne, Ball, & Salmon, 2012). For example, Teychenne et al. (2012) found intra-personal and social factors (i.e., social cohesion and social support) partly mediated the association between socio-economic status (SES) and Australian women’s television viewing, while perceptions of the built environment were non-significant (Teychenne et al., 2012). However, overall, the role of social factors in decreasing sedentary behavior has been largely overlooked.
Social-ecological models posit that an individual’s behaviors are influenced by the social and physical environments in which they live (Stokols, 1992). Recently, researchers have highlighted the need for studies with greater socio-ecological breadth (Rhodes, Mark, & Temmel, 2012), as improved knowledge of both built environment and social correlates would help target interventions to reduce sitting time (Owen et al., 2010; Owen et al., 2011; Rhodes et al., 2012). Notably, Owen et al. (2011) developed a comprehensive ecological model summarizing the domains influencing sedentary behaviors (e.g., household, occupation, leisure time, and transport), which are likely to have distinct determinants. Importantly, the neighborhood environment could govern sedentary behaviors across several domains, as a more walkable local neighborhood might support physical activity behaviors (i.e., walking, cycling, and sporting infrastructure), active transport (i.e., public transit infrastructure and services), minimize vehicle travel time (i.e., proximate access to shops, services, and employment opportunities), and create opportunities for social engagement and community participation (i.e., social infrastructure such as cafes, restaurants, community halls).
Given the inconsistencies in the evidence on the built environment and sedentary time, and the dearth of studies exploring the role of the social environment, this study uses a social-ecological model to examine associations between neighborhood planning attributes, community participation, and sedentary behavior. We examined (a) the association between objectively measured neighborhood attributes and self-reported sitting time and (b) whether any association between the built environment and sitting can be explained by higher levels of community participation.
Method
Sample
The sample comprised 1,179 participants in the RESIDential Environments (RESIDE) Project (response rate = 33.4%). Participants were new home buyers who moved into residential developments located across the Perth metropolitan area (n = 73 developments). These developments were classified by the state government’s Department of Planning as, “liveable” (i.e., complying with the “Liveable Neighborhoods Guidelines”—a subdivision design code based on new urbanism principles; n = 18); “hybrid” (i.e., having some liveable neighborhood attributes; n = 11); or “conventional” (i.e., not complying with the guidelines; n = 44). The Liveable Neighborhoods Guidelines aimed to create pedestrian friendly neighborhoods, and objective measures (e.g., street connectivity, residential density, and land-use mix) indicated these developments were more supportive of walking (Christian et al., 2013).
All people building new homes in the study areas were invited to participate by the state water authority following the land transfer transaction. They were proficient in English, >18 years old, and agreed to complete three surveys during the study. This article is a cross-sectional analysis focusing on participants who had lived in their new neighborhood for about 32 months (time point 3: collected 2006-2008). Objective environmental measures were generated for each participant’s 1,600 m neighborhood using Geographic Information Systems (GIS). RESIDE is fully described elsewhere (Giles-Corti et al., 2008). Ethics approval was provided by The University of Western Australia’s Human Research Ethics Committee.
Context
The RESIDE study was set in suburban neighborhoods with most participants living in new Greenfield developments on the urban fringe. Residential developments were located across 48 suburbs, but were similar in terms of the housing stock (i.e., single family detached houses) and infrastructure provided. In particular, participants were well served by public open space and walking infrastructure, which are typically implemented early in the land development process by Australian developers (Hooper, Giles-Corti, & Knuiman, 2014). In contrast, minimal land was allocated to retail with relatively few participants having good access to shops and services (Christian et al., 2013; Foster, Giles-Corti, & Knuiman, 2010).
Sitting Time
Self-report sitting on a weekday and weekend day was collected using modified International Physical Activity Questionnaire (IPAQ) items: (a) in a usual week, how much time do you spend sitting on a weekday; and (b) in a usual week, how much time do you spend sitting on a weekend day (min). Studies assessing IPAQ have reported good test–retest reliability (Spearman correlations ranged from .40-1.0) and fair criterion validity (i.e., most Spearman correlations above .25) (Rosenberg, Bull, Marshall, Sallis, & Bauman, 2008).
Individual Characteristics
Individual characteristics included age, education, household income, marital status, number of children, age of children, number of hours worked, and physical activity level at work. Body mass index (BMI; kg/m2) was calculated using self-report height and weight. Walking inside the neighborhood (min/week) was measured using the Neighborhood Physical Activity Questionnaire (NPAQ), which has acceptable reliability (Giles-Corti et al., 2006).
Social Factors
Community participation was based on the count of activities in which participants were involved in their local area during the past year (Lindström, Hanson, & Östergren, 2001). Activities (n = 29) include social or community service participation (e.g., book club, hobby class, artistic activity, fund raising activity, resident’s association, community action group, volunteer/service organization, school-related group/activity, social contact through children’s sport, street/neighborhood party, church/religious group, mothers’ group, fete) and sporting, exercise or recreational club participation (i.e., as a participant, coach/instructor or spectator) (M = 2.31, SD = 2.66, range = 0-18; Cronbach’s α = .744).
Built Environment
All objective built environment measures were generated using GIS for the 1,600 m road network distance from home, rather than using the Euclidean (“as the crow flies”) distance, or an arbitrary statistical boundary (e.g., suburb or census collection district). The 1,600 m road network distance was chosen to represent the maximum distance a person could walk in 15 min (using the accepted speed 6 km/h), regardless of whether their local streets were well connected (i.e., traditional gridded street patterns vs. curvilinear street layouts). Each participant’s environmental measures were unique to their home address (i.e., individual-level, person-specific measures).
Neighborhood walkability was measured using a modified transport walkability index (Frank, Schmid, Sallis, Chapman, & Saelens, 2005) that combined (a) street connectivity (the count of three- or more-way intersections, where more three- or more-way intersections represent a better connected street network with more route choices); (b) residential density (ratio of the area in residential use to the number of residential dwellings in the area); (c) land-use mix (evenness of development across specified land-uses: residential; retail; office; health community and welfare; and entertainment, culture and recreation) (Christian et al., 2011); and (d) transit stops (count of bus or train stops). Data were supplied courtesy of The Western Australian Land Information Authority. The component z scores were summed to form the walkability index, and component raw scores were examined individually.
As the mix and evenness of land-uses across the neighborhood (as captured by the land-use mix “entropy” measure) may not be as relevant to an outcome as the simple presence of specific destinations (Brown et al., 2009), we also created an objective measure of community infrastructure. This was generated from a commercial listings directory (i.e., Sensis) and supplemented with school information. The additive scale comprised the count of specific destinations within 1,600 m of each participant’s home that were potential sites for both formal and informal interaction, including schools, churches, synagogues/temples, community halls, clubs, hotels/taverns, libraries, fast food outlets, cafes/restaurants, sports fields, swimming pools, and fitness/recreation centers (M = 22.18, SD = 14.58, range = 0-81).
Statistical Analysis
A negative binomial model (with log link) was used to compute the percentage change in time spent sitting per day (rate ratios) per one standard deviation (SD) increase in the exposure variables. A log link allows the relative effect of variables on sitting time to be estimated (i.e., percentage change in sitting time). This model has been applied elsewhere (Van Dyck et al., 2012) and is appropriate because sitting time is non-negative, positively skewed, and has a variance that exceeds its mean. Clustering of participants within residential developments was accommodated using a random effect. Analyses were conducted separately for men and women in SPSS version 21.
Initially, the univariate association of each socio-demographic factor with sitting time was assessed. Subsequent analyses examining associations between the built environment and community participation variables and sitting time controlled for socio-demographic factors (i.e., age, education, income, marital status, number of children, hours worked, physical activity level at work, walking, and BMI). Each built environment and social factor was examined separately, and a further multivariable model including all significant variables simultaneously was fitted. Results are presented as estimates (and 95% confidence intervals) for the relative change in sitting time per change in one SD for the continuous variables. Relative change estimates are translated into approximate absolute effects using the overall mean of sitting time.
Results
Compared with women, men reported more weekday sitting (men 324 min, women 300 min; p = .028) and weekend day sitting (men 282 min, women 258 min; p = .004). The unadjusted associations between the socio-demographic variables and sitting time for men and women are presented in Tables 1 and 2, respectively. For men, income was associated with sitting time on both weekdays and weekend days, whereas physical activity at work was associated with weekday sitting only, and walking and BMI with weekend sitting only. For example, higher income men and those who were inactive at work tended to spend more time sitting on weekdays. For women, physical activity at work was also associated with weekday sitting, whereas number of children, hours worked, and BMI were significantly associated with both weekday and weekend sitting. For example, women with no children tended to sit more than those with children, and overweight or obese women sat more than those with a healthy weight.
Men’s Descriptive Information and Univariate Associations With (a) Weekday Sitting Time and (b) Weekend Sitting Time.
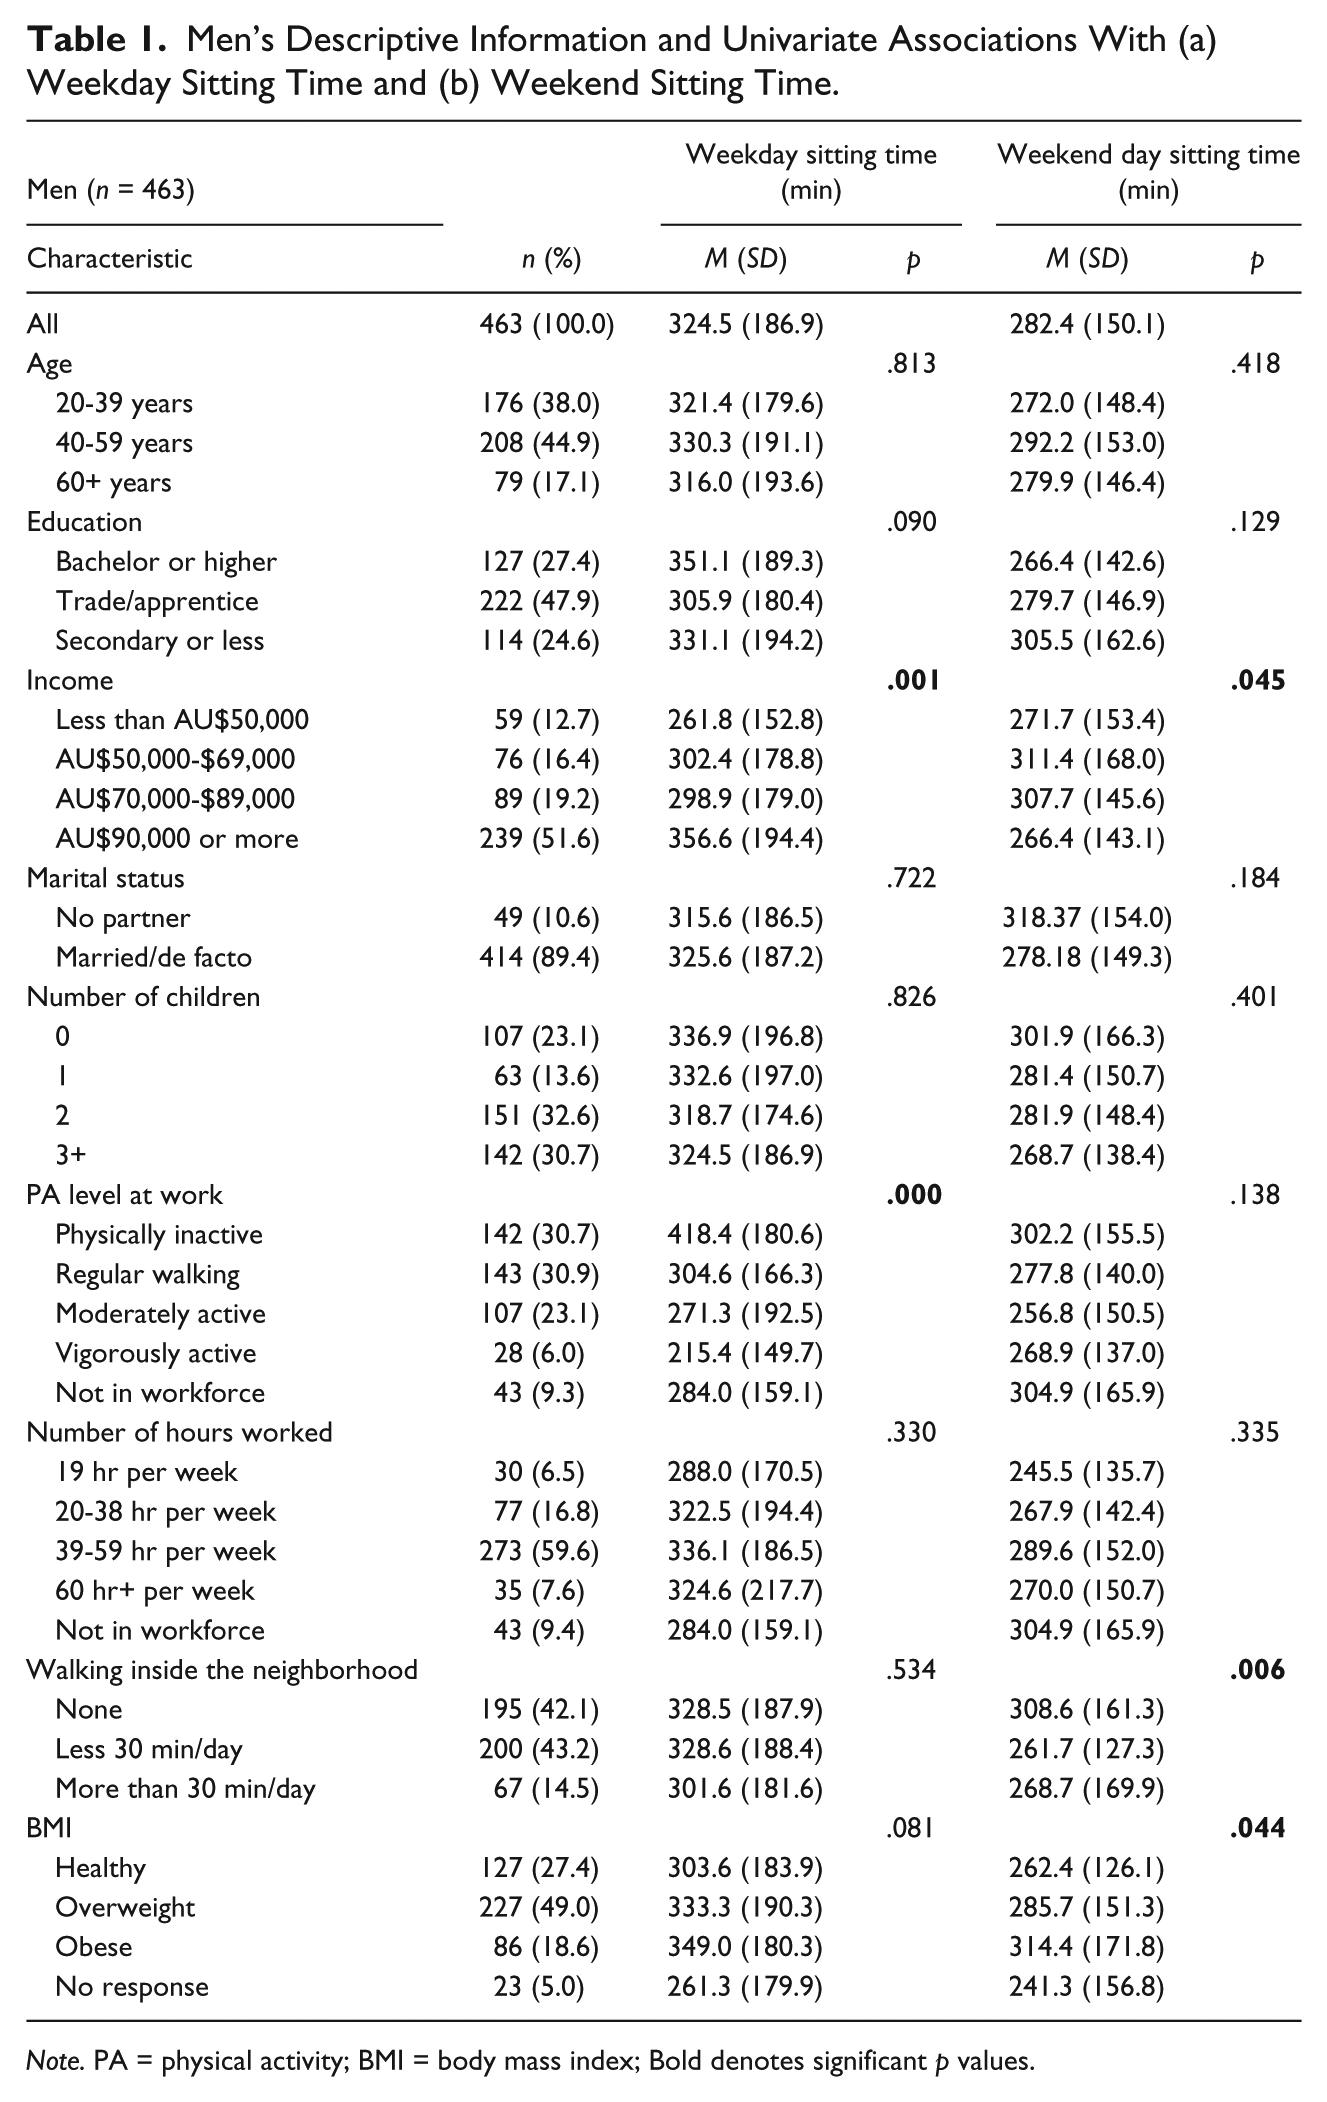
Note. PA = physical activity; BMI = body mass index; Bold denotes significant p values.
Women’s Descriptive Information and Univariate Associations With (a) Weekday Sitting Time and (b) Weekend Sitting Time.
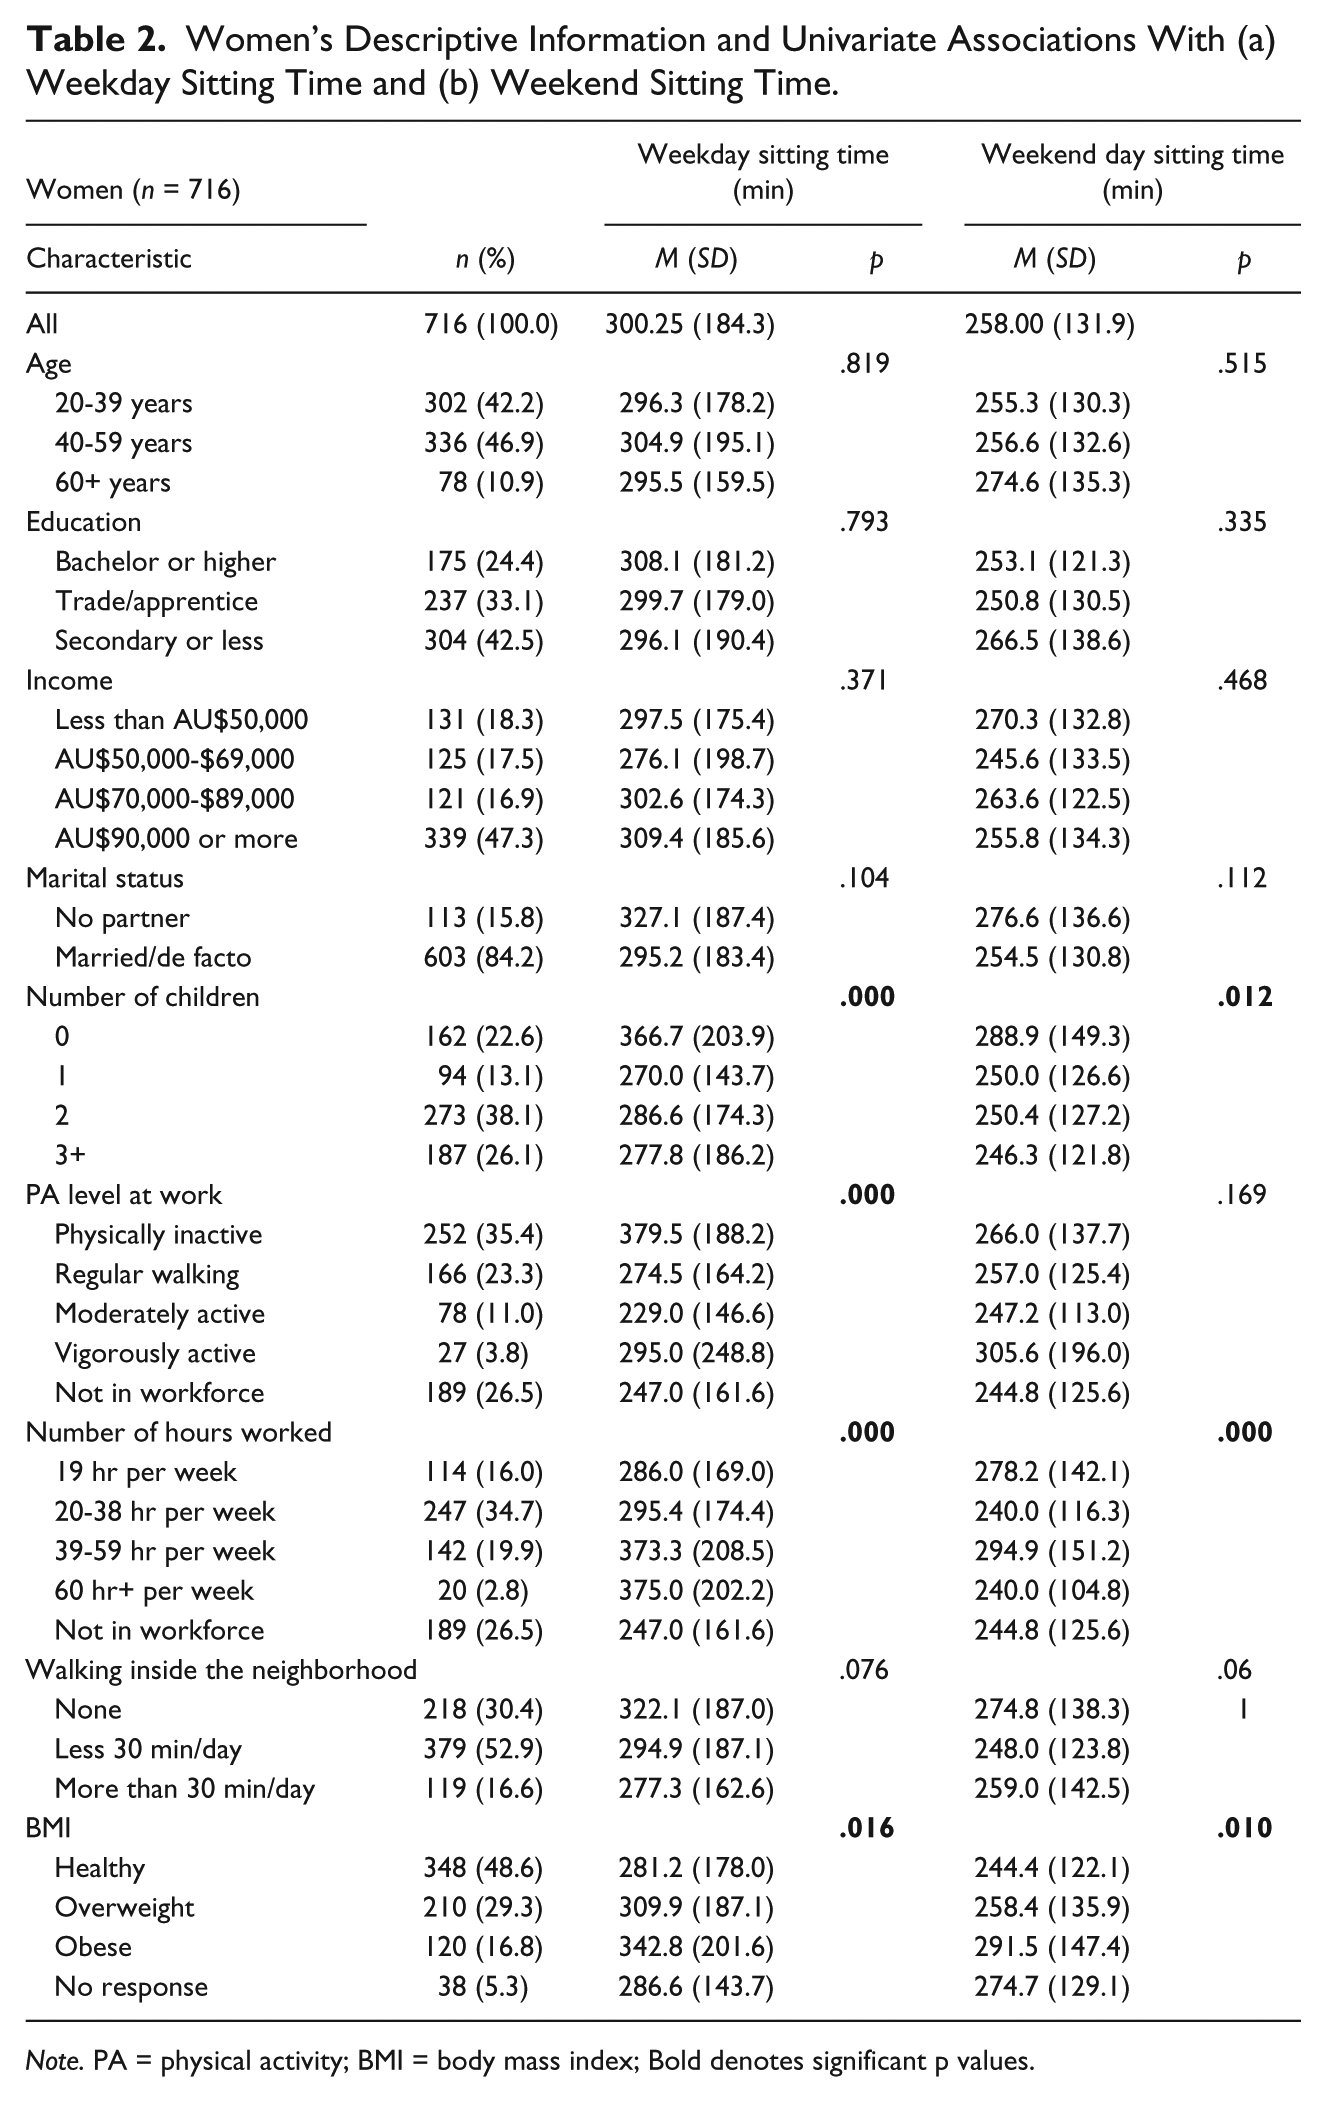
Note. PA = physical activity; BMI = body mass index; Bold denotes significant p values.
The associations between the built environment and social factors and sitting time, after controlling for socio-demographic variables are presented in Tables 3 and 4 (i.e., one exposure per model, adjusted for socio-demographics). For men, most associations between the built environment and sitting time were in the anticipated direction, although non-significant. For example, for every SD increase in the walkability index, minutes of weekday sitting reduced by almost 5% (relative reduction = 0.951; p = .098). A 5% change in weekday sitting time for an average man (based on 324 min/day) would equate to reduction of about 16 min/day. Examination of the walkability index sub-components revealed that land-use mix had the strongest association with weekday sitting time (relative reduction = 0.950; p = .083). For weekend day sitting time, only transit stops approached statistical significance (relative reduction = 0.955; p = .074).
Estimated Relative Changes for Built Environment and Social Factors Associated With (a) Weekday Sitting Time and (b) Weekend Sitting Time for Men, After Adjustment for Individual Factors.
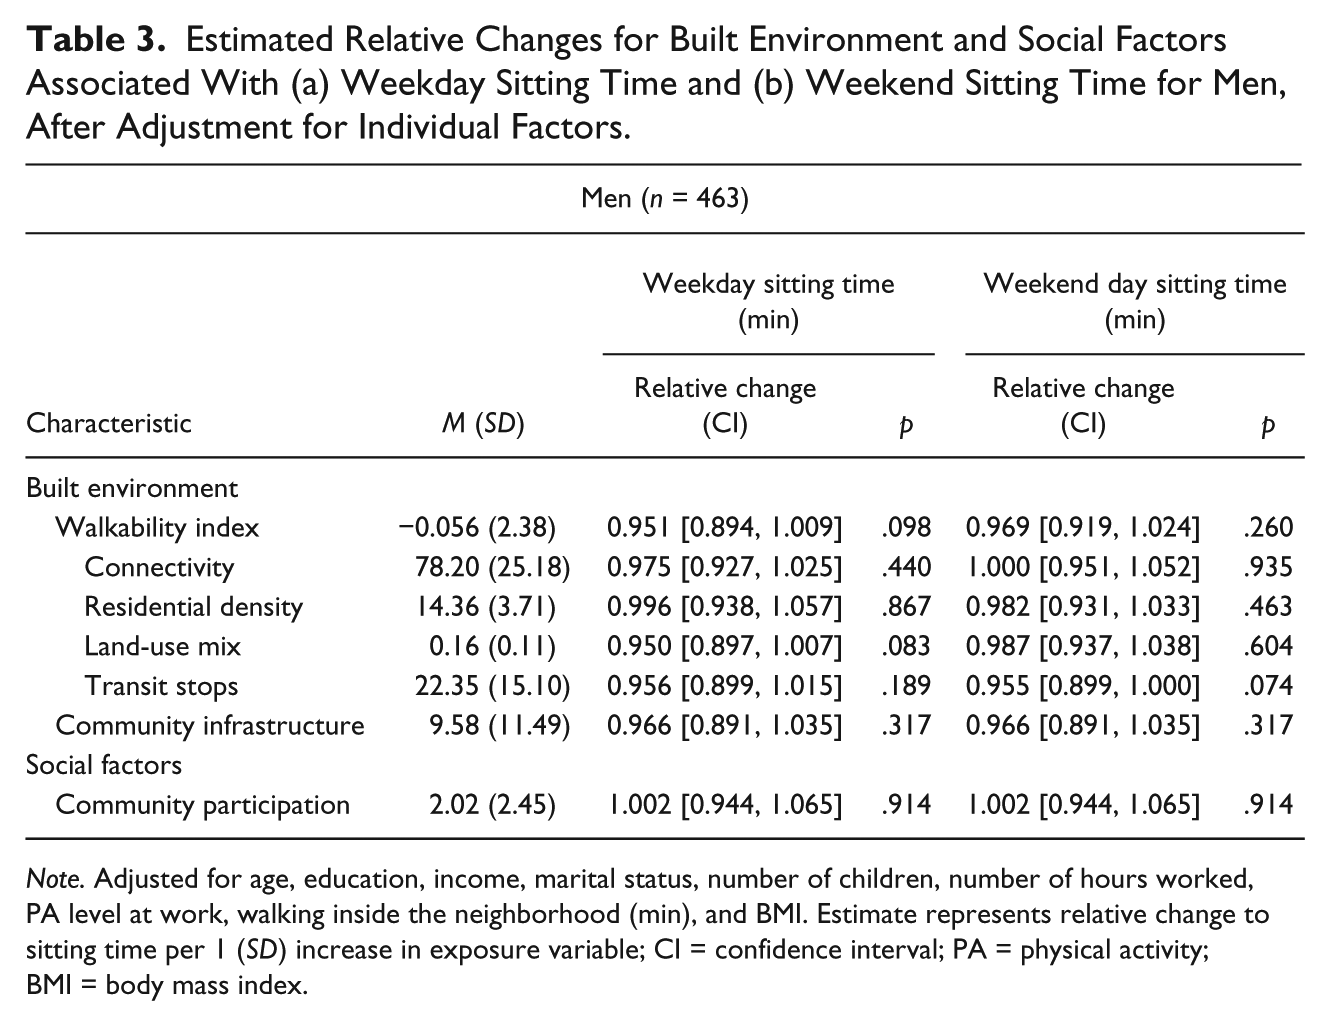
Note. Adjusted for age, education, income, marital status, number of children, number of hours worked, PA level at work, walking inside the neighborhood (min), and BMI. Estimate represents relative change to sitting time per 1 (SD) increase in exposure variable; CI = confidence interval; PA = physical activity; BMI = body mass index.
Estimated Relative Changes for Built Environment and Social Factors Associated With (a) Weekday Sitting Time and (b) Weekend Sitting Time for Women, After Adjustment for Individual Factors.
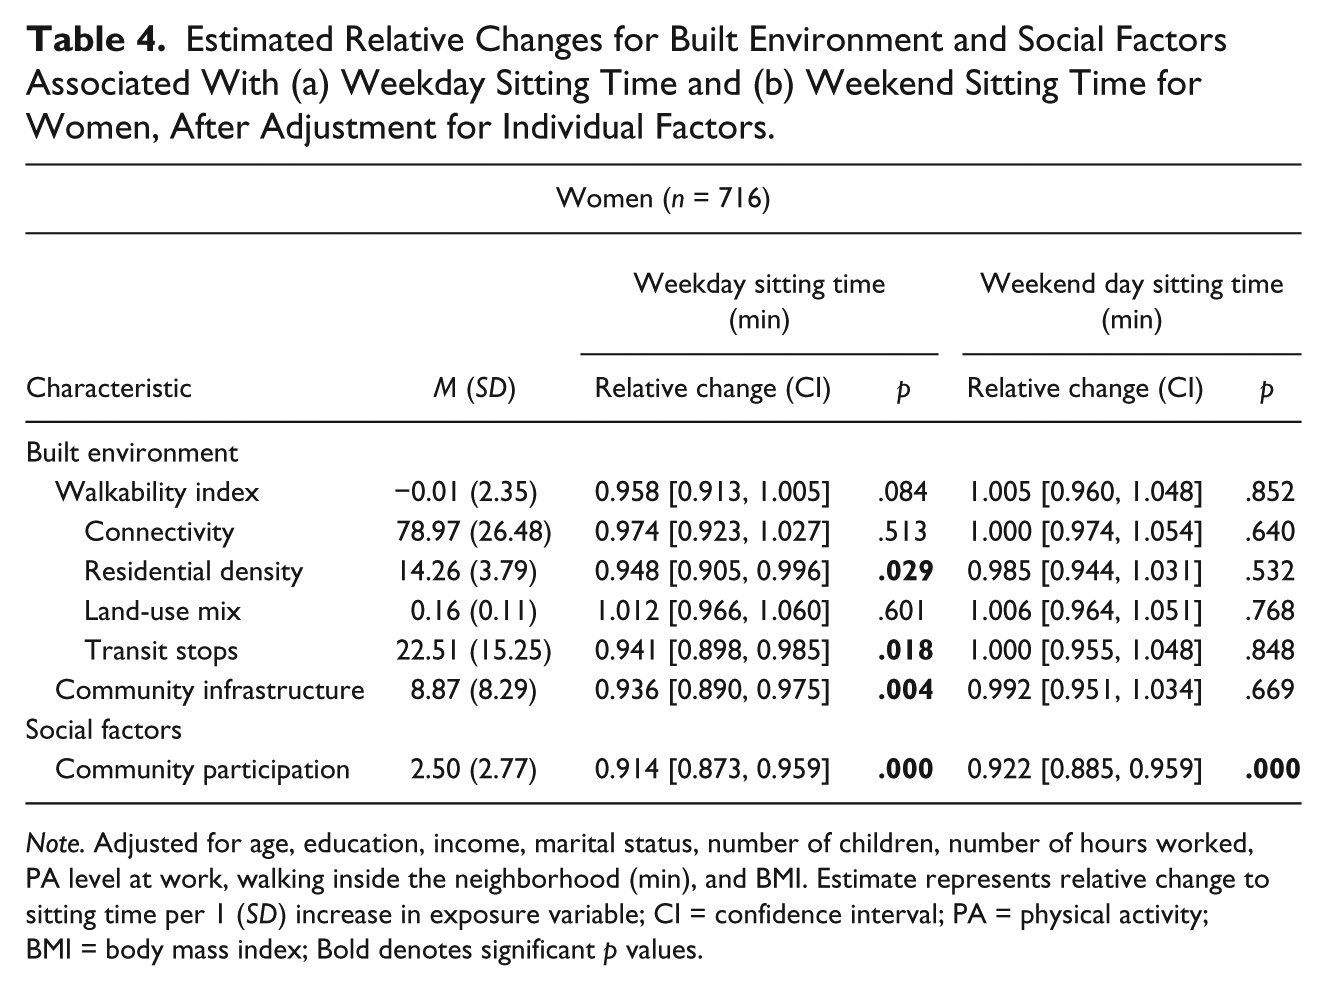
Note. Adjusted for age, education, income, marital status, number of children, number of hours worked, PA level at work, walking inside the neighborhood (min), and BMI. Estimate represents relative change to sitting time per 1 (SD) increase in exposure variable; CI = confidence interval; PA = physical activity; BMI = body mass index; Bold denotes significant p values.
For women, there was a similar weak negative association between the walkability index and weekday sitting time (relative reduction = 0.958; p = .084). Analysis of the sub-components revealed that residential density (relative reduction = 0.948; p = .029) and transit stops (relative reduction = 0.941; p = .018) had stronger associations with weekday sitting than land-use mix or street connectivity. None of the built environment measures considered was associated with women’s weekend day sitting.
The presence of community infrastructure was not associated with either outcome for men, but was negatively associated with women’s weekday sitting. For every SD increase in community infrastructure, women’s weekday sitting time reduced by more than 6% (relative reduction = 0.936; p = .004). A 6% change in weekday sitting time for an average woman (based on 300 min/day) would equate to reduction of about 18 min/day. Consistent with this, community participation was not associated with either outcome for men, but was negatively associated with both weekday and weekend sitting for women. For every SD increase in community participation, women’s sitting time reduced by about 8% for weekdays (relative reduction = 0.914; p < .001) and weekend days (relative reduction = 0.922; p < .001). For an average woman in our sample, this would equate to a 24 min/day reduction in weekday sitting (based on 300 min/day) and a 21 min/day reduction in weekend sitting (based on 258 min/day).
A further multivariable model simultaneously examined the significant (p < .05) built environment correlates of women’s weekday sitting time (i.e., residential density and community infrastructure). Transit stops were omitted due to a high correlation with community infrastructure (Pearson correlation = .691; p = .000). In this model, the association between residential density and weekday sitting attenuated (relative reduction = 0.970; p = .211), whereas community infrastructure retained a significant negative association with sitting (relative reduction = 0.951; p = .037). Finally, community participation was added to the model. This social measure remained strongly associated with weekday sitting (relative reduction = 0.922; p = .001), whereas the statistical significance of community infrastructure weakened slightly (relative reduction = 0.951; p = .057).
Discussion
This study adds to the small body of evidence suggesting the attributes of a more walkable built environment contribute to less sitting time in adult populations (Frank et al., 2004; Kozo et al., 2012; Sugiyama et al., 2007; Van Dyck et al., 2012). Although neighborhood walkability was not significantly correlated with sitting time (i.e., p < .1 for men’s and women’s weekday sitting time), the associations were in the anticipated direction for both genders with increased walkability associated with less weekday sitting.
Consistent with others (Stafford, Cummins, Macintyre, Ellaway, & Marmot, 2005), our results suggest that the residential environment may be more important to women’s health. Of the built environment variables examined, the strongest association was between community infrastructure and women’s weekday sitting time. In the fully adjusted models, an increase in community infrastructure was associated with a 5% decrease in weekday sitting (i.e., a reduction of about 15 min for an average woman in our sample). Although the estimated effect sizes for the built environment exposures and sitting time are small, if such changes were to occur across the population, it is likely that they would translate to a meaningful impact on health.
The findings suggest different factors may impact sitting time on weekdays and weekends. It seems self-evident that weekday and weekend schedules differ (Australian Bureau of Statistics, 2011), and for many women, work and child care commitments (and commuting to and from these destinations) will shape weekday routines. Furthermore, access to daily routine activities is dictated by the attributes of a more walkable neighborhood (i.e., with sufficient residential densities to support businesses and transit) (Owen et al., 2011). In contrast, neighborhood attributes had little association with residents’ weekend sitting. In car-dominated cities like Perth (Newman & Kenworthy, 1999), weekend activities may be undertaken across the wider metropolitan area. Furthermore, as our sample typically lived in new suburbs on the urban fringe, many destinations for weekend activities may not yet be available locally.
Consistent with Sugiyama et al. (2007), our findings suggest that there may be an alternative pathway through which environments discourage sitting time in women, other than by promoting walking. We hypothesized that community participation would help explain the association between walkable neighborhood attributes and sitting time, as more walkable neighborhoods might provide more opportunities for community participation. However, our findings indicate that both community infrastructure and community participation appear to be independently associated with women’s sitting time (although the former was marginally significant). Furthermore, as our community participation measure comprised many activities that are typically sedentary in nature (e.g., book club, hobby class); the findings suggest that incidental activity may also have a role in reducing sitting time.
Overall women in this study were involved in more community activities than men (women: M = 2.50, SD = 2.77; men: M = 2.02, SD = 2.45); t(1068) = 3.115; p = .002, and community participation was negatively correlated with sitting time for women only. One explanation for the different participation levels in men and women may relate to the inclusion of “child-centric” activities in the community participation variable (e.g., social contact through children’s sport, mothers group). Indeed, number of children was a highly significant predictor of less sitting time on weekdays and weekends for women, but not men. Thus, for participants with children, women might assume a greater share of the day-to-day parenting (Craig, 2006; Craig & Mullan, 2011; Doucet, 2001; Thompson & Walker, 1989) and actively participate in their community via their child’s activities (Wood, Giles-Corti, Zubrick, & Bulsara, 2013).
This pattern fits with a previous Australian study that found women were less likely to be “low participators” (Baum et al., 2000). Women were more likely to participate in social activities (e.g., school-related groups, hobby groups), whereas men were more likely to attend social clubs and play sport. Women were also more likely to participate in social activities set in informal settings such as cafés or restaurants (Baum et al., 2000). However, opportunities to participate may only limit the sedentary behavior of those willing to be drawn into community life. Hamer et al. (2010) proposed an alternative pathway whereby excessive periods of sedentary time can increase social isolation and hinder integration into social networks to the detriment of mental well-being.
Our findings support the notion that busy people are less sedentary; however, they also have implications for neighborhood design. Others have highlighted the importance of providing social infrastructure to promote participation (Baum & Palmer, 2002; Wood et al., 2013) and community activities require both formal (e.g., community center) and informal venues (e.g., café) to host these activities. It is plausible that neighborhoods with higher residential densities might support a greater range of activities, appealing to the diverse interests of local residents, and possibly resulting in greater community participation (i.e., areas with higher residential densities may have more people to support local activities). Moreover, higher population densities ensure that the local businesses that provide venues for informal activities are financially viable (Giles-Corti, Ryan, & Foster, 2012). For instance, in our study, there was a moderate correlation between residential density and the provision of community infrastructure (Pearson correlation = .442; p = .000).
The suggestion that community infrastructure may have a role in helping to minimize women’s weekday sitting time could have implications for both government and developers. As new neighborhoods develop, social infrastructure often follows, rather than precedes development. Given its relevance to creating communities and encouraging participation, particularly for women, it may be necessary to provide financial incentives to facilitate the establishment of social infrastructure in new neighborhoods earlier in the land development process (Baum & Palmer, 2002). This is likely to be health protective by providing necessary local services, promoting local walking and potentially helping to minimize sitting time. Conversely, creating new neighborhoods without adequate social infrastructure may harm residents’ health, particularly those who spend more time in the neighborhood (e.g., parents of young children, retirees, unemployed).
The main strength of this study was the inclusion of objective built environment measures specific to each participant’s 1,600 m neighborhood; however, there are several limitations. First, this study was cross-sectional, so causality cannot be determined. We hypothesized that neighborhood characteristics might contribute to less sitting time; however, it is equally possible that those preferring sedentary lifestyles relocate to neighborhoods supporting this preference (i.e., self-selection). Longitudinal studies are necessary to understand whether environmental changes and increased community participation actually influence sitting behaviors.
We examined overall sitting (rather than domain-specific sitting) and adjusted for a range of individual and workplace factors. Although this is a relatively coarse measure of sitting time, we theorized that attributes of the neighborhood environment could influence sitting across multiple domains (e.g., household, leisure time, and transport), as urban planning characteristics dictate proximity to employment, shops and services, public transit, and social and recreational opportunities. Furthermore, sitting time is particularly sensitive to recall bias, as these behaviors “are repetitive and often non-interactive” (Owen et al., 2010, p. 156). For self-reported measures of sitting time, specific sitting behaviors (e.g., TV viewing, workplace sitting) appear easier to recall than overall sitting (e.g., usual weekday or weekend day) (Healy et al., 2011). Moreover, it is possible that when asked to recall “sitting time” people do not recall time spent sitting when out socializing, but only recall sitting time at home or work. Ideally, studies examining sitting time would combine accelerometry with self-reported sitting to capture domain- and behavior-specific sedentary time (Healy et al., 2011).
Participants were homeowners in relatively new suburban neighborhoods, and the limited environmental variability may have reduced the magnitude of the observed associations. This is particularly relevant to our walkability and community infrastructure findings, which may be affected by the evolution of new neighborhoods. However, new suburbs remain an important environment to examine sitting time, as participants have typically moved to the urban fringe, with larger commute times and fewer shops and services. Furthermore, given the study setting, the findings may not be generalizable to other places and populations (i.e., lower SES groups). Indeed, evidence suggests that local infrastructure may be more important to the behavior of women living in lower socio-economic environments (Lee, Cubbin, & Winkleby, 2007).
Finally, the response rate was somewhat low at 33.4%. Potential participants were undergoing a major change, and study participation may have been a low priority (Petticrew et al., 2005). The study criteria may have also affected the response rate, as participants were required to move into their new home by a specified time (i.e., December 2005). However, once recruited, considerable effort was made to keep participants in the study (Giles-Corti et al., 2008).
Conclusion
Although there is a considerable body of evidence confirming a relationship between neighborhood walkability and transport walking, our results provide some evidence that the attributes of a walkable neighborhood may also relate to women’s sitting time. In this study of residents in new suburban neighborhoods, both the objective presence of community infrastructure and self-reported community participation were negatively associated with women’s sitting time. The findings provide some preliminary evidence to suggest that policies that facilitate the development of social and community infrastructure in new suburbs on the urban fringe may have role in limiting sitting time.
Footnotes
Acknowledgements
The authors acknowledge Nicholas Middleton (supported by an NHMRC [National Health and Medical Research Council] Capacity Building Grant: 458668), Bridget Beesley, and Sharyn Hickey for generating the Geographic Information Systems (GIS) measures used in this study.
Authors’ Note
The Western Australian Land Information Authority (©2003), Western Australian Department of Planning and Sensis Pty. Ltd. provided the spatial data for the objective built environment measures.
Declaration of Conflicting Interests
The author(s) declared no potential conflicts of interest with respect to the research, authorship, and/or publication of this article.
Funding
The author(s) disclosed receipt of the following financial support for the research, authorship, and/or publication of this article: This research was funded by a Western Australian Health Promotion Foundation (Healthway) (11828) and an Australian Research Council (ARC) Linkage Grant (LP0455453). The first author is supported by a Healthway Health Promotion Research Fellowship (21363), the third author by an NHMRC (National Health and Medical Research Council)/National Heart Foundation Early Career Fellowship (1036350), and the last author by an NHMRC Principal Research Fellow Award (1004900).