
Abstract
This research was conducted in the southeastern United States, one of the most rapidly developing regions in the country. The study included two sets of predictor variables: environmental experiences and perceptions (i.e., observation of pollution and assessment of pollution’s impact) and residential factors (i.e., rural vs. urban residence and upstream vs. downstream watershed location); sociodemographic characteristics served as control variables. Sequential regression was performed on survey data of watershed residents to isolate the predictors of environmentalism. Observation of pollution and assessment of pollution’s impact on water quality were most important for explaining environmental concern, self-reported household-based behaviors, and self-reported likelihood of engaging in water quality improvement efforts. The sociodemographic variables were also significant predictors; the residential variables had limited influence on the dependent variables. These results indicate that stormwater educators should account for experiential factors and perceptions of pollution when designing strategies for encouraging environmentalism.
Keywords
In the past decade, concern about water quality and quantity has increased in the United States and abroad. The southeastern United States is of special interest as this region has experienced significant population growth and is predicted to become a “megalopolis” within the next 45 years (Terando et al., 2014). This region has also faced several water crises as South Carolinians have experienced extreme drought conditions and Georgia policy makers have made difficult decisions about water flow to neighboring states (Powers & Kovski, 2007).
In response to these challenges, environmental educators have sought to increase residents’ awareness of the relationship between their everyday behaviors, water quality and quantity, and stormwater management. Examining attitudinal and experiential differences within a watershed is a worthwhile avenue to investigate (Dietz & Abraham, 2012; Perez-Maqueo, Martinez, Vázquez, & Equihua, 2013) given that the watershed provides a context for stormwater management efforts and place-based education programs (Elfin & Sheaffer, 2006) and that a range of values and beliefs have been ascribed to watershed residents (McGinnis, Woolley, & Gamman, 1999). Such studies can inform education efforts by highlighting the steps needed for long-lasting behavior and attitude changes (Lewis & Popp, 2013; Mollinga, 2008). As Wagner et al. (2002) contend, “the effects of personal actions to reduce water use and water pollution . . . tend to be most visible at a watershed level” (p. 2).
This article reports the results of a survey of citizens who all live within the boundaries of a watershed in upstate South Carolina. The study extends previous research by including variables that are relevant for designing stormwater education efforts, but that have received somewhat limited attention from researchers. The analytical approach includes observation of pollution, appraisal of the threat of pollution impacts, and residential location, thus going beyond the traditional market-segmentation approach that focuses on sociodemographic characteristics. This model is used to predict concern about water quality, self-reported engagement in environmentally responsible behaviors (ERBs), and self-reported likelihood of becoming involved with water quality improvement efforts.
Stormwater Management and Environmental Education
Communities across the United States are increasingly challenged to improve water quality and increase the water supply for their residents. A range of approaches has characterized stormwater management and education strategies. Programs that focus on “point source” (or “end-of-pipe”) pollution, which is based in a readily identifiable source, rely on regulating industrial activities that cause pollution. However, some of the more vexing environmental challenges stem from nonpoint pollution, which is more directly connected to residents’ general everyday behaviors. Although the exact source of nonpoint pollution is diffuse and often difficult to pinpoint, common causes include the overuse of fertilizers and pesticides, sediment from poorly managed construction areas, runoff from paved areas, natural and human-caused erosion, and oil and grease runoff from transportation and other sources. Unlike point source pollution, sources of nonpoint pollution are ultimately “anonymous, ubiquitous, with no single culprit to blame” (Elfin & Sheaffer, 2006, p. 26); indeed, individuals exacerbate “the problem without even realizing it” (U.S. Environmental Protection Agency [EPA], n.d.). Thus, tackling such pollution requires innovative solutions that account for the unique geophysical characteristics of watersheds and integrate a more nuanced understanding of human behaviors.
The U.S. EPA now requires many municipalities to educate residents about nonpoint pollution and the behavior of stormwater in watersheds. Focusing on behaviors encourages residents to extend their realm of environmental responsibility beyond their immediate neighborhood to their watershed (Syme, Nancarrow, & Jorgensen, 2002). However, researchers debate the usefulness of many stormwater education programs and call for more targeted approaches (Ryan & Brown, 2000).
Conceptual Model for Predicting Environmentalism at the Watershed Level
Individuals’ views on the environment depend “partly on who they are” (Hamilton, Colocousis, & Duncan, 2010, p. 327). Indeed, the vast literature on the relationship between sociodemographic characteristics and environmentalism has informed stormwater education efforts (Ryan & Brown, 2000). While there is a wide range of exceptions, the dominant findings are that females, Whites, and younger individuals display higher levels of environmentalism.
While an important body of research, the focus on sociodemographics neglects contextual explanations of environmentalism such as those based on personal experiences, the physical characteristics of place, and residential location in a watershed (Hamilton, Harter, Safford, & Stevens, 2014). This approach allows for more comprehensive educational strategies that tap into the socioecological components of human behavior (Stanger, 2011) and extend beyond simply providing more knowledge about environmental challenges. Instead, the focus shifts to “questions of where high levels of environmental concern are likely to occur” (Stough-Hunter, Lekies, & Donnermeyer, 2014, p. 1308; emphasis added). The current study considers two contextual factors that influence the formation of environmentalism and are important for developing innovative educational strategies: personal experiences and observations and location within the watershed. The study recognizes that citizens’ everyday experiences and observations can serve as foundational “texts” for nurturing environmentalism (Hensley, 2014).
Experiential Variables
Observation of pollution
Stough-Hunter et al. (2014) call for greater attention to the relationship between environmentalism and personal experiences of the environment; their study of two rural watersheds revealed that perceptions of local water quality predict environmental concern. Previous research supports this point that environmentalism is shaped by one’s perception of environmental degradation, as well as visual observation of and exposure to pollution (Berenguer, Corraliza, & Martín, 2005; Hu & Morton, 2011). This proposition has been applied to a variety of contexts, including the assessment of air pollution and environmental risk (Irwin, Simmons, & Walker, 1999; Molatt, Phillimore, Bhopal, & Foy, 1995). Such personal sensory experiences are more influential than media publicity about pollution (Bickerstaff & Walker, 2001; Takács-Sánta, 2007). By including respondents’ observations of pollution and their assessments of environmental impacts, this study extends previous research that included awareness and appraisal of visible impacts to explain views on watershed health (Forsyth, Garcia, Zyzniewski, Story, & Kerr, 2004; Ryan & Brown, 2000).
Appraisal of the impact of pollution
Environmentalism may also be rooted in one’s assessment of the impact of pollution. Story and Forsyth’s (2008) research found that awareness and appraisal of threats to water quality predicted respondents’ proenvironmental behavior and their perception of responsibility for protecting the watershed. Individuals who consider their watershed to be degraded express the strongest proenvironmental intentions (Forsyth et al., 2004) and greater willingness to participate in water quality improvement efforts (Samuelson et al., 2005). Education efforts that begin with a “learner-centered approach” use these perceptions as a focus for change at the community level (Ryan & Brown, 2000).
Location in the Watershed
Given that water quality and quantity are related to changes in population and settlement patterns, a watershed approach to stormwater management has implications for the study of change within and across communities and regions (Krannich, 2008; O’Neill, 2005). More specifically, research has shown that place of residence influences various measures of environmentalism (Ambrosius & Gilderbloom, 2015). This article incorporates two objective measures of watershed location: whether residents live in an urban or rural area and whether they live in an upstream or downstream location in the watershed.
Urban–rural residence
Since watersheds often flow through urban and rural areas, there are many potential conflicts as residents compete for control over scarce resources (O’Neill, 2005). Researchers often categorize rural–urban residence as a sociodemographic characteristic. For this study, however, urban and rural qualities are associated with physical qualities of the watershed. For example, research has shown that more rural, remote portions of a watershed and position in the urban fringe affect water quality (Moore et al., 2014; Naiman & Turner, 2000).
Research on urban–rural differences in environmentalism is mixed. On one hand, studies indicate that urban residents have stronger proenvironmental values (Bjornlund, Parrack, & De Loë, 2013) and are more concerned than rural residents about environmental degradation, as indicated in seminal studies on the topic (Lowe & Pinhey, 1982; Tremblay & Dunlap, 1978) and more recent investigations (Borisova et al., 2013; Yu, 2014). Such differences could result from urban residents’ greater exposure to environmental deterioration (Salka, 2003), a finding supported by Tremblay and Dunlap’s (1978) classic study. As a result of this “differential exposure” to environmental degradation, rural residents are less likely to advocate for stronger environmental protection. Also, because rural residents often depend on the land for economic purposes, they may not value the land for its aesthetic or intrinsic qualities (Tremblay & Dunlap, 1978), a point reinforced by Robinson’s (2005) Extractive Resource Commodity Theory.
Other research suggests that rural residents have higher levels of general environmental concern (Berenguer et al., 2005; Chung & Poon, 2001), environmental knowledge (McDaniel & Alley, 2005), and environmental behaviors (Berenguer et al., 2005) than urban residents and may be more aware of environmental degradation resulting from urban sprawl, the decline of rural life and rural habitat, and the gentrification of rural areas.
Still other studies indicate few, if any, residential differences in en-vironmental concern (Berenguer et al., 2005; Huddart-Kennedy, Beckley, McFarlane, & Nadeau, 2009) and environmental behavior (Wolters, 2014). The “rural rebound” and outmigration of urban residents to rural areas over the past three decades has contributed to a reduction in rural–urban differences in environmentalism (Freudenburg, 2007; Sharp & Tucker, 2005). The current study investigates these explanations more fully in a watershed context.
Upstream versus downstream location in a watershed
Actual location in a particular watershed may influence various measures of environmentalism. Upstream activities affect the water quality and supply of downstream watershed areas. Water flow downstream is reduced through impervious surfaces upstream, stream channelization, and damming of upriver streams (Alexander, Boyer, Smith, Schwarz, & Moore, 2007; Nadeau & Rains, 2007). Because these factors ultimately influence the environmental experiences of residents throughout the watershed, the concept of “differential exposure” (Tremblay & Dunlap, 1978) may apply to one’s watershed location (and not just rural vs. urban residence). Depending on the geographical features of a particular watershed, upstream residents may more likely observe negative inputs into the water, while downstream residents observe the negative consequences of various water uses, as water flows down and through the watershed. Research suggests that watershed location has been a source of contention and that “failure to reconcile the competing interests of upstream and downstream users has generated considerable political conflict” in many regions of the world (Stapp, 2000, p. 185).
Research Questions
Based on the connection between behaviors and impacts on water quality, the essential research goal of the current study is to determine whether experiential and place-based variables add unique explanatory power to the study model, after controlling for the sociodemographic variables. This investigation advances previous research in its focus on experiential and place-related variables. These variables are especially pertinent to community-based stormwater education efforts that aim to nurture residents’ knowledge of water quality issues and awareness of the influence of individual behaviors on water quantity and quality. Based on the literature review, it is anticipated that (a) respondents’ observations of pollution and assessments of pollution’s impact have a positive influence on environmental concern, behaviors, and intentions; and (b) respondents’ residential location (upstream vs. downstream; rural vs. urban) is related to the measures of environmentalism included in this study.
The Study Setting
Encompassing 1,165 square miles, the Saluda–Reedy watershed begins in the rural headwaters of the rural Blue Ridge foothills and then flows downstream through the main Upstate cities, Greenville and Spartanburg, and drains downstream into rural Lake Greenwood. All six watershed counties have experienced significant population growth since 2000 as newcomers are attracted to the high quality of life, diversified economy, and natural resources.
However, this growth has led to numerous environmental challenges. Development in the region has increased five times faster than the population (Campbell, Allen, & Lu, 2007) and the region is losing an average of 14 acres of tree cover a day to development and other land uses (Eldridge, 2006). The resulting significant increase in impervious surfaces has negatively affected water quality (Allen, Patki, & Pasula, 2007) and drought conditions have affected water supply. A long history of heavy industrialization and then a large oil spill that occurred in 1996 compromised watershed health in the Reedy River. Extensive development has degraded the water quality of the Saluda River, a water body that, in 2009, was identified as one of the top 10 most endangered rivers in America (American Rivers, 2009).
In terms of residential differences in experiences, there have been several sources of conflict in the watershed. Upstream activities have been identified as the cause of pollution and algae blooms in Lake Greenwood, located in the southernmost portion of the watershed. Thus, downstream residents bear part of the burden of upstream development. Recently, a variety of stakeholders have become more motivated to protect local waterways, such as the Reedy River whose transformation has been the centerpiece of a revitalized downtown Greenville, the third largest city in the state. Several conservation groups have emerged to address environmental issues through watershed education. The study results can help to guide these efforts.
Data and Method
Data Source
Survey data were collected between May and July 2004 as part of the Saluda–Reedy Watershed Consortium’s (SRWC) broader efforts to provide scientific information about water issues to decision makers and the general public. Respondents were randomly selected from a list of numbers purchased from a national vendor of telephone samples. The sample was selected so that the number of random numbers for each zip code mirrored the proportion of the adult population in that zip code relative to the adult population of the watershed area as a whole. Standard statistical weighting procedures in SPSS were used to adjust for demographic differences between the sample and Census data for the watershed area (Table 1). The weighted numbers are reported and discussed in the remainder of the article.
Profile of Survey Respondents.
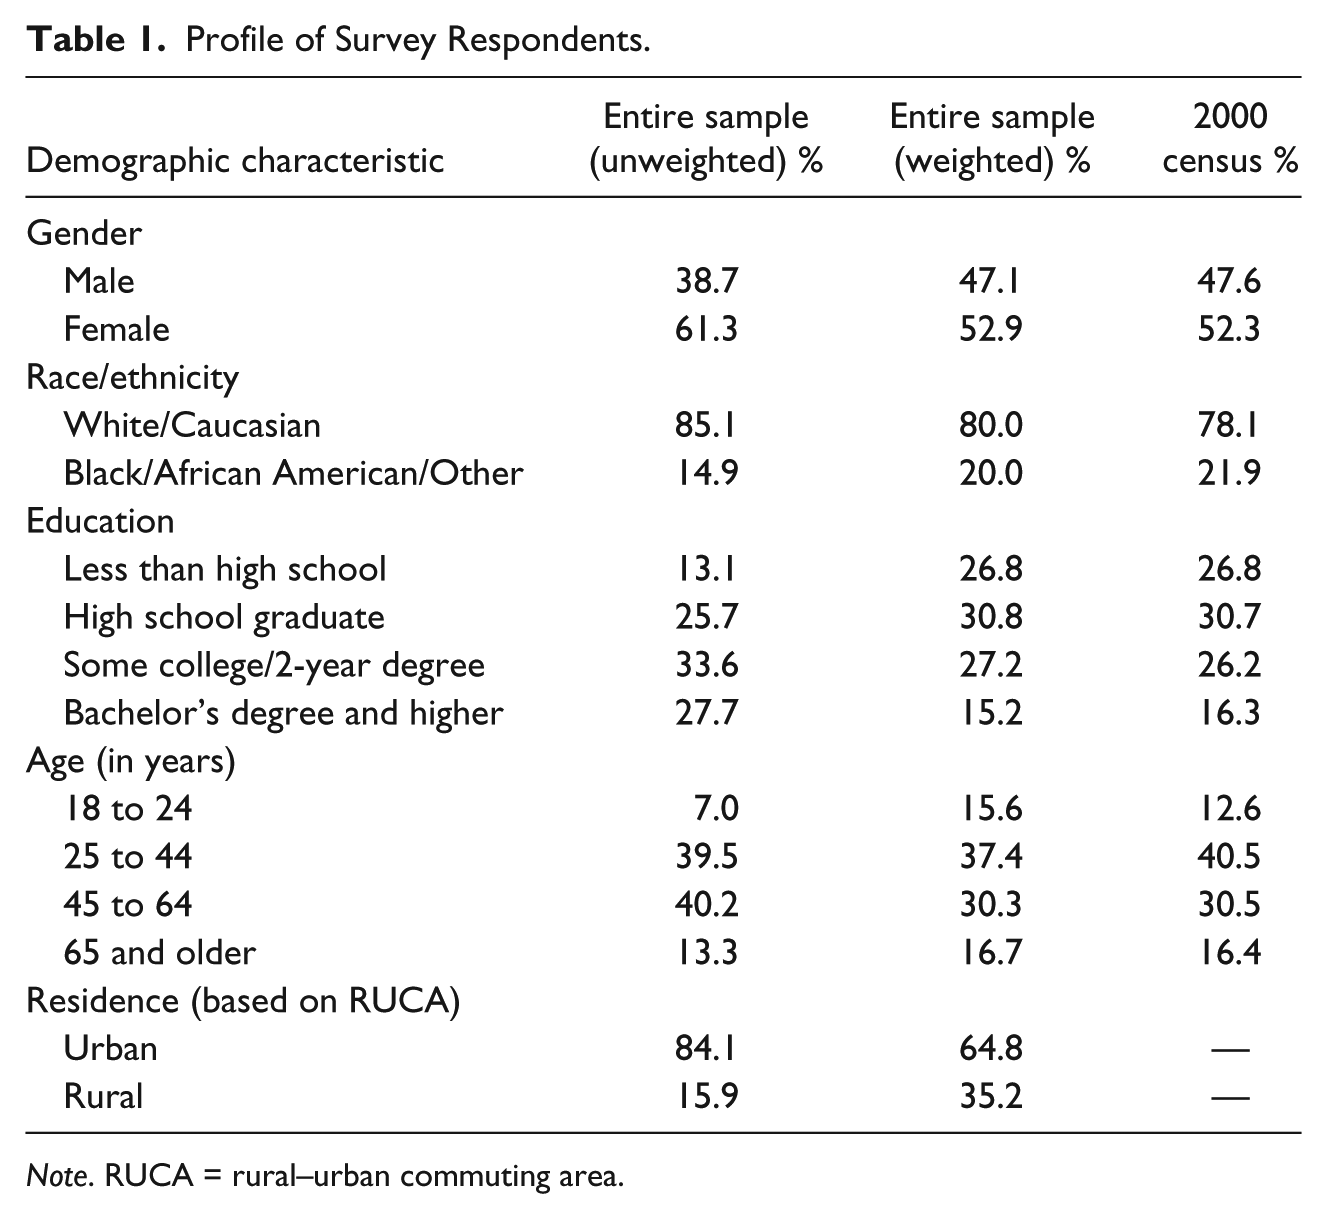
Note. RUCA = rural–urban commuting area.
A total of 855 watershed residents were surveyed, for a margin of error of plus or minus 3.4% with a 95% confidence level. Interviews lasted 15 min, on average. The response rate was 29%, typical for telephone surveys of this length (Keeter, Miller, Kohut, Groves, & Presser, 2000).
Dependent Variables
Unlike many prior studies on environmentalism, the survey items were related to water quality and water quantity issues. These more focused questions not only better served the SRWC’s needs to design more effective outreach efforts but also can advance understanding of water-related environmental concerns, which have become more urgent in recent years.
Concern about water quality
Respondents were asked, “I’d like to know how concerned you are with pollution and environmental quality in your local streams and waterways?” After recoding, responses ranged from 1 (not at all concerned) to 4 (very concerned). This more specific measure of environmental concern relates more closely to watershed issues and replicates Hu and Morton’s (2011) research that measured residents’ perception of the condition of their surface and groundwater.
Engagement in household-based ERBs
Respondents indicated (yes = 1 or no = 0) whether, in the previous 3 years, they had participated in each of six behaviors that influence water quality or quantity: stopped using/used less of a household product that the respondent felt was polluting local waterways, made an effort to reduce water usage, planted a tree, created a wildlife habitat, reduced/eliminated pesticide use, and reduced/eliminated fertilizer use. The resulting responses were combined into an “Engagement in ERBs” scale.
Likelihood of becoming involved in water quality improvement efforts
Respondents were asked about their willingness (on a 4-point scale) to become involved in efforts to improve water quality if they had more information about water quality issues in the area, were being directly affected in some way by water pollution, and could personally save money in the long run by taking action to improve water quality. Responses were summed into a “Likelihood of Involvement” scale.
Independent Variables
Experiential variables
In a separate section of the survey, nearly half of the respondents (48%) reported that “personal observation” had the biggest effect on their views of water pollution, providing further justification for including experiential variables in the model. “Observation of pollution” was comprised of five “yes/no” items, reflecting whether respondents had observed or had knowledge of five sources of pollution in their local streams and lakes: trash, foam or foul odors, mud/silt, algae problems, and toxic chemicals. Responses to each item were totaled to form an “Observation of Pollution” index.
Assessment of Impact is measured through respondents’ assessment of the impact of 13 different sources of pollution on water quality: growth in the Upstate; road construction; home construction; fertilizer/lawn chemicals; exhaust from buses, automobiles; fuel/oil leaks from trucks, buses, automobiles; wastewater treatment facilities; farm operations; water running off roofs/streets into storm drains; waste from boats/boating; golf courses, playing fields, and other high-maintenance green spaces; general littering; and construction of new businesses/industry. Each item was coded 1 through 4 (ranging from not at all to a great extent) to reflect the perceived degree of impact of each item on water quality of local streams or lakes. Responses were summed to create an “Assessment of Impact” scale.
Location in the watershed
For rural versus urban location, the 2000 Census “rural–urban commuting area” (RUCA) was used as a measure of rurality. This measure distinguishes urban, metropolitan areas by population size and nonmetro counties by degree of urbanization and commuting time, resulting in a nine-part classification scheme. Using respondent-provided zip codes, each zip code in the study area was assigned one of these nine rankings and the resulting data were then used as the continuous measures of rurality. The rankings for the watershed zip codes ranged from 1 (metropolitan area core: primary flow within an urbanized area) to 10.5 (rural areas: primary flow to an area outside an urban area or urban cluster; secondary flow 10% to 30% to a large urban core). For watershed location, each of the 32 zip code areas included in the survey was assigned a number, ranging from 1, for the northernmost zip code area, to 32, for the zip code located furthest downstream.
Sociodemographic variables
Sociodemographic variables included female (1, men = 0), White race (1, all others = 0), income of US$40,000 to US$79,000 (1, and a 2-dummy measure of income where $39,999 or less and $80,000 or more = 0), and age 25 to 44 (1, where age 18-24, age 45-64, and age 65 and older = 0). Additional sociodemographic variables that were identified in the literature as possible influences (e.g., education and length of residence) were included in the initial models but not in the final analysis as they did not add to the explanatory power of the models.
Analytical Method
Following the strategy used in key studies of environmentalism (Hungerford & Volk, 1990), sequential multiple regression was used to predict the dependent variables. The sociodemographic variables, which precede the other variables in time and take on a background role (Stern, 2000), were entered first to determine whether they predicted the dependent variables and then used as controls in the subsequent models. The second model included the residential variables (rural vs. urban residence and upstream vs. downstream location). The third model added the experiential variables of observation of pollution and appraisal of threats to water quality. These are considered the most proximal predictors given they are closer to respondents’ lived experiences. PASW (SPSS) Statistics 18.0 was used for all statistical analyses.
Results
Descriptive Results and Bivariate Analyses
As indicated in Table 2, the correlations indicate significant positive relationships between the main variables, ranging from .095 (for concern and self-reported ERBs) to .351 (for observation of pollution and self-reported ERBs). The Cronbach’s alphas for Engagement in ERBs, Likelihood of Involvement, Observation of Pollution, and Assessment of Impact were .63, .79, .67 and .90, respectively, indicating acceptable scale reliabilities and appropriate internal consistency among the scale items (Nunnally, 1978). Observation of Pollution and Engagement in ERBs scores are somewhat lower than the suggested level of .70. Multicollinearity was not a problem (variance inflation factors < 10; condition indices < .30; Tabachnick & Fidell, 2007).
Correlation Matrix of Major Research Variables.
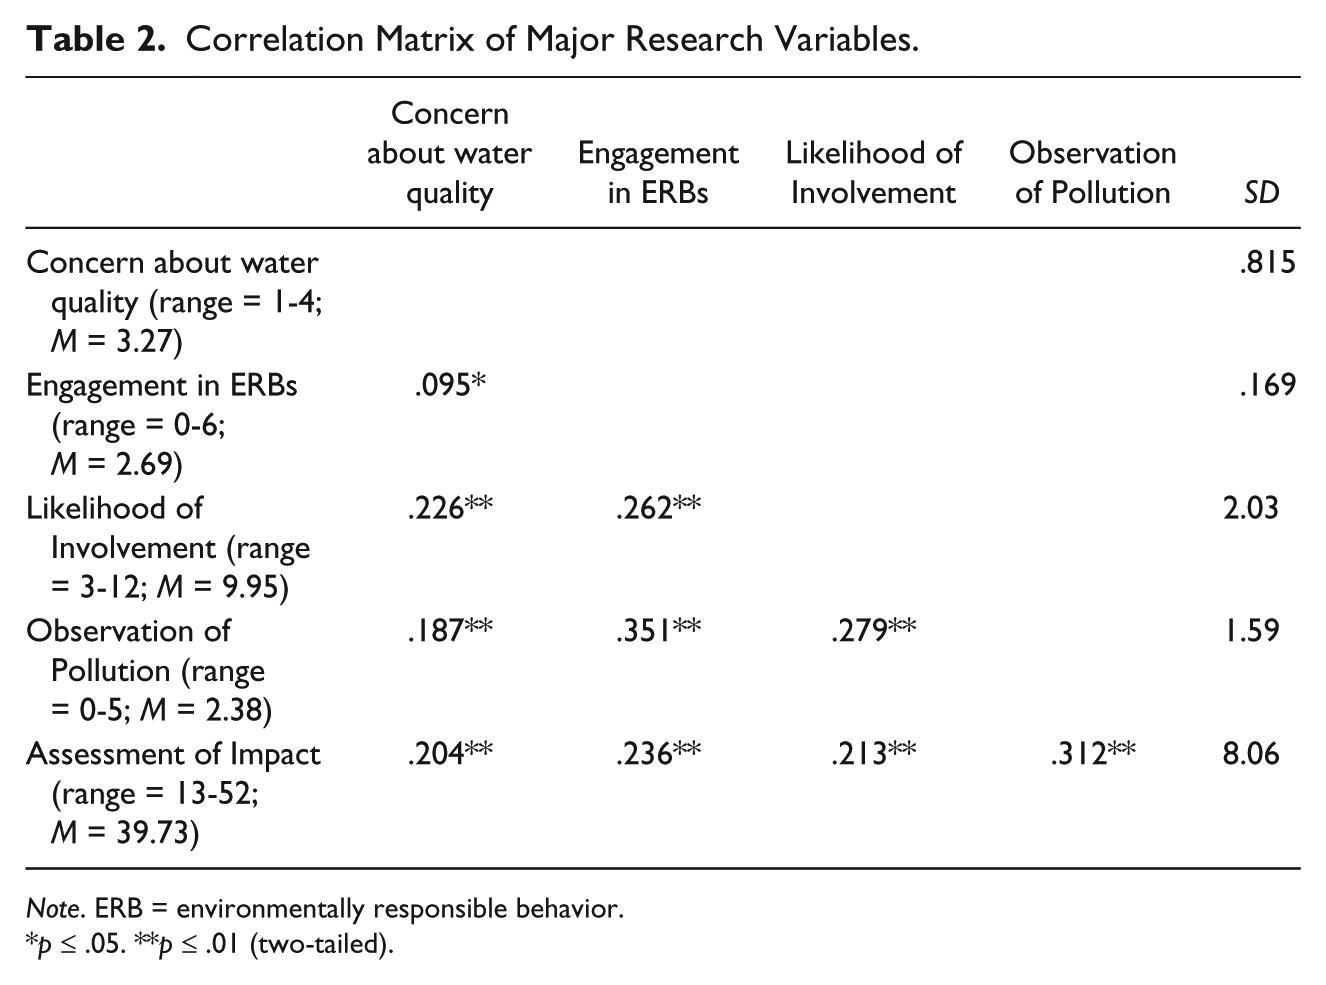
Note. ERB = environmentally responsible behavior.
p ≤ .05. **p ≤ .01 (two-tailed).
Regression Results
Concern about water quality
The sociodemographic characteristics (Model 1) explained 11.4% of the variance in environmental concern, F(7, 506) = 10.264; p ≤ .001, with gender (women expressed higher levels of concern than men) and age (18- to 24-year-olds expressing lower levels of concern than 25- to 44-year-olds) emerging as significant predictors (Table 3). Model 2 indicates that rural residents expressed higher levels of concern than urban residents, whereas there were no statistically significant differences between upstream and downstream residents; gender and age remained associated with concern, F(9, 506) = 8.770, p < .001. Adding the location variables to the model slightly increased the explanatory power (from .114 to .121; Fchange = 3.22, p < .05). In Model 3, observation of pollution significantly predicted concern for water quality, whereas assessment of impact did not, F(11, 506) = 9.755, p < .001; adding these experiential variables to the model increased the R2 from .121 to .160 (Fchange = 12.382, p < .001). Although the F-statistic indicates a significant joint contribution of the variables in predicting environmental concern, the final beta scores show that the strongest and most significant contributor to concern was age: 18- to 24-year-olds were less likely than 25- to 34-year-olds to be concerned about water quality (β = .312), followed by observation of pollution (β = .178) and rural residence (β = .081). Gender differences disappeared in the final model.
Concern About Water Quality Regressed on Sociodemographics, Locational Variables, and Experiential Variables (Standardized Beta Coefficients).
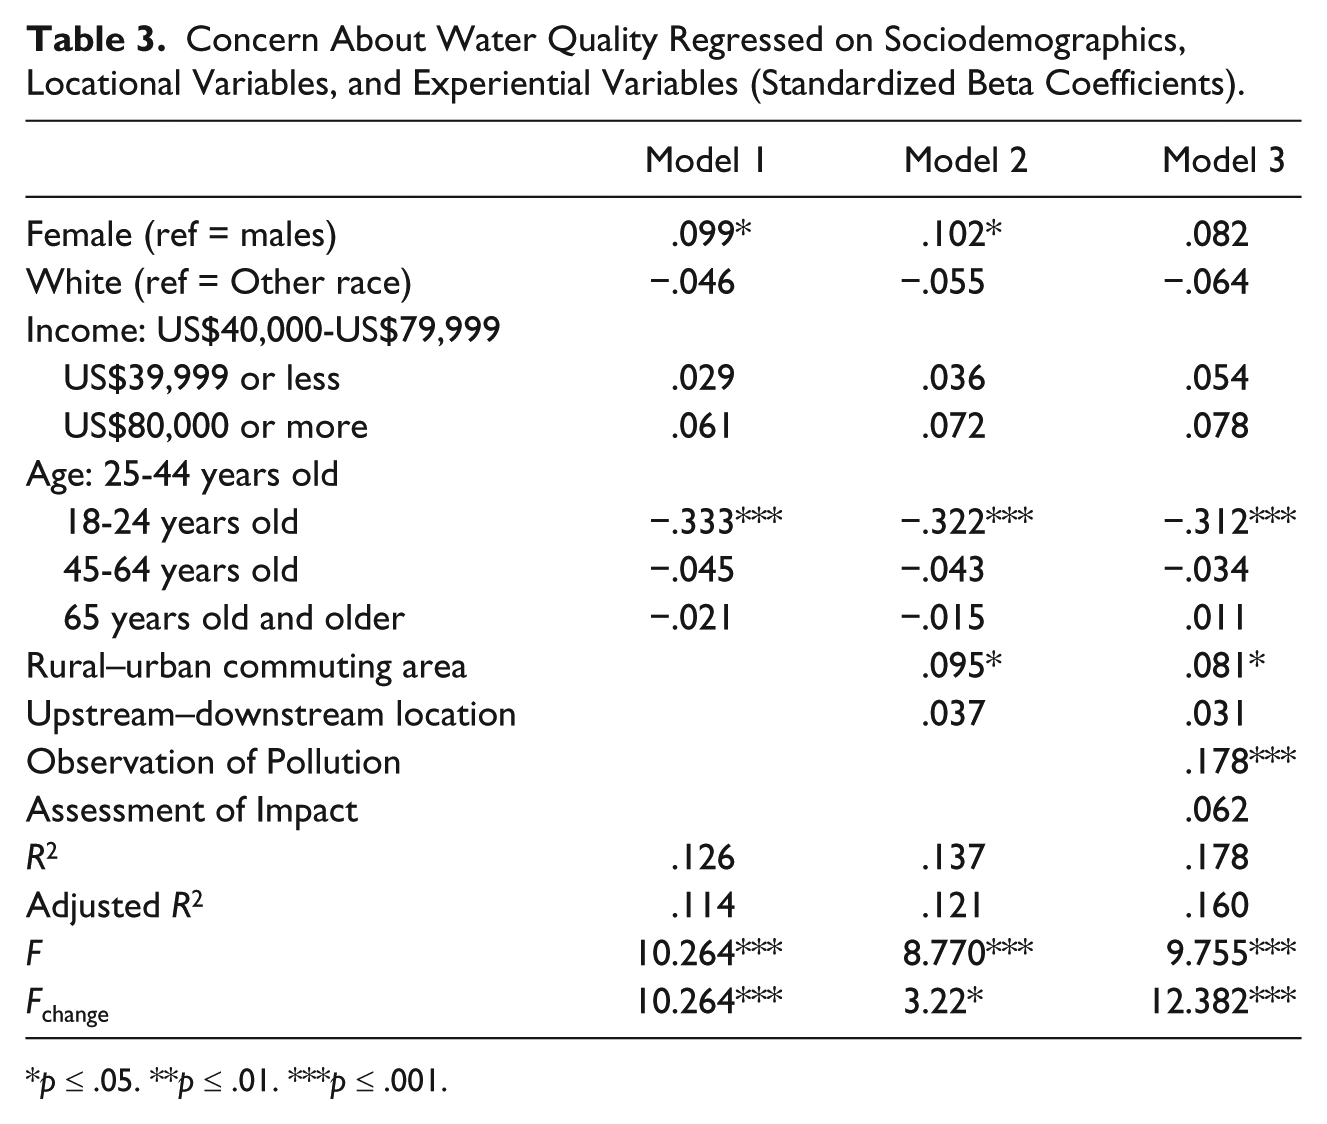
p ≤ .05. **p ≤ .01. ***p ≤ .001.
Engagement in ERBs
Race was the only significant sociodemographic predictor of ERBs, with Whites reporting higher levels of engagement in ERBs than minorities. However, the R2 value for Model 1 was low (.052); sociodemographic characteristics alone are not very useful for predicting ERBs, F(7, 408) = 4.203, p < .001 (Table 4). Adding the location variables (Model 2) increased the R2 just slightly, from .052 to .053, F(9, 408) = 3.527, p < .001. There were no residential differences in ERBs: upstream and downstream residents, and rural and urban residents, were equally likely to report engaging (or not engaging) in ERBs. However, this model does not make a statistically significant contribution to explaining engagement in ERBs, as indicated in the nonsignificant Fchange value. Adding the experiential variables (Model 3) increased the explanatory power of the model from .053 to .146, F(11, 408) = 7.338, p < .001, with these variables making a statistically significant contribution to explaining the overall variance (Fchange = 22.760, p < .001). In the final model, the strongest predictor of ERBs was assessment of impact (.230), followed by race (.203) and observation of pollution (.152).
Engagement in ERBs Regressed on Sociodemographics, Locational Variables, and Experiential Variables (Standardized Beta Coefficients).
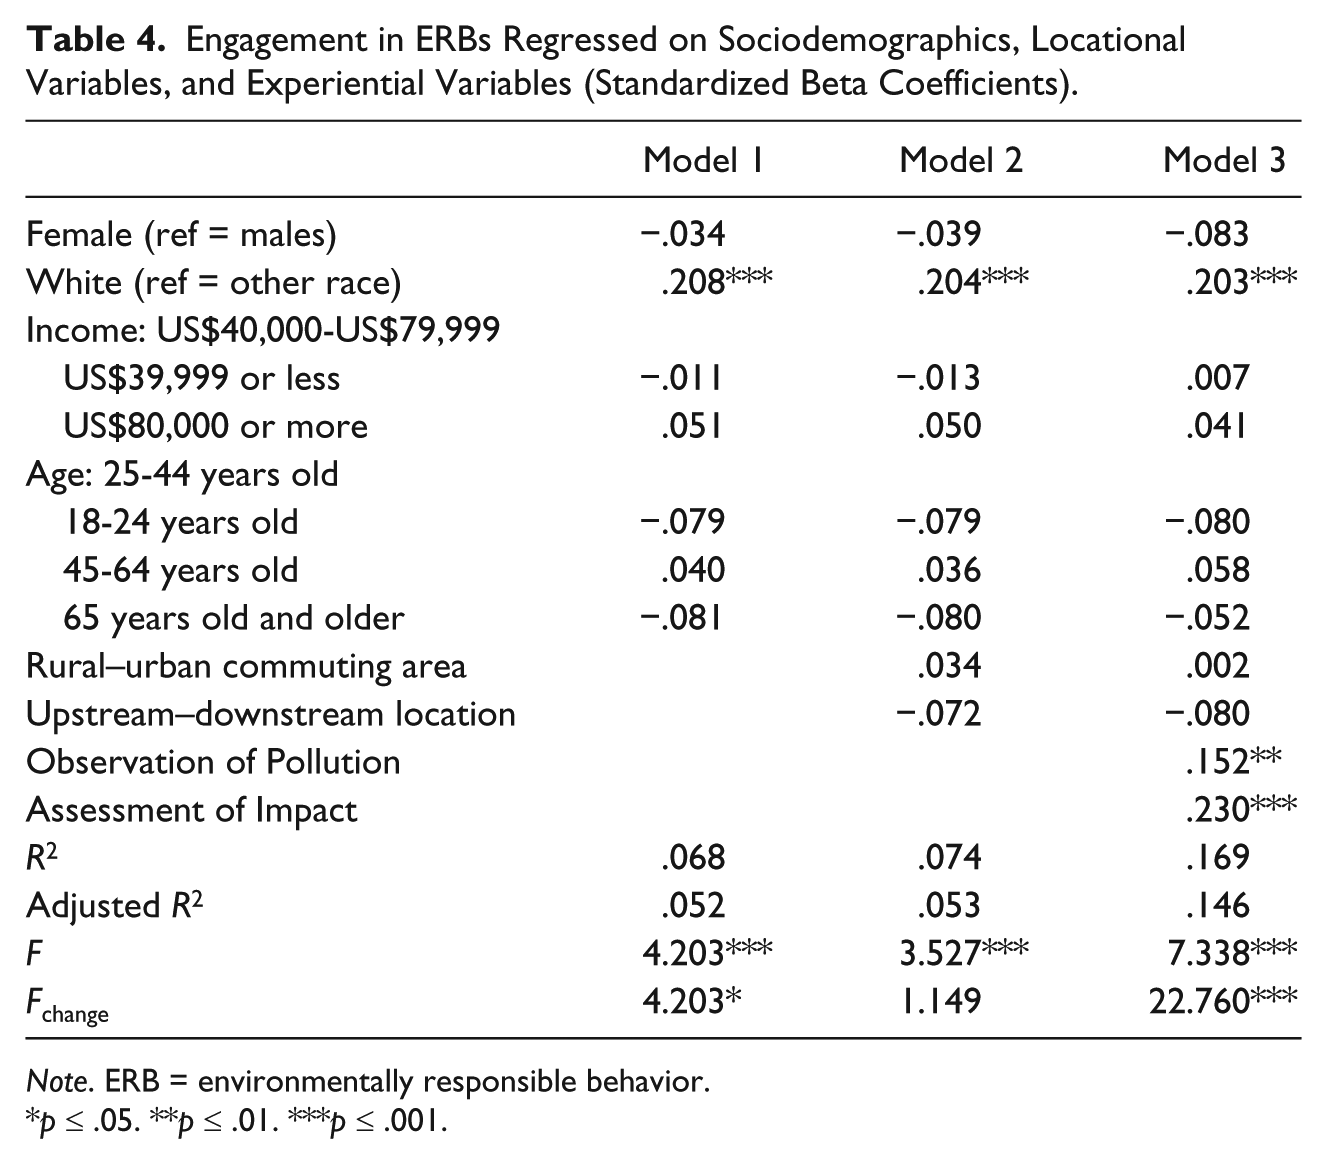
Note. ERB = environmentally responsible behavior.
p ≤ .05. **p ≤ .01. ***p ≤ .001.
Likelihood of becoming involved in water quality improvement efforts
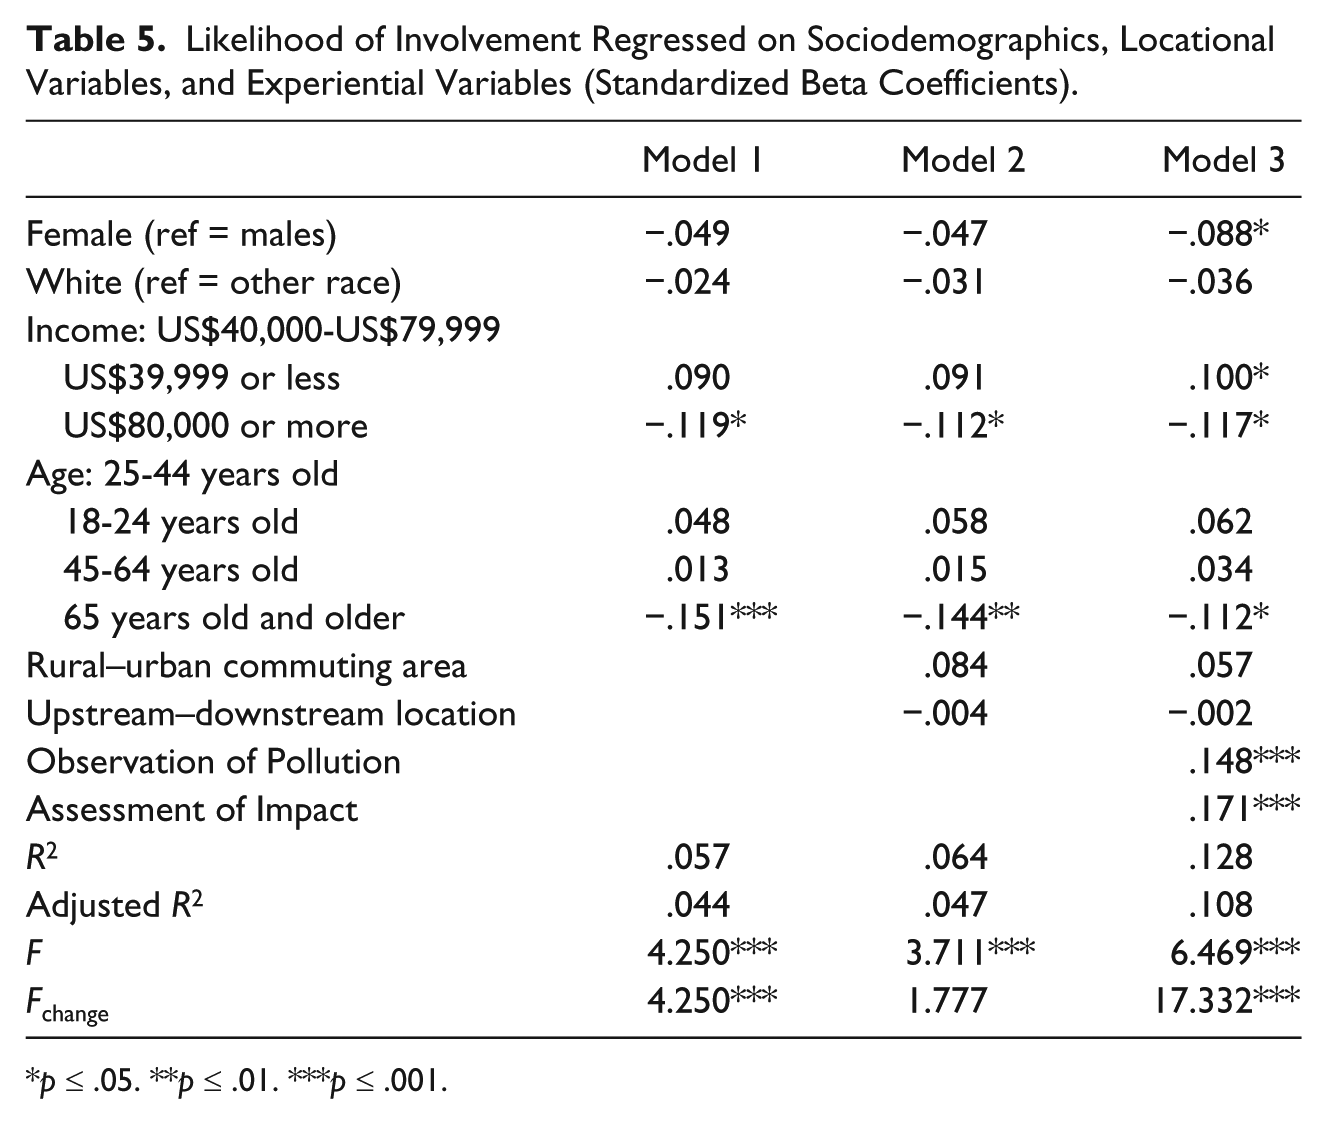
Age and income were the only significant sociodemographic characteristics in Model 1, which explained 4.4% of the variance in this dependent variable, F(7, 497) = 4.250, p < .001 (Table 5). Adding the location variables (Model 2) increased the explained variance only slightly, from 4.4% to 4.7%, F(9, 497) = 3.711, p < .001; neither residential variable was significant. This model did not make a statistically significant contribution to the overall explained variance (Fchange = .1777, p = .170). In Model 3, both experiential variables were statistically significant predictors of likelihood of getting involved, F(11, 497) = 6.469, p < .001; adding these variables increased the adjusted R2 from .047 to .108. In the final model, the influence of the experiential variables was strongest (observation of pollution, .148 and assessment of impact, .171). The influence of age and income persists, with older and highest income individuals expressing a lower likelihood of involvement in water quality improvement efforts; those making US$39,999 or less expressed a higher likelihood of involvement. Gender became significant in this final model as well, with women expressing a lower likelihood than men of engaging in activities to protect water quality. This model makes a statistically significant contribution to overall explained variance (Fchange = 17.332, p < .001).
Likelihood of Involvement Regressed on Sociodemographics, Locational Variables, and Experiential Variables (Standardized Beta Coefficients).
p ≤ .05. **p ≤ .01. ***p ≤ .001.
Discussion
As water quality and quantity problems become more pressing for communities around the globe, it is essential to develop a deeper understanding of the drivers of environmentalism. This study includes proximate and intermediate determinants that are pertinent for exploring environmentalism among watershed residents. Experiential variables (observation of pollution and assessment of impact) tap into residents’ lived experiences and their perceptions of pollution’s impacts on water quality; residential variables (rural vs. urban and upstream vs. downstream) capture the unique geophysical qualities of watersheds.
The relatively stronger and more important contribution of the experiential variables is a unique finding that extends previous research on environmentalism (Bickerstaff & Walker, 2001). Individuals who observed more sources of pollution were more likely to be concerned, to report engaging in ERBs, and indicate they would likely become involved in efforts to improve water quality. Assessment of impact was positively related to ERBs and likelihood of involvement. The bivariate analyses indicate these two measures are moderately correlated; further studies can reveal the direction of the relationship between these two variables.
The study results offer little support for residential differences in environmentalism. Residential differences were observed only for rural versus urban residence and only predicted concern: Rural residents expressed higher levels of concern than urban residents about water quality. This reinforces previous research (Berenguer et al., 2005; Chung & Poon, 2001) and makes sense in the Upstate region as residents in more rural areas of the watershed may be feeling the loss of open space in more poignant ways than urban residents. No other differences were observed for rural–urban residents or upstream–downstream residence.
To some extent, this study supports previous research on sociodemographic explanations for environmentalism. The final models for each dependent variable indicate that women and men were equally concerned about water quality and equally likely to engage in ERBs. These findings are somewhat inconsistent with studies that show that women are more concerned about the environment (Zelezny, Chua, & Aldrich, 2000). Research on gender differences in ERBs suggests that women are more likely than men to engage in household-based ERBs (Tindall, Davies, & Mauboules, 2003). Although, it should be noted that some of the ERB measures included in this study are oriented more toward males (e.g., use of fertilizers and planting trees), thus leading to more equal gender means in ERBs. This is in contrast to most previous studies that generally include more female-oriented ERBs. The results show that men were somewhat more likely than women to indicate they would be willing to get involved in water quality improvement efforts. It may be that men are more able to participate in such improvement efforts, as suggested by the biographical availability hypothesis (Xiao & McCright, 2014).
Although there were no racial differences in concern and likelihood of involvement, Whites were more likely than minorities to indicate they engaged in ERBs, supporting previous research on race differences in environmental behaviors. There were no income differences in concern and engagement in ERBs. However, income influenced likelihood of involvement: Individuals making US$39,999 or less were more likely, and individuals making US$80,000 or more were less likely, than individuals in the middle income category (US$40,000 to US$79,000) to indicate they would likely become involved in water quality improvement efforts.
After controlling for all other variables, age was the strongest predictor of environmental concern, above and beyond the experiential and residential variables. The youngest (age 18-24) respondents were less concerned than 25- to 44-year-olds about water quality, contradicting prior research (Dietz, Stern, & Guagnano, 1998). Individuals 65 years and older were less likely than 25- to 44-year-olds to indicate they would likely become involved in water quality improvement efforts. Older individuals may focus more on private (e.g., personal finances or health) rather than public concerns (e.g., the state of the environment; Franzen & Meyer, 2010) or be facing physical limitations that lessen their propensity to engage in water quality improvement efforts.
Implications of the Study Results for Environmental and Stormwater Education
When considering the applied implications of these results, protection motivation theory (PMT) provides a foundation for interpreting the findings and a framework for developing environmental education programs. Originally developed by Rogers (1975) in the mid-1970s to explain fear appraisals and later applied to communication strategies (Rogers, 1983), PMT posits that individuals will act to protect themselves from threats based on perceived severity of a particular threat and perceived vulnerability to such threats. McKenzie-Mohr and Smith’s (2008) influential book on community-based environmental education discusses the value of using PMT principles (e.g., perceptions of threat and the use of fear) to frame water challenges and shape water education and management strategies. PMT has been used in research on water-related environmental challenges (Grothmann & Reusswig, 2006; Mankad, Greenhill, Tucker, & Tapsuwan, 2013) and motivations for adapting proactively to climate change (Kim, Jeong, & Hwang, 2012; Koerth, Vafeidis, Hinkel, & Sterr, 2013). Grothmann and Patt’s (2005) research found that PMT principles were stronger predictors of adaptation to river flooding than sociodemographic variables.
The current study focused on perceived severity of threats to water quality. In this and other contexts, PMT can be used to develop communication strategies for encouraging people to engage in proenvironmental behaviors. Applying this theory, I contend that various measures of environmentalism are shaped by the perception of risk, in this case as measured by observation of pollution and assessment of pollution’s impacts. That is, PMT posits that such perceptions then shape one’s propensity to engage in proenvironmental behaviors. According to Botetzagias and Malesios (2012), this social constructionist perspective means that individuals must perceive environmental conditions as “poor” or “threatening” to be motivated toward expressions of environmentalism; that is, they engage in a process of cognitive evaluation of different threats that impact their environment (Mankad, 2012). These cognitive perceptions could influence public acceptance of water management strategies, such as decentralized water management. In essence, then, Mankad (2012) posits that “negative emotions are more powerful determinants of behavioral intention than positive emotions” (p. 131). Franzen and Meyer’s (2010) study of cross-national trends in environmentalism reinforces these points; they found that residents’ negative perceptions of environmental quality had a positive influence on environmental concern, whereas national-level indicators of environmental quality did not.
The current study highlights the importance of making the connection between everyday behavior and environmental impacts more obvious, a goal of many stormwater education programs. Many efforts focus explicitly on educating residents about the differences between point and nonpoint sources of pollution. As Ryan and Brown (2000) describe in their discussion of the Chesapeake Bay educational program, “the more that the citizens recognize that ‘the enemy is us,’ the more that they are inclined to acknowledge their own part in the problem.” Providing information about the connection between behaviors and pollution can “pierce the veil of abstraction” that surrounds public understanding of stormwater and watersheds (Ryan & Brown, 2000, p. 11).
PMT also suggests that communication messages should more fully appeal to residents’ perceptions of degradation and that such efforts should also build on place attachment. Thus, place-based education, rooted in direct encounters with the environment and in cultivating a “hydrological” sense of place, is most successful if the unique characteristics of the watershed are considered, especially those most directly experienced by the residents themselves (Hensley, 2014). As postulated by PMT, improving residents’ ability to identify, observe, and assess the impact of various sources of pollution could help nurture environmentalism and raise residents’ awareness of their common “environmental fate.” That is, if observing pollution is an important precursor to becoming concerned about the environment, as this study suggests, then education efforts can focus on “training” individuals to become more attendant to signs of environmental degradation and ultimately increasing residents’ perceptions of the impact of pollution, as suggested by Cismaru, Cismaru, Ono, and Nelson (2011).
Many educational programs use similar strategies to inform residents about the behavioral causes of nonpoint pollution. This point is reinforced in Franzen and Meyer’s (2010) contention that individuals may need to learn how to assess the connection between their behaviors and nonobservable sources of pollution (e.g., CO2). Thus, education is necessary to establish a connection between environmental quality and environmental concern. Demystifying terms such as “nonpoint” pollution could have an empowering effect in the end, as individuals may feel like they have the knowledge to proceed, no matter where they live in the region or watershed: “personal responsibility, civic education, and mutual vigilance replace coercion from afar as the bases for community involvement” (Ryan & Brown, 2000, p. 11).
However, it is interesting to note that while observation of pollution predicted concern, both observation of pollution and assessment of impact were significant predictors of ERBs and likelihood of engagement. Thus, a perception of threat is necessary, in addition to observing pollution, to encourage individuals to go beyond mere concern about water quality and ultimately engage in ERBs and consider involvement in efforts to improve water quality. This point is reinforced in Forsyth et al.’s (2004) study and supports one of PMT’s main premises that educational efforts should inform residents both that water problems are serious and that the residents themselves are vulnerable to the effect of these water challenges (Blackstock, Ingram, Burton, Brown, & Slee, 2010). Applying PMT further, any educational effort must also provide action recommendations that the residents would be capable of performing. That is, if residents “are not given specific, easy-to-follow recommendations and the necessary knowledge on how to respond or what to do, a failure in behavioral change may result and the campaign may fail” (Nelson, Cismaru, Cismaru, & Ono, 2011, p. 167, citing Tanner, Hunt, & Eppright, 1991).
These results on age are important in light of the fact that the Upstate region is attractive to younger professionals seeking a high quality of life, such as available in Greenville. Education efforts should focus specifically on this age group as these newer residents seek to establish a sense of connection to their new community. This is especially relevant given that, in recent years, the Upstate has emphasized the distinctive quality of life associated with the region’s natural resources. Further research on the influence of age could determine whether differences are explained by an aging effect (e.g., how being a certain age shapes environmentalism, such as limiting one’s ability to engage in ERBs), life cycle influences (e.g., younger residents have not yet developed a strong sense of place attachment; they may be more concerned with achieving education or career goals), or a cohort effect (e.g., whether being a part of a particular generation influences expressions of environmentalism; Lynn, 2014; Torgler, Valiñas, & Macintyre, 2008).
Given the lack of residential differences in behavior and intentions, it may be more useful to promote collaborative approaches to managing natural resources, a point reinforced in previous research (Johnson, 2009). That is, in this particular watershed, rather than beginning with the tensions often associated with residential differences (urban vs. rural or upstream vs. downstream), environmental educators can initiate efforts rooted in residents’ shared experiences in the watershed, based on their personal observations and assessments of impacts and threats.
Limitations and Future Research
As the regression model did not include all possible predictors, future research is needed to test additional predictors such as political party or ideology (Mobley, Vagias, & DeWard, 2010), distance from water body (Brody, Highfield, & Alston, 2004), environmental knowledge, and recreational use of waterways (Lewis & Popp, 2013; McDuff, Appelson, Jacobson, & Israel, 2008). Given the self-reported nature of the dependent variables, respondents may have overreported their behaviors and likelihood of engagement; others may have elected not to participate, potentially resulting in nonresponse bias. Attitude–behavior research is also inherently challenging due to the inevitable feedback loops that exist. More complex analysis is needed to determine the direction of causality between attitudes and behaviors (Robinson, 2005).
The data were collected in 2004 in one southeastern region in the United States; replicating the study elsewhere with more recent data would be useful. Future studies should also investigate land use changes over time; perhaps upstream–downstream and rural–urban location is not as important as land use changes per se that cut across these locational variables. Future research should consider whether the expansion or contraction of agricultural land uses versus other land uses could influence the effect of locational variables on measures of environmentalism. Other place-related variables, including population growth rates, density, and employment patterns, influence levels of environmentalism and should be explored in future studies (Gosnell & Abrams, 2011; Hamilton et al., 2014; Henly, 2012).
Regarding locational measures, researchers need to reconceptualize their understanding of rurality in the context of rapid change and convergence of values across regions (Lichter & Brown, 2011). As a multidimensional concept, rurality is often not adequately captured through discrete measures (Chomitz, Buys, & Thomas, 2005) or solely quantitative or qualitative measures (Humphreys, 1998), especially when applied to studies on environmentalism (Huddart-Kennedy et al., 2009). Our more recent and comprehensive studies of environmentalism in South Carolina will allow us to select geographical areas of larger size that cover rural and urban areas and incorporate larger watersheds (Mobley, Witte, Pargas, & Green, 2009; Mobley, Witte, & Pargas, 2010).
Conclusion
In answer to the question posed in the title of this article “What matters when explaining environmentalism at the watershed level?” the study results indicate that “what you see” (i.e., observation of pollution), and “what you perceive” (i.e., assessment of pollution’s impact) are stronger predictors of environmentalism than “where you live” (i.e., rural vs. urban; upstream vs. downstream). In some cases, “who you are” (i.e., especially in terms of age) is important as well.
When considering the practical implications of the results, policy makers should especially account for experiential factors when designing strategies for encouraging environmentalism. As these variables are consistent predictors of environmentalism in this watershed, place-based education, rooted in personal experiences, provides an important starting point for encouraging environmentalism and citizen efforts to improve water quality (Louv, 2008). This reinforces the point that successful community education programs are locally relevant, future-oriented, action-oriented, and learner-centered (Ryan & Brown, 2000). That is, stormwater education should go beyond merely providing information or increasing knowledge about environmental principles. The suggestions follow from PMT that perceptions of severity of impact and threats to water quality should also be emphasized. Communication campaigns and educational programs should then be coupled with other educational components, including increasing self-efficacy for taking action related to water quality improvement efforts and sharing success stories about behavioral changes and residents’ positive experiences with community involvement efforts (Cismaru et al., 2011).
Footnotes
Acknowledgements
The author is grateful to Dr. James Witte, the Center for Social Science Research, George Mason University, for his support on this project.
Author’s Note
The findings, conclusions, and recommendations included in this article are those of the author and do not reflect the views of the Saluda–Reedy Watershed Consortium, the V. K. Rasmussen Foundation, or Fuji Photo Film, Inc.
Declaration of Conflicting Interests
The author(s) declared no potential conflicts of interest with respect to the research, authorship, and/or publication of this article.
Funding
The author(s) disclosed receipt of the following financial support for the research, authorship, and/or publication of this article: This research project, “Public Opinion on the Saluda–Reedy Watershed: Knowledge, Attitude and Behaviors,” was funded by the Saluda–Reedy Watershed Consortium, Catherine Mobley, and James Witte, coinvestigators, Clemson University. Funding for this project was received from V. K. Rasmussen Foundation and Fuji Photo Film, Inc.