
Abstract
In a sample of racially, ethnically, and socioeconomically diverse neighborhoods, using a quasi-experimental, prospective, longitudinal study design, we examined whether involvement of community groups in playground design selection, installation, and ongoing maintenance influences park utilization and moderate-to-vigorous physical activity (MVPA) post-playground renovations (N = 78 matched parks, 39 intervention/39control). Parks were matched on size, proximity, neighborhood socioeconomic status, and race/ethnicity. In summer/fall 2013 and 2014, baseline and 12-month follow-up data were collected on park utilization and physical activity, presence and condition of park features, incivilities, programming, and safety. Analyses were conducted using Poisson mixed-effects regression models. Significant increases between baseline and 12-month follow-up were found for park utilization and the number of people engaged in MVPA at the .05 significance level. Study results can provide communities with evidence to inform future policy decisions on how to increase park utilization in diverse neighborhoods.
Introduction
Numerous cross-sectional studies link supportive neighborhood environments, such as park and other recreational facility proximity (Cohen et al., 2007; Davison & Lawson, 2006; Giles-Corti & Donovan, 2002; Gómez, Johnson, Selva, & Sallis, 2004; Hoehner, Brennan Ramirez, Elliott, Handy, & Brownson, 2005; Norman et al., 2006; L. M. Powell, Chaloupka, Slater, Johnston, & O’Malley, 2007; K. E. Powell, Martin, & Chowdhury, 2003; Roemmich et al., 2006) and density (Cohen et al., 2006; Slater et al., 2010; West, Shores, & Mudd, 2012), to increased physical activity (PA) behavior. Yet, to justify large-scale environmental interventions, quasi-experimental designs are needed to establish stronger evidence on causal relationships between the environment and PA (Giles-Corti et al., 2015; R. F. Hunter et al., 2015; Pate et al., 2013). Specifically, the Institute of Medicine (IOM; 2012) recommends a range of policy initiatives, including changes to the built environment to target youth obesity. However, they noted in a recent report, a body of intervention research on policy and environmental approaches is largely absent from the literature (IOM, 2012). Other studies call for PA research that capitalizes on natural experiments and evaluates the effects of built environmental changes on youth PA (IOM, 2012; Physical Activity Guidelines for Americans Midcourse Report Subcommittee of the President’s Council on Fitness, Sports & Nutrition [PAG], 2012; Sallis, Floyd, Rodríguez, & Saelens, 2012). Evaluation of natural experiments can provide essential information on the effectiveness of policy and environmental strategies in increasing PA, particularly in low-resource communities and high-risk populations (Craig et al., 2012; C. M. Hunter, McKinnon, & Esposito, 2014). Natural experiments improve external validity or greater generalizability at the population level by revealing the impact of the policy in real-world settings and populations.
The Chicago Plays! Initiative
A needs assessment of all Chicago, Illinois parks, conducted in 2009 through 2011, identified 300 playgrounds in need of repair. Using Chicago Park District (CPD) earmarked capital improvement funds, the Chicago Plays! Initiative was created to renovate these 300 playgrounds from 2013 through 2017 and enhance safety and accessibility for all Chicago residents. The CPD and Friends of the Parks (FOTP), a local nonprofit organization, developed a competitive application process where community groups (e.g., park advisory councils, block, and church groups) (a) nominated their local playgrounds to be renovated in Year 1 of the program, (b) were included in the selection process of new playground equipment, (c) were involved in some of the playground installation, and (d) were asked to propose plans for ongoing playground maintenance. The process was meant to empower residents living in intervention areas (i.e., those receiving renovated playgrounds in Year 1) to improve their neighborhoods and health by increasing park utilization and PA for children and their families. FOTP received a total of 104 applications, or one third of all potential applications. Fifty parks were slated for the first stage (Year 1) renovation. This new initiative, using community engagement—defined as the involvement of community groups, to (a) identify how playground renovations will benefit their community and (b) collaborate with FOTP post renovation to successfully implement ongoing care and maintenance of playgrounds with the goal of enhancing playground renovations—provided a rare opportunity to evaluate a timely natural experiment. Once playgrounds were selected for renovation, community leaders gathered input to select the playground equipment from community members primarily through outlets such as social media and websites for voting or face-to-face voting at parks, churches, and community meetings. Community group maintenance plans involved scheduled park and community clean-up days, and working with CPD during clean-up days. In addition, some parks have unofficial clean-up volunteers.
While several studies of park and playground renovations have been completed, the results are mixed, with some showing positive effects on PA (Tester & Baker, 2009; Veitch, Ball, Crawford, Abbott, & Salmon, 2012) and some with no effect (Cohen et al., 2009; Dowda et al., 2007). Furthermore, recent research on the connection between the environment and PA in disadvantaged neighborhoods found that simply changing the built environment was insufficient (Franzini et al., 2010). It is unclear whether “if you build it, they will come” holds for these target populations in park playgrounds; complementary interventions may be needed. A few studies have examined the role of community engagement in the use of parks, generally (Broyles, Mowen, Theall, Gustat, & Rung, 2011; Daniels & Johnson, 2009; Derose, Marsh, Mariscal, Pina-Cortez, & Cohen, 2014), with promising results, but more research is needed. Thus, we capitalized on this series of park-based playground renovations in Chicago to examine whether this involvement of community groups in the renovation process of one specific park feature would result in a change in overall park utilization and park-based PA. Our primary study hypothesis was as follows: Playground renovations with community engagement activities (i.e., involvement in the playground design selection process, installation, and ongoing maintenance) will result in increased overall park-based utilization and PA compared with parks with un-renovated playgrounds not yet exposed to these community engagement activities and renovations.
Our study follows a socioecological conceptual framework, which asserts that behavior changes are affected by individual factors (e.g., age, gender, socioeconomic status [SES], race/ethnicity, genetics), as well as interactions with the larger social, cultural, and environmental contexts in which individuals live and play (e.g., family, school, community) (Davison & Birch, 2001; Sallis et al., 2006). Drawing from this framework, this study focused on specific environmental factors that influence the overall park environment and park usage. Our conceptual model is a modification of previously developed models (Alfonzo, 2005; Franzini et al., 2010) that present frameworks for neighborhood environmental factors that affect outdoor PA, and is based on the following assumptions: (a) adequate community engagement is needed to sustain health-promoting and disease-preventing programs/strategies, (b) community-level interventions are necessary to modify obesogenic environments to which children are exposed and successfully change individuals’ behavior, and (c) communities that submitted applications and were selected for Year 1 playground renovations have some degree of community capacity through their local coalition.
Method
Park Sample
Renovations involved replacing old playground equipment and ground surfacing. Parks were selected in May-June 2013 using specific criteria agreed upon by the CPD and FOTP, which took into consideration (a) the level of community support and playground maintenance plan, (b) the age and condition of the existing playground, and (c) equitable geographic distribution of new playgrounds throughout the city (north, central, south). The study sample included 39 intervention parks (renovation + community engagement), located in 33 of Chicago’s 77 neighborhoods, that were renovated between August and November 2013 and 39 matched control parks (not yet renovated). To ensure that control parks were as similar to intervention parks as possible, control parks were first limited to only the 250 parks identified as needing repair, but not selected for renovation in Year 1 of the initiative. Second, all potential control parks were mapped to select those that were similar in size and park features, and located in close proximity to intervention sites to ensure that intervention and control communities had similar underlying neighborhood characteristics to test the added effect of community engagement. Intervention and control parks were then matched by neighborhood median household income and race/ethnicity. Neighborhood median household income ranged from US$12,333 to US$121,541. Fifty-five percent, 23%, 16%, and 6% of study parks were located in predominantly African American, White, mixed race, and Latino neighborhoods, respectively. Thirty-one percent, 28%, and 41% of study parks were located on Chicago’s North, Central/West, and South sides, respectively.
Study Measures
Outcome measures
Park utilization and PA
Baseline data collection activities occurred between July and October 2013. Twelve-month follow-up occurred as closely as possible (within a 2-week time period) to their corresponding baseline dates between July and October 2014. After the study began, the decision was made to administer the initial application process across the remaining 250 Chicago Plays! park–based playgrounds to continue to prioritize renovation schedules going forward. During the first year, one quarter (n = 9) of the study control parks were exposed to the intervention, renovated by spring 2014, and were classified as intervention parks at 12-month follow-up.
The System for Observing Play and Recreation in Communities (SOPARC) (Cohen et al., 2011; McKenzie, Cohen, Sehgal, Williamson, & Golinelli, 2006), a valid and reliable systematic protocol for measurement of population-level PA and utilization, was used to collect the key outcome measures: (a) park utilization, (b) the number of people engaged in sedentary behavior; and (c) the number of people engaged in moderate-to-vigorous PA (MVPA).
Trained observers coded individual behavior into one of three activity levels (sedentary, walking, and vigorous intensity) during brief left to right scans of park zones or target areas. All data collectors participated in a rigorous 8-hr training session in the use of the SOPARC protocol. Training included review of the SOPARC forms and definitions, as well as visits to local parks for practice in both observations and target area mapping. This training was followed by a debriefing session to discuss methods, discrepancies, and questions. Field staff were paired with an experienced study team member during the first 2 weeks of data collection to become comfortable with the SOPARC methodology. Inter-observer reliability averaged 0.91 across baseline and 12-month follow-up data collectors.
During baseline observations, each park was mapped and divided into target areas according to SOPARC definitions (McKenzie et al., 2006). Target area maps were made by either the project manager or research assistant after walking the boundaries of parks to observe all potential target areas. A master list of target areas was created across all parks, and master target area numbers were assigned for data entry and analysis. During 12-month follow-up, the same maps and identified target areas were used by field staff to conduct SOPARC observations. New maps were created, as needed, to accommodate park renovations. Field staff observed 28 (414 in total) unique target areas (e.g., playgrounds, swings, sports fields and courts, etc.) across the 78 study parks. Parks ranged in size from having one to eight different target areas. Average park size in square acres is 3.86 (range 0.09-40.48).
For baseline data collection (July-October 2013), SOPARC observations were conducted on 1 weekday (Thursday or Friday) and 1 weekend day (Saturday) for each park. For 12-month follow-up (July-October 2014), observations were expanded to 2 weekdays (Thursday and Friday) and 1 weekend day (Saturday). For every day of observation, a total of four scans were conducted using a standard schedule across all parks. On weekdays, two scans of all target areas were completed between 11:00 a.m. and 3:00 p.m., and two scans of all target areas were completed between 3:00 p.m. and 7:00 p.m. On weekend days, two scans of all target areas were completed between 9:00 a.m. and 1:00 p.m., and two scans of all target areas were completed between 1:00 p.m. and 5:00 p.m. Length of data collection activities differed between baseline and 12-month follow-up due to the availability of study resources. For analyses, data were first summed across time and all observed park target areas and then averaged over days to represent the total mean number of people observed per day across parks at baseline and 12-month follow-up.
Independent contextual and control measures
The availability of park programs and events is associated with increased park use and higher levels of PA (Cohen et al., 2010). Conversely, incivilities, including presence of litter and graffiti (Miles, Panton, Jang, & Haymes, 2008; Tilt, 2010), and parents (Davison & Lawson, 2006; McCormack, Rock, Toohey, & Hignell, 2010; Sallis, McKenzie, Elder, Broyles, & Nader, 1997) and youth (Babey, Tan, Wolstein, & Diamant, 2015; Slater, Fitzgibbon, & Floyd, 2013) who perceive parks as unsafe are less likely to bring or allow their children to visit them. Thus, we account for these external factors—that is, changes in park programs, park-based safety, and maintenance—that could influence park utilization and PA.
Park program measures
Annual (12-month) park-specific program data were obtained pre- and post-playground renovation from the CPD. The CPD extracted the requested data from its tracking database across all study parks. Data by park included which study parks had programming, how many and what types of programs (e.g., sports, art classes, summer camp, etc.) were offered, and how many people were enrolled in the programs. A dichotomous measure representing whether formal park programs were offered at a park was constructed.
Park incivilities measures
Park environment observations were conducted at baseline and 12-month follow-up, in conjunction with SOPARC observations, to capture any changes over time. We used the Bridging the Gap Park Observation Form (BTG-POF; BTG, 2013) to capture information on the presence and condition of park-related maintenance (i.e., incivilities). Presence of incivilities was collected using a 4-point Likert-type scale (none, a little, some, and a lot). Data on the presence of incivilities were used to construct a park maintenance index that included garbage/litter, broken glass, graffiti/tagging, evidence of alcohol use, evidence of substance use, and sex paraphernalia. Higher values of the scale indicate more incivilities present. Increased presence of incivilities serves as a proxy measure for decreased park maintenance.
Neighborhood safety
Neighborhood safety was defined as the total number of all “street” crimes (violent crimes [i.e., murder, criminal sexual assault, aggravated assault, robbery]), property crimes (e.g., vandalism, theft), and “social disorder” crimes (i.e., prostitution, drug abuse, disorderly conduct) that occurred over a 12-month period within a 2-block (quarter-mile) radius around the parks. Because this measure was highly skewed, it was log transformed for analyses. Data were obtained from the Chicago Police Department’s (2013) CLEARMAP website. These data are available online within a week of the crime incident occurring and were collected to follow the schedule of all park, PA, and environmental observations. Neighborhood safety was measured by aggregating all crimes listed above that occurred in the quarter mile surrounding the park.
Weather
The actual daily outside temperature was recorded during the park audits. Where temperature data were missing on the audit forms (n = 10), archival data for daily temperature was used as an alternative source. Using these data, we constructed a daily temperature measure at baseline and 12-month follow-up.
Distance
The actual distance in miles between matched intervention and control parks was calculated to control for proximity between matched parks to account for possible confounding due to potential spillover effects between intervention and control parks.
Park size
We calculated how many square acres of land each park occupies.
Analysis
Parks were observed at baseline and 12-month follow-up after playground renovations occurred. There were two groups of parks: with (intervention) and without (control) renovation. Analyses were conducted in 2015 using STATA (version 12). Outcome measures included park utilization, sedentary behavior, and MVPA. Every renovated park was matched to a park without renovation on key park characteristics, as described above, to control for potential bias.
Because our primary outcome is park utilization, parks are the unit of analysis observed over time for this study. We used mixed-effects Poisson models to estimate differential effects of groups over time. Repeated measures and matched design resulted in a three-level data structure. Specifically, observations were nested in parks and parks were clustered in pairs due to matching. The model with two random intercepts (one for each level of clustering) accounted for repeated measures over time (pre- and post-intervention measurements) and for clustering. The indicator variable for group (intervention vs. control parks), time (pre-/post-intervention), and their interaction were treated as fixed effects in the model. As previously stated in the methods section, nine of the selected control parks received the Chicago Plays! intervention (i.e., playground renovations) between baseline and 12-month follow-up. We account for these changes in the analysis by re-assigning these nine parks as additional intervention parks post intervention. Thus, the group variable accounts for having 30 control and 48 intervention parks at 12-month follow-up. This change in group status was handled in analyses by means of the time-varying covariate. The time-varying covariate changes its value as a study progresses, and hence it closely mimics the situation that happened while this study was underway. To evaluate the impact of changing the status of these nine parks on the study results, we ran analyses omitting them from the estimation (results not shown) and found that this did not change the results presented in the article.
All models controlled for park size, daily outside temperature, distance between matched parks, neighborhood median household income, and neighborhood predominant race. Model 2 also accounted for contextual measures of park programming, safety, and maintenance.
We ran two different models for each of the three outcome variables. Model 1 included control variables only and Model 2 examined the effect of adding overall neighborhood crime count, presence of park programs, and park maintenance. We excluded two park observations that had a very large number of people present, above 300. Those observations occurred while there was a large event happening in the park and, hence, did not represent typical park utilization. This brings the final sample down to 154 observations used in the Model 1 analysis. Model 2 analyses used 153 observations due to missing incivilities data at the follow-up for one park.
Results
Summary statistics for the full sample, and by intervention and control groups at baseline and 12-month follow-up, are presented in Tables 1 and 2. A total of 14,586 people were observed across the 78 study parks with 5,612 observations occurring over 2 days during baseline and 8,974 observations occurring over 3 days during 12-month follow-up data collection. The average number of people observed visiting study parks, across time (includes all days and times of data collection) and target areas, was 32.81, with 14.68 engaging in MVPA and 18.03 observed in sedentary behavior. Fifty-five percent of study parks were located in predominantly Black neighborhoods with median household incomes of US$46,173. Forty-five percent of study parks offered some kind of park programs. Generally, observed parks were well maintained (incivilities scale = 1.75, range 0-9) with varying neighborhood crime (average annual crime count = 663, range 90-5,437).
Summary Statistics for the Total Sample Across the Study and Intervention and Control Parks at Baseline.
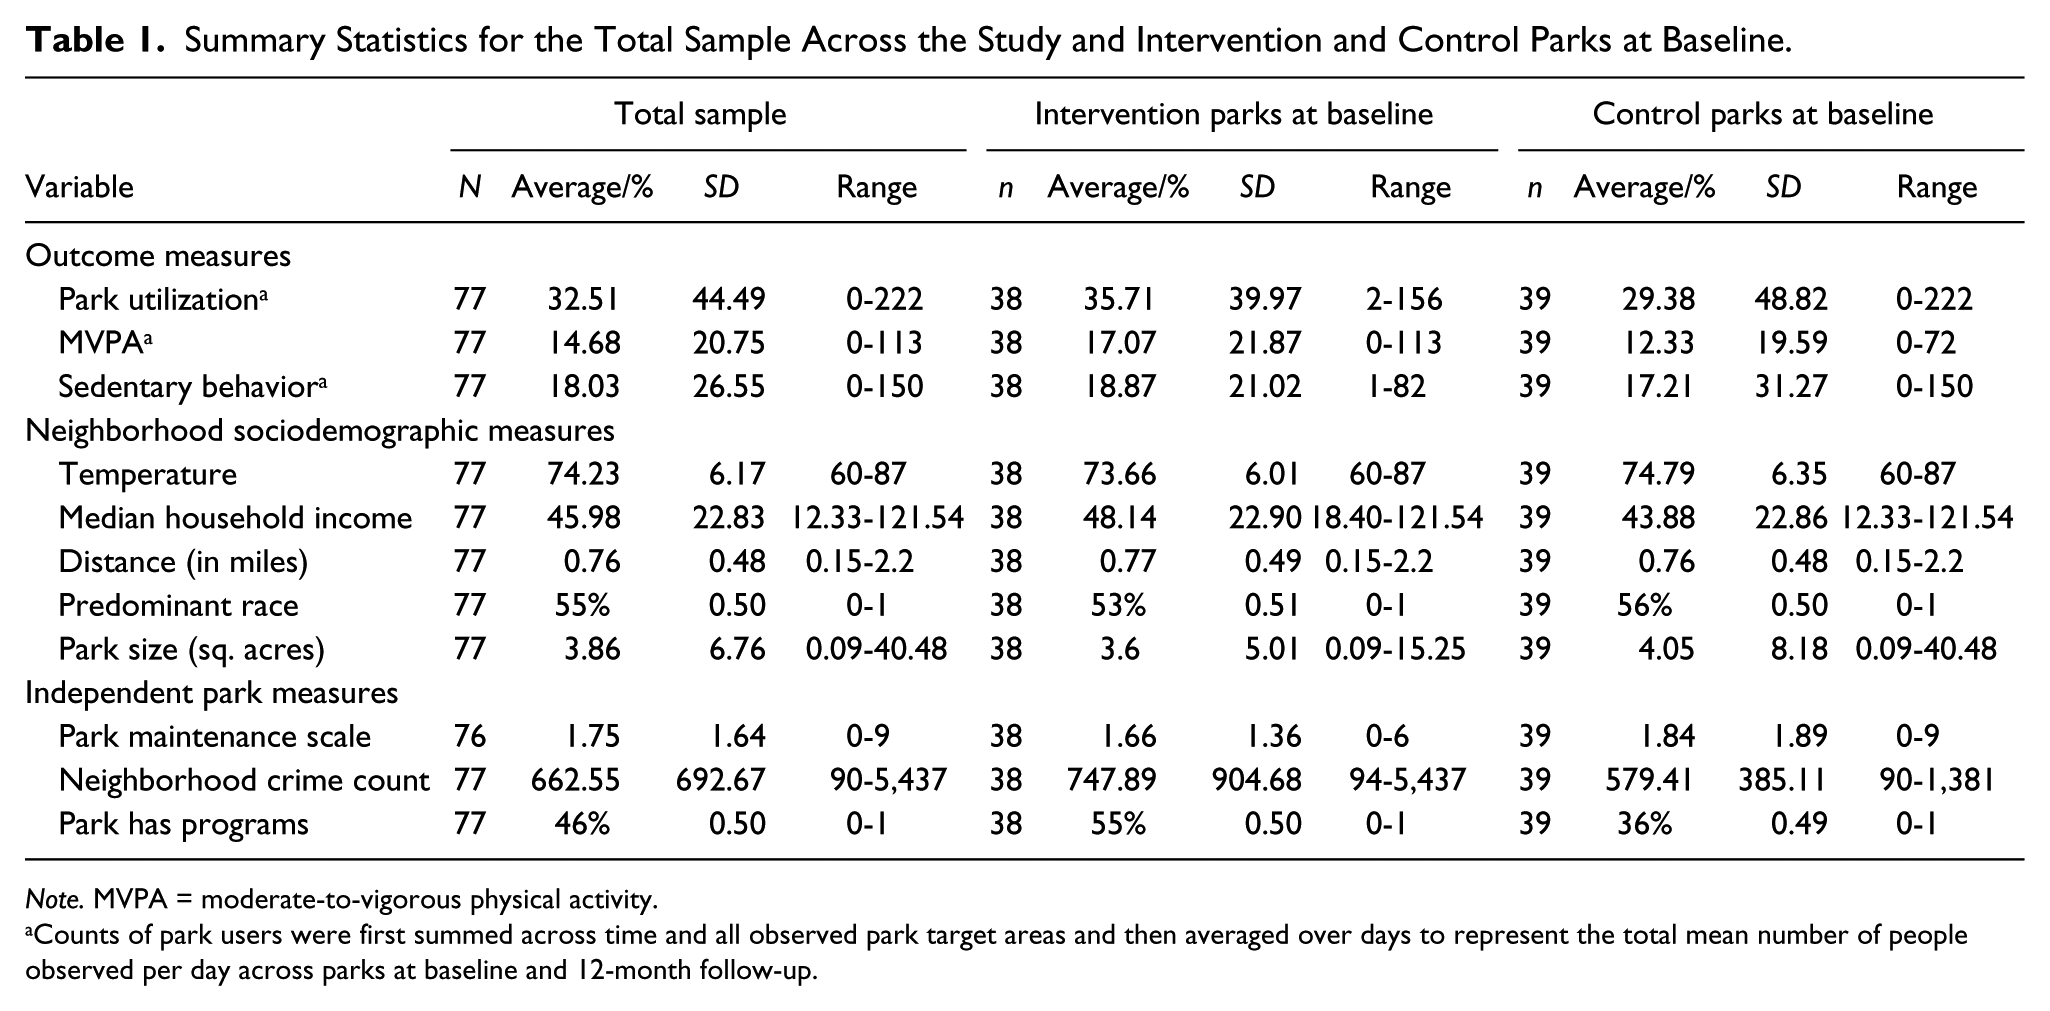
Note. MVPA = moderate-to-vigorous physical activity.
Counts of park users were first summed across time and all observed park target areas and then averaged over days to represent the total mean number of people observed per day across parks at baseline and 12-month follow-up.
Summary Statistics for Intervention and Control Parks at 12-Month Follow-Up.
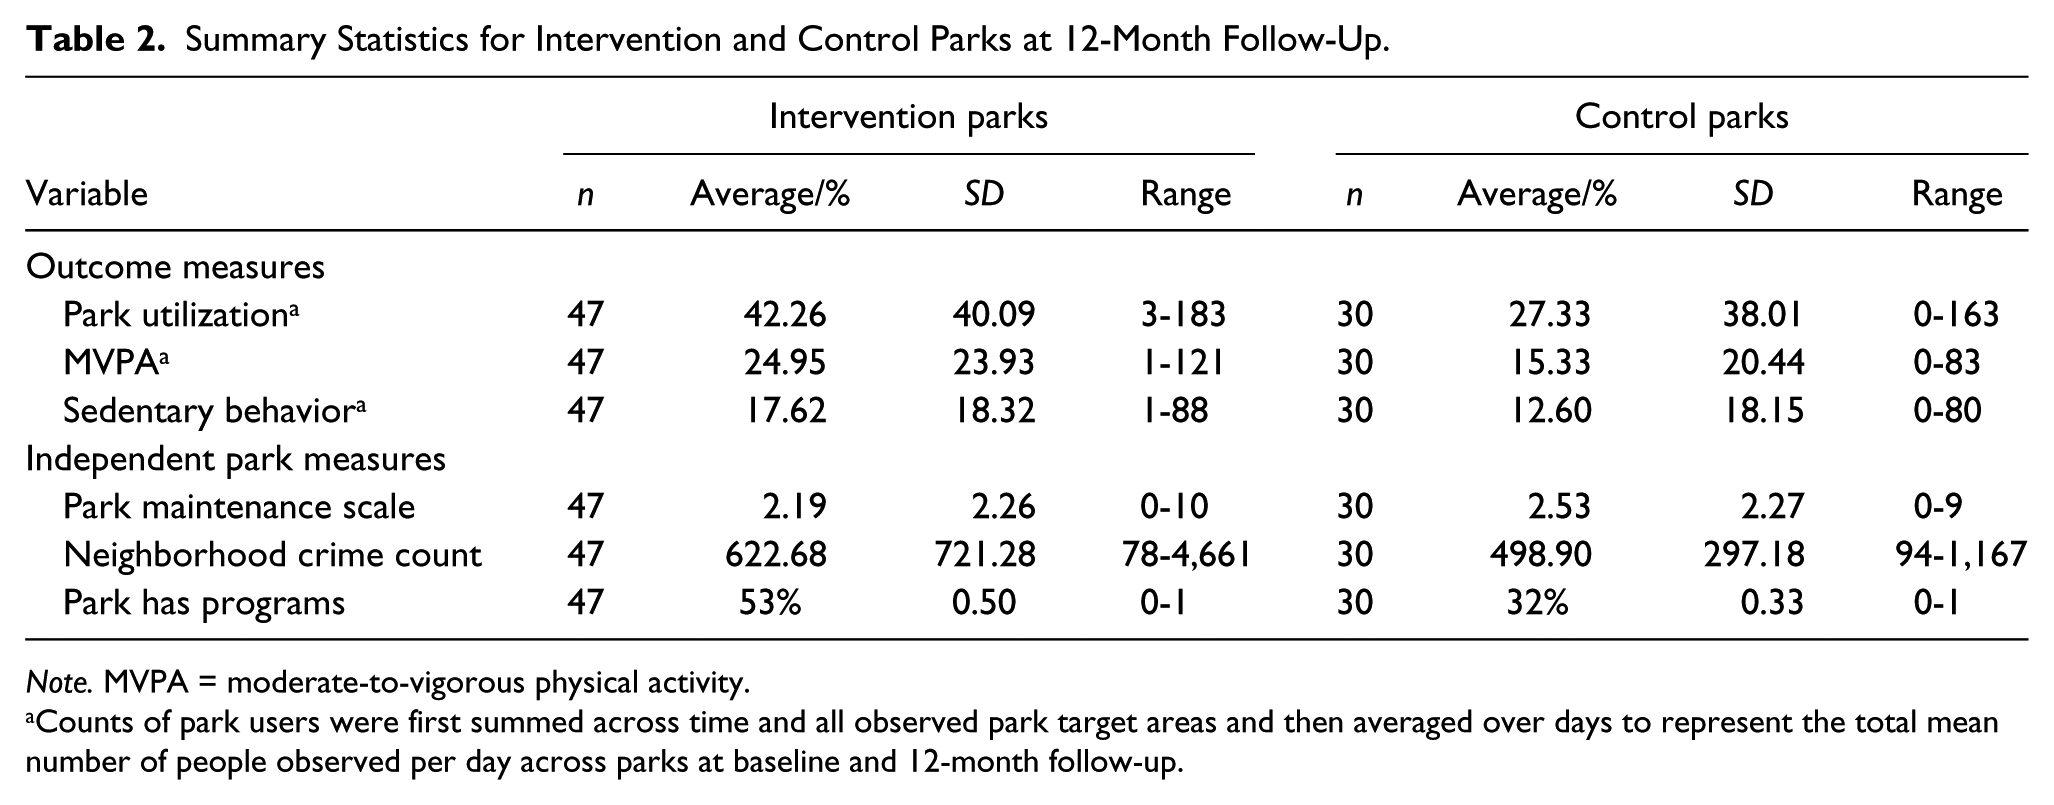
Note. MVPA = moderate-to-vigorous physical activity.
Counts of park users were first summed across time and all observed park target areas and then averaged over days to represent the total mean number of people observed per day across parks at baseline and 12-month follow-up.
Park Utilization and Park-Based PA
Results in Table 3 show an increase in park utilization over time in intervention compared with control parks in Models 1 (
Park Utilization.
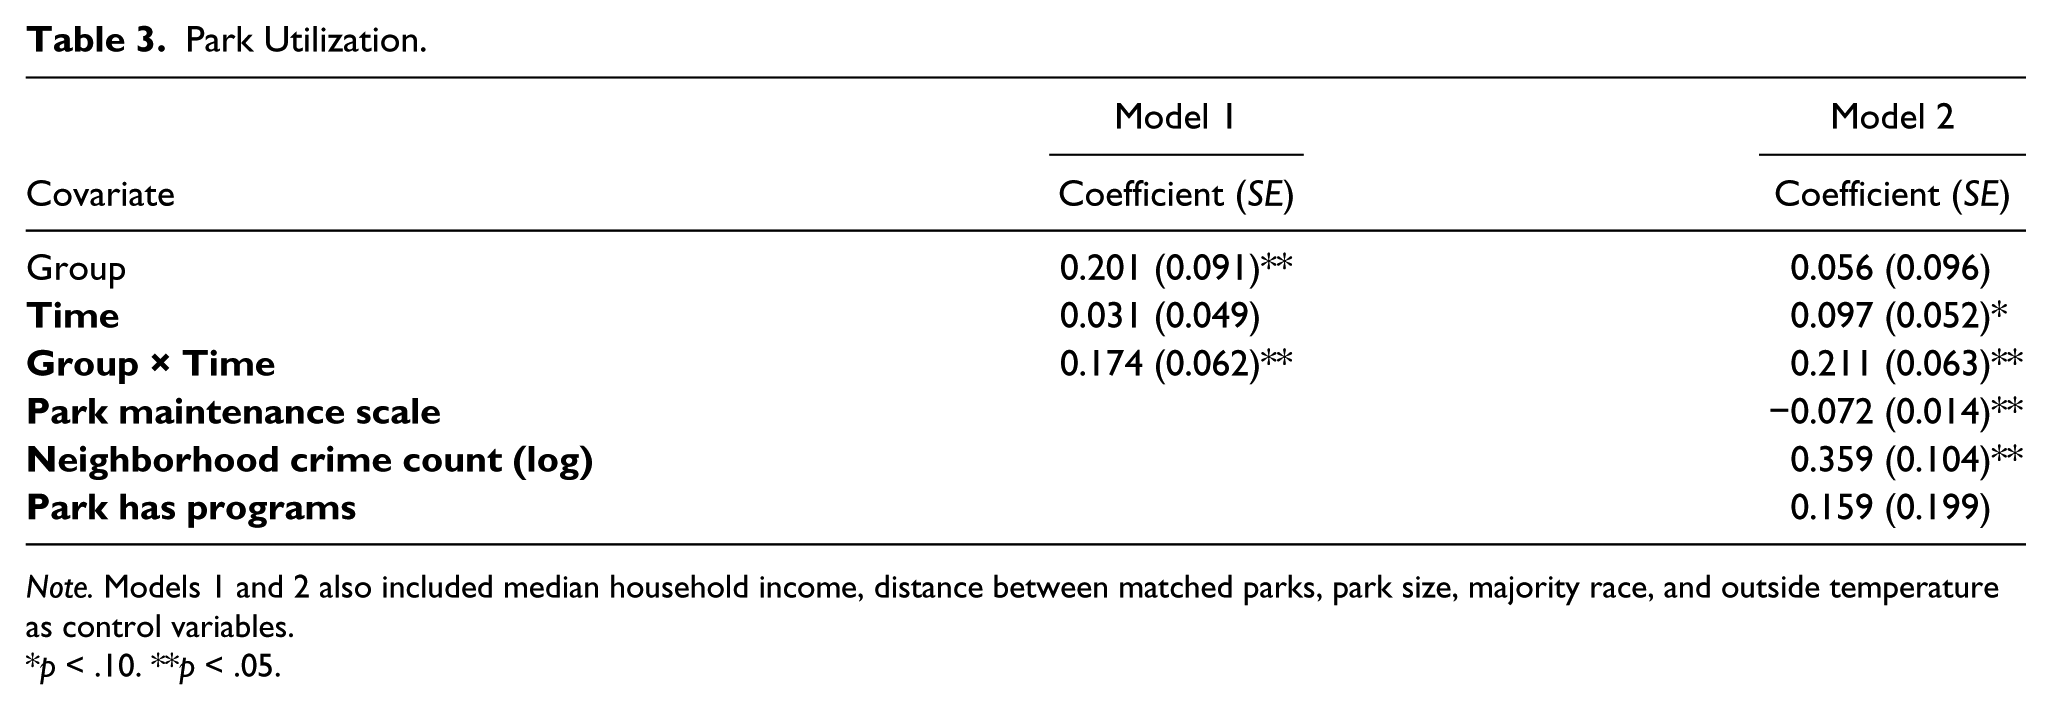
Note. Models 1 and 2 also included median household income, distance between matched parks, park size, majority race, and outside temperature as control variables.
p < .10. **p < .05.
Park-Based Physical Activity.
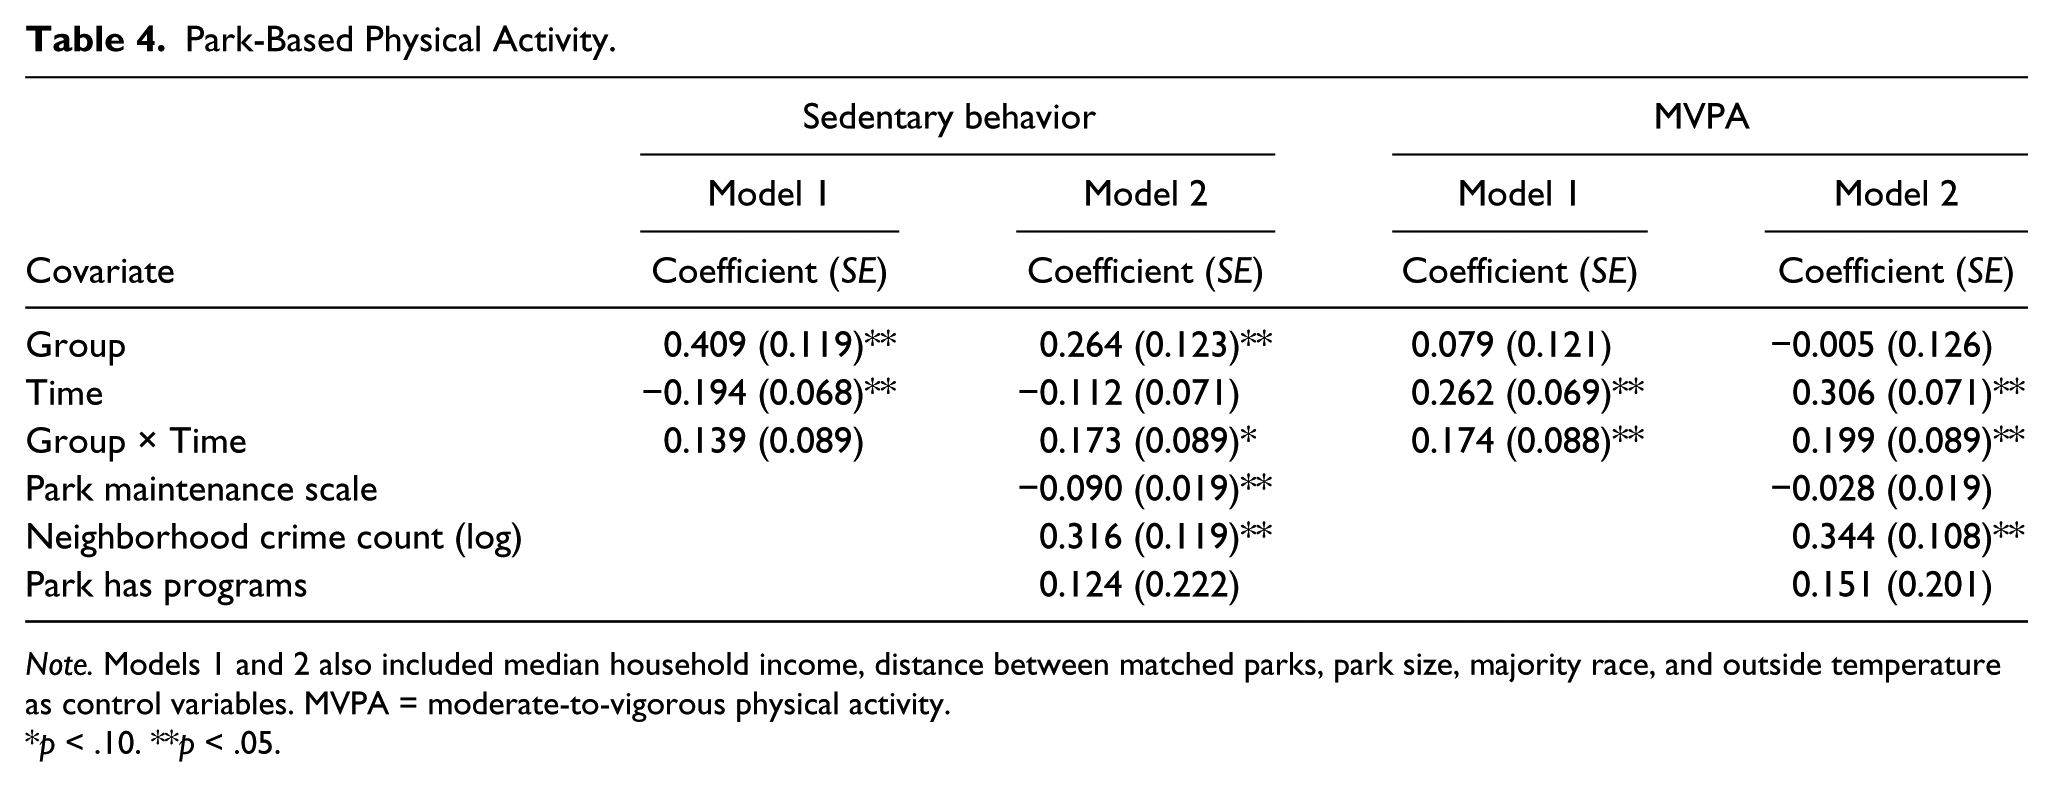
Note. Models 1 and 2 also included median household income, distance between matched parks, park size, majority race, and outside temperature as control variables. MVPA = moderate-to-vigorous physical activity.
p < .10. **p < .05.
Discussion
Study results supported our primary hypothesis. Consistent with previous research (Cohen et al., 2013; Tester & Baker, 2009; Veitch et al., 2012), we found differential increases between groups over time in the number of people visiting parks and engaging in MVPA in both Models. Results of Model 2 also showed that, as we accounted for contextual park factors, the interaction effect became larger and more statistically significant across all three outcome measures. These findings are important because neighborhood parks are usually freely accessible to all community members and parks can play an important role in youth PA, particularly in low-income, urban neighborhoods that have been shown to have access to a greater number of parks (Vaughan et al., 2013; Wen, Zhang, Harris, Holt, & Croft, 2013).
Results of adding the contextual measures to the models showed that, consistent with previous research (Miles et al., 2008; Tilt, 2010), greater presence of park incivilities was associated with decreased park utilization. In general, we observed increases in the presence of incivilities between baseline and 12-month follow-up in both intervention and control parks, but control park levels were slightly higher. Specific to intervention parks, it is possible that as park utilization increased, having more people in the parks resulted in the presence of more litter and other incivilities. However, this is contrary to what we expected to find because community groups developed maintenance plans. More research is needed to determine what barriers community groups may have experienced in implementing these plans, or whether the plans themselves were insufficient to keep up with park-based incivilities, and more formal intervention by the CPD is needed.
Neighborhood crime was also associated with increased park utilization, MVPA, and sedentary behavior in parks. This finding is contrary to previous research (Davison & Lawson, 2006; Gómez et al., 2004) showing that neighborhood violence negatively affects PA. In general, we observed decreases in total street crimes within a ¼ mile of parks across time, which suggest other external factors, possibly community policing or other crime-reducing activities may be occurring across the city, which may be influencing perceived safety. Alternatively, a more recent study (Lapham et al., 2015) suggests that changes to park facilities or park features have a greater impact on park use than perceived safety.
Study Strengths, Limitations, and Conclusion
This study builds on previous research of playground renovations (Brink et al., 2010; Colabianchi, Kinsella, Coulton, & Moore, 2009; Colabianchi, Maslow, & Swayampakala, 2011; Farley et al., 2007) in a number of ways: (a) a prospective longitudinal study design; (b) baseline data; (c) a large, matched sample of intervention and control parks; (d) racially/ethnically and socioeconomically diverse neighborhoods; and (e) objective measures of park programming, safety, and maintenance measures. We also recognize that the study has limitations, such as not having individual-level PA measures. However, we collected park-level utilization and MVPA, as well as objective measures of the park physical and social environments. The number of days of park observation may also be considered a limitation. However, per the study conducted by Cohen et al. (2011), it is possible to obtain accurate estimates of total park use, or park use summed across all target areas, which is what we are presenting in this study, with a 2- or 3-day schedule with four observation times per day. Finally, as community groups were involved in the design selection, renovation, and maintenance of the playground, we cannot fully disentangle effects of the community engagement and renovation components on park utilization and MVPA. It is likely that the increases in park utilization and MVPA that we observed were a result of the combined effect of new playground equipment and community involvement. Future research is needed that includes a systematic method for collecting and measuring community engagement and its effect on park utilization and PA. In conclusion, results of this study add to the limited literature that involving community members in playground renovations can have a positive effect on park utilization and MVPA and can be applied to future park and playground renovations in both Chicago and other urban cities.
Footnotes
Acknowledgements
We thank our community partners—Michael Lange, Maria Stone, Melanie Moore, Renna Thomas, and Catherine Denny—for their support and input regarding the evaluation of this natural experiment.
Authors’ Note
The content of this publication is solely the responsibility of the authors and does not necessarily represent the official views of the Centers for Disease Control and Prevention or the Department of Health and Human Services, or the University of Illinois.
Declaration of Conflicting Interests
The author(s) declared no potential conflicts of interest with respect to the research, authorship, and/or publication of this article.
Funding
The author(s) disclosed receipt of the following financial support for the research, authorship, and/or publication of this article: This work is conducted by the Illinois Prevention Research Center and was supported by grants from UIC’s Institute for Policy and Civic Engagement and the Cooperative Agreement No. U48-DP005010, under the Health Promotion and Disease Prevention Research Centers program, funded by the Centers for Disease Control and Prevention, and administered by the Institute for Health Research and Policy at the University of Illinois at Chicago.