
Abstract
The purpose of this analysis was to examine achievement gaps on fractions for very-low-performing students as a function of whether they receive inclusive fraction instruction or specialized fraction intervention and with the shift to Common Core State Standards (CCSS). In three randomized control trials conducted in 3 consecutive years, 203 students who scored at or below the 10th percentile in mathematics (mean standard score ~75) at the start of fourth grade were randomly assigned at the individual level to 12 weeks of inclusive fraction instruction or specialized fraction intervention. In Year 1, the fourth-grade mathematics curriculum was guided by initial state standards; in Years 2 and 3, the state was transitioning to CCSS. In each of the 3 years on each measure, results indicated significantly stronger learning and markedly smaller post-intervention achievement gaps for specialized fraction intervention than for inclusive fraction instruction. Yet, the size of achievement gaps grew over the years in both conditions, as CCSS increased the depth and challenge of the fraction curriculum and produced differentially stronger learning in not-at-risk classmates. Implications are discussed in terms of the provision of services for students with learning disabilities in the era of CCSS and the meaning of access to the general education curriculum.
For this article, we synthesized results from three randomized control trials (RCTs) examining the effects of two service delivery options on fraction learning. The first of these service delivery options was specialized fraction intervention; the second was inclusive fraction instruction. Participants were very-low-performing fourth graders with achievement and intelligence profiles similar to students with learning disabilities (LD): At the start of the school year, participants scored at or below the 10th percentile on mathematics (mean standard score ~75) but fell within the average range on intelligence (mean standard score ~90). We also indexed the posttest achievement gaps of these students relative to their not-at-risk classmates as a function of service delivery option and as their mathematics curriculum shifted toward the more rigorous Common Core State Standards (CCSS; National Governors Association Center for Best Practices, Council of Chief State School Officers, 2010). Our goal was to provide insight into the type of services that may be required to address the needs of very-low-performing students in an era of increasingly rigorous learning standards. By focusing on very-low-performing students with IQ within the average range, our goal was to draw conclusions relevant to students with LD.
In this introduction, we discuss the LD population’s achievement gaps in light of the reform context of the past 20 years. Then, we provide the rationale for our focus on fractions. At the start, we note that many schools interpret the mandate of access to the general education curriculum as requiring students with disabilities to receive their instruction in the inclusive setting, alongside their classmates without disabilities, with the goal of ensuring exposure to the same high standards. We return to the issue of access in the discussion of this article.
The LD Population’s Achievement Gap in the Context of Increasing Learning Standards
The signature characteristic of students with LD is severe low achievement despite generally effective instruction and intelligence in the normal range. In the past 25 years, the dominant reform related to students with LD is inclusion, which typically features universal design for learning (Center for Applied Special Technology, 2011) and other accommodations to provide students with access to high academic standards in the general education classroom, along with collaboration between general and special educators to support these students’ learning.
Despite such inclusive reforms, the achievement of students with LD has stagnated at very low levels, as indexed in large, nationally representative evaluations. According to the National Longitudinal Transition Study–2 (NLTS-2; Wagner, Marder, et al., 2003; Wagner, Newman, Cameto, Levine, & Marder, 2003), by the time students with LD are at the secondary level, they are an average of 3.4 years behind grade-level peers in reading and 3.2 years behind in math. According to the 2008 Special Education Elementary Longitudinal Study (Schiller, Sanford, & Blackorby, 2008), 64% of students with LD scored below the 21st percentile on reading comprehension, and this very large achievement gap remained constant across the 3 years of the study. Similar results occurred in mathematics, and findings echo analyses conducted on the Early Childhood Longitudinal Study–Kindergarten Cohort (U.S. Department of Education, 2000), which documented an ever-widening achievement gap for students with LD (e.g., Judge & Watson, 2011).
The most recent National Assessment of Educational Progress (NAEP; National Center for Education Statistics, 2013) provides another, more recent evaluation. The achievement gap for eighth-grade students with disabilities, which dominantly represents students with LD, is holding steady and remains severe. The percentage of students scoring at or above basic in reading was 34, 34, and 35 in 2009, 2011, and 2013, respectively. For students without individualized education programs, these numbers were 78%, 79%, and 81%. The numbers run parallel in math: 33%, 33%, and 31% versus 76%, 77%, and 78% (see http://nces.ed.gov/nationsreportcard/naepdata/).
The magnitude and persistence of these academic deficits raise important questions about the nature and effectiveness of the value of relying heavily on core classroom instruction, with accommodations, to meet these students’ academic needs. In this regard, it is instructive to consider that according to NLTS-2, only 11% of students with LD receive substantial modifications to the general education curriculum. Few rigorous studies assess the impact of instructional accommodations on the academic performance of students with disabilities. In a recent review of instructional accommodations, Harrison, Bunford, Evans, and Owens (2013) corroborated Tindal and Fuchs’s (2000) earlier findings when they concluded, “Multiple accommodations are being recommended without any evidence of effectiveness” (p. 587).
Even so, as the curriculum in the United States shifts to the more rigorous CCSS, now adopted by 45 states, instructional recommendations for students with LD continue to focus dominantly on these inclusionary practices. To provide guidance to schools on the application of the new standards to students with disabilities, the Common Core web site offers the following advice (http://www.corestandards.org/assets/application-to-students-with-disabilities.pdf): Promoting a culture of high expectations for all students is a fundamental goal of the Common Core State Standards. In order to participate with success in the general curriculum, students with disabilities, as appropriate, may be provided additional supports and services, such as: Instructional supports for learning—based on the principles of Universal Design for Learning—which foster student engagement by presenting information in multiple ways and allowing for diverse avenues of action and expression; Instructional accommodations (Thompson, Morse, Sharpe & Hall, 2005)—changes in materials or procedures—which do not change the standards but allow students to learn within the framework of the Common Core; Assistive technology devices and services to ensure access to the general education curriculum and the Common Core State Standards.
In a similar way, McLaughlin (2012), on behalf of the National Association of Elementary School Principals, offered advice for implementing Common Core with students with disabilities “The best way to meet the needs of this group of students, as well as other students, is for teachers to understand and apply the principles of Universal Design for Learning” (p. 23) This includes the use of accommodations: Presentation (e.g., repeat directions, read-aloud, large print, Braille);Equipment and material (e.g., calculator, amplification equipment, manipulatives, assistive and instructional technologies);Response (e.g., mark answers in book, scribe records response, use a pointer);Setting (e.g., study carrel, student’s home, separate room); andTiming/scheduling (e.g., extended time, frequent breaks). (p. 24)
McLaughlin added, Topics for such joint [i.e., for general and special educator] professional development include:Understanding all aspects of Universal Design Learning; . . . Learning how to use assistive and instructional technology to provide accommodations; and Creating effective ways for special educators to work alongside and in full partnership with general educators through co-teaching and collaboration. (p. 26)
The major alternative to these inclusionary practices for addressing the academic needs of students with LD is specialized intervention. Our use of the term specialized intervention refers to two forms of practices. The first involves intervention programs that rely on carefully designed, complex instructional routines, based on principles of explicit instruction and state-of-the-art understanding of the domain (e.g., L. S. Fuchs, Fuchs, & Powell, et al., 2008). The second approach, sometimes used in conjunction with the first form of specialized intervention, is the use of ongoing progress monitoring to systematically experiment with instructional program components, thereby inductively deriving individualized programs (e.g., Stecker, Fuchs, & Fuchs, 2005). Research shows that each of these two forms of specialized intervention can dramatically reduce achievement gaps (e.g., O’Connor & Fuchs, 2013; Torgesen et al., 2001).
Specialized intervention, in both its forms, is reflected in some recommendations as an alternative approach for helping students with disabilities with the challenge of CCSS. For example, the Common Core web site (http://www.corestandards.org/assets/application-to-students-with-disabilities.pdf) states, In order for students with disabilities to meet high academic standards and to fully demonstrate their conceptual and procedural knowledge and skills . . . , their instruction must incorporate . . . teachers and specialized instructional support personnel who are prepared and qualified to deliver high-quality, evidence-based, individualized instruction and support services.
Yet, specialized intervention plays a decidedly secondary role to the inclusionary ideal of universal design for learning and classroom accommodations. It also differs markedly from collaboration and co-teaching, in which special educators provide assistance in implementing the general educators’ inclusive instructional program.
The specialized intervention in the RCTs analyzed in this article incorporated complex instructional design, rooted in explicit instruction and based on state-of-the-art understanding of the domain. As L. S. Fuchs, Fuchs, Powell, et al. (2008) described, specialized intervention’s explicit instruction in mathematics relies on (a) beginning instructional units with worked examples, with the teacher explaining how work is completed, step by step, and what the teacher thinks as she or he completes each step; (b) providing explanations in simple, direct language and having students repeat explanations in their own words; (c) identifying efficient solution strategies and requiring students to practice applying those strategies while they explain how and why those strategies make sense; (d) ensuring students have the necessary background knowledge and skills to succeed with those strategies and ensuring students are thoroughly grounded in the ideas that form the basis of the strategies; (e) providing repeated practice so students use the prescribed strategies to generate many correct responses; (f) incorporating systematic cumulative review; (g) motivating students to employ a high standard of coherence to promote on-task thinking and hard work; and (h) teaching for transfer so students recognize novel problems, with unfamiliar problem features, as belonging to the problem types taught during intervention.
Such specialized intervention is designed to maximize student attention, participation, motivation, and perseverance as well as responsive teacher feedback. It is designed to address the kinds of cognitive limitations these students experience, such as poor language comprehension and limited working memory (e.g., L. S. Fuchs et al., 2013; L. S. Fuchs, Schumacher, Sterba, et al., 2014) and to address the types of difficulty in foundational skills these students, by definition, experience.
Specialized intervention is therefore a very different instructional model than is typically practiced in the general education settings where inclusion occurs. But rigorous studies have not been conducted to contrast the efficacy of inclusive instruction versus specialized intervention for very-low-performing students, such as students with LD, on academic outcomes. Such studies are needed to guide practitioners about the types of service delivery that is required to help this population of learners profit from the CCSS reform.
To gain insight into how the CCSS reform may affect the learning of very-low-performing students (such as students with LD) as a function of these two service delivery models, we analyzed data from the Fractions Center, funded by the Institute for Education Sciences in the U.S. Department of Education. These data were derived from three RCTs conducted in 3 consecutive years in one large, urban school district. The 3 years spanned the timeframe during which the school district moved toward CCSS implementation. We looked at the subset of fourth-grade students who began the RCTs with mathematics achievement scores at or below the 10th percentile (note that the published reports of these studies did not disaggregate data for this population). These very low performers had been randomly assigned at the individual level to inclusive fraction instruction versus specialized fraction intervention, and students in both conditions received a similar amount of mathematics instruction. We examined whether fraction learning differed as a function of service delivery option and considered how these groups’ achievement gaps, relative to the not-at-risk classmates of the very-low-performing students, changed during the transition to CCSS.
Rationale for Focusing on Fractions
Competence with fractions is considered foundational for learning algebra, for success with more advanced mathematics, and for competing successfully in the American workforce (National Mathematics Advisory Panel, NMAP, 2008). Yet, half of middle and high school students in the United States are still not proficient with the ideas and procedures taught about fractions in the elementary grades (e.g., National Council of Teachers of Mathematics, 2007; NMAP, 2008). For these reasons, NMAP recommended that high priority be assigned to improving performance on fractions, an emphasis reflected in the CCSS.
In the early stages of fraction knowledge (usually at fourth grade), two ways of understanding fractions are critical (e.g., Hecht & Vagi, 2010; NMAP, 2008). The first is part–whole interpretation, with which a fraction is understood as a part of one entire object or a subset of a group of objects. Such understanding is often evident as early as preschool (e.g., Mix, Levine, & Huttenlocher, 1999), based on children’s experiences with sharing. In American schools, symbolic fraction notation, typically introduced in first grade, is taught via area models that underpin part–whole understanding. By fourth grade, the dominant emphasis on part–whole interpretation persists. In the RCTs analyzed in the present report, the school’s inclusive program emphasized part–whole interpretation.
The second type of understanding, the measurement interpretation of fractions, reflects cardinal size (Hecht, 1998; Hecht, Close, & Santisi, 2003). Often represented with number lines (e.g., Siegler, Thompson, & Schneider, 2011), this type of interpretation is less intuitive than part–whole understanding and is thought to depend on formal instruction. Yet, the measurement interpretation of fractions has traditionally been assigned a subordinate role to part–whole interpretation in typical American classrooms. This is the case even though NMAP (2008) viewed the measurement interpretation of fractions as the more important mechanism in explaining fraction learning. For this reason, an emphasis on the measurement interpretation of fractions represents the more state-of-the art instructional approach for promoting understanding of fractions.
To reflect state-of-the-art understanding of the fraction domain, the specialized intervention condition focused more on the measurement interpretation of fractions. As represented in typical classroom practice, teachers in the inclusive instruction condition focused mainly on the part–whole interpretation of fractions; this was the case even though the Year 1 state standards and the CCSS mandated a stronger focus on the measurement interpretation. We return to this point in the Discussion section.
Method
For complete descriptions of the methods of the RCTs from which data for the present analysis were derived, see L. S. Fuchs et al. (2013) for Year 1; L. S. Fuchs, Schumacher, Sterba, et al. (2014) for Year 2; and L. S. Fuchs, Schumacher, Long, et al. (2014) for Year 3.
Participants
In this section, we (a) describe the participant pool from the larger RCTs from which data for the present analysis were derived; (b) explain the criteria by which we selected very low performers for the present analysis; (c) describe not-at-risk classmates, whose data were used to calculate the very low performers’ achievement gaps; and (d) provide descriptive information on the not-at-risk classmates and very low performers. Please note that these RCTs received institutional review board approval, and consent was obtained from participating teachers, children, and children’s parents.
Larger RCTs
In the RCTs from which data for the present analysis were derived, we had defined risk as performance below the 35th percentile at the start of fourth grade on a broad-based calculations assessment (Wide Range Achievement Test–4, WRAT; Wilkinson & Robertson, 2006). To ensure strong representation across the range of scores below the 35th percentile, we sampled half the at-risk students from below the 15th percentile and the other half from between the 15th and 34th percentiles. We administered the two-subtest Wechsler Abbreviated Scales of Intelligence (WASI; Wechsler, 1999) to all students who met the risk criterion; because the studies were not about intellectual disability, we excluded children with t scores below the 9th percentile on both subtests. We sampled between three and nine at-risk students per classroom, stratifying by more versus less severe risk in each classroom. The sample comprised 268 students from 53 classrooms in 13 schools in Year 1, 243 students from 49 classrooms in 14 schools in Year 2, and 197 students from 45 classrooms in 14 schools in Year 3.
We randomly assigned these students at the individual level, stratifying by classroom and risk severity, to the two study conditions in Year 1: the school’s inclusive program versus the study’s specialized intervention. In Years 2 and 3, students were randomly assigned to three conditions: inclusion or one of two variants of the specialized intervention.
Very low performers for present analysis
Because effects on the study outcomes included in the present analysis were comparable for the two intervention variants in Years 2 and 3, we combined the two intervention conditions in those years for the present analysis. To focus on the subset of the at-risk population representative of the achievement level of students with LD, we limited the sample for the present analysis to students who began fourth grade on the mathematics screener at or below the 10th percentile. (We included students scoring at or below the 10th percentile on the mathematics screener instead of students identified by schools as having LD, because research methods have evolved to avoid LD school identification due to inconsistency in the criteria schools employ, and instead rely on researcher identification. In this regard, also note that in keeping with LD criteria, all participants not only scored at or below the 10th percentile on the mathematics screener but also had t scores at or above the 9th percentile on at least one WASI subtest.) To represent the response to inclusive fraction instruction of such low performers, we restricted the sample to students who received their instruction without special education pullout services in the area of mathematics.
After random assignment, between one and three students (depending on year) moved to schools outside the study’s reach. Students who moved did not differ statistically from the remaining students on any demographic or pretest variable and did not differ significantly on any demographic or pretest variable as a function of condition. We omitted the children who moved. This yielded 42 inclusion and 39 intervention students in Year 1, 23 inclusion and 44 intervention students in Year 2, and 19 inclusion and 38 intervention students in Year 3. (In Years 2 and 3, the number of intervention students was approximately double that of inclusive students, because in those years, students had been randomly assigned to three conditions, which included the two intervention conditions we combined in this analysis.)
Not-at-risk classmates
To index posttreatment achievement gaps, we compared students’ postintervention performance on group-administered fraction measures against the performance of not-at-risk classmates. We obtained the sample of not-at-risk classmates by randomly sampling students who began fourth grade above the 34th percentile on the study’s screening measure. Sampling was conducted to represent each of the participating classrooms in similar proportion to at-risk students in the larger RCTs. In Years 1, 2, and 3, respectively, this not-at-risk classmate sample included 282, 265, and 320 children. Depending on year, 10 to 19 students moved during the study; those students did not differ from remaining students on pretest measures. We collected only group-administered measures on not-at-risk classmates, not demographic or individual test data; hence, we included only group-administered measures in the present analysis.
Descriptive information on sample used in present analysis
See Table 1 for demographics and Table 2 for pretest fraction performance as a function of year and condition. In terms of WRAT Arithmetic, standard scores averaged 75.05 (SD = 4.97) for inclusive instruction, 74.67 (SD = 5.67) for specialized intervention, and 104.64 (SD = 7.41) for not-at-risk classmates in Year 1. They averaged 75.48 (SD = 5.22) for inclusive instruction, 76.66 (SD = 4.41) for specialized intervention, and 104.52 (SD = 6.71) for not-at-risk classmates in Year 2. And they averaged 75.11 (SD = 4.50) for inclusive instruction, 75.66 (SD = 4.98) for specialized intervention, and 105.44 (SD = 6.99) for not-at-risk classmates in Year 3.
Demographics by Year and Condition.
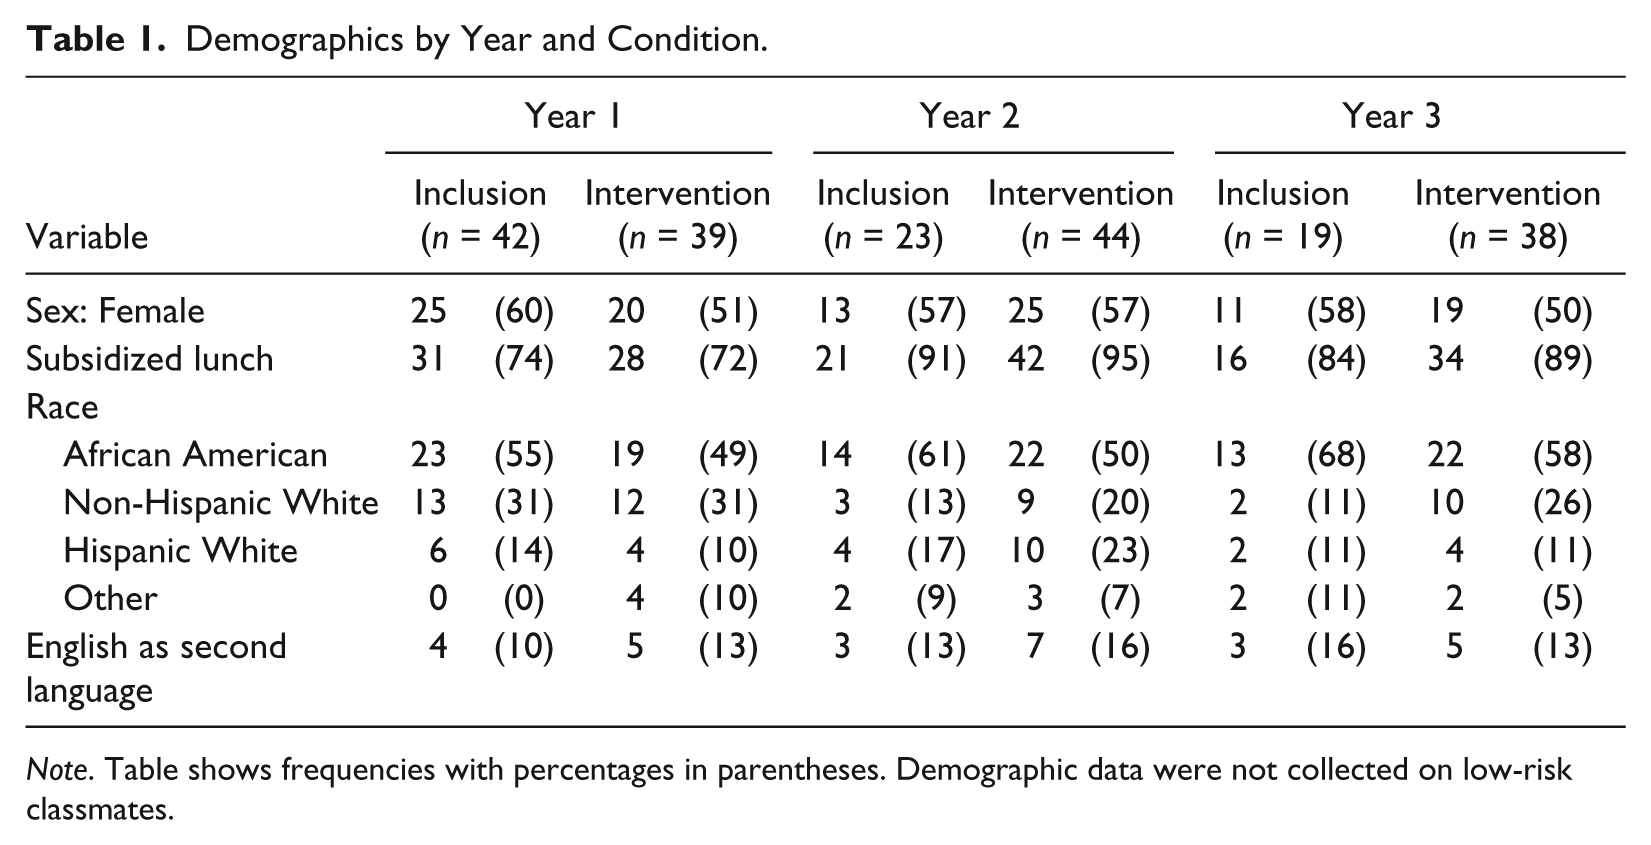
Note. Table shows frequencies with percentages in parentheses. Demographic data were not collected on low-risk classmates.
Fraction Performance at Pre- and Posttest by Year and Condition.
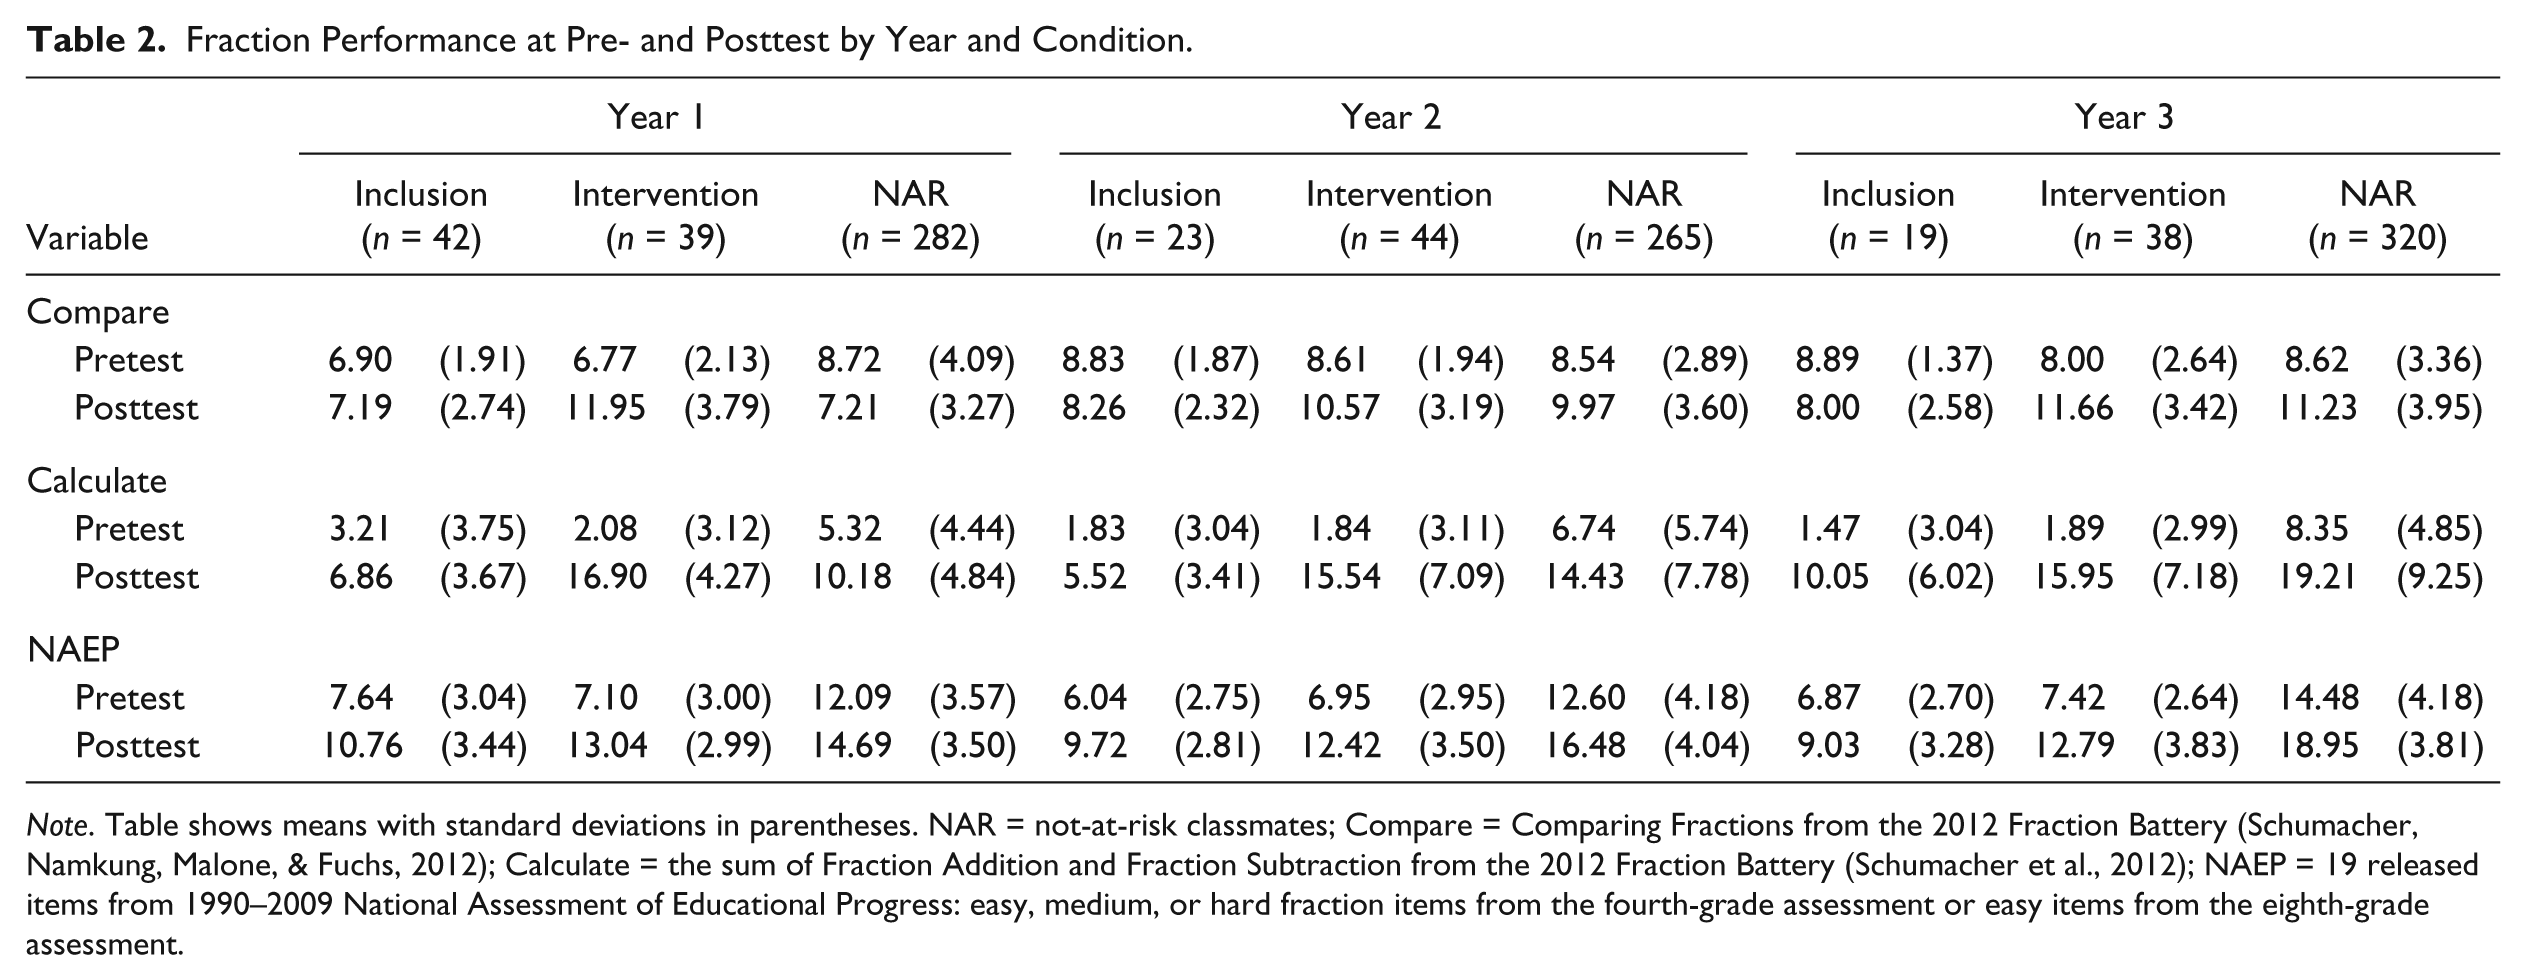
Note. Table shows means with standard deviations in parentheses. NAR = not-at-risk classmates; Compare = Comparing Fractions from the 2012 Fraction Battery (Schumacher, Namkung, Malone, & Fuchs, 2012); Calculate = the sum of Fraction Addition and Fraction Subtraction from the 2012 Fraction Battery (Schumacher et al., 2012); NAEP = 19 released items from 1990–2009 National Assessment of Educational Progress: easy, medium, or hard fraction items from the fourth-grade assessment or easy items from the eighth-grade assessment.
In terms of WASI IQ, standard scores averaged 93.51 (SD = 10.74) for inclusive instruction and 93.51 (SD = 12.37) for specialized intervention in Year 1. They averaged 86.22 (SD = 8.82) for inclusive instruction and 85.48 (SD = 9.84) for specialized intervention in Year 2. They averaged 89.58 (SD = 8.16) for inclusive instruction and 90.16 (SD = 7.91) for specialized intervention for Year 3.
District Standards and Curricular Emphases
Inclusive fraction instruction and specialized fraction intervention evolved over the course of the three RCTs, as the school district curriculum transitioned toward the CCSS. See Table 3 for state standards; bolded text highlights initial (i.e., Year 1) state standards that were not included in the CCSS. Year 2 was a transition year, in which teachers were encouraged to move toward the CCSS. In Year 3, teachers were expected to address the CCSS in their instruction.
Fourth-Grade Traditional Standards (Year 1) and Common Core State Standards (CCSS) Fraction Standards (Year 3).
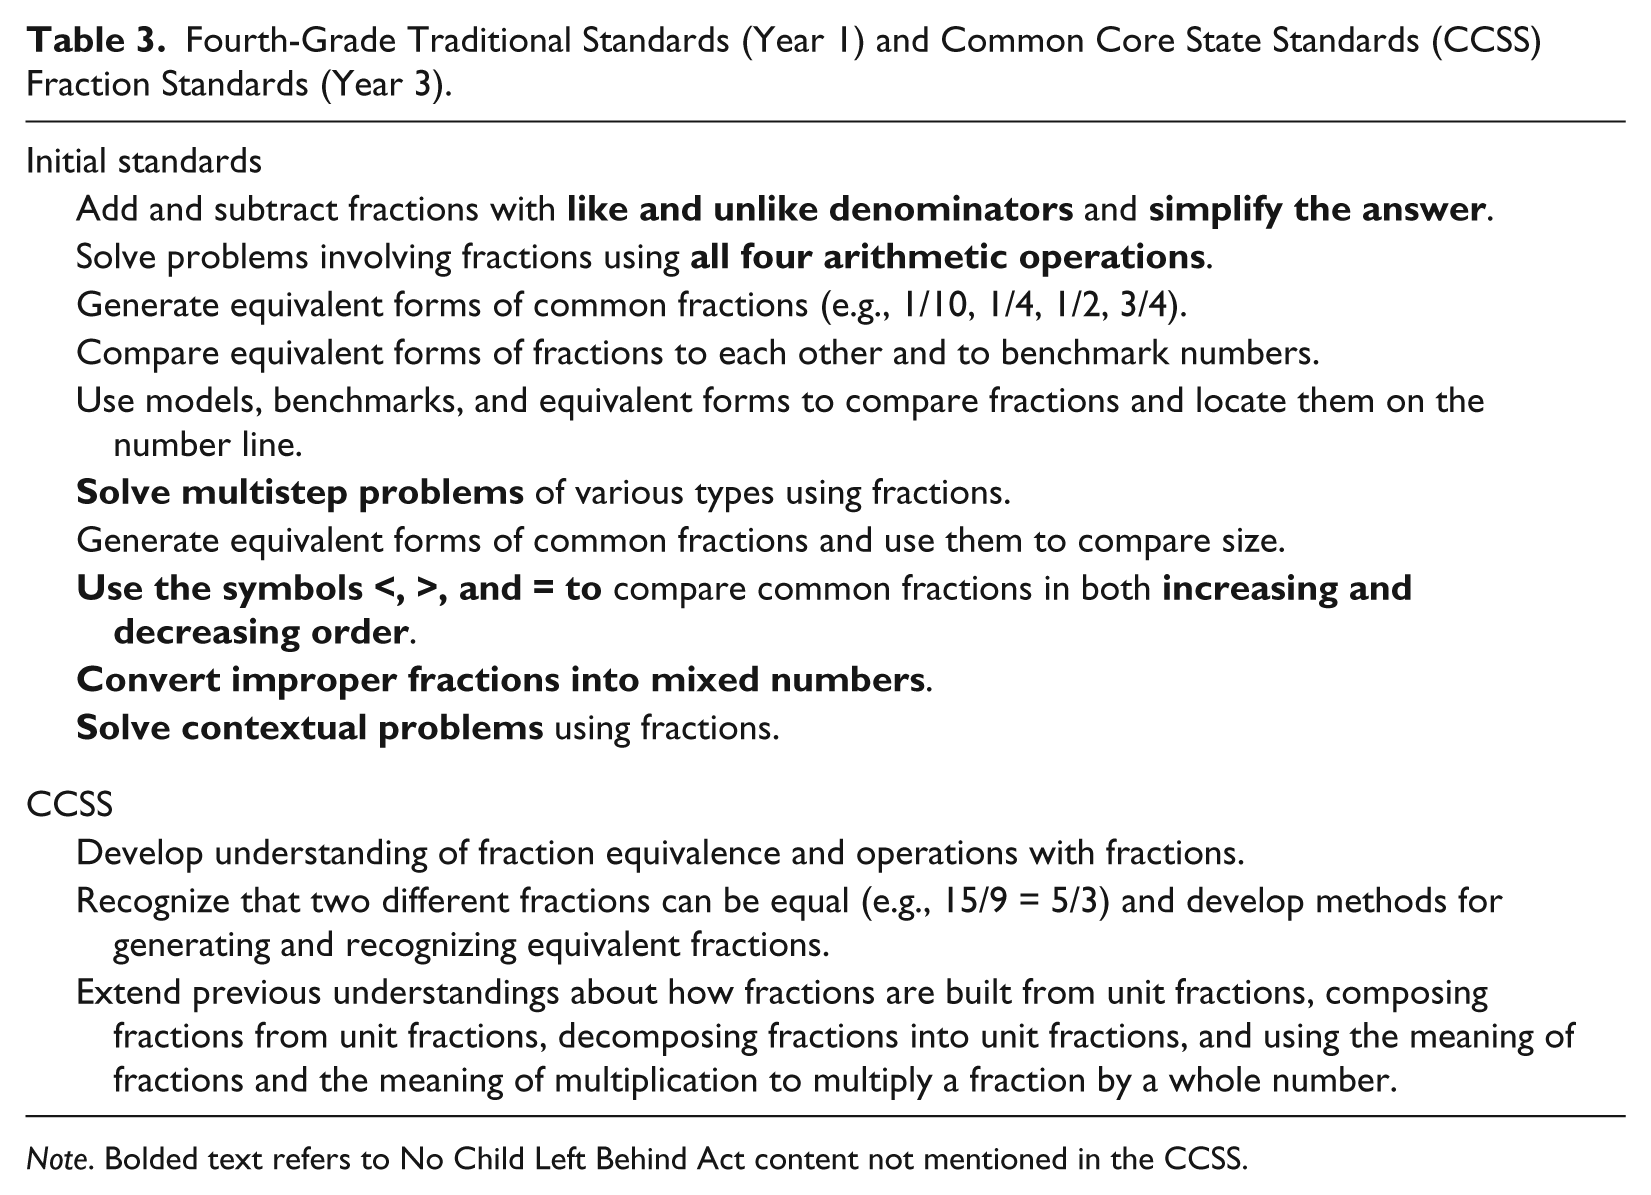
Note. Bolded text refers to No Child Left Behind Act content not mentioned in the CCSS.
Contrary to common understanding about the greater challenge of the CCSS compared to traditional standards, Table 3 shows that Year 1 standards specified fraction objectives at least as difficult as the CCSS. Consistent with understanding about the CCSS, however, Year 1 standards specified more fraction objectives than the CCSS, with the CCSS framed in broader terms. With respect to this reduction in scope, it is important to note that an essential component of CCSS reform is to decrease content coverage—treating fewer topics at a given grade in greater depth. So accordingly, at fourth grade, the CCSS refocused intensity and depth on fractions, as the state eliminated nonfraction standards: those involving comparing decimals using concrete and pictorial representations; determining correct change from a transaction; making generalizations about geometric and numeric patterns; identifying attributes of simple and compound figures composed of two- and three-dimensional shapes; determining situations in which a highly accurate measurement is important; identifying images resulting from reflections, translations, or rotations; describing the distribution of data using median, range, or mode; and listing all possible outcomes of a given situation or event. The hope was that the curricular emphasis on fractions (and the other remaining, more broadly specified CCSS standards) would result in greater depth of coverage and challenge.
In fact, we observed greater depth of fraction coverage and challenge as inclusive fraction instruction evolved over Years 1 to 3. This greater depth of coverage and challenge was reflected in (a) teacher reports of their curricular foci, (b) interventionists’ observations of strategies that students brought to the specialized intervention sessions from their classrooms, and (c) the increasing fraction scores of not-at-risk classmates on the measures administered as part of the three RCTs (see Results section). (Note that we did not collect classroom observational data because resources did not permit such data collection.)
In Table 4, we summarize data from teacher questionnaires on the major emphases of inclusive fraction instruction and specialized fraction intervention as a function of year (see full-length report of each RCT for more information). There were two major commonalities across inclusive instruction and specialized intervention. First, in terms of procedures, inclusive instruction as well as specialized intervention restricted calculation instruction to adding and subtracting fractions in all 3 years. This occurred even though the initial standards directed that instruction occur on all four operations. Ignoring multiplying and dividing may reflect practitioners’ recognition of the potential for confusion (and unrealistic challenge) in expecting fourth graders to simultaneously acquire understanding of nonintuitive fraction principles (e.g., there is no counting sequence; two whole numbers are combined in notation that determines the value of one fractional value) in the same timeframe as they acquire nonintuitive understanding of fraction multiplication and division (in which products are smaller than multipliers and multiplicands and quotients are larger than divisors and dividends).
Curricular Emphases by Year and Condition.
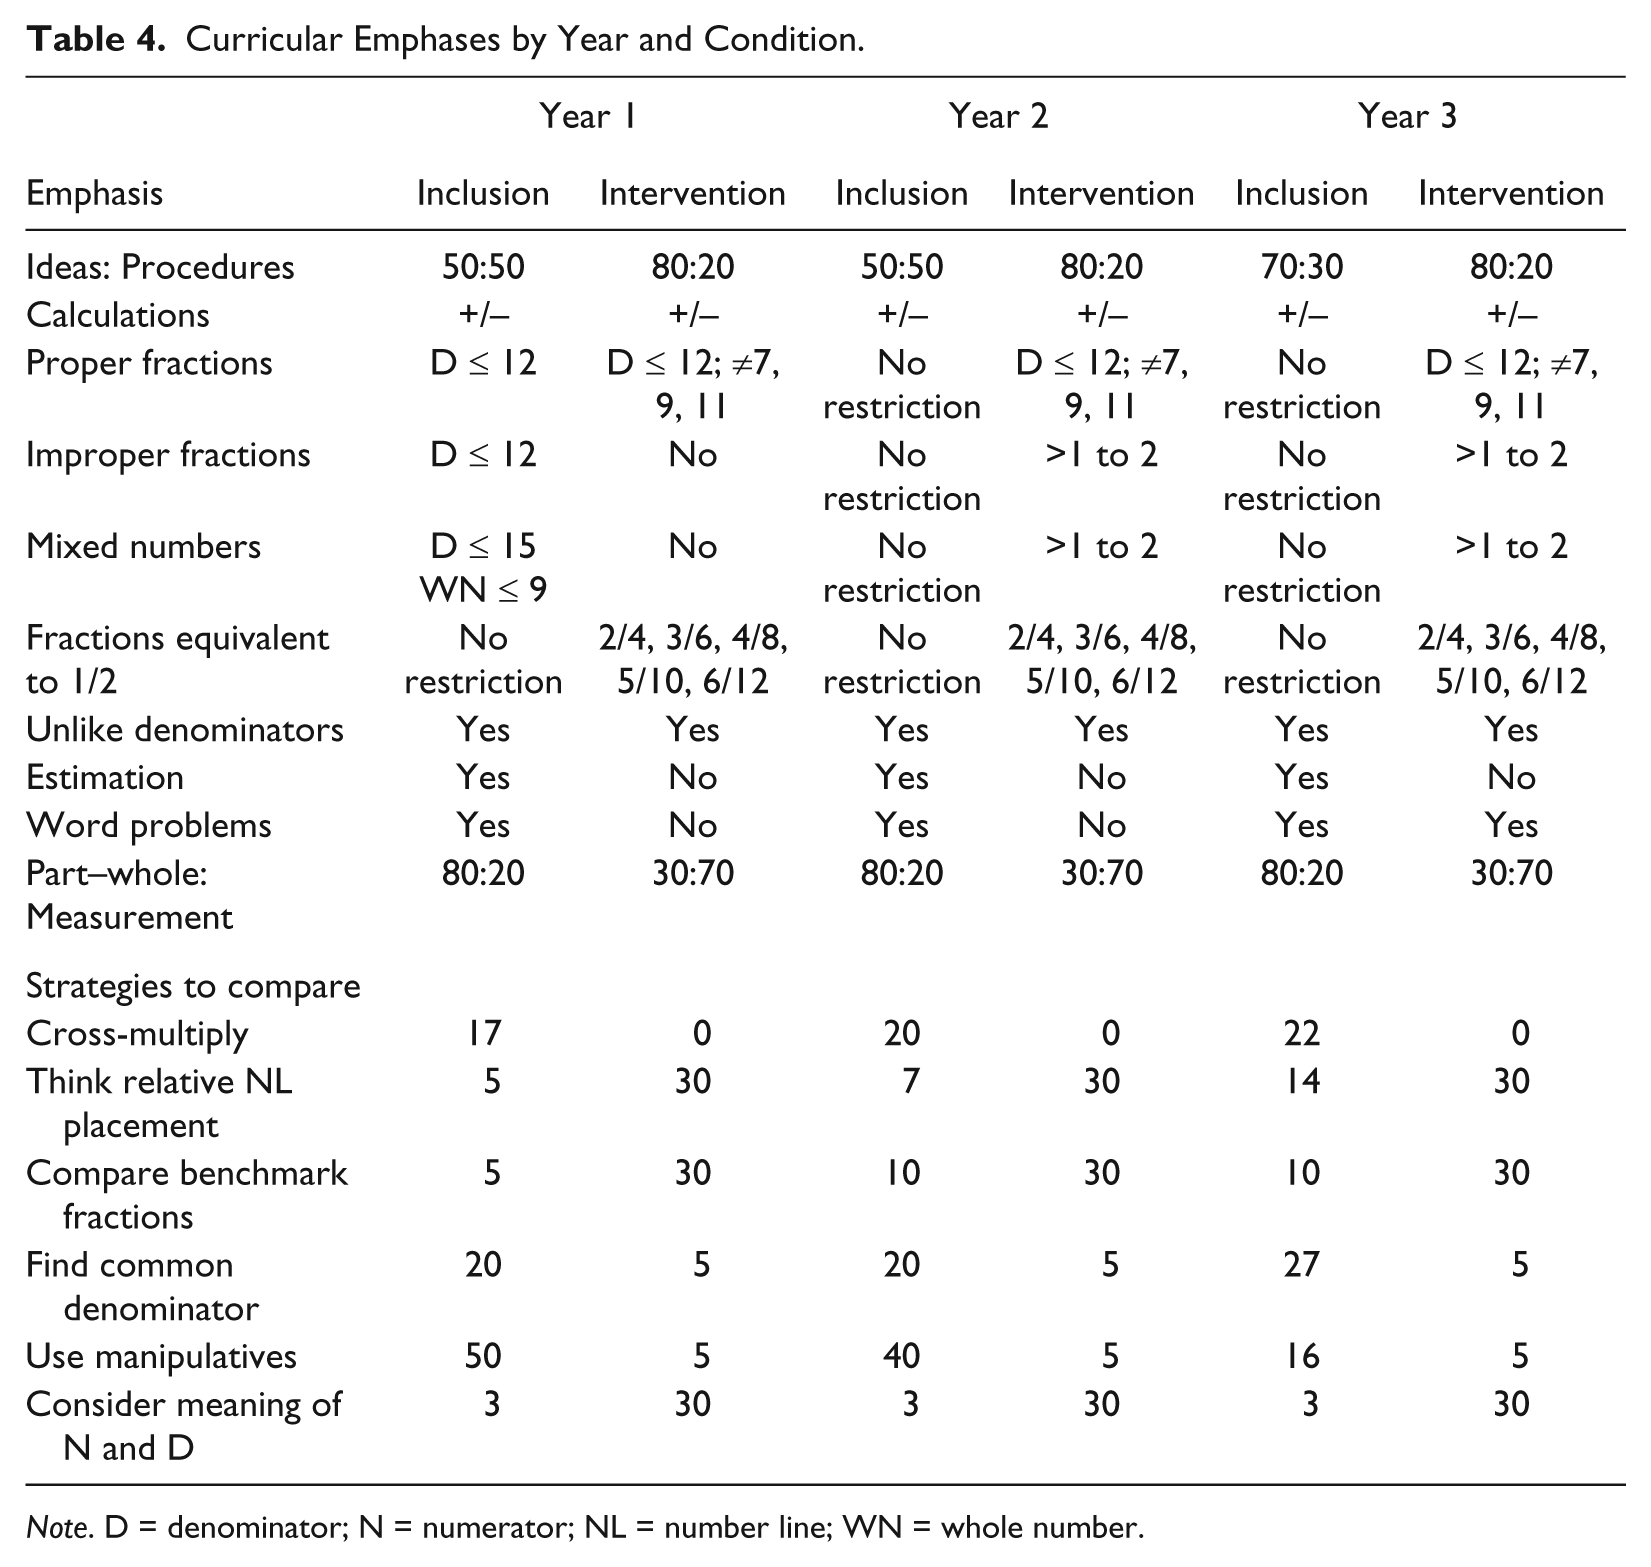
Note. D = denominator; N = numerator; NL = number line; WN = whole number.
The second commonality across inclusive instruction and specialized intervention was attention to unlike denominators and emphasis on fractions equivalent to one half. With respect to fractions equivalent to 1/2, however, inclusive instruction imposed no restrictions, whereas specialized intervention limited the focus to a pool of six equivalent fractions, all with even denominators. This restriction was imposed to encourage understanding of the multiplicative relationships within fractions while limiting calculation demands. This theme of broader coverage within inclusive instruction also pertained to the range of proper fractions, improper fractions, and mixed numbers. For the range of proper fractions, inclusive instruction focused on denominators less than or equal to 12 in Year 1 but expanded to no restrictions in Years 2 and 3. By contrast, specialized intervention limited denominators to less than or equal to 12 but not equal to 7, 9, and 11 (again, the goal was to focus students’ attention on fraction ideas without creating excessive calculation demands). For improper fractions, inclusive instruction focused on denominators less than or equal to 12 in Year 1 but then expanded to no restrictions in Years 2 and 3. By contrast, specialized intervention did not address mixed numbers in Year 1; however, in Years 2 and 3, the focus expanded to include improper fractions between 1 and 2 (again, the goal was to focus attention on the meaning of improper fractions without raising the division challenges associated with improper fractions greater than 2). For mixed numbers, inclusive instruction focused on denominators less than or equal to 15 with whole numbers less than or equal to 9 in Year 1 but then expanded to no restrictions in Years 2 and 3. By contrast, specialized intervention did not address improper fractions in Year 1; however, in Years 2 and 3, the focus expanded to include mixed numbers between 1 and 2 (again, to focus attention on the meaning of mixed numbers without raising division challenges). It is interesting to note that fourth-grade CCSS actually imposes restrictions similar to those used in specialized intervention. Teacher reports of inclusive instruction therefore indicate greater challenge than CCSS requires.
Major distinctions between the two conditions also existed. First, across the 3 years, the ratio of curricular emphasis on ideas about fractions to procedures with fractions was lower with inclusive instruction than with specialized intervention. With inclusion, the ratio of ideas to procedures was 50:50 in Years 1 and 2 and increased to 70:30 in Year 3. By contrast, in keeping with state-of-the-art understanding about fractions, for which evidence suggests conceptual knowledge is more important for supporting procedural skill than vice versa (Hecht & Vagi, 2010; Rittle-Johnson, Siegler, & Alibali, 2001), specialized intervention favored ideas over procedures (80:20) across all 3 years. Second, inclusive instruction addressed a broader range of fraction topics to include estimation and word problems in all 3 years. Specialized intervention did not address fraction estimation at all and first addressed fraction word problems in Year 3.
Finally, there were major differences in the strategies taught for comparing fractions, a major curricular focus with traditional standards as well as CCSS. The inclusive program highlighted the use of manipulatives, especially in Years 1 and 2, which likely reflects inclusive instruction’s emphasis on the part–whole interpretation of fractions (i.e., comparing the size of fraction circles or tiles representing different fractions) rather than the conceptual basis for determining the cardinal value of fractions. Procedural strategies for comparing fractions were also emphasized, with inclusive instruction relying strongly on cross-multiplying and finding common denominators. Cross-multiplying is entirely procedural as addressed in the inclusive classrooms in these RCTs. Finding common denominators can reflect but, as practiced in the classrooms in these RCTs, was not typically focused on understanding why fractions have differing magnitudes. Together, teachers indicated that approximately 50% of their instructional emphasis on fraction magnitudes was procedural—not focused on the ideas essential to why fraction magnitudes differ. Yet, teachers also reported almost comparable emphasis (43%) on activities or strategies that address meaningful ideas about why fraction magnitudes differ: thinking about relative placement on number lines, comparing fractions to benchmark fractions, using manipulatives, and considering the meaning of the numerator and denominator. Nevertheless, to reflect state-of-the-art thinking about the fraction domain within specialized intervention, 90% of activities focused on strategies for comparing fractions were conceptual: thinking about relative placement on number lines, comparing fractions to benchmark fractions, and considering the meaning of the numerator and denominator.
Inclusive Education
As described by the school district (http://www.mnps.org/Page70012.aspx), the model of inclusive service delivery “organizes professional staff by the needs of each learner instead of clustering learners by label.” The vision entails “general education and special education working collaboratively.” The mission is that “schools, families, and the community develop successful learners in the least restrictive environment. Inclusion brings classrooms together by teaching all students as one group, including those with exceptional education needs. In an inclusive classroom, all students learn more.”
District initiatives to support inclusive education are in keeping with the CCSS web site’s guidance to schools about the application of the standards to students with disabilities: universal design for learning, use of accommodation to create access to high learning standards, and collaboration between general and special educators. This included co-teaching; however, as is usually the case with co-teaching, the ratio of special to general education classrooms within any given school required reliance more on collaboration than on the special educators’ physical presence and actual assistance in any given classroom at any given time.
Unfortunately, in the three RCTS, we did not have reliable reports about the extent of actual implementation of universal design for learning, accommodations, collaboration, or co-teaching to support the population of students whose mathematics achievement was at or below the 10th percentile. The district did provide a district in-service program and school-based coaches and special educators designed to support these practices. On the basis of NLTS-2 (Schiller et al., 2008), however—in which 40% of students with LD have general education teachers who receive no information about their instructional needs and implement substantial modifications to the curriculum for only 11% of students with LD—we assume inclusive instruction for these very-low-performing students was the general educators’ normal instructional programs, with relatively few and relatively minor modifications, such as shortening assignments and allowing additional time for assignments.
Specialized Intervention
Specialized intervention differed from inclusive instruction by relying on explicit instruction (see introduction to this article), by restricting fraction coverage and reducing calculation demands, and by focusing more dominantly on the measurement interpretation of fractions. Intervention occurred in groups of two to four students, three times per week for 30 to 35 min outside the classroom in a quiet location in the school. It lasted for 12 weeks. Between Years 1 and 2, the difficulty of the specialized intervention increased to better represent the district curriculum, and in Year 3, word problem instruction was added (see Table 4). Also, each year, specialized intervention was revised to improve the quality of explanations and flow of topics. However, the organization of the program remained similar. In this article, we provide an overview of the Year 3 specialized intervention program. For additional information, see L. S. Fuchs et al. (2013) for Year 1; L. S. Fuchs, Schumacher, Sterba, et al. (2014) for Year 2; and L. S. Fuchs, Schumaker, Long, et al. (2014) for Year 3.
Intervention was organized in a manual, Fraction Face-Off! (L. S. Fuchs, Schumacher, & Fuchs, 2012), which includes materials and guides for 36 lessons. The lesson guides provide a model for each lesson and the language of explanations. To ensure the natural flow of interactions and responsiveness of tutors to the difficulties students encountered, tutors reviewed but did not read from or memorize lesson guides.
For fraction understanding, intervention focused primarily on the measurement interpretation of fractions. This was achieved by increasing magnitude understanding through instruction and activities involving comparing, ordering, and placing fractions on number lines. This focus was preceded by attention to the part–whole interpretation (e.g., showing objects with shaded regions) and to equal sharing examples to build on instruction provided in the general classroom. Number lines, fraction tiles, and fraction circles were used to introduce and review concepts through the 36 lessons. In Lessons 1 through 15, the focus was on proper fractions and improper fractions equal to 1. Students compared two fractions, ordered three fractions, and placed fractions on a zero-to-1 number line. In Lesson 16, we introduced improper fractions >1 and <2. Students converted between improper fractions and mixed numbers, placed fractions on a zero-to-2 number line, and ordered and compared improper fractions and mixed numbers. In the last 4 weeks of tutoring, we added instruction on adding and subtracting proper, improper, and mixed numbers, but the content was still primarily allocated to understanding fractions.
Each lesson comprised six activities, with activity names reflecting a sports theme. In the first activity (7 min; introduced in Lesson 7), “Word-Problem Warm-Up,” students were provided schema-based word problem instruction. In “Training” (8–12 min), tutors introduced concepts, skills, problem-solving strategies, and procedures while relying on manipulatives (e.g., fraction tiles, fraction circles, number lines) and visual representations. “The Relay” (8–12 min) involved group work on concepts and strategies taught during that day’s Training. Students took turns completing problems while explaining their work to the group. All students simultaneously showed work for each problem on their own papers. The Training and Relay activities together lasted 20 min. “Sprint” (2 min; introduced in Lesson 10) provided strategic, speeded practice on four measurement interpretation topics: identifying whether fractions are equivalent to 1/2; comparing the value of proper fractions; comparing the value of a proper and an improper fraction; and identifying whether numbers are proper fractions, improper fractions, or mixed numbers. In the final activities, “The Individual Contest” (5 min) and “The Scoreboard” (1 min), students independently completed paper-and-pencil problems on content representing that day’s Training topics with cumulative review. Tutors scored their work for correct responses and provided corrective feedback on errors. In the first 3 weeks before all activities were introduced, the Training and Relay were extended to account for the full 35 min. Because very-low-performing students, such as students with LD, often display attention, motivation, and self-regulation difficulties that may affect learning (e.g., Montague, 2007), we encouraged students to regulate their attention and behavior and to work hard using a systematic reinforcement system.
Each year, we audiotaped every intervention session, with 20% of recordings randomly sampled such that interventionist, student, and lesson were sampled comparably. A research assistant (RA) listened to each sampled tape while completing a checklist to identify the essential points the interventionist implemented. This RA, who had participated in tutoring, was trained in coding by the fifth author, who had helped develop the specialized intervention. Training occurred in a series of sessions during which the RA and the fifth author independently coded the same set of tapes (used only for training) and identified and resolved discrepancies to achieve a common understanding of the coding scheme. Training sessions continued until the RA and the fifth author achieved 100% agreement. The mean percentage of points addressed was 97.69 (SD = 3.39) in Year 1, 97.16 (SD = 1.92) in Year 2, and 97.92 (SD = 1.88) in Year 3. Each year, a second RA, trained using the same process, independently listened to 20% of the sampled recordings to assess concordance. The mean difference in score, depending on year, ranged between 1.63% and 1.74%.
Instructional Time
According to teacher reports, the inclusive general education program included a supplemental instruction period in which inclusive instruction students received mathematics supplemental instruction for approximately 30 min per week. This, combined with 300 min of weekly classroom instruction (an average of 60 min per day), sums to 330 min of mathematics instruction per week for inclusive instruction students. On the other hand, teachers reported that specialized intervention students most typically received the present study’s specialized intervention (i.e., 90 min in Years 1 and 2; 105 min per week in Year 3) during part of the classroom teacher’s math instructional period but less frequently during other parts of the school day. On average, specialized intervention students’ weekly mathematics instructional time, including the present study’s intervention, was 344 min. Thus, students in the two conditions received comparable amounts of mathematics instruction.
Measures
Screening measures
The mathematics screening measure was WRAT-4-Arithmetic (Wilkinson & Robertson, 2006), with which students complete calculation problems of increasing difficulty. Alpha for the students included in the present article was .73. The IQ screening measure was the WASI (Weschler, 1999). The Vocabulary subtest assesses expressive vocabulary, verbal knowledge, memory, learning ability, and crystallized and general intelligence; subjects identify pictures and define words. The Matrix Reasoning subtest measures nonverbal fluid reasoning and general intelligence; subjects select one of five options that best completes a visual pattern. Reliability exceeds .92.
Fraction outcomes
To provide an index of postintervention achievement gaps (i.e., for which we required not-at-risk classmate comparison data—on whom only group-administered data were collected), we focused the present analysis on three group-administered measures representing a range of outcomes. To provide a measure on which the specialized intervention condition allocated more attention than the inclusion instructional condition (i.e., the measurement interpretation of fractions), we included Comparing Fractions from the Fraction Battery–2012–Revised (Schumacher, Namkung, Malone, & Fuchs, 2012). Comparing Fractions assesses magnitude understanding with 15 items, each of which shows two fractions. Students write the greater than, less than, or equal sign between the two fractions. The score is the number of correct answers. The maximum score is 15. Alpha on this sample was .84.
To provide a measure on which the inclusion condition allocated more attention than the intervention condition (i.e., fraction procedures), we administered two subtests of the Fraction Battery–2012–Revised (Schumacher et al., 2012). Fraction Addition includes five addition problems with like denominators and seven addition problems with unlike denominators. Six are presented vertically and six horizontally. Fraction Subtraction includes six subtraction problems with like denominators and six with unlike denominators; half are presented vertically and half horizontally. For each subtest, administration is terminated when all but two students have completed the test. Items are scored as 1 point for finding the correct numerical answer, 2 points if the item is appropriately reduced one time (seven items on addition and eight items on subtraction), or 3 points if the item is appropriately reduced two times (one subtraction item). We used the total score across these tests, which correlated at .83. The maximum score across the tests is 41. Alpha on this sample was .91 at pretest and .94 at posttest.
To index generalized learning about fractions, which was comparably distal for both conditions and addressed the measurement interpretation of fractions and the part–whole interpretation of fraction with equal emphasis, we administered 19 released items from 1990 to 2009 NAEPs: easy, medium, or hard fraction items from the fourth-grade assessment or easy from the eighth-grade assessment. Testers read each problem aloud (with up to one rereading upon student request). Eight items assess the part–whole interpretation (e.g., provided with a rectangle divided into six equal parts, the student is directed to shade 1/3), nine assess measurement interpretation (e.g., provided with four lists of three fractions, students are asked, “In which of the following are the three fractions arranged from least to greatest?”), one requires subtraction with like denominators, and one asks how many fourths make a whole. Students select an answer from four choices (11 problems), write an answer (three problems), shade a portion of a fraction (one problem), mark a number line (two problems), write a short explanation (one problem), or write numbers, shade fractions, and explain the answer (one problem with multiple parts). The maximum score is 25. Alpha on this sample was .83.
Results
Pretest Comparability of Inclusive Instruction Versus Specialized Intervention Students
See Table 2 for pretest means on the three fraction outcomes for inclusive instruction versus specialized intervention. Analyses of variance were conducted to assess pretest comparability on three measures for each year’s sample. In Year 1, F(1, 79) = 0.09, p = .764, on Comparing Fractions; F(1, 79) = 2.19, p = .143, on Calculations; and F(1, 79) = 0.65, p = .424, on NAEP. In Year 2, F(1, 65) = 0.19, p = .669, on Comparing Fractions; F(1, 65) = 0.00, p = .996, on Calculations; and F(1, 65) = 1.52, p = .222, on NAEP. In Year 3, F(1, 55) = 1.91, p = .172, on Comparing Fractions; F(1, 55) = 0.25, p = .621, on Calculations; and F(1, 55) = 0.55, p = .465, on NAEP.
Posttest Performance of Inclusive Instruction Versus Specialized Intervention Students
See Table 2 for posttest means on the three fraction outcomes for inclusive instruction versus specialized intervention students. To assess posttest differences between the service delivery conditions, we conducted a parallel set of analyses on the three measures for each year’s sample. We did not employ nested analyses to control for dependency due to students’ membership in classrooms because the intraclass correlations on the fraction outcome measures (estimated with SPSS MIXED, Version 20) were negligible to small (<.02). Also, note that students had been randomly assigned to study conditions at the individual level, and with 203 students drawn from 147 classrooms, there were few students per classroom.
Results indicated that posttest scores favored specialized intervention students over inclusive instruction students on each measure in each year. In Year 1, F(1, 79) = 42.34, p < .001, on Comparing Fractions (effect size [ES; difference in means divided by pooled standard deviation] = 1.67); F(1, 79) = 129.38, p < .001, on Calculations (ES = 2.54); and F(1, 79) = 10.03, p < .001, on NAEP (ES = 1.46). In Year 2, F(1, 65) = 9.38, p = .003, on Comparing Fractions (ES = 0.80); F(1, 65) = 40.67, p < .001, on Calculations (ES = 1.72); and F(1, 65) = 10.25, p = .002, on NAEP (ES = 0.83). In Year 3, F(1, 55) = 16.87, p < .001, on Comparing Fractions (ES = 1.17); F(1, 55) = 9.45, p = .003, on Calculations (ES = 0.87); and F(1, 55) = 3.40, p < .001, on NAEP (ES = 1.03). Across measures, the mean ES for Years 1, 2, and 3, respectively, were 1.89, 1.68, and 1.54. Across years, the means ES for Comparing Fractions, Calculations, and NAEP, respectively, were 1.21, 1.71, and 1.11.
Not-At-Risk Classmates’ Posttest Fraction Performance by Measure and Year
See Table 2 for pre- and posttest means on the three fraction measures for not-at-risk classmates. On posttest Comparing Fractions, the measure most proximal to the specialized intervention condition and reflecting the measurement interpretation of fractions, performance across the three RCTs increased: from a mean of 7.21 (SD = 3.27) in Year 1 to a mean of 9.97 (SD = 3.60) in Year 2 and to a mean of 11.23 (SD = 3.95) in Year 3. On posttest Calculations, the measure most proximal to inclusive instruction, performance across the three RCTs also increased: from a mean of 10.18 (SD = 4.84) in Year 1 to a mean of 14.43 (SD = 7.78) in Year 2 and to a mean of 19.21 (SD = 9.25) in Year 3. On posttest NAEP, the measure comparably representative of both the emphasis of part–whole interpretation of fractions in inclusive instruction and of the emphasis on measurement interpretation of fractions in specialized intervention, performance across the three RCTs again increased: from a mean of 14.69 (SD = 3.50) in Year 1 to a mean of 16.48 (SD = 4.04) in Year 2 and to a mean of 18.95 (SD = 3.81) in Year 3.
This pattern of annual improvement in the fraction performance on measures proximal and distal to the classroom instruction these inclusive not-at-risk classmates received is a strong index of the intensifying depth of coverage and challenge of fraction instruction as classrooms moved from the initial set of standards to CCSS.
Posttest Achievement Gaps: Inclusive Instruction Versus Specialized Intervention Students
To calculate posttest achievement gaps for inclusive instruction students, we subtracted the mean performance of inclusive instruction students from the mean performance of not-at-risk classmates and divided this difference by the not-at-risk classmates’ standard deviation. We did the same when calculating posttest achievement gaps for specialized intervention students. These achievement gaps are plotted in Figure 1 by condition, measure, and year. Note that positive values indicate higher posttest performance for very low performers compared to not-at-risk classmates.
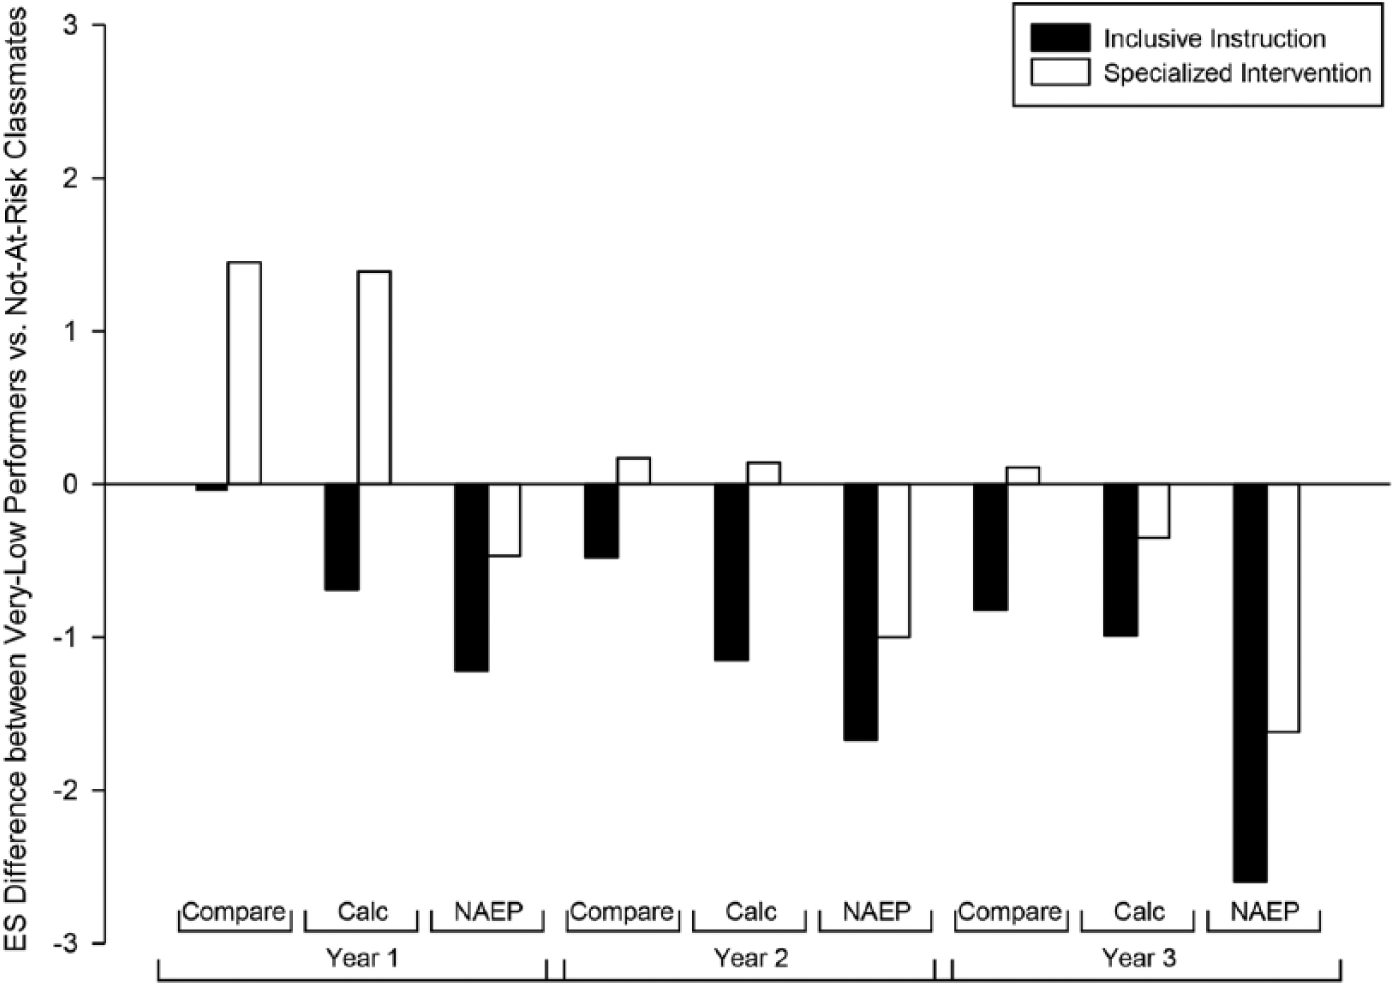
Very low performers’ posttest achievement gaps by condition, year, and measure.
Across measures, the mean posttest achievement gap (in ES, i.e., standard deviation, units) for inclusive instruction students in Years 1, 2, and 3, respectively, was −0.64, −1.10, and −1.47. By contrast, the mean posttest achievement gap for specialized intervention students in Years 1, 2, and 3, respectively, was +0.79, −0.23, and −0.62. Across years, the mean posttest achievement gap for inclusive instruction students on Comparing Fractions, Calculations, and NAEP, respectively, was −0.44, −0.94, and −1.42. By contrast, the mean posttest achievement gap for specialized intervention students on Comparing Fractions, Calculations, and NAEP, respectively, was +0.58, +0.39, and −1.03.
Discussion
The purpose of this analysis was to examine achievement in the domain of fractions for very-low-performing fourth-grade students (i.e., at or below the 10th percentile) as a function of whether these students receive inclusive fraction instruction or specialized fraction intervention and as the curriculum shifts to CCSS. Our goal was to draw implications for students with LD, whose achievement and intelligence profiles are similar to the students included in the present analysis. In this section, we first interpret the effects of service delivery option and then focus on achievement gaps as a function of service delivery option as well as CCSS. We then consider the limitations of the present analysis and draw implications for practice, including meaningful interpretation of access to the general education curriculum.
Effects of Inclusive Fraction Instruction Versus Specialized Fraction Intervention
In each of three RCTs, conducted in subsequent years, the posttest fraction performance of students who received specialized fraction intervention exceeded that of students who received inclusive fraction instruction—despite that the pretest fraction performance of these groups was comparable and that the amount of instructional time in the two conditions was similar. The between-group differences were robust, with large ESs obtained across measures. On Comparing Fractions, ESs ranged from 0.80 to 1.67. This might be expected because Comparing Fractions reflected the dominant focus of specialized fraction intervention on the measurement interpretation of fractions. Even so, this type of understanding about fractions is important. It predicts fraction learning between Grades 3 and 5 (Hansen et al., 2014; Jordan et al., 2013) and more advanced mathematics achievement, including algebra (e.g., Siegler et al., 2012).
Moreover, on the Calculations measure, to which inclusive instruction allocated substantially greater focus than did specialized intervention, ESs favoring specialized intervention were even larger, ranging from 0.87 to 2.54. Given that inclusive instruction allocated more time than specialized intervention to calculation instruction, this is notable. It indicates that inclusive students failed to respond adequately even from procedural classroom instruction. It also suggests that the measurement interpretation transfers to procedural skill, at least for adding and subtracting fractions (e.g., L. S. Fuchs et al., 2013; L. S. Fuchs, Schumacher, Sterba, et al., 2014; Hecht et al., 2003; Mazzocco & Devlin, 2008; Rittle-Johnson et al., 2001; Siegler et al., 2011).
Effects favoring specialized intervention over inclusive instruction were also large on the NAEP items. This measure represented the most generalized index of fraction performance for two reasons. First, compared to other study measures, the nature of questions and format of responses on the NAEP items were less aligned with the curriculum in the classroom or in intervention. Second, the NAEP items reflected both the dominant conceptual focus of both inclusive instruction (the part-whole interpretation of fractions) and specialized intervention (the measurement interpretation of fractions)—with equal emphasis. On this most generalized measure, effects favored the specialized fraction intervention condition over inclusive instruction, with ESs ranging from 0.83 to 1.46.
These results suggest strong added value for specialized intervention over inclusive instruction—at least in the domain of fractions, which is often deemed one of the most critical areas of elementary school mathematics and the most essential for subsequent school success (Siegler et al., 2012). And to the extent that findings may generalize to other academic domains, results have practical implications for students whose achievement profiles are similar to those in the present sample—including students with LD (D. Fuchs, Fuchs, & Compton, 2012). Results suggest the importance of specialized intervention for this population.
These results suggest strong added value for specialized intervention over inclusive instruction.
Findings echo those of L. S. Fuchs, Fuchs, Craddock, et al. (2008), which showed that although a state-of-the-art inclusive instructional program and a state-of-the-art specialized intervention both promote stronger mathematics word problem outcomes compared to typical inclusive word problem instruction, such specialized intervention is more active than such inclusive instruction in ameliorating initially at-risk students’ risk status. The present analysis adds to this prior study in an important way, because although the 2008 L. S. Fuchs, Fuchs, Craddock, et al. study sample was at risk, it was substantially higher performing than students in the present analysis. In fact, we identified no prospectively designed RCT (or previous retroactive analysis of an RCT) to isolate the effects of inclusive instruction from specialized intervention for the population of very-low-performing students focused in the present analysis.
Prospectively designed RCTs are needed to contrast the effects of inclusive instruction against specialized intervention for the kind of very low performers who were the focus of this analysis. These studies should specifically target students with LD and focus on a variety of curricular domains, including, for example, fractions, word problems, proportion, and algebra in mathematics and critical topics, such as the civil rights movement and the Great Depression, in informational text. Such prospective studies should also provide detailed classroom observations of the inclusive instructional program as well as levels of student engagement, classroom artifacts (e.g., homework and seatwork), and any supplemental support provided as part of inclusive instruction. Further, these studies should provide information about financial and logistical conditions schools use to provide specialized intervention. Such RCTs might feature a specialized intervention that reflects state-of-the-art understanding of the domain, as in the present analysis and as expected of validated specialized interventions. Other RCTs might control for state-of-the-art understanding of the domain across the inclusive-instruction and specialized-intervention conditions. In terms of inclusive instruction, such RCTs might feature typical practices to be broadly generalizable, as in the present analysis, or state-of-the-art Universal Design for Learning, accommodations, and co-teaching practices to reflect the ideal.
In the meantime, however, researchers might consider conducting secondary analyses of other previously conducted RCTs to contrast the subset of participants at or below the 10th percentile who received inclusive instructional programs versus specialized interventions. Pending additional findings from prospective and other retrospective studies, however, present findings, combined with the results of the other pertinent RCT we identified (L. S. Fuchs, Fuchs, Craddock, et al., 2008), indicate that practitioners should not assume that adequate student learning in response to inclusive reforms, such as Universal Design for Learning, instructional accommodations, and collaboration between general and special educators, represents a viable substitute for specialized intervention for very low performers, such as students with LD. Instead, results indicate the need to systematically monitor the progress of these students and, if inadequate response is revealed, the need for specialized intervention.
Achievement Gaps of a Function of Service Delivery Option and CCSS
We also examined the posttest achievement gaps of these very-low-performing students as the depth and degree of challenge of classroom fraction instruction increased over the three RCTs. One clear, objective indicator of the inclusive fraction program’s increasing depth and challenge was the not-at-risk classmates’ dramatic gains in fraction performance over the 3 years in which the RCTs were conducted. In this timeframe, which corresponds to the district’s shift toward CCSS, not-at-risk classmates increased their scores more than one standard deviation on all three fraction measures: Comparing Fractions, Calculations, and NAEP. This impressive achievement speaks to the potential power of CCSS to enhance learning for not-at-risk students.
At the same time, however, CCSS’s intensified depth of coverage and challenge further presses the resources of the inclusive instructional setting to address very low performers’ needs more appropriately, even as the enhanced outcomes of classmates creates a more ambitious frame of reference for judging the achievement levels required of very-low-performing students. That is, as not-at-risk classmates’ learning increases, very-low-performing students’ learning must improve that much more. Otherwise, achievement gaps widen.
This is exactly what happened to students who began fourth grade at or below the 10th percentile and participated in inclusive fraction instruction. Over the same 3-year timeframe, in response to the same inclusive instruction their not-at-risk classmates received, very low performers demonstrated stronger rates of learning from Year 1 to Year 2, an increase in ES of approximately one third of a standard deviation. This rate of improvement from Year 1 and 2, however, failed to keep pace with the rate of improved learning for not-at-risk classmates. More disturbingly, as CCSS implementation increased from Year 2 to Year 3, the rate of learning of very-low-performing students came to a halt, as the achievement of their not-at-risk classmates continued to grow.
So as the depth of coverage and challenge of fraction instruction intensified with the transition toward CCSS, the achievement gaps of very low performers who were served by inclusive instruction increased from a posttest deficit of 0.64 standard deviations in Year 1 to 1.10 in Year 2 to 1.47 in Year 3. This widening achievement gap for very low performers who received the same inclusive instruction as their classmates was similar for the three measures. From Year 1 to Year 3, the achievement gap grew from −0.01 to −0.82 standard deviations on Comparing Fractions; from –from 0.69 to −0.99 standard deviations on Calculations; and from −1.22 to −2.60 standard deviations on the NAEP items.
It is important to note that over the same timeframe, achievement gaps for students participating in specialized intervention also grew. This was the case even though the challenge of the specialized intervention curriculum also increased over this timeframe. Averaged over the three measures, the gap increased from a posttest advantage over not-at-risk classmates of 0.79 standard deviations in Year 1 to a deficit of 0.23 in Year 2 to a deficit of 0.62 in Year 3. That very-low-performing specialized intervention students should outperform not-at-risk classmates in Year 1 is a clear indication that the inclusive instructional program during the initial standards era lacked depth and challenge for not-at-risk students—even as very-low-performing inclusive students responded poorly to that inclusive program. This is reflected in their Year 1 achievement gap of −0.64 standard deviations.
Yet, as the fraction program transitioned to CCSS and not-at-risk students’ learning began to increase, specialized-intervention students began to register larger deficits relative to not-at-risk classmates. On the one hand, these achievement gaps of 0.23 standard deviations in Year 2 and 0.62 standard deviations in Year 3 were dramatically smaller than those registered for very-low-performing inclusive students (i.e., 1.10 standard deviations in Year 2 and 1.47 standard deviations in Year 3). Also, in absolute terms, the posttest performance of specialized-intervention students remained strong, compared to their own pretest performance and compared to very-low-performing inclusive instruction students. On the other hand, the growing deficits of very low performers relative to not-at-risk classmates, even with specialized intervention, suggest that with CCSS reform, specialized intervention will require greater intensity to realize the gains necessary for very low performers to keep pace. In the present study, specialized intervention occurred only three times per week for 30 to 35 min per session for 12 weeks.
Limitations
In the RCTs analyzed in this article, specialized intervention provided carefully designed, complex instructional routines that relied on explicit instruction and state-of-the-art understanding of the domain. This involved a dominant focus on the measurement interpretation of fractions, which is thought to be a key mechanism in explaining fraction learning. By contrast, inclusive instruction focused on part–whole understanding, which has been the dominant instructional focus in the United States. This was a key difference between inclusive instruction and specialized intervention throughout the three RCTs—despite that CCSS, and even the initial state standards to a lesser but clear extent, emphasizes the measurement interpretation of fractions. Although this distinction in conceptual focus may help explain differential learning in the specialized-intervention condition, it is important to remember that an important characteristic of validated, specialized intervention is that it represents state-the-art understanding of the domain.
Even so, the question arises, Why did inclusive instruction teachers maintain a dominant emphasis on part–whole interpretation of fractions, when CCSS (and to a lesser extent, traditional standards) explicitly directed them toward the measurement interpretation of fractions? One possible explanation is that fourth-grade teachers’ own understanding of fractions and their pedagogical knowledge of fractions may not be as strong as necessary to support conceptual realignment of the curriculum.
Such a possibility is supported by the Institute for Education Science’s Middle School Mathematics Professional Development Impact Study (Garet et al., 2014), an RCT that evaluated the effects of 2 years of relatively intensive, ongoing professional development on rational numbers (i.e., fractions, decimals, ratios, percentages, and proportions) among a large sample of seventh-grade teachers in multiple districts and with two well-accepted approaches to professional development. Results indicated no significant effects on teacher understanding of rational numbers or their knowledge about teaching rational numbers (ES = 0.05) and no significant effects on their students’ rational number achievement (ES = −0.01). This suggests that realigning teachers’ instructional expertise may represent a substantial undertaking. By contrast, the form of specialized intervention used in this analysis’s RCTs provides the kinds of instructional guides that clearly explicates how to provide instruction that reflects state-of-the-art understanding of the domain. This problem may be more pertinent for challenging curricular content, such as fractions, in inclusive instructional settings. However, a recent synthesis (Gersten, Taylor, Keys, Rolfhus, & Newman-Gonchar, 2014) suggests the problem may pertain more widely, at least across mathematics content.
A second limitation of the present analysis is that the RCTs did not collect observational data on the nature of inclusive instructional practices; this includes the nature of the supplemental instruction the inclusive programs provided. As already noted, prospectively designed RCTs should include such classroom observations. Such RCTs should also feature specialized intervention that reflects state-of-the-art understanding of the domain, as in the present analysis and as expected of validated specialized interventions. And other RCTs should control for state-of-the-art understanding of the domain across the inclusive-instruction and specialized-intervention conditions.
From the present analysis, we draw two conclusions about what is required if schools are to deliver on the CCSS promise of college and career readiness for very-low-performing students, such as students with LD. First, specialized intervention will be required for many if not most of these students. Second, such intervention will need to be intensified beyond the level provided in these RCTs.
Implications for Practice: Meaningful Access to the General Education Curriculum
From the present analysis, we draw two conclusions about what is required if schools are to deliver on the CCSS promise of college and career readiness for very-low-performing students, such as students with LD. First, specialized intervention will be required for many if not most of these students. Second, such intervention will need to be intensified beyond the level provided in these RCTs. This may be accomplished by conducting state-of-the-art validated intervention, based on principles of explicit instruction, for additional instructional time or with smaller group size. It might also be achieved by using data-based individualization in conjunction with state-of-the-art validated intervention.
These two conclusions raise important issues about the meaning of access to the general education curriculum—at least for students similar to those included in the present analysis, such as students with LD. One issue concerns schools’ common misinterpretation of the access mandate as requiring students with disabilities to receive their instruction in the inclusive setting, alongside their classmates without disabilities, with the goal of ensuring exposure to the same high standards.
All this argues for a definition of access to the general educational curriculum that is based on empirical evidence of adequate learning—regardless of the setting in which or the instructional methods by which that learning is achieved.
As illustrated in our results, however, neither location nor exposure is synonymous with access. Moreover, although not addressed in the present analysis, access cannot be assumed even when inclusive instruction reflects state-of-the-art accommodations and support. Instead, only evidence of adequate student outcomes demonstrates that access to the curriculum has been accomplished. In fact, the present analysis indicates that such access is sometimes more satisfactorily achieved under a service delivery arrangement that occurs outside the physical space of the inclusive program and using instructional methods that differ from the inclusive program. All this argues for a definition of access to the general educational curriculum that is based on empirical evidence of adequate learning—regardless of the setting in which or the instructional methods by which that learning is achieved.
Before closing, we emphasize a related point that requires practitioners’ attention. Achieving meaningful access for very-low-performing students, such as students with LD, often requires a combination of grade-level curriculum and an instructional focus on out-of-grade-level foundational skills. In the RCTs we have described, this was not necessary because whole-number logic is at odds with key fraction principles (Ni, 2001; Ni & Zhou, 2005). For example, there is no counting sequence for fractions, the density of fractions on any segment of the number line is infinite, and fractions increase in magnitude as denominators increase for the same numerator. Specialized intervention in our RCTs could therefore target fractions without addressing these very low performers’ whole-number deficits. Yet, even in our specialized fraction intervention, the range of denominators was restricted (in line with CCSS but in contrast to the inclusive program’s curriculum). The goal of this narrowing of the general education program was to ease the press on very low performers’ whole-number multiplication and division deficits and thereby permit consolidation of “big ideas” about fractions.
In more dramatic fashion, however, there are relatively few opportunities in the curriculum for such a “fresh start,” when earlier skills in the academic domain are not prerequisite for learning the next instructional target. Most commonly, it is not possible to ignore students’ foundational skill deficits if progress toward CCSS is to be realized. For example, to demonstrate meaningful improvement with informational text, specialized intervention must address very low performers’ decoding, word recognition, and vocabulary deficits, and this often requires out-of-level foundational skills instruction. Therefore, although reconceptualizing access as empirical demonstration of learning, schools must also recognize that the access mandate often requires schools to provide out-of-level instruction to meet students’ needs for accessing the grade-level curriculum.
Footnotes
Authors’ Note
This research was supported in part by Grant R324D130003 from the Institute of Education Sciences in the U.S. Department of Education to Vanderbilt University, by Grant R324C100004 from the Institute of Education Sciences in the U.S. Department of Education to the University of Delaware with a subcontract to Vanderbilt University, and by Core Grant HD15052 from the Eunice Kennedy Shriver National Institute of Child Health and Human Development Vanderbilt University. The content is solely the responsibility of the authors and does not necessarily represent the official views of the Institute of Education Sciences, the U.S. Department of Education, the Eunice Kennedy Shriver National Institute of Child Health and Human Development, or the National Institutes of Health.