
Abstract
The authors conducted 324 full-class-length observations of 108 high school students with severe disabilities in general education classes, focusing analyses on how often students were present during class and in proximity to peers without disabilities. Students were not present for a substantial proportion of the classes in which they were enrolled, and they were infrequently in proximity to classmates without disabilities when they were present. Observations of a comparison group of peers without disabilities enrolled in these same classrooms suggest missed social opportunities for students with severe disabilities. We also found that primary disability category (i.e., autism spectrum disorder, intellectual disability) and type of class (i.e., academic, other) were associated with different patterns of presence and proximity.
The educational placement of students with severe disabilities has changed dramatically since the inception of federally mandated special education services more than 3 decades ago. Originally taught almost entirely in separate schools, many students with severe disabilities were soon integrated into their neighborhood schools but served primarily in self-contained special education classrooms (Polloway, Patton, Smith, & Buck, 1997). Driven by an array of legislative, policy, and research initiatives throughout the 1990s and 2000s, increasing numbers of students with severe disabilities began spending at least a portion of their school day in general education classes alongside their peers without disabilities (McLeskey, Landers, Williamson, & Hoppy, 2012). A primary metric for documenting this evolution in educational environments has been state-level placement data collected annually by the U.S. Department of Education. Although not disaggregated by severity of disability, 2013 Individuals With Disabilities Education Act Part B data reports indicated 58% of students with autism spectrum disorder (ASD), 44% of students with intellectual disability (ID), and 29% of students with multiple disabilities were enrolled in regular classes 40% or more of their school day. Conversations about where students with severe disabilities should spend their school day and why they should be included in general education classes still remain prominent in current policy and practice discussions (e.g., Ryndak, Jackson, & White, 2013).
Two principle reasons proffered for including students with severe disabilities in general education classes are to enhance their learning and to promote interactions with peers without disabilities (Jackson, Ryndak, & Wehmeyer, 2008/2009). Although one purpose of education is to provide strong instruction on relevant skills, a central argument for the inclusion of students with disabilities in general education is the opportunity it provides students to participate in social interactions and shared learning with their peers without disabilities (Carter, Bottema-Beutel, & Brock, 2014). For many students with severe disabilities, individualized education programs (IEPs) emphasize progress on communication and social outcomes (Kwon, Elicker, & Kontos, 2011). Without opportunities to practice communication and social skills in authentic contexts with same-age peers, it is unlikely students will make substantial progress on these goals. Peer relationships also become especially important during adolescence and are considered a vital part of the high school experience because of their contributions to the development of social and communication skills, supportive relationships, increased quality of life, a sense of belonging, and the potential for future success (Carter & Hughes, 2013; Ryan & Ladd, 2012). However, many high school students with severe disabilities spend the majority of their days almost exclusively in the company of special educators, paraprofessionals, and various related service providers and have few interactions with peers without disabilities (Carter, Sisco, Brown, Brickham, & Al-Khabbaz, 2008; Wagner, Cadwallader, Garza, & Cameto, 2004). As a result, they may miss opportunities to develop connections and form friendships with other students that can make school enjoyable, prepare them to be successful in the community, and contribute to overall well-being.
Put simply, interactions with general education classmates are impossible if students with disabilities are not physically present in these classes.
If expanding social opportunities is a prominent rationale for including students with severe disabilities in general education classes, it is important to consider two factors that provide the necessary (but not sufficient) context for peer interactions to occur in these settings. First, students with severe disabilities must actually be present in the general education classrooms in which they are enrolled. Put simply, interactions with general education classmates are impossible if students with disabilities are not physically present in these classes. Even when enrolled in general education courses, students with severe disabilities may not attend consistently, arrive on time, or stay through the end of class. In their observational study of elementary school general education classes, Chung, Carter, and Sisco (2012) found that students with severe disabilities who used augmentative and alternative communication were not present in their general education classes for an average of almost one fifth of scheduled instructional time. Although the reasons for their absence may be multiple (e.g., students are receiving pull-out therapies, students come late to avoid navigating crowded halls, students leave early because of behavioral challenges), these students are missing a myriad of peer interaction opportunities because they are not present in the classroom learning alongside their classmates without disabilities. Although data on educational placement typically focus on the proportion of the school day that students are enrolled in general education classes (McLeskey et al., 2012; U.S. Department of Education, 2013), these data overlook the strong possibility that students with severe disabilities may be inconsistently present in these classrooms. To date, studies have not addressed the actual presence of adolescents with severe disabilities in high school classrooms.
Second, students with severe disabilities must be in close physical proximity to peers without disabilities to participate in sustained interactions within inclusive classrooms. Being present in a general education classroom but sitting on the periphery of the classroom with an individually assigned paraprofessional can severely limit the opportunities students have to converse with peers, practice social skills, or develop relationships with their classmates (Carter et al., 2008; Giangreco, 2010). In their observational study, Chung et al. (2012) found that elementary students with severe disabilities were in proximity (i.e., within 3 feet or readily reachable distance) to general education classmates for an average of just 58.5% of the class period. Moreover, the vast majority of interactions students with severe disabilities had in these classrooms involved the staff person assigned to support them, such as a paraprofessional or special educator. Similarly, Carter, Hughes, Guth, and Copeland (2005) examined factors associated with the social interactions of high school students with ID. They found proximity of peers to be an influential factor in the occurrence and quality of peer interaction. Unfortunately, little is known about the extent to which high school students with severe disabilities work in proximity to classmates within inclusive classes.
The amount of time students with severe disabilities are present in their general education class and the extent to which they learn in close proximity to peers without disabilities could be influenced by several factors. In the present study, we examined whether both presence and proximity vary by students’ primary special education category (i.e., ASD vs. ID) or the type of general education class (i.e., core academic or nonacademic) in which they are enrolled. For example, presence in inclusive classrooms might be more restricted for students with ASD who sometimes engage in challenging behaviors or have difficulty navigating busy hallways during passing periods, both of which might lead to late arrivals to or early departures from class. Similarly, students may present less often in classes viewed as having greater academic demands (e.g., math, science, language arts) than in courses perceived to be less academically challenging (e.g., electives, related arts). Such possible influences have not been explored in prior studies.
This descriptive study focused on the presence and peer proximity of high school students with severe disabilities in general education classrooms. Specifically, we sought to address the following research questions: (a) To what extent are high school students with severe disabilities present in the general education classrooms in which they are enrolled? (b) To what extent are high school students with severe disabilities in proximity to peers without disabilities in these classrooms? (c) To what extent do the patterns of presence and proximity change over the course of a class period? (d) How is this presence and proximity associated with student factors (i.e., ASD or ID diagnosis) and classroom factors (i.e., type of class)? (e) To what extent do students without disabilities interact with peers in these same classrooms? This latter question was intended to address the peer interaction opportunities students with disabilities might be missing when not in proximity to peers or when absent from their general education classes.
Method
Participants
Participants included 108 high school students with severe disabilities. These students were drawn from participants involved in the preintervention phase of a large-scale project focused on increasing the social and academic participation of adolescents with severe disabilities. To be included in the present analyses, students had to (a) have a primary diagnosis of ASD or ID, (b) be eligible for their state’s alternate assessment (i.e., designed for the 1% to 2% of students with the most significant disabilities who are unable to meaningfully participate in statewide assessments, even with accommodations), (c) be enrolled in at least one general education class (with the exception of physical education), (d) receive direct support from a paraprofessional or special education teacher in that general education class, and (e) be involved in the first 2 years of the overarching project. Their average age was 16.5 years (range 14–20 years); 63.9% were male and 36.1% were female. The majority (70.4%) was European American, 13.9% were African American, 7.4% was Asian American, 0.9% were Hispanic or Latino, and 7.4% were of other races or ethnicities (e.g., Afro-Brazilian, Albanian, Pacific Islander/Hawaiian). Most students (57.4%) were served under the primary special education category of ID, and 42.6% had a primary category of ASD. The average composite standard score on the Vineland Adaptive Behavior Scales–II (Sparrow, Cicchetti, & Balla, 2005) completed by teachers was 62.5 (SD = 12.3). These scores reflect ratings that are 2.5 standard deviations below the mean and are considered “low” ratings. Average standard scores on the Social Skills Improvement System (Gresham & Elliot, 2008) completed by teachers were 80.2 (SD = 15.5) for social skills and 119.6 (SD = 14.9) for problem behaviors. Students varied in grade level, with 24.1% in ninth grade, 39.8% in 10th grade, 23.1% in 11th grade, and 13.0% in 12th grade. More than one quarter (29.6%) of participants were reported to be eligible for free or reduced-price meals (see Table 1).
Participant and Classroom Demographics.
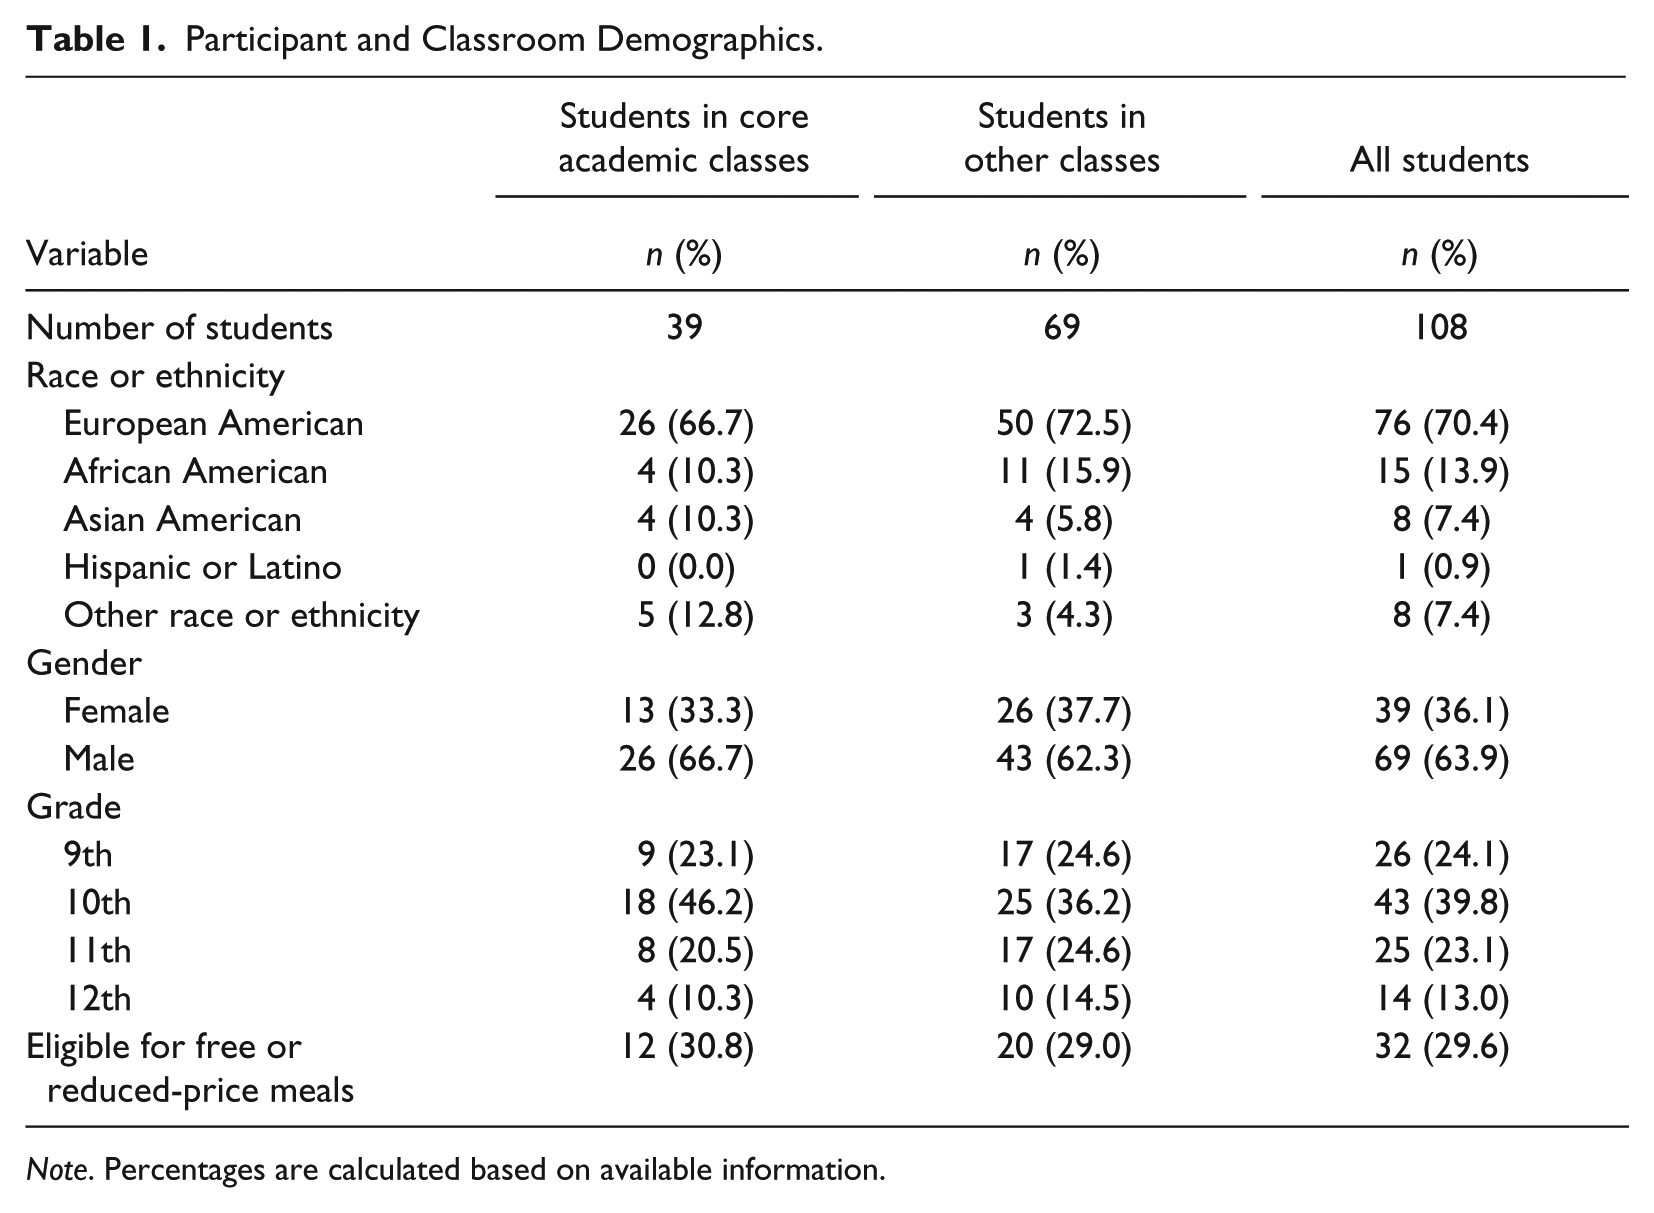
Note. Percentages are calculated based on available information.
Schools and Classrooms
After receiving institutional review board and district approval, we recruited high schools from two states (one midwestern and southern) using identical procedures. We extended invitations to high schools located in districts surrounding each of the two participating universities. We worked with staff at each school to identify all students meeting study criteria (see Participants section) and obtained consent and assent from study participants. Participating students attended 21 different high schools across two states. Average student enrollment was 1,322 (range 513–2,086). Average race or ethnicity of enrolled students across schools was 73.7% European American, 13.1% African American, 6.9% Hispanic or Latino, 4.0% Asian American, and 0.3% American Indian. More than one quarter (28.3%) of students were eligible for free and reduced-price meals.
We observed each student with severe disabilities three times in one general education classroom during one semester. When students were enrolled in more than one general education course, we selected one observation setting based on scheduling considerations and input from school staff. Thirty-nine students (36.1%) were observed in core academic classes (i.e., courses focused on the disciplines of math, science, language arts, or social studies), and 69 students (63.9%) were observed in elective and related arts classes (e.g., music; chorus; band; art; theater; dance; digital arts, media, or journalism; computer technology; health and wellness; culinary arts or foods). This pattern is consistent with other studies addressing the enrollment of students with autism and ID (Newman, 2007; Yu, Newman, & Wagner, 2009). The average length of these classes was 59.2 min (SD = 19.7), and the average enrollment was 24.4 students (SD = 7.4). With only a few exceptions, all of the students with severe disabilities were accompanied by paraprofessionals to these classes. Based on peer comparison observations (see next section), the most common instructional formats in these classrooms were large-group instruction (M = 40.2%; SD = 38.4%), independent work (M = 39.0%; SD = 39.5%), small-group instruction (M = 12.4%; SD = 27.0%), and no instruction (M = 7.1%; SD = 10.9%).
Measures and Observation Procedures
For each student with a severe disability, we observed three full-length classes toward the beginning of the semester. These observations occurred over a 2- to 3-week period, beginning at least 2 weeks into the semester. To include observational data in our project, participants had to be in the classroom for at least 20 min. If a student did not show up to his or her general education class (due to absence at school or other reasons) or stayed there less than 20 min, we rescheduled the observation. We used tablet computers equipped with MOOSES (Multi-Option Observation System for Experimental Studies; Tapp, 2012) to collect durational (e.g., proximity, instructional format) and frequency (e.g., initiations, responses) data in real time (i.e., second by second). For the current analysis, we were interested in just three variables: (a) the presence of students with severe disabilities in the general education classrooms in which they were enrolled, (b) the proximity of students with severe disabilities to their peers without disabilities in those classrooms, and (c) the occurrence of interactions a normative sample of peers without disabilities had in these same classrooms. Presence was defined as being present in the classroom between the start and end bells (i.e., not gone). We coded six mutually exclusive and exhaustive instructional formats: large group, small group, one-to-one adult, independent work, no instruction, and gone. For example, gone would be coded when the student had not yet arrived to class at its start, permanently left the classroom before its end, or left the room temporarily for more than 5 s. Proximity to peers was defined as a peer without severe disabilities being located within a body orientation, distance, and position that allowed for easy interaction with the focus student (i.e., about 3 feet or within reachable length). In other words, a classmate is in a position that would allow him or her to interact with the focus student easily (e.g., facing toward each other or sitting next to each other and facing the same direction).
To estimate the typical social interaction opportunities existing within these classrooms, we coded all social interactions of a normative sample of peers without disabilities enrolled in the same classrooms. Peer comparison data were collected at the beginning of the semester in half of the classrooms in which students with severe disabilities were enrolled (55 total observations). In these peer comparison observations, observers selected peers who (a) did not have severe disabilities and (b) were in close enough proximity to the observer to allow for accurate observation. One peer was chosen for the first half of the class, and a different peer was observed for the second half of class. The observations were combined to form a single full-class length observation. Interactions were defined as any verbal or nonverbal (e.g., signs, gestures) communicative behaviors directed toward any classmate. We used event recording to capture every conversational turn (i.e., both initiations and responses) but did not capture interactions with adults or note whether student interactions were prompted. Each initiation and response was coded as task related or social related. Task-related interactions addressed activities, materials, or expectations related to the current class. Social-related interactions addressed all other topics (e.g., social amenities, other classes, out-of-school activities) unrelated to the class in which students were enrolled. Apart from these topic-related distinctions, we did not code whether interactions were appropriate versus inappropriate to the context.
Observer Training and Agreement
All observations were completed by a team composed of graduate students and faculty in special education and school psychology. Observers read and discussed the coding manual, which included definitions, examples, and nonexamples. Before independently completing observations, observers were required to (a) take two written quizzes, scoring 90% or higher on each; (b) code training videos, scoring 90% agreement or higher against a master coding file; and (c) achieve 80% agreement or higher with an experienced observer in a live classroom setting. Observers were then considered trained and allowed to complete observations on their own.
We assessed interobserver agreement during approximately one third of observations, balanced across classrooms and observers. A second observer independently recorded information at the same time as the primary observer. Duration-based codes (i.e., gone and proximity) were compared on a second-by-second basis; total percentage of agreement was derived by dividing the number of seconds of agreement by the total number of seconds and multiplying by 100%. Kappa was also calculated. Average agreement for gone was 98.4% (range 54 to 100%; kappa = 0.976), and average agreement for proximity to peers without disabilities was 97.0% (range 49 to 100%; kappa = 0.964). Point-by-point agreement was calculated for interaction data. Agreements were scored when the same code appeared within a 5-s window in the secondary observer’s file; unmatched codes were scored as disagreements. Because interactions were originally coded based on function (i.e., initiation, response), topic (i.e., task, social), and source (i.e., peer to classmate, classmate to peer) before being collapsed to all task- or social-related interactions in which a peer was involved, interobserver agreement was calculated at the original level. Average overall agreement for these eight individual measures ranged from 94.9% for task-related initiations by peers to 80.1% for social-related responses from classmates.
Data Analysis
Presence and proximity data
To examine how students’ presence in the classroom and proximity to peers changed over the course of each class period, we divided each observation into 100 equal intervals and used momentary time sampling to determine status on each measure based on the percentage of time that had elapsed in class. These intervals ranged in length from 13.2 to 61.4 s. We opted to use percentage-based intervals (instead of fixed-length intervals, such as 30 s) because classes varied in overall length and our interest was in aggregating across observations to generate patterns based on elapsed time within the class period. This required us to convert and export data files from the MOOSES program into an Excel spreadsheet specifically designed for this analysis. We programmed the Excel file to determine whether the student was present in the classroom or in proximity to peers at the end of each of the 100 intervals (i.e., percentage of elapsed class time).
For our presence measure, the Excel spreadsheet scanned the data file to see whether the code for gone was toggled on at the end of each percentile of the class. If it was, a 0 was entered for that percentile of the class period. If another instructional format was toggled on (e.g., large group, small group, no instruction), a 1 was entered for that percentile of the class period to indicate the student was present in the classroom. For our proximity-to-peers measure, the same approach was used. We programmed the Excel spreadsheet to scan the data file to see whether the code for proximity to peers was toggled on at the end of each percentile of the class. If the student was not in proximity to any peers, a 0 was entered; otherwise, a 1 was entered to indicate peer proximity.
We created figures displaying the patterns of presence and proximity across the class period using the series of 0s and 1s generated for each of the 100 percentage intervals. For each percentage of the class period, we also calculated and plotted in a line graph the percentage of all 324 observations (108 students with three observations per student) in which the student with severe disabilities was present in the classroom or in proximity to peers without disabilities. Thus, each segment of the lines indicates the percentage of observations in which participating students were present or in proximity (y-axis) at a given point of the class period (x-axis). In addition, we summarized data by quarters of the class period as well as the overall class.
Interaction data
We used a similar approach to document patterns of peer interaction in our normative sample. Because interactions were captured using frequency counts, we used partial-interval recording to capture whether a peer interaction occurred at any point during each of the same 100 equal intervals of the class period. This required us to convert and export data files from the MOOSES program into a different Excel spreadsheet specifically designed for this analysis. We programmed the Excel file to determine whether the peer had a social- or task-related interaction with a classmate at any point during each of the 100 intervals. A 0 was entered if an interaction was not observed; a 1 was entered if an interaction did occur. We created figures displaying the patterns of peer interaction across the class period using the series of 0s and 1s generated for each of the 100 percentage intervals. For each percentage of the class period (x-axis), we calculated and plotted the percentage of all 55 observations (y-axis) in which the peer conversed with others in the class. In addition, we summarized data by quarters of the class period as well as the overall class.
Results
Presence in the General Education Classroom
Across observations, students with severe disabilities were observed to be present in their general education classes for an average of 84.2% (range 20% to 100%) of the actual class period (see Table 2). Arraying these data over the duration of class indicates a pattern in which fewer students are present toward the beginning (i.e., arriving late) and end (i.e., leaving early) of these class periods. The highest levels of presence are apparent in the middle of these classes. As shown in Figure 1, students were actually present at the start of class in just 69.1% of observations. The percentage of observations in which students were present peaked at 94.1% after about two fifths of the class period had elapsed, steadily declining throughout the rest of the observation time. Across observations, students were present in the classroom just 56.2% of the time during the final percentage interval of these classes. When dividing classes into four segments, students with disabilities were present in the general education classroom an average of 84.1% of all intervals across observations during the first quarter, 93.1% of all intervals during the second quarter, 88.8% of all intervals during the third quarter, and 70.9% of all intervals during the last quarter of the class period.
Summary of Student Variables by Class Type, Disability Type, and Across All Students.
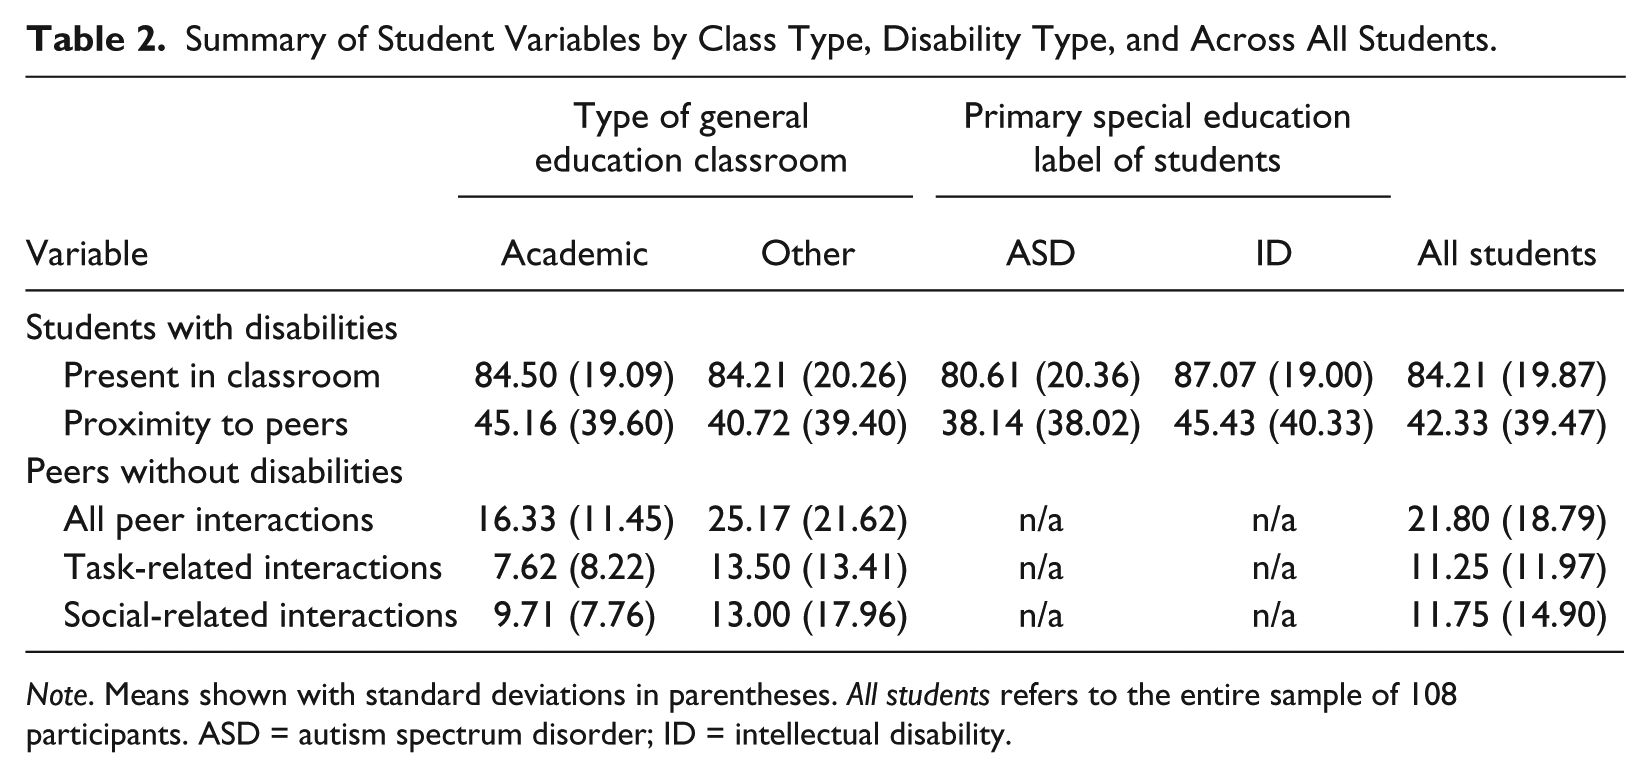
Note. Means shown with standard deviations in parentheses. All students refers to the entire sample of 108 participants. ASD = autism spectrum disorder; ID = intellectual disability.
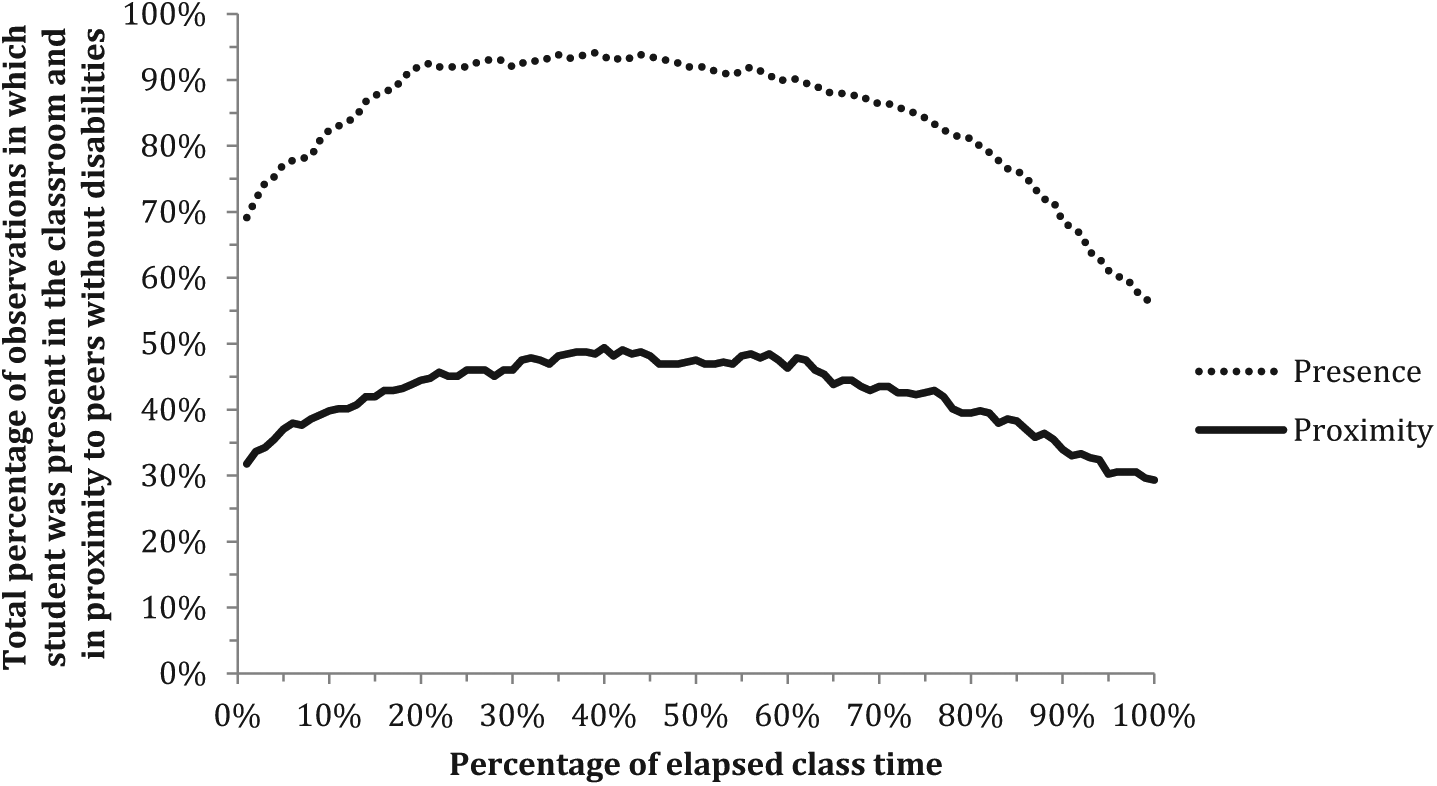
Percentage of students with severe disabilities who are present in the general education classroom and in proximity to peers without severe disabilities by percentage of elapsed time in the class period.
We also looked at these patterns based on the type of class (i.e., academic vs. other) and the primary disability category of the student with severe disabilities (i.e., autism vs. ID). Visual analysis of patterns suggests no differentiation in the patterns of presence across the class period based on type of class (see Figure 2). Overall, students with severe disabilities were present in academic classes for an average of 84.5% (range 33% to 100%) of the total class period and present in elective and related arts classes for 84.2% (range 20% to 100%) of the class period.
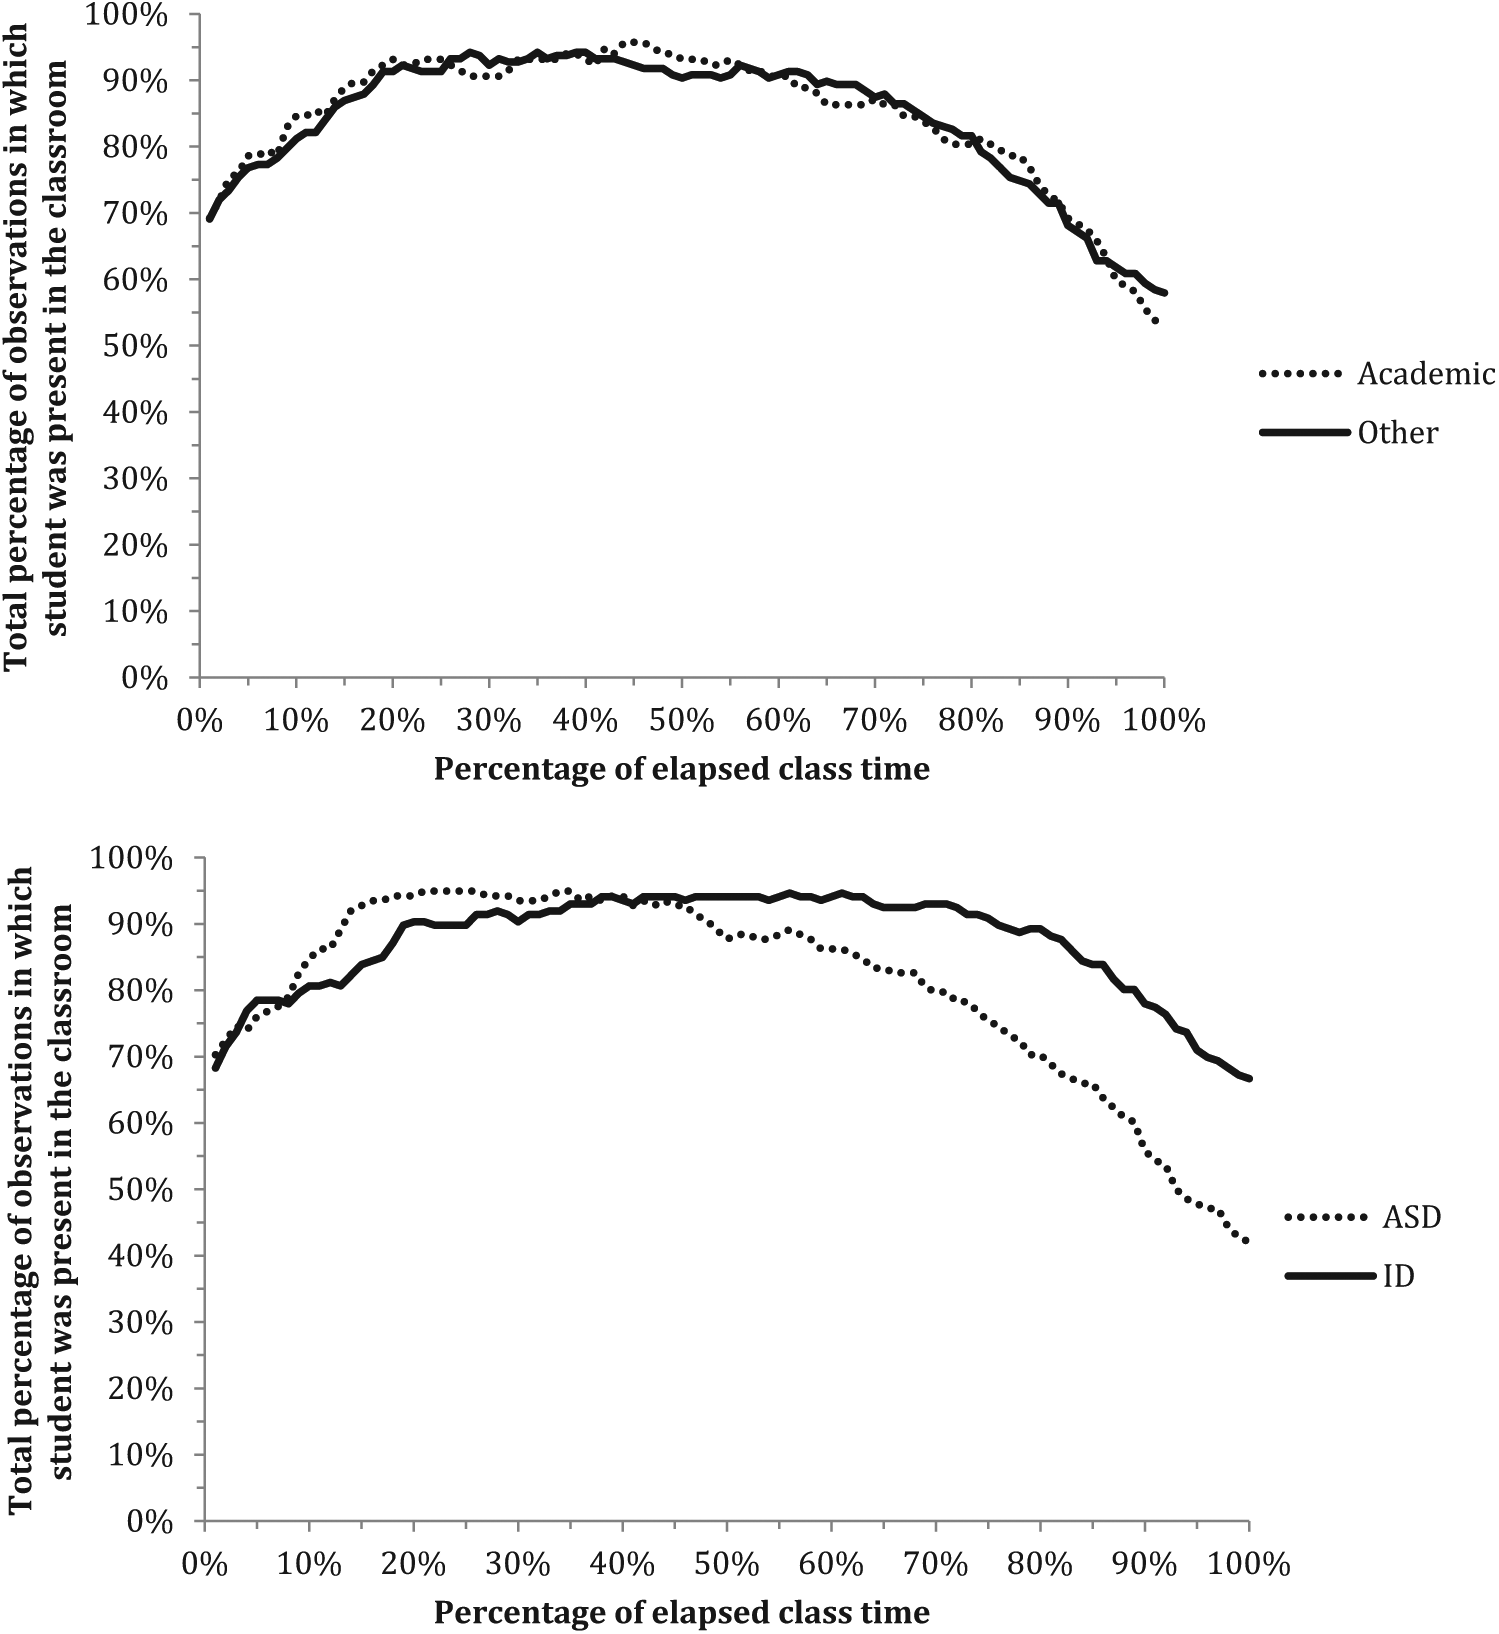
Top panel displays the presence of students with severe disabilities in general education classes based on type of class (i.e., core academic classes vs. other classes). Bottom panel displays presence based on primary disability category (i.e., autism vs. intellectual disability).
When examining data based on primary disability diagnosis, we found that some differences were visually apparent (see Figure 2). Overall, students with a primary label of ID were present in these classrooms 87.1% (range 28% to 100%) of the overall class period, whereas students with autism were present an average of 80.6% (range 20% to 100%) of the time. Although patterns of presence were similar toward the beginning of these classes, differentiation became apparent around the midpoint of these classes, with a higher proportion of observations in which students with autism were gone from the classroom relative to students with ID. For example, during the last interval of these classes, students with autism were present in the classroom during just 44.8% of observations compared to 67.2% of observations focused on students with ID.
When reviewing individual data, we noticed five different participation patterns of students on this variable. We display an example of each in Figure 3 using individual student data for a single class period. The first pattern involved arriving late to class but generally staying throughout the remainder of the class period (i.e., “late comers”). The second pattern involved arriving for the start of class but consistently leaving early before the final bell (i.e., “early leavers”). The third pattern involved both coming late and leaving early, being present only for some portion of the middle of class (i.e., “middle”). The fourth pattern was reflected in students who stayed the entire class (i.e., “always there”). The fifth pattern involved coming and leaving at various times without a clear pattern (i.e., “inconsistent attenders”). A sixth profile—which was not directly observed in this project but was still evident at these schools—involved students who were enrolled in a general education classroom but never actually attend (“absentees”). Because we did not collect data on days when participants were not present for at least 20% of the class period, such profiles are not reflected in our data. However, it became evident during the recruitment process that some potential student participants were enrolled in general education classrooms with the registrar but rarely attended these classes.
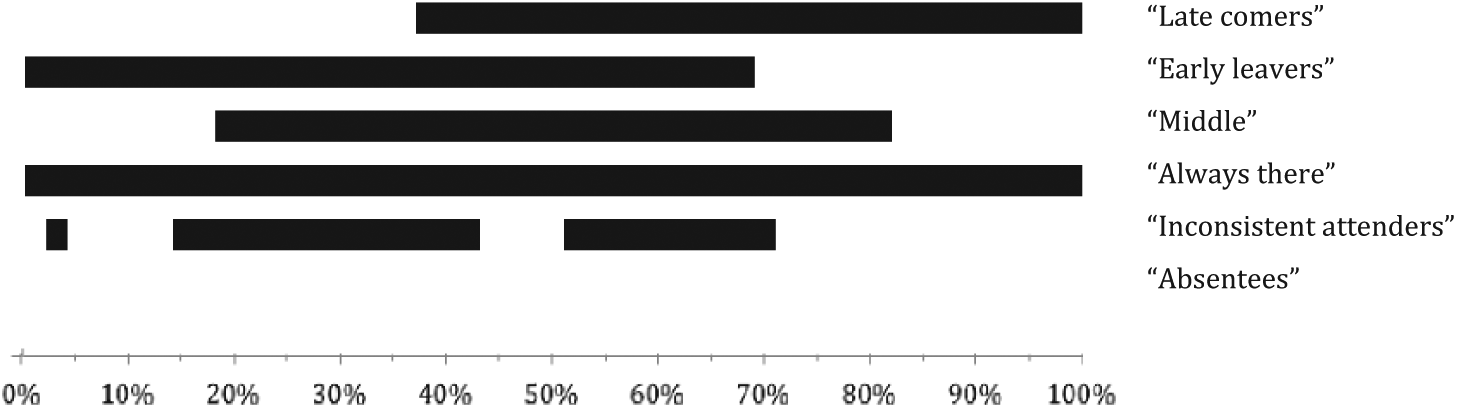
Example profiles of the patterns in which individual students were present in a classroom during a single class period. Black bars represent time present in the classroom. White space refers to time gone from the classroom. Percentages refer to amount of elapsed class period.
Proximity to Peers Without Severe Disabilities
We found that students with severe disabilities spent most of each general education class period out of proximity to their classmates without disabilities. Specifically, students were in proximity to at least one peer without disabilities during an average of 42.3% (range 0% to 100%) of the full class period across observations. Examples of being in proximity include sitting directly next to peers, working on a collaborative project or lab activity with a small group of peers, or sitting across the table from a peer. When not in proximity to peers, students may have been working at a separate table with other students with severe disabilities, sitting next to a paraprofessional rather than peers, or being gone from the classroom. Overall patterns of peer proximity never exceeded 50% and were somewhat lower toward the beginning and end of the classes (see Figure 1). For example, the percentage of observations in which students were in proximity to peers at the start of class was just 31.8%, peaked at 49.4% of observations two fifths of the way through class, and ended at 29.3% of observations during the last interval of the class period. When dividing classes into four segments, we found that students with disabilities were in proximity to peers for an average of 40.6% of all intervals (not just intervals when the student was present) across observations during the first quarter, 47.6% of all intervals during the second quarter, 45.5% of all intervals during the third quarter, and 35.6% of all intervals during the last quarter of the class period.
We also examined patterns based on the type of class and the primary disability category. Visual analysis suggested slight differentiation in patterns of proximity across the class period based on the type of class (see Figure 4), with higher levels generally found in academic classes. Overall, students with severe disabilities were in proximity to peers for an average of 45.2% (range 0% to 100%) of the total period in academic classes versus 40.7% (range 0% to 100%) of the total period in other classes.
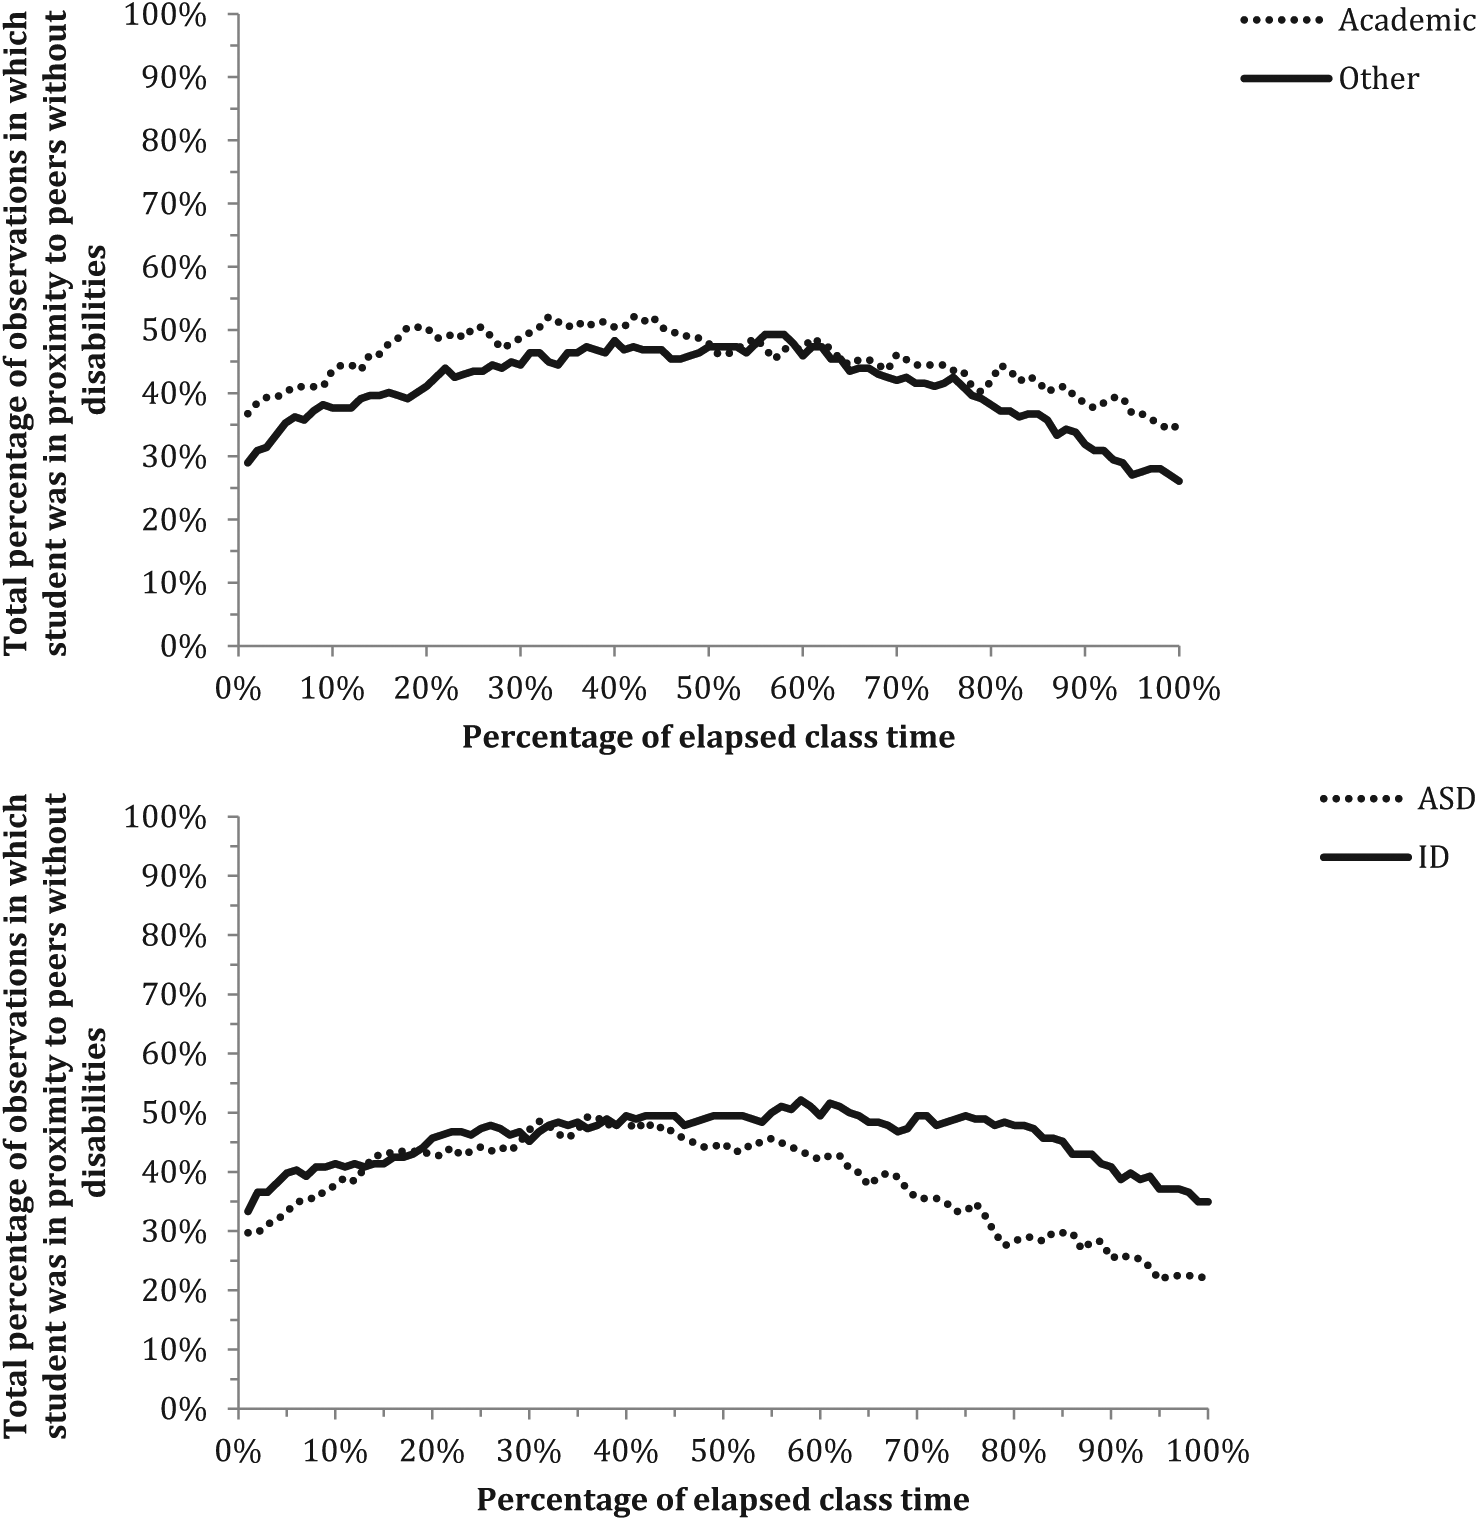
Top panel displays the proximity of students with severe disabilities to peers without disabilities in their general education classes based on type or class (i.e., core academic classes vs. other classes). Bottom panel displays proximity based on primary disability label (i.e., autism vs. intellectual disability).
A more distinct difference was apparent based on primary disability type. Overall, students with a primary label of autism were in proximity to peers an average of 38.1% (range 0% to 100%) of the class period, whereas students with ID were in proximity for an average of 45.4% (range 0% to 100%) of the class. The patterns of the two groups of students differentiated throughout the last three fifths of the class, with more time in proximity evident for students with ID (see Figure 4). By the last interval of these classes, students with autism were in proximity to peers an average of 21.7% of observations versus 35.0% of observations of students with ID.
Interaction Patterns of Classmates Without Severe Disabilities
To gauge the opportunities for interaction that might exist in these general education classrooms, we documented the actual interactions of a comparison sample of peers without disabilities. We observed peer interactions occurring fairly consistently throughout each class period. Specifically, at least one interaction took place during an average of 21.8% (range 0% to 70%) of the percentage-based intervals across all observations. During any particular interval, the percentage of observations in which an interaction took place ranged from a low of 7.3% to a high of 34.5%. Although variable, the trend across the class period was fairly stable (see Figure 5). When dividing the classes into four segments, we found that interactions occurred during an average of 20.0% of all intervals across observations during the first quarter, 20.1% of all intervals during the second quarter, 24.3% of all intervals during the third quarter, and 22.8% of all intervals during the last quarter of the class period. When examining patterns separately for task- and social-related interactions, we found that limited overall differentiation was also apparent (Figure 6). Social-related interactions were somewhat higher than task-related interactions toward the very beginning and very end of classes. Overall, the percentage of observations in which a task- and social-related interaction took place was 11.3% (range 0% to 61%) and 11.8% (range 0% to 62%), respectively. We also examined patterns in total interactions based on class type. Visual analysis revealed that a larger proportion of intervals included interactions within nonacademic classes versus academic classes (see Figure 6). Overall, peers had at least one interaction in an average of 16.3% (range 0% to 47%) of intervals across observations in academic classes compared to 25.2% (range 1% to 70%) of all intervals in other classes. Across observations, peers were in proximity to at least one other peer during an average of 90.1% (SD = 18.7%) of class time.
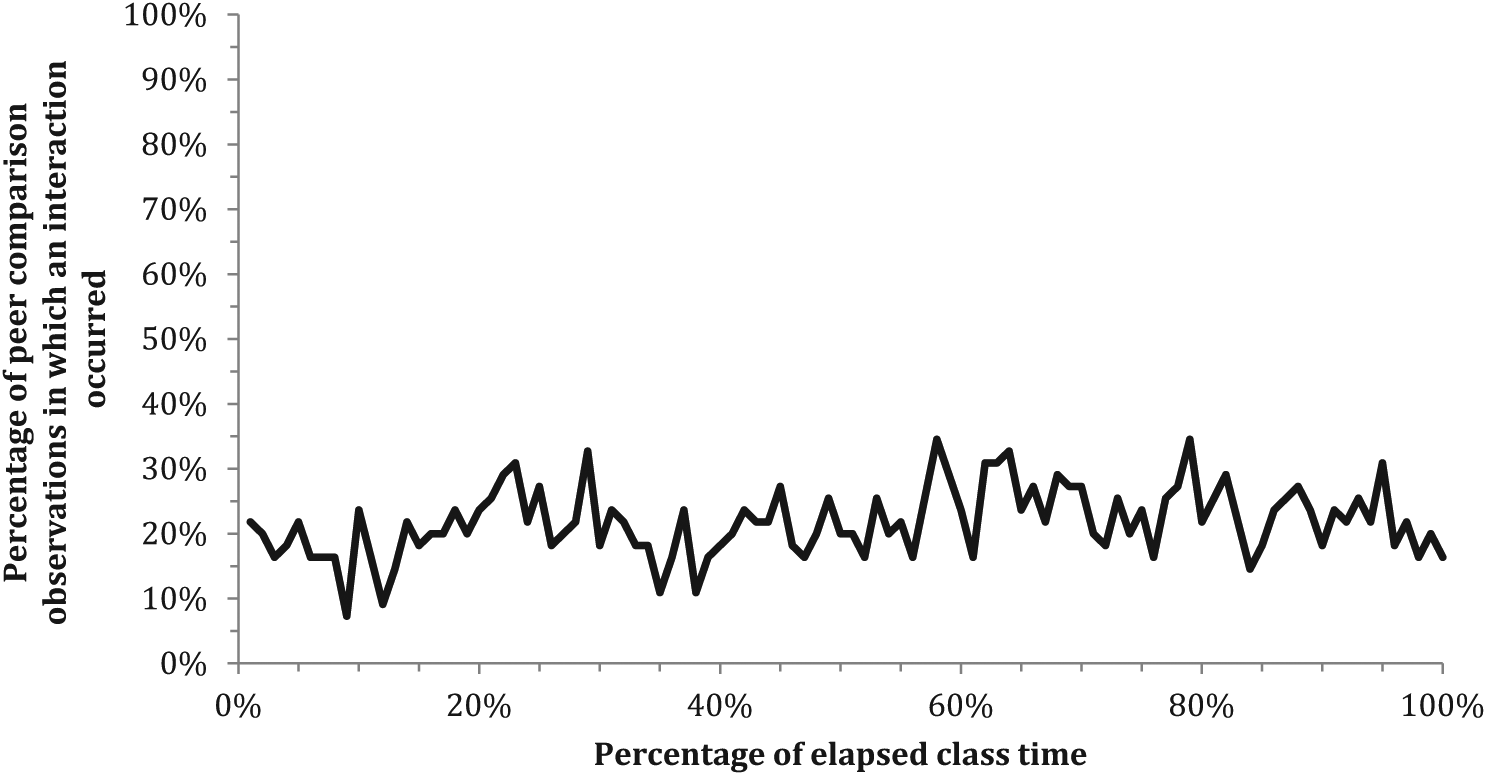
All interactions (conversation turns) occurring during observations of classmates without disabilities in the same general education classes as students with severe disabilities.
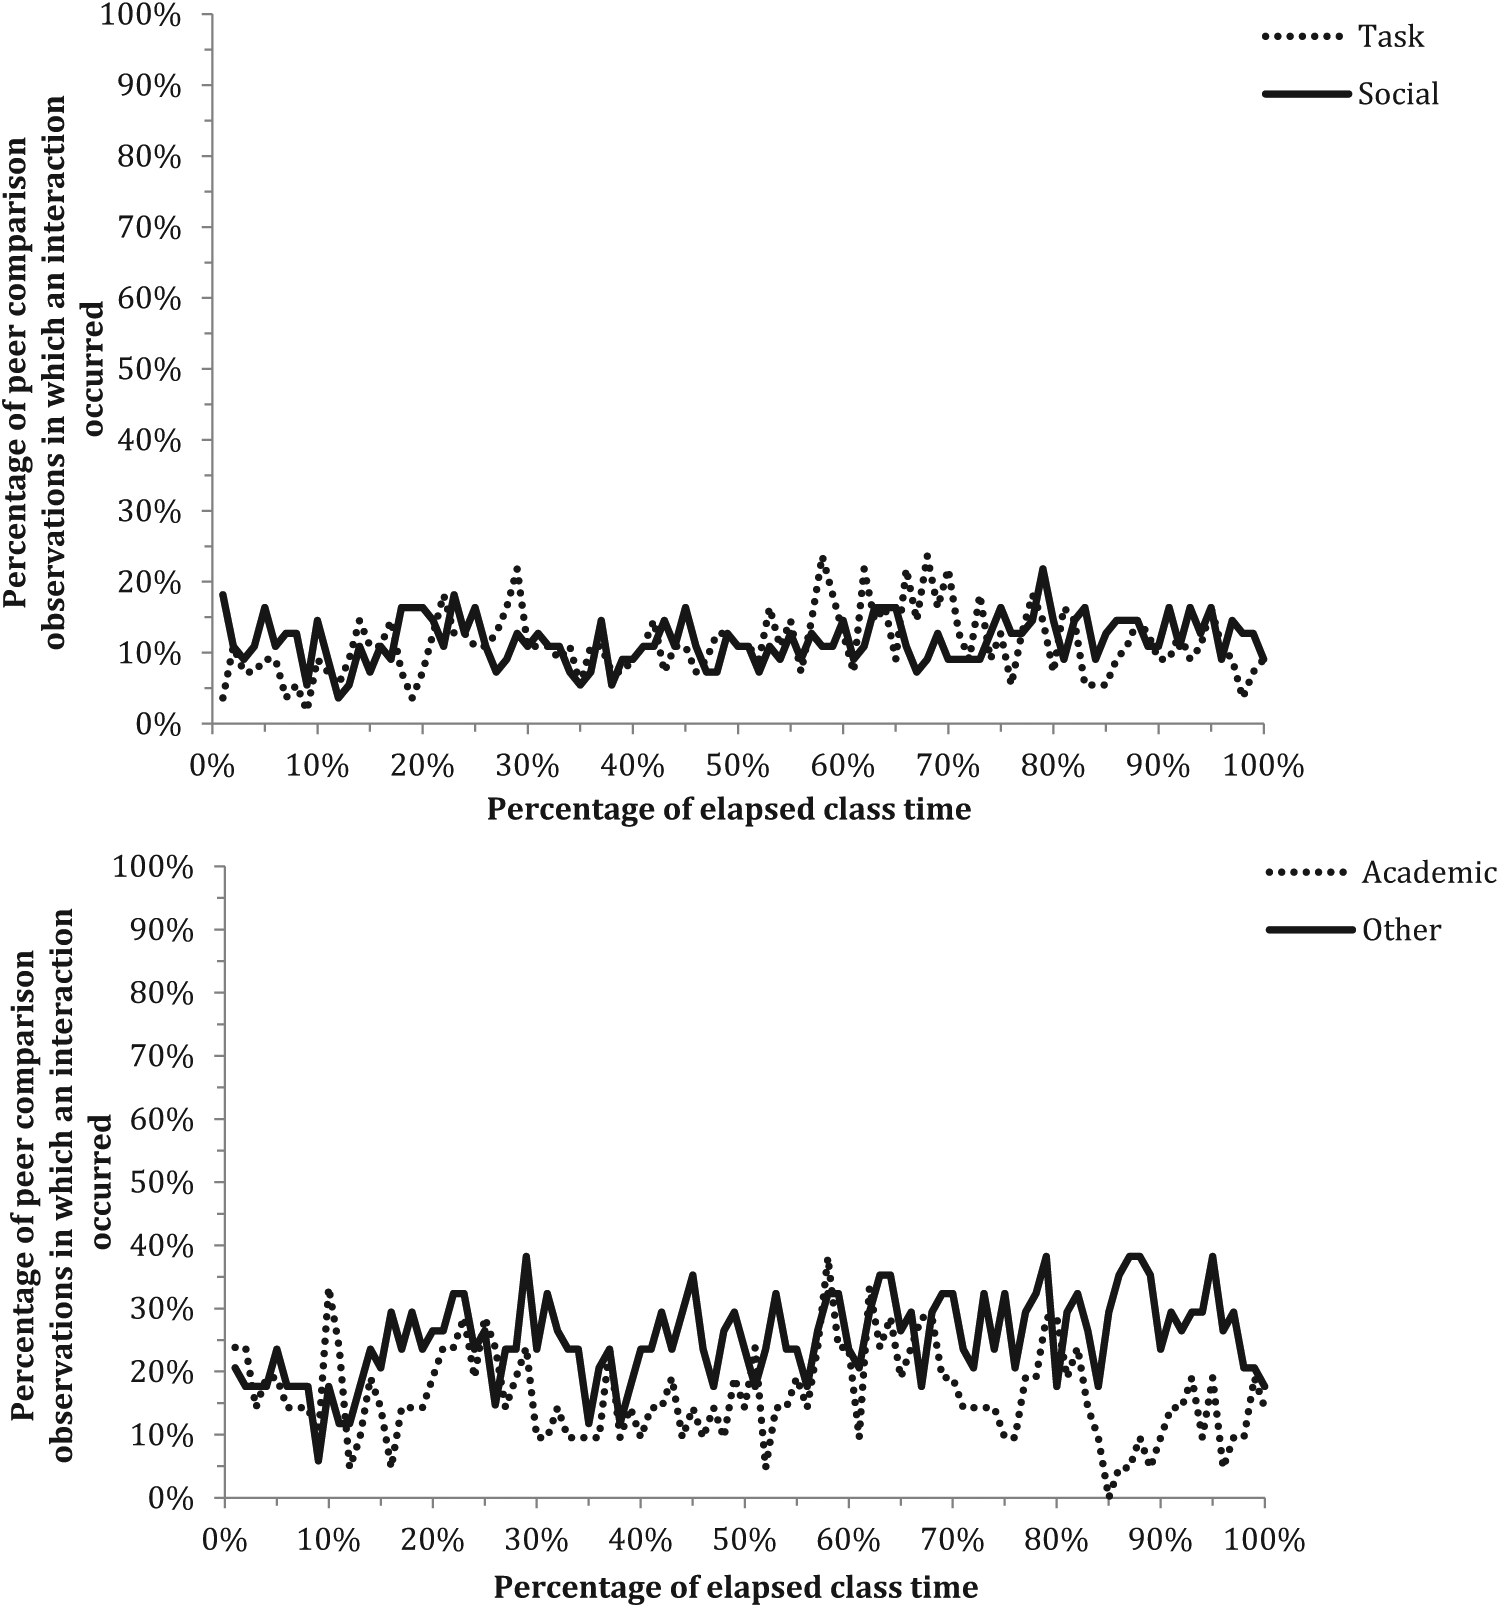
Top panel displays interactions (conversation turns) occurring during observations of classmates without disabilities broken down by topic of interaction (i.e., social- vs. task-related interactions). Bottom panel displays all interactions (conversation turns) broken down by type of classroom (i.e., core academic vs. other classes).
Discussion
The purpose of our analyses was to look deeper at two factors that can inadvertently limit the opportunities students with severe disabilities have to interact with their peers without disabilities in general education classrooms. Although state-level trends in educational environment suggest general education participation is becoming more widespread (McLeskey et al., 2012), it is possible students with severe disabilities still have limited chances to collaborate and converse with their classmates even when enrolled in the same courses. Students must be both present and in proximity to peers as prerequisites to fostering peer interaction and shared learning. We explored these two important markers of social inclusion in a large sample of students. Our findings extend the literature on school inclusion in several ways.
First, we found that students with severe disabilities were not present in their general education classes for a substantial proportion of instructional time. During a given observation, students were gone from their classroom for an average of 15.8% of total scheduled class time. Their presence also varied widely across the class period, with just 69.1% of observations reporting students with severe disabilities present at the start of the class period and a mere 56.2% present at the end of class. Indeed, almost half of the observed classes involved students who left class before the final bell. This results in students’ missing valuable instructional time as well as opportunities to interact with classmates. As reflected in our normative comparison data, conversations among peers (particularly, social-related interactions) often happen shortly after class begins and just before the final bell rings, times when large numbers of students with severe disabilities are not present. This finding of considerable absence is consistent with prior studies of elementary students with severe disabilities, although the reasons these patterns exist have yet to be identified (Chung et al., 2012).
Students must be both present and in proximity to peers as prerequisites to fostering peer interaction and shared learning.
Although our observers did not query paraprofessionals as to why students with disabilities were gone during particular periods of each class, the various patterns of presence observed in the classroom are important to explore. Some students arrived late or left early, some were present only for the middle of class, and others came and went throughout a class period. What might account for this reduced presence? Some potential reasons might include staff’s choosing to avoid crowded hallways during passing periods or involve students meeting with a related service provider (e.g., speech-language pathologist, physical therapist, occupational therapist) or students participating in alternative activities occurring in the special education classroom or elsewhere. Additional research is needed to elucidate how these decisions are made and the various factors that lead students to be absent from the very courses in which they are enrolled.
Second, we found that even when students with severe disabilities were present in their general education classes, they often had limited proximity to classmates without disabilities. Across observations, students with severe disabilities were in proximity to at least one peer without disabilities for an average of just 42.3% of the class period. In other words, students were not in a position where they could easily interact with a peer without disabilities for nearly three fifths of every class. Looking at the observations based on elapsed class time, students were in proximity to peers near the start of class during just 31.8% of observations and in proximity at the end of class during just 29.3% of observations. Our comparison data suggest these two bookends of class represent a time when social interactions were most common. Findings from Chung et al. (2012) resemble our findings (i.e., elementary students were in proximity to peers without disabilities during just 58.5% of the class period). When students with severe disabilities work on the periphery of the classroom with individually assigned paraprofessionals and away from peers, opportunities to interact with peers are severely restricted.
When students with severe disabilities work on the peripheries of the classroom with individually assigned paraprofessionals and away from peers, opportunities to interact with peers are severely restricted.
Third, we observed noticeable differences in presence and proximity based on both student and classroom factors. For example, presence and proximity were both associated with disability label. For presence in the classroom, students with a primary diagnosis of autism were present for an average of 80.6% of class periods, whereas participants with ID were present for an average of 87.1% of these periods. One possible explanation for this disparity is that school staff often choose to avoid crowded hallways for students with autism, leading to late arrivals or early departures. It is also possible students with autism might be more likely to engage in disruptive behaviors that could lead paraprofessionals to pull them from the classroom earlier or arrive later. In terms of proximity to peers, students with autism were in proximity to at least one peer without disabilities for an average of 38.1% of classes, whereas students with ID were in proximity of peers for an average of 45.4% of class time.
We did not notice differences in presence based on type of classroom (i.e., academic or nonacademic class). However, the amount of time in which students with severe disabilities were in proximity to classmates without disabilities did look different across classroom types. In academic classes, students were in proximity to peers for an average of 45.2% of the class; students observed in nonacademic classes were in proximity for a somewhat smaller average of 40.7% of the class. Although this difference is modest, the reasons for this difference warrant additional exploration. For example, it may be due to the nature of instruction typically provided in these two settings or the physical arrangements of classes. It may also relate to differences in student characteristics that lead some students to be enrolled in one type of class versus the other.
Fourth, examining the interactions of students without disabilities provided insights into just how often social interaction typically takes place for students without disabilities in these same classes. On average, about one fifth (21.8%) of students without disabilities had a peer interaction during any given interval. If students with severe disabilities are in proximity to peers an average of only 42.3% of the time, they are missing out on a fairly large number of potential interaction opportunities. Moreover, when students are not even in the classroom 15.8% of the time, they have decreased opportunities to form relationships with peers, develop age-appropriate social skills, or feel included in the classroom community. We note, however, that increasing presence and proximity alone is likely to be insufficient to promote rates of interaction comparable to those of classmates without severe disabilities. Indeed, the literature consistently affirms that peer interactions remain limited for students with severe disabilities absent intentional intervention efforts (Carter, Sisco, Chung, & Stanton-Chapman, 2010).
Limitations
Several limitations to this study suggest directions for future research. First, data were collected only when students came to class for a minimum of 20 min. In other words, if a student was absent from class for an entire period or stayed less than 20 min, we did not complete an observation. Because this occurred multiple times, our reporting on both presence in the classroom and proximity to peers is actually inflated. Future research could incorporate into calculations any amount of time students were in the general education classroom, regardless of length, as well as times when students did not show up to class.
Second, presence and proximity are the only two variables we explored in relation to peer interaction. Although presence and proximity are necessary, they are not sufficient to promoting interaction (e.g., Carter et al., 2008). Other factors are also relevant to consider. For example, the type of instruction used within a classroom (i.e., large group, small group, no instruction) could affect interaction opportunities among students. Students might be more likely to have task-related interactions during small-group time or social-related interactions when no instruction is occurring. Similarly, the degree to which students with severe disabilities are engaged in activities that are consistent with what other students in the class are doing could affect interaction opportunities. Other factors might include how well students know one another, their location within the classroom, and the availability of relevant communication systems (Carter, Huber, & Biggs, 2015). Future studies are needed to identify how these various elements collectively shape the quality and quantity of social interaction opportunities.
Third, our study focused specifically on high school students. It is possible that younger adolescents with disabilities—such as those in middle school—might exhibit different patterns of presence and participation. Looking at younger students with severe disabilities could serve as an interesting point of comparison as well as enhance the generalizability of the findings by incorporating a broader population of students. Future research could look at the same factors but also involve younger students to see if age plays a role in students’ presence in the classroom and proximity to peers without disabilities.
Fourth, our analyses focused only on observations conducted toward the beginning of the semester. It is unclear whether such participation patterns remain constant across a particular semester.
Finally, interobserver agreement for social interaction was acceptable but somewhat low. Given the challenges associated with unobtrusively and reliably observing the social interactions of adolescents in classroom settings, future studies might incorporate time sampling (versus real-time) data collection approaches.
Implications for Practice
Findings from this descriptive study have several implications for educators and policy makers committed to supporting inclusive education for students with severe disabilities. First, the patterns of presence and proximity in this study highlight the importance of distinguishing between placement and participation. Conversations about educational inclusion—within both student-level IEP team meetings and broader national policy discussions—often appeal to the percentage of the school day in which students are enrolled in general education classrooms. Yet findings from the present study suggest the participation of students with severe disabilities in general education classes may be far more limited than is currently reflected in aggregated state-level educational placement data or on the course schedules of individual students. Advocacy for increased access to general education classes must be accompanied by actual efforts to ensure students are participating fully in these educational settings.
…the patterns of presence and proximity in this study highlight the importance of distinguishing between placement and participation.
Second, paraprofessionals can have a direct influence on the extent to which the students with severe disabilities whom they support ultimately learn alongside their peers without disabilities in inclusive settings. The initial training and ongoing guidance they receive from general and special educators can shape their confidence and capacity to support students with severe disabilities well within inclusive classrooms. Yet the availability of high-quality professional development in this area—both for paraprofessionals and for the educators who direct their work—is often quite limited or altogether absent (Carter, O’Rourke, Sisco, & Pelsue, 2009). Strategic efforts should be undertaken by schools and districts to ensure paraprofessionals are well equipped for the tasks to which they are assigned, work under the direction of certified teachers, and understand their roles in supporting students to access the social and learning opportunities that exist within inclusive classrooms.
Third, findings from this study reinforce the importance of ensuring educational teams draw upon evidence-based approaches for supporting the inclusion of students with severe disabilities (Jackson et al., 2008/2009; Ryndak et al., 2013). Peer-mediated interventions—such as peer support arrangements and cooperative learning groups—offer a particularly promising approach for supporting the presence and proximity of students within inclusive secondary school classrooms (Carter, Moss, Hoffman, Chung, & Sisco, 2011; Jimenez, Browder, Spooner, & Dibiase, 2012). Such interventions shift paraprofessionals away from one-to-one support roles and involve peers much more actively in providing some of the supports students need to remain academically and socially engaged throughout the class period. Ensuring educators are fluent in these and other instructional approaches is an important task for both preservice training programs and entities charged with the design and delivery of professional development.
Summary
Our analyses focused on students with severe disabilities enrolled in general education classes and the contexts that may set the occasion for interactions with peers without disabilities. Although many in the field have advocated for increased inclusion on the basis of expanded social opportunities, our findings affirm such opportunities are not consistently made available. Students with disabilities often do not stay in class for the entire period; even when in class, many are not in proximity to peers. Absent this presence and proximity, they are unlikely to develop new relationships, strengthen their social and communication skills, or access shared learning opportunities. Special educators, general educators, and paraprofessionals should work in close collaboration to maximize the time students spend in their classes as well as ensure these students are learning right alongside their classmates without disabilities.
Footnotes
Authors’ Note
Support for this research came from the Institute of Education Sciences, U.S. Department of Education, through Grant R324A100391 to Vanderbilt University and the University of Wisconsin–Madison.