
Abstract
We tested the efficacy of a comprehensive intervention program designed for high school students across the autism spectrum, the Center on Secondary Education for Students with Autism (CSESA) model, in a cluster randomized control trial involving 60 high schools in three states (California, North Carolina, Wisconsin), with implementation occurring over a 2-year period. We examined outcomes for the schools, students (N = 547), and families. At the conclusion of the study, CSESA schools had significantly higher program quality than the services-as-usual (SAU) schools. In addition, students in the CSESA schools had significantly higher total attainment of educational goals than students in SAU schools. There were not significant differences between the two groups on standardized assessment outcomes. We discuss implications for intervention implementation and future research with this population in the public school context.
At times, circumstances converge to create complex situations that require a comprehensive response (Hawes, 2015). Such are the circumstances of autistic adolescents in high school programs in the United States. The combination of the abilities of students with autism, the developmental features of adolescence, and the multicontextual high school environment create a “perfect storm” of complexity. Federal legislation in the United States charges public schools with providing adolescents with autism a free and appropriate educational program that utilizes evidence-based practices (EBPs). This mandate establishes the need for a comprehensive program that addresses the variety of abilities of autistic adolescents. In this article, we describe the features of a comprehensive school-based program developed by the Center on Secondary Education for Students with Autism (CSESA) and a cluster randomized control trial that examined the efficacy of the program.
By definition, children and youth with autism exhibit impairment in social communication and restricted or repetitive behavior (American Psychiatric Association, 2013). Although they manifest early in life, impairments continue into adolescence and adulthood (Howlin, 2014). Students with autism have a wide range of support needs. Some students have profound intellectual disability and severe social-communication impairment and need substantial support; others have above-average intellectual functioning and less severe social-communication impairment and need only modest support (American Psychiatric Association, 2013). Regardless of level of support needs, adolescence is a period of particularly high stress for families of autistic individuals as the normative challenges associated with the transition to adulthood are compounded with multiple difficulties unique to the disorder (Prata et al., 2019).
By most accounts, public education has not been successful in meeting the needs of adolescents and young adults with autism. Longitudinal studies have found that, relative to individuals with and without other impairments, autistic students experience significant challenges during the high school years (i.e., limited contact with friends and lower levels of self-direction than other youth with an individualized education program [IEP]; Lipscomb et al., 2017) and poorer outcomes (e.g., lower employment and social engagement rates than those of individuals with other disabilities) when they transition out of schools (Taylor et al., 2015). Concerns about school and postschool outcomes are particularly important now because in 2019, there were an estimated 280,000 autistic adolescents in U.S. high schools (i.e., 15.3 million adolescents enrolled in public high schools [McFarland et al., 2019] and a prevalence rate of 1 in 54 [Maenner et al., 2020], who will be transitioning into the community in the near future).
Given the variety of ability levels and magnitude of educational and service needs, school systems and personnel may be challenged to meet the needs of autistic adolescents. In fact, teachers have reported that they often feel unprepared to meet the needs of students with autism (Knight et al., 2019). For children with autism, comprehensive programs have emerged to address their multidimensional learning needs (Odom et al., 2014), but they have often been individually focused (i.e., occurring with an individual child in clinics or homes) and when classroom based primarily usually address young and elementary school-age autistic children (e.g., Suhrheinrich et al., 2020). To the authors’ knowledge, there have been no published reports of comprehensive programs in the United States designed for high school students with autism. By most accounts, public education has not been successful in meeting the needs of adolescents and young adults with autism.
CSESA
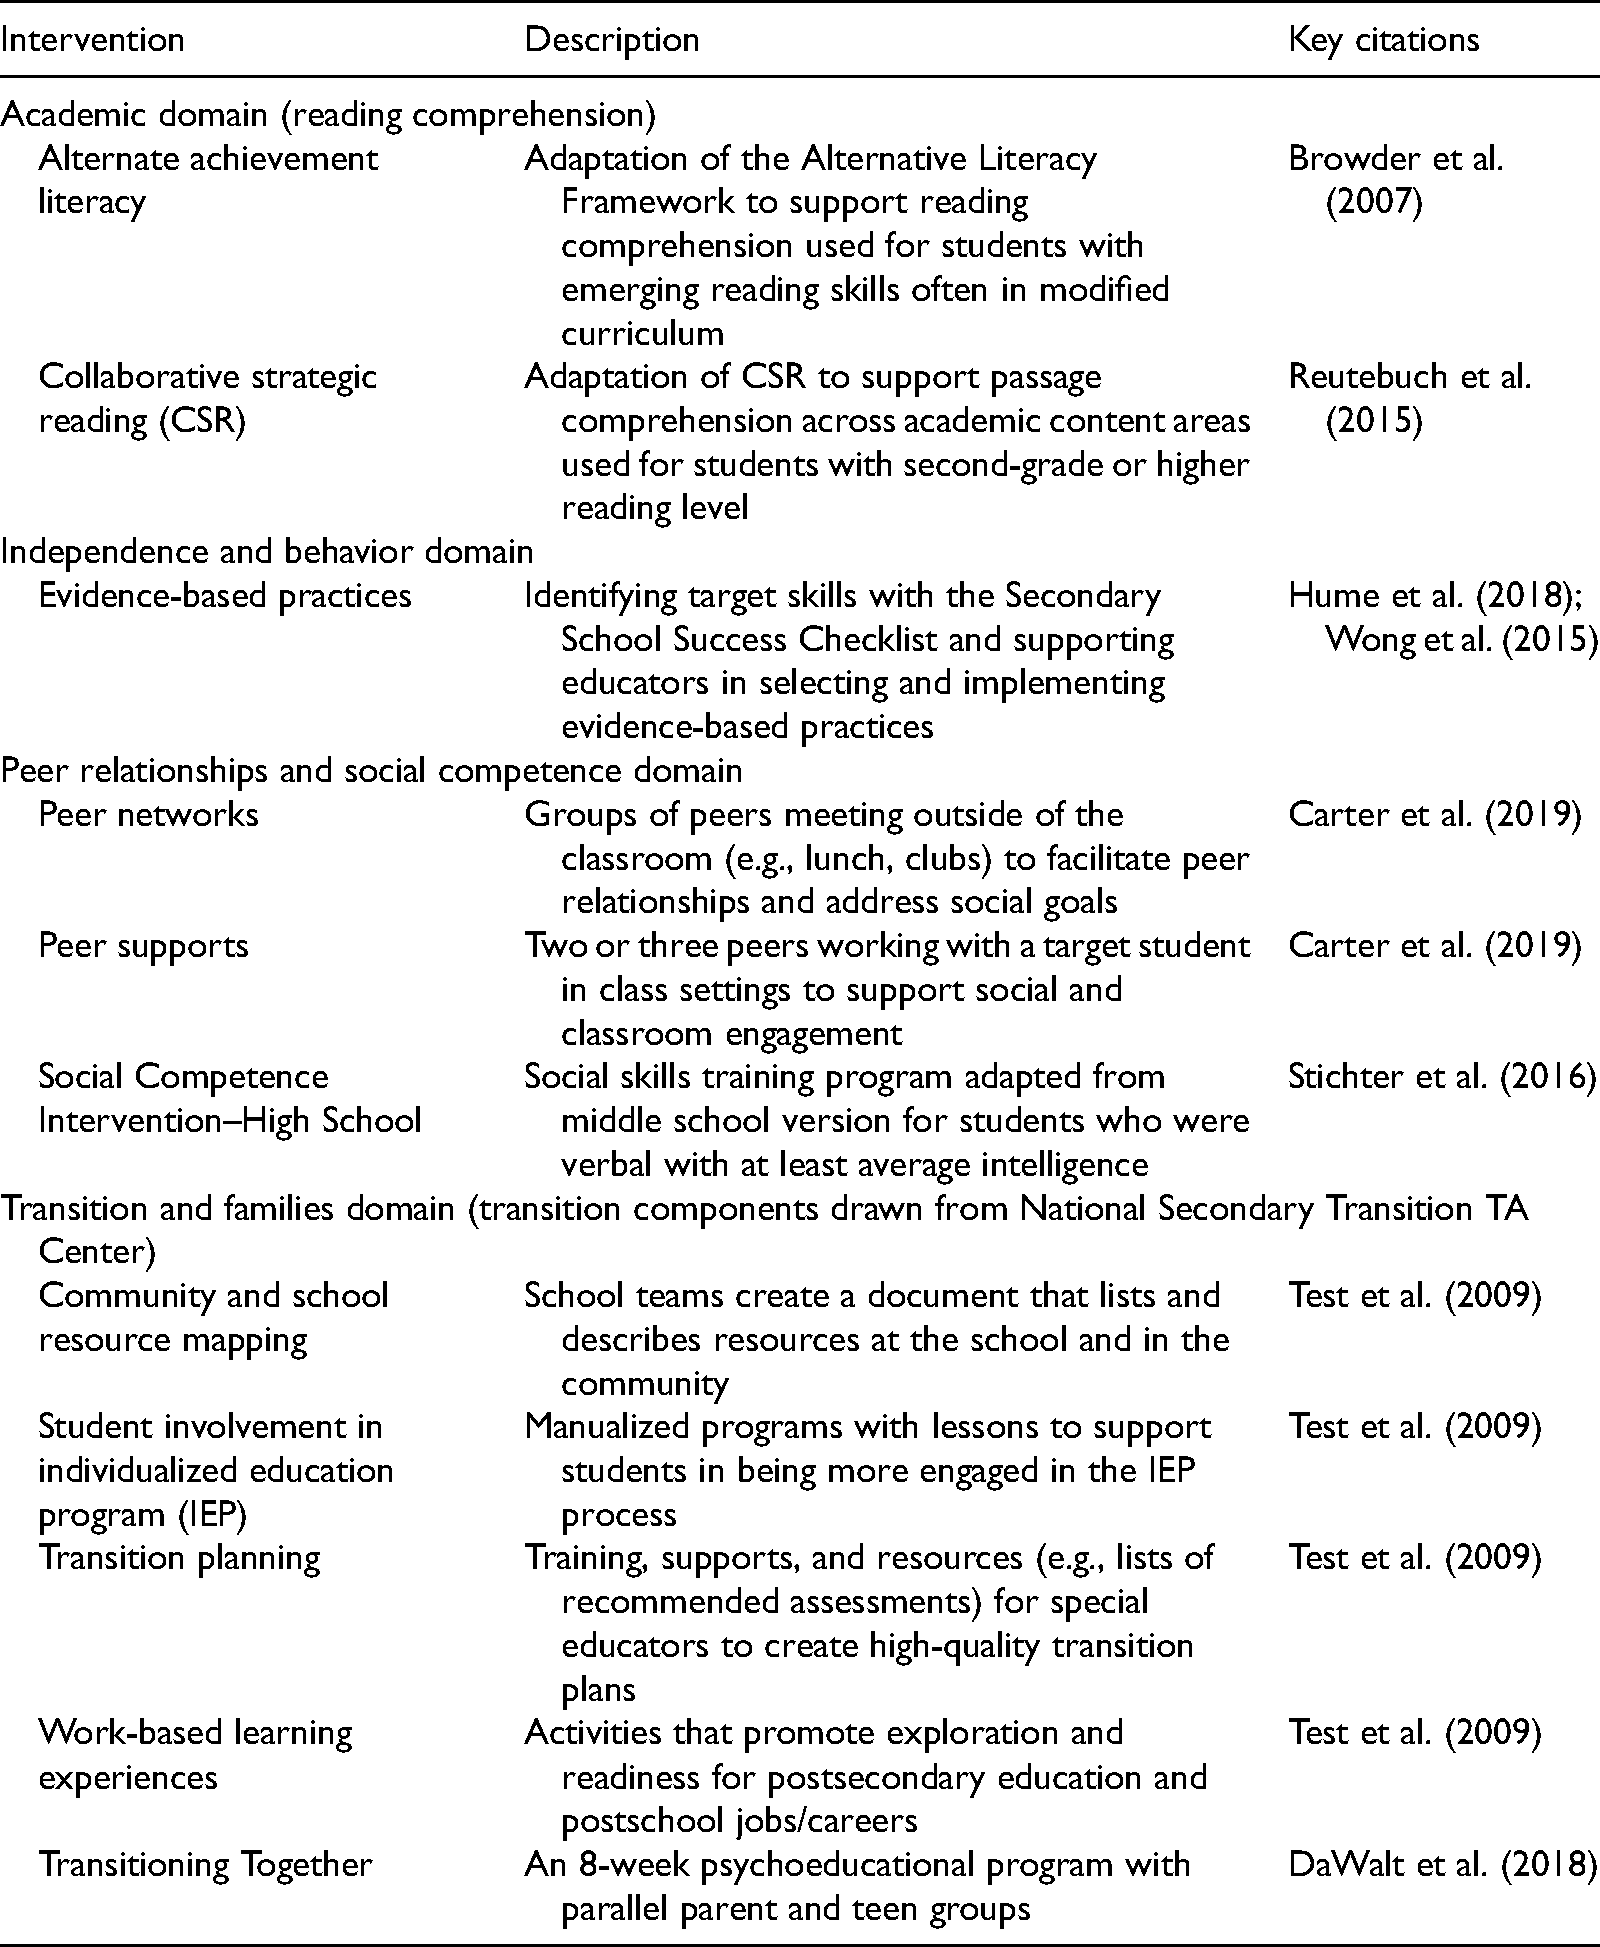
To respond to the need for a comprehensive program focusing on the learning needs of adolescents with autism in high school, the CSESA developed just such a comprehensive school-based program. CSESA investigators designed the program to meet the needs of high school students with autism having a wide range of abilities and support needs (e.g., enrolled in general and special education classes, working toward standard or modified diplomas). From the literature, CSESA investigators identified the high-need domains for high school students with autism as academics (Fleury et al., 2014), peer relationships and social competence (Carter et al., 2014), independence and behavior (Hume et al., 2014), and transitions and families (Test et al., 2014). CSESA investigators and colleagues designed program components to address each domain and adapted interventions that have previous evidence of efficacy (see Table 1 for component descriptions). Additional details about the each component may be found at the CSESA website (http://www.csesa.fpg.unc.edu). The CSESA implementation process is described in the Procedures section.
CSESA Program Components.
Purpose
The purpose of this study was to examine the efficacy of the CSESA program for high school students with autism. The specific research questions addressed were as follows: (a) Does the CSESA model have a more positive effect on the program quality than services as usual (SAU)? (b) Does the CSESA model produce positive changes in students’ acquisition of their individualized educational goals relative to SAU (promixal outcome)? (c) Does the CSESA model produce more positive outcomes on standardized measures of student performance relative to SAU (distal outcome)? (d) Does the CSESA model have more positive effects for families relative to SAU? (e) What is the social validity of the CSESA model?
Method
To address the research questions, the researchers employed a cluster randomized control trial across three research sites.
Settings
This study was conducted in 60 high schools, located in North Carolina, Wisconsin, and Southern California (i.e., 20 high schools at each location). For inclusion, schools needed to be public (i.e., not private or charter) and enroll students with and without disabilities (i.e., no special education-only high school programs). These high schools were organized into two cohorts, so that 10 (i.e., five CSESA and five SAU) at each site entered the study for a 2-year period the first year, and the second cohort of 10 entered the study the second year. The high schools were selected to include urban (40%), suburban (45%), and rural (15%) areas. More than half of the schools had Title I eligibility (55%), and the mean of the student population eligible for free and reduced lunch was 40%. School information, drawn from the National Center for Education Statistics (McFarland et al., 2019), appears in Table 2.
School Demographic Data.
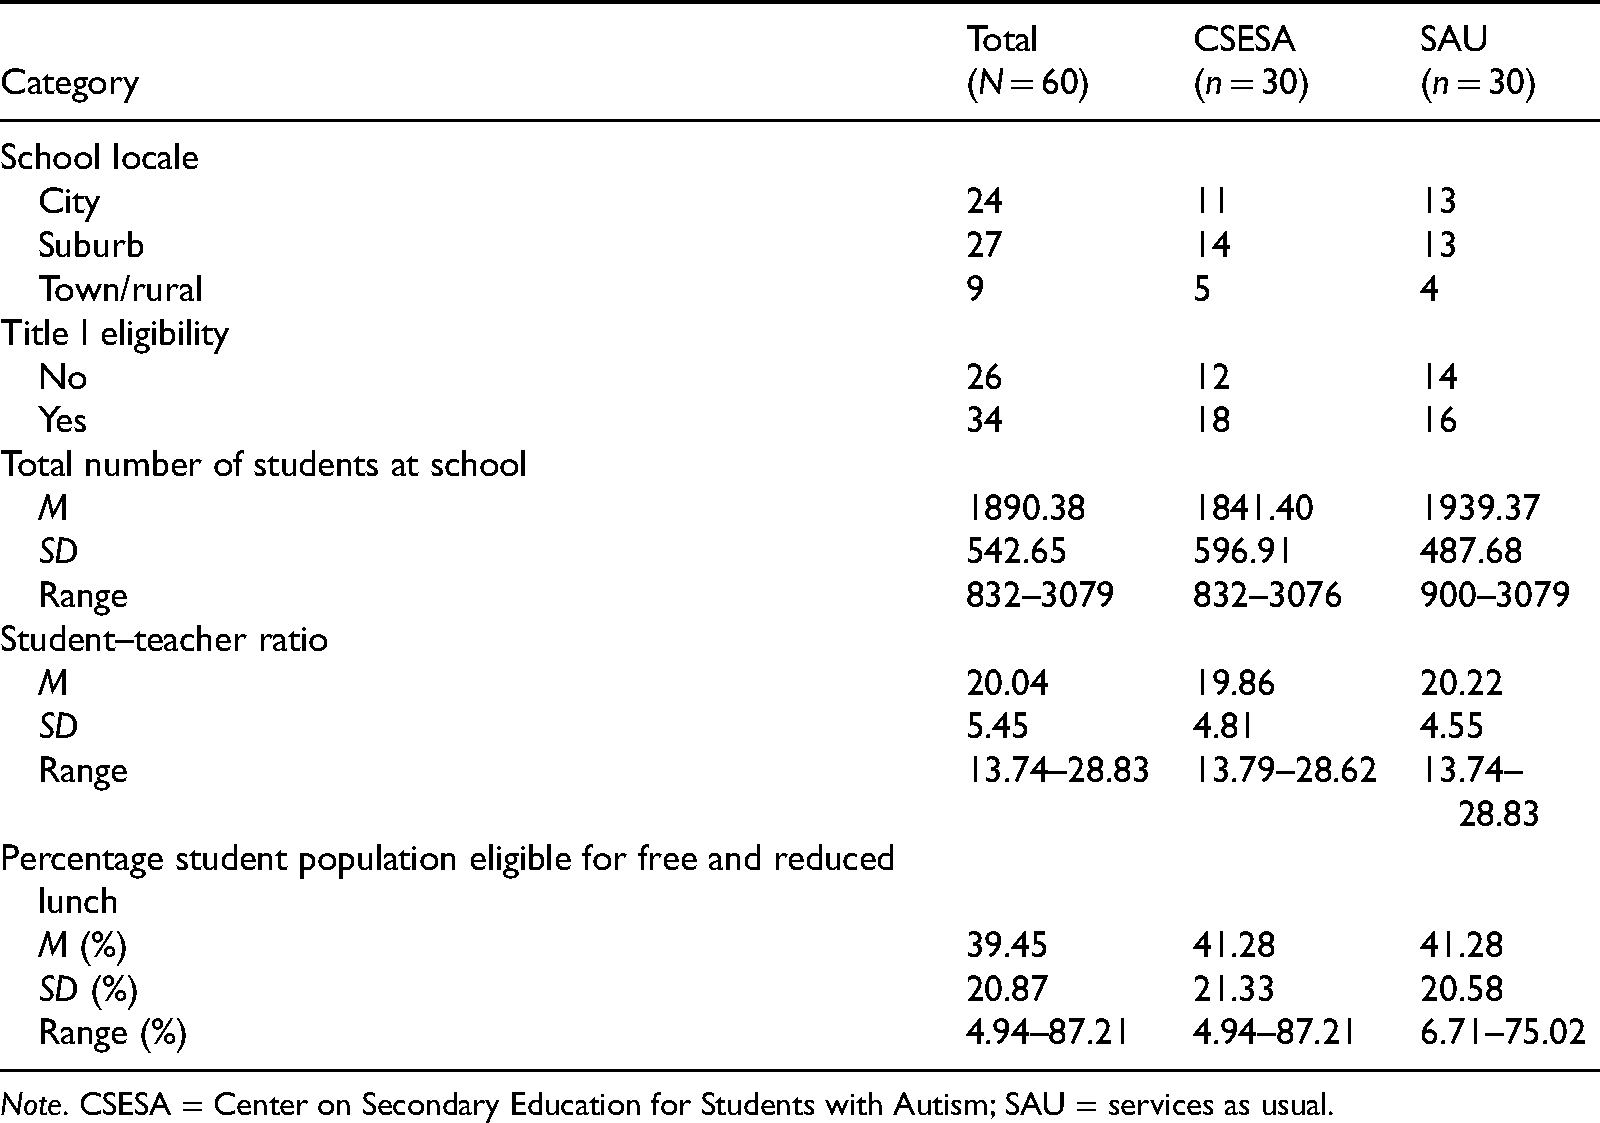
Note. CSESA = Center on Secondary Education for Students with Autism; SAU = services as usual.
The CSESA team used the Generalizer Software (Tipton & Miller, 2015) to analyze the generalizability of the findings to different inference populations based on school size, district size, percentage free and reduced lunch, urbanicity, and percentage of students in racial-ethnic groups and English language learners. For school size, the minimum size was set at 801 students to reflect schools that would likely have eight or more students with autism (i.e., minimum enrollment target per school for the study) based on prevalence data. Based on the schools enrolled in the study, the generalizability index was 0.93, which, according to Tipton and Miller (2015), reflects “very high generalizability.”
Participants
Participants in this study were autistic high school students and their family members. All eligible participants received recruitment information approved by the institutional review board and voluntarily participated. Caregivers signed informed consent forms and youth provided assent for their participation in the assessment process. The primary inclusion criteria were that students have a primary or secondary educational classification of autism, anticipated remaining in school for the subsequent 2 academic years, and did not have a severe, uncorrected hearing or visual impairment. A maximum of 12 students were enrolled in at each school. If more than 12 students consented to participation, then a random selection of students, stratified by standard diploma (i.e., inclusive program that yielded a regular diploma upon graduation) or modified-diploma programs (i.e., a special education program that did not yield a general education diploma of graduation) were selected. A total of 547 students with autism were initially enrolled in the study. Demographic data are provided in Table 3.
Student Demographics and Characteristics.
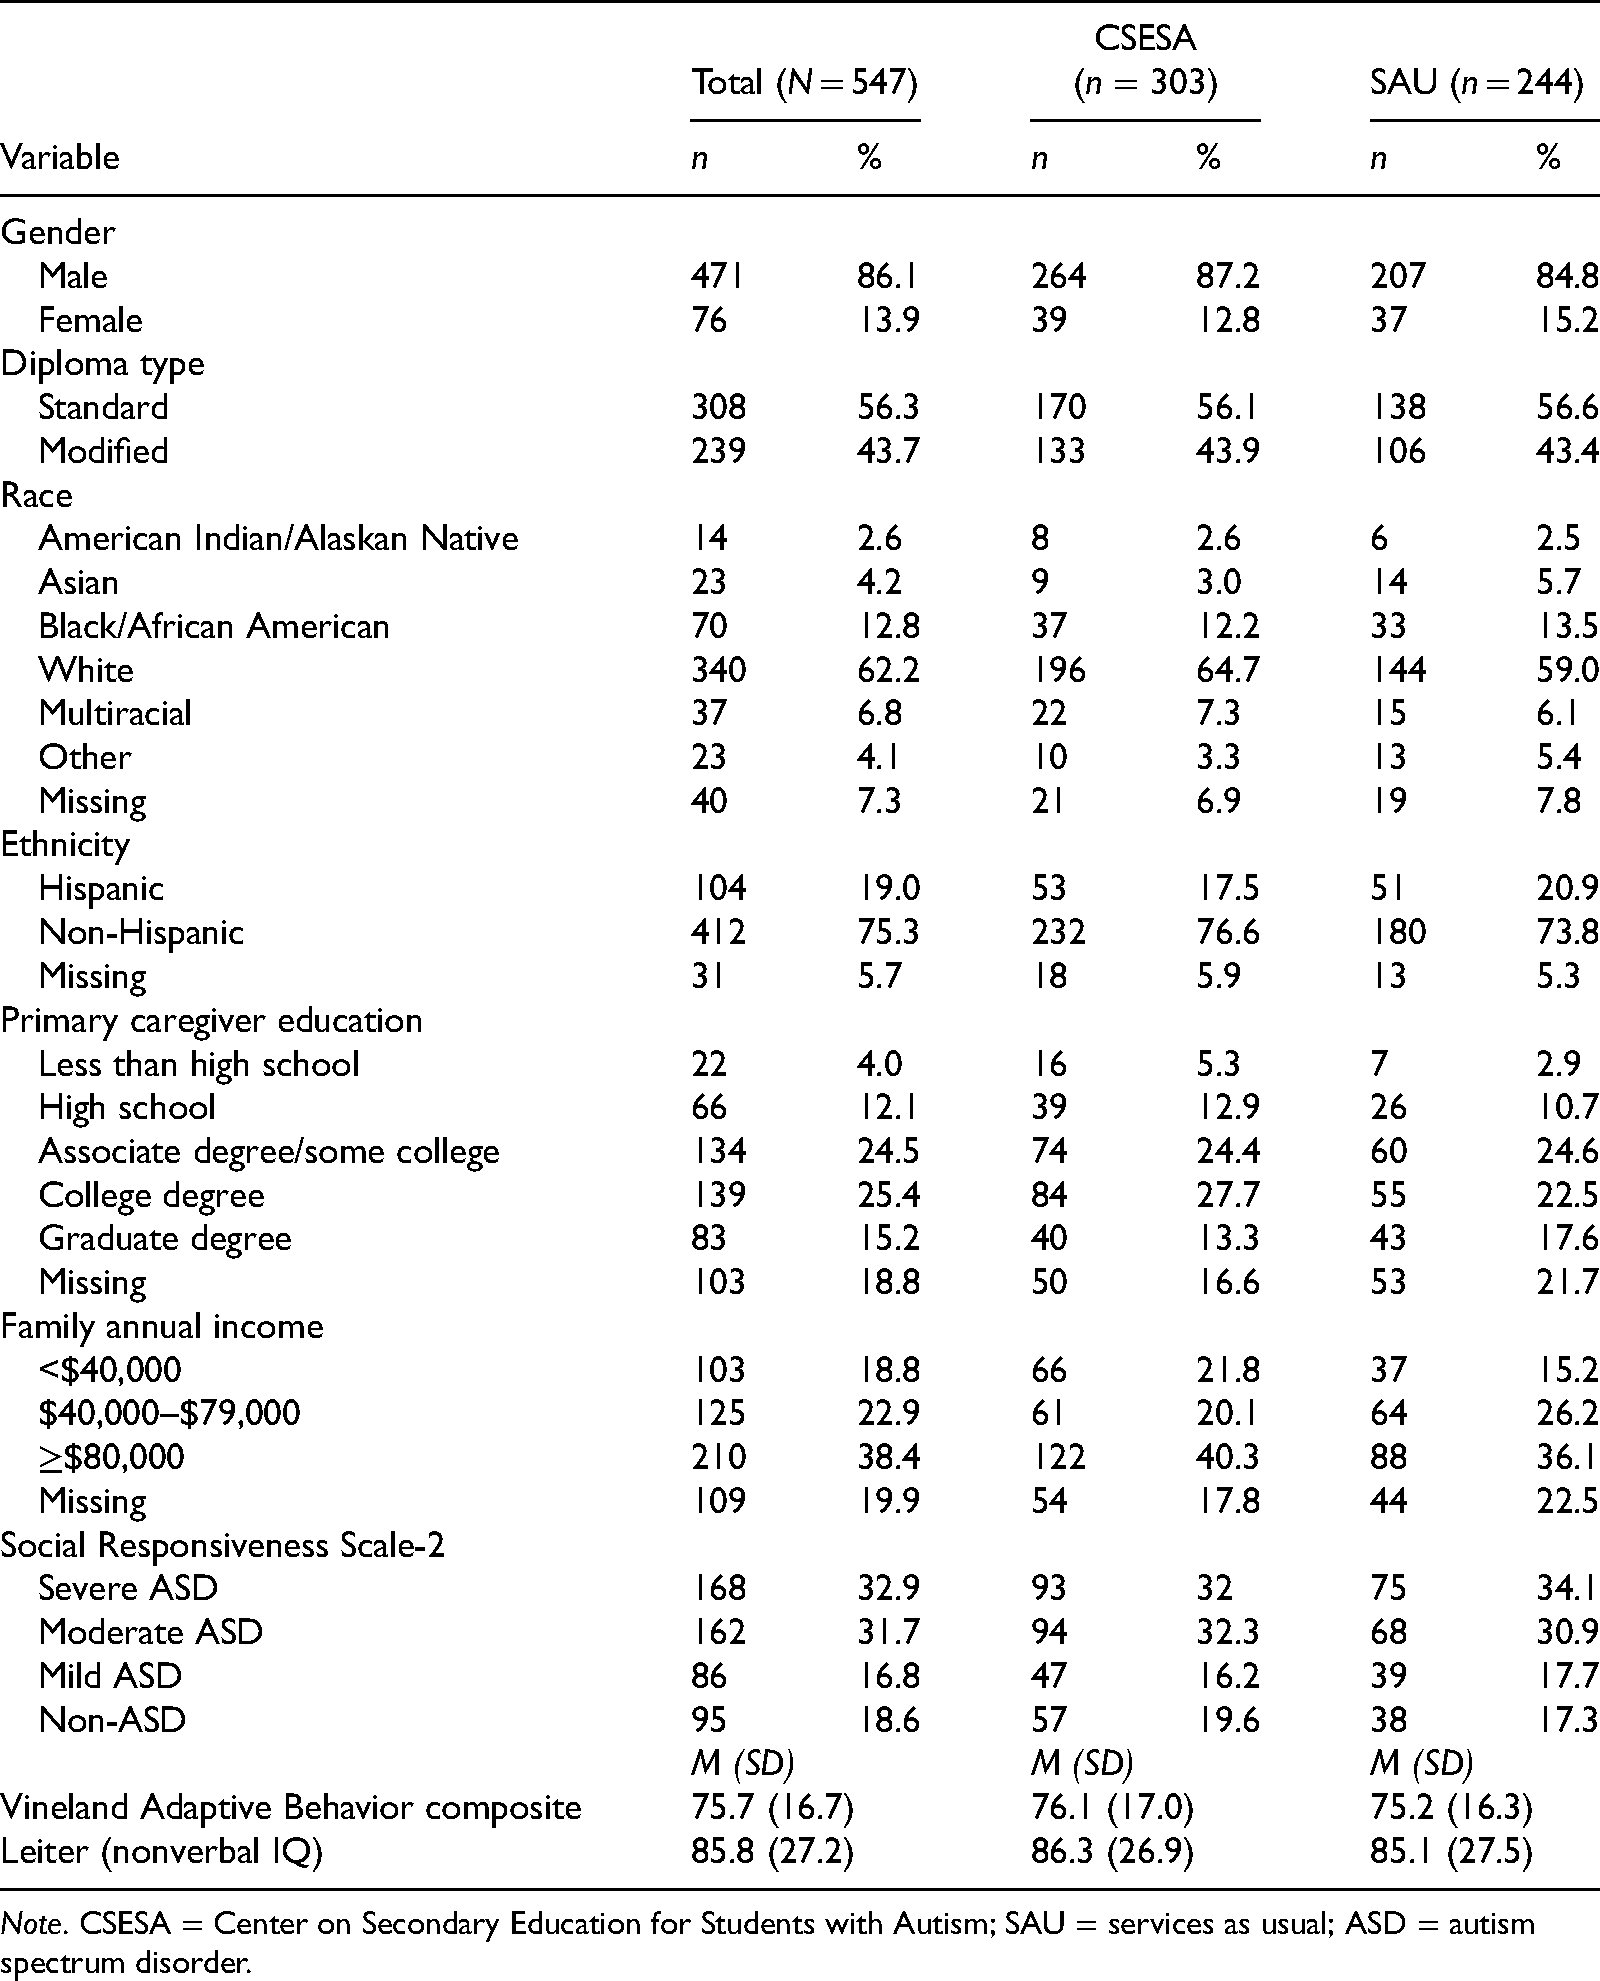
Note. CSESA = Center on Secondary Education for Students with Autism; SAU = services as usual; ASD = autism spectrum disorder.
As occurs for this population, the participants were primarily male (86%). The mean age when they began the study was 16.2 years. The sample was quite diverse in that 46% had racial or ethnic backgrounds other than White non-Hispanic. The distribution of autism severity, as indicated by the teacher version of the Social Responsiveness Scale–Second Edition (SRS-2; Constantino & Gruber, 2012) collected at pretest, was primarily in the severe-to-moderate range, with smaller percentages designated as mild or not autism. The sample had a wide range of intellectual functioning and adaptive behavior skills as measured at pretest. There were no statistically significant differences between groups on any demographic characteristic.
Procedure
We employed a block randomization process in that high schools within school districts were randomly assigned to CSESA or SAU. If a district had only one high school in the study or had an odd number of high schools, a high school with similar demographics (size, urbanicity) was grouped into the block for random assignment. CONSORT tables for the randomization of schools and students in the two groups are provided in the online supplemental materials.
Independent variable (CSESA model)
The components of the CSESA model are described in Table 1. The model delivery process in the CSESA schools consisted of (a) establishing and training an autism team (A-team), (b) assessing program quality and student skills and priorities, (c) developing a 2-year implementation plan, and (d) providing weekly coaching and ongoing training to implement CSESA interventions across each domain.
First and before the school year started, the school formed an A-team, which consisted of a team leader (usually a special education teacher), special and general education teachers, other related services personnel, and always a member of the school administration. The A-team received 3 hr of initial training that introduced them to the CSESA model and study as well as a schoolwide introduction to autism (for training materials, see CSESA, n.d.). In addition, CSESA staff provided a 1-hr training on developing and writing observable and measurable student goals and the development of a Goal Attainment Scale (GAS; Ruble et al., 2012). Across the 2-year implementation period, team members also received training on specific model components (described in Table 1).
Second, CSESA research staff assessed program quality at the beginning of the year using the Autism Program Environment Rating Scale (APERS; Odom et al., 2018; described in a subsequent section) and generated a report of the strengths of the school program and areas for growth. To assess student skills in the four domains described previously, teachers, parents, and students completed the Secondary School Success Checklist (SSSC; Hume et al., 2018). These assessment data guided the teams in developing individual programs for students.
Third, the A-team developed a school-level plan to determine how to improve school quality (i.e., using the report of the APERS results) and schedule the implementation of the CSESA interventions across a 2-year period. School personnel were asked to implement each intervention component for at least one semester with students for whom it was appropriate. Also, A-team members used the SSSC data and student IEPs to develop priority goals for students in four content domains noted previously.
Fourth, coaches supported implementation through training and coaching. Coaches were master's- or doctoral-level trained professionals who had backgrounds in education and autism. These coaches worked with school personnel in forming the A-team at the beginning of the year and assisted the A-team in planning for school quality improvement (based on APERS information) and the implementation of the CSESA intervention components. Coaches provided initial training on CSESA interventions (e.g., collaborative strategic reading, peer social networks) in 1-to-3-hr workshops and follow-up coaching on delivery of the interventions. The mean training time for intervention schools was 16.0 hr and ranged from 7.6 hr to 23.8 hr, and the mean coaching time was 123 hr across the 2-year period (range 52–241). Coaches also collected fidelity information on implementation of the intervention procedures by school staff members. The coaches followed the coaching process developed by the National Professional Development Center on Autism (Kucharczyk et al., 2012) and aimed to spend 1 day (i.e., 6 hr) a week in each CSESA high school. The coaching process included a pre-observation conference; an observation that could include fidelity data collection, modeling, and demonstrations; and a post-observation meeting in which reflective consultation was provided (Kucharczyk et al., 2012). Progress on school- and student-level plans and goals was monitored by school and research staff, regularly discussed during weekly coaching sessions, and reviewed in research staff meetings.
SAU as counterfactual
CSESA coaches were also assigned to SAU schools. They began the year by assisting schools in forming an A-team and provided a schoolwide workshop on autism as described in the CSESA condition, conducted training on goal writing as described previously, and provided resources related to the use of EBPs (e.g., websites, informational handouts). CSESA research staff (not affiliated with the school) shared the beginning-of-the-year APERS data but did not assist school staff in developing an action plan for improving quality. The A-team and school staff were informed that they would receive CSESA materials at the end of the 2-year study and training on any of the interventions that they requested.
Intervention Fidelity
To capture the breadth of implementation of this comprehensive program, CSESA investigators developed an implementation index approach, which was reported in Steinbrenner et al. (2020). The index incorporated data from research staff records (e.g., training and coaching logs), observations (i.e., teaming from APERS, fidelity ratings of intervention components), and document reviews (e.g., CSESA planning form, student intervention matrix). A 0-to-3 scaling rubric with performance anchors was used to document from these data the degree to which features of CSESA were implemented for the following CSESA model features: training, coaching, school planning, intervention quality, teaming, student planning, and student dosage. The mean CSESA implementation rating across features and schools yielded a scale score of 2.07 (SD = 0.38) out of 3.00, or 69%. The mean implementation rating in SAU schools was 0.47 (SD = 0.17), or 16%. Between groups differences were significant (t = 28.13, p < 0.001), with large standardized effect size (d = 5.43; 95% confidence interval [4.35, 6.53]). Space constraints prevent providing more details about this analysis and readers are referred to Steinbrenner et al. (2020). We collected data on five classes of dependent variables that we hoped would capture the range of outcomes
Dependent Variables
We collected data on five classes of dependent variables that we hoped would capture the range of outcomes expected from a comprehensive program with a heterogenous sample. These measures included the APERS, the GAS to assess individual student progress, a battery of standardized student assessments, standardized measures of caregiver burden and empowerment, and social validity measures.
APERS
The APERS is a program quality rating scale based on observations, interviews, and document analysis (Odom et al., 2018). It was collected at pretest and again at posttest. The APERS middle and high school version is a 66-item, 5-point rating scale, with a score of 1 indicating poorest quality, 3 indicating acceptable quality, and 5 indicating superior quality. The items are grouped into 10 domains (i.e., learning environment, positive classroom climate, assessment and IEP, curriculum and instruction, communication, social competence, personal independence, functional behavior, family participation, and interdisciplinary teaming). Because of the importance of the transition area, CSESA investigators created a transition composite variable with items across domains that reflect elements of the transition process.
To obtain information necessary for completing APERS ratings, CSESA staff (not the coach assigned to that school) spent 1 full day observing in a representative sample of classes and other program environments (e.g., gym, work-based learning settings) in which students with autism participated and conducted six to eight interviews with school staff and two parents, which provided information about the program that could not be observed (e.g., nature of the IEP meetings). Also, CSESA staff reviewed documents, such as the IEP, individualized transition plans, and behavior intervention plans. They then completed the APERS. Most schools had both inclusive (i.e., for standard-diploma students) and self-contained special education programs (i.e., for modified-diploma students), so the raters completed separate ratings for each program. A computerized program generated a total weighted score (i.e., based on the number of students in the school in both types of programs).
To examine reliability of the APERS for this sample, we used Cronbach's alpha to assess internal consistency for the standard diploma (e.g., more inclusive) and modified diploma (e.g., primarily self-contained) programs separately. Alphas were, respectively, .94 and .95 for the total scores and ranged from .61 to .88 and .56 to 0.88 for individual domains. For 12 of the 60 schools at both pretest and posttest (20%), a second rater simultaneously conducted the APERS assessments (across sites) to assess interrater agreement. Interrater correlation for the total score was 0.56. To analyze the consistency in raters’ scoring, the mean total scores were calculated for the primary and second raters (3.31, SD = 0.55, and 3.30, SD = 0.55, respectively) and were not significantly different. In addition, the mean difference between raters (e.g., on Item 2, one rater scored 2 and the other 4 would be a 2.0 rating difference) on individual items was 0.37 (SD = 0.35).
Goal attainment scaling
The GAS (Kiresuk & Sherman, 1968; Ruble et al., 2012) provided information about the progress that students made on attaining their individualized educational goals. The GAS is a rating of progress that students have made toward their identified goals. The ratings were 0 = current performance, 1 = initial progress toward goal, 2 = further progress toward goal, 3 = goal achieved, and 4 = progress beyond goal. Following the GAS psychometric equivalence testing format proposed by Ruble et al. (2012), CSESA staff provided training to teachers in CSESA and SAU schools to modify the form for IEP goals or create goals for students related to academic (reading comprehension), social, independence and behavior, and transition outcomes. Teachers developed the GAS goals at the beginning of the respective academic year when the intervention (e.g., social) was to be delivered and completed a GAS rating based on their student performance data at the end of the academic year. CSESA staff collected agreement data on the teachers’ initial and final rating of the GAS goals on 26.3% of the sample. Interrater agreement was 95%.
Standardized measures
Because the CSESA model addresses different potential outcomes for students and families, various standardized measures were collected at the beginning of the study (in the fall of the first year) and again at the end of the study (spring of the second year). The assessor or informants are indicated by superscript letters C for CSESA staff (measures administered directly with student), F for family, and T for teacher. The Leiter Nonverbal Intelligence TestC (Roid et al., 2013) and the Social Communication QuestionnaireF (Berument et al., 1999) were collected only at pretest to describe the sample. To assess student outcomes related to CSESA domains, the following standardized measures were collected at pretest and posttest: SRS-2 (Constantino & Gruber, 2012), the Woodcock Johnson Test of Achievement IIIC Passage Comprehension and Academic Knowledge subtests (Woodcock et al., 2001), the Vineland Adaptive Behavior Scale-IIT (Sparrow et al., 2006), the Support Intensity Scale–Children Short FormF,T (Thompson et al., 2004) and the American Institute of Research Self-Determination ScaleC,F,T (Wolman et al., 1994). In addition, family members completed the Family Empowerment ScaleF (Koren et al., 1992) and the Zarit Burden InterviewF (Zarit et al., 1985) to assess effects of the CSESA model on families.
Social validity
To assess social validity (Wolf, 1978), CSESA staff adapted the User Rating Profile (URP; Chafouleas et al., 2009), which A-team members completed at posttest. The adapted URP consisted of 27 six-point Likert-type rating items, with the rating items ranging from strongly disagree (1) to strongly agree (6). For this analysis, the items were grouped into five subdomains: importance of CSESA, training and coaching, participation in CSESA, communication with CSESA staff, and usefulness and effectiveness of the CSESA model. Cronbach’s alpha for the measure was .96.
Results
The findings in this study are grouped by the research questions.
Does the CSESA Model Affect the Quality of the Program Environment in High Schools?
We used an analysis of covariance (ANCOVA) to test CSESA effects on quality of high school environment postintervention as measured by the weighted total APERS adjusted posttest means. Covariates were total APERS preintervention weighted mean, school site (North Carolina, Wisconsin, and California), and socioeconomic status of the high school as measured by the percentage of students in the school receiving free or reduced lunch. There were significance differences, favoring the CSESA group, in APERS weighted mean postintervention scores, F(1, 54) = 17.16 p < 0.001, η2 = 0.24, d = 1.52 (see Figure 1). Next, this analysis was repeated for individual domain scores, with Benjamini-Hochberg procedure (Thissen et al., 2002) correcting for multiple comparisons. ANCOVAs showed significant differences, favoring the CSESA group, in adjusted postintervention means in the following domains: assessment, F(1, 54) = 11.4, p = 0.001, η2 = 0.17, d = 1.24; communication, F(1, 54) = 2.67, p = 0.026, η2 = 0.09, d = 0.85; functional behavior, F(1, 54) = 3.06, p = 0.016, η2 = 0.12, d = 0.90; instruction, F(1, 54) = 16.28, p < 0.001, η2 = 0.23, d = 1.48; social, F(1,54) = 13.06, p < 0.001, η2 = 0.40, d = 2.20; and teaming, F(1, 54) = 6.54, p = 0.013, η2 = 0.11, d = 0.95. Last, the ANCOVA analysis was conducted for the transition composite score, indicating significant differences favoring the CSESA group, F(1,54) = 12.03, p = 0.001, η2 = 0.18, d = 1.27.
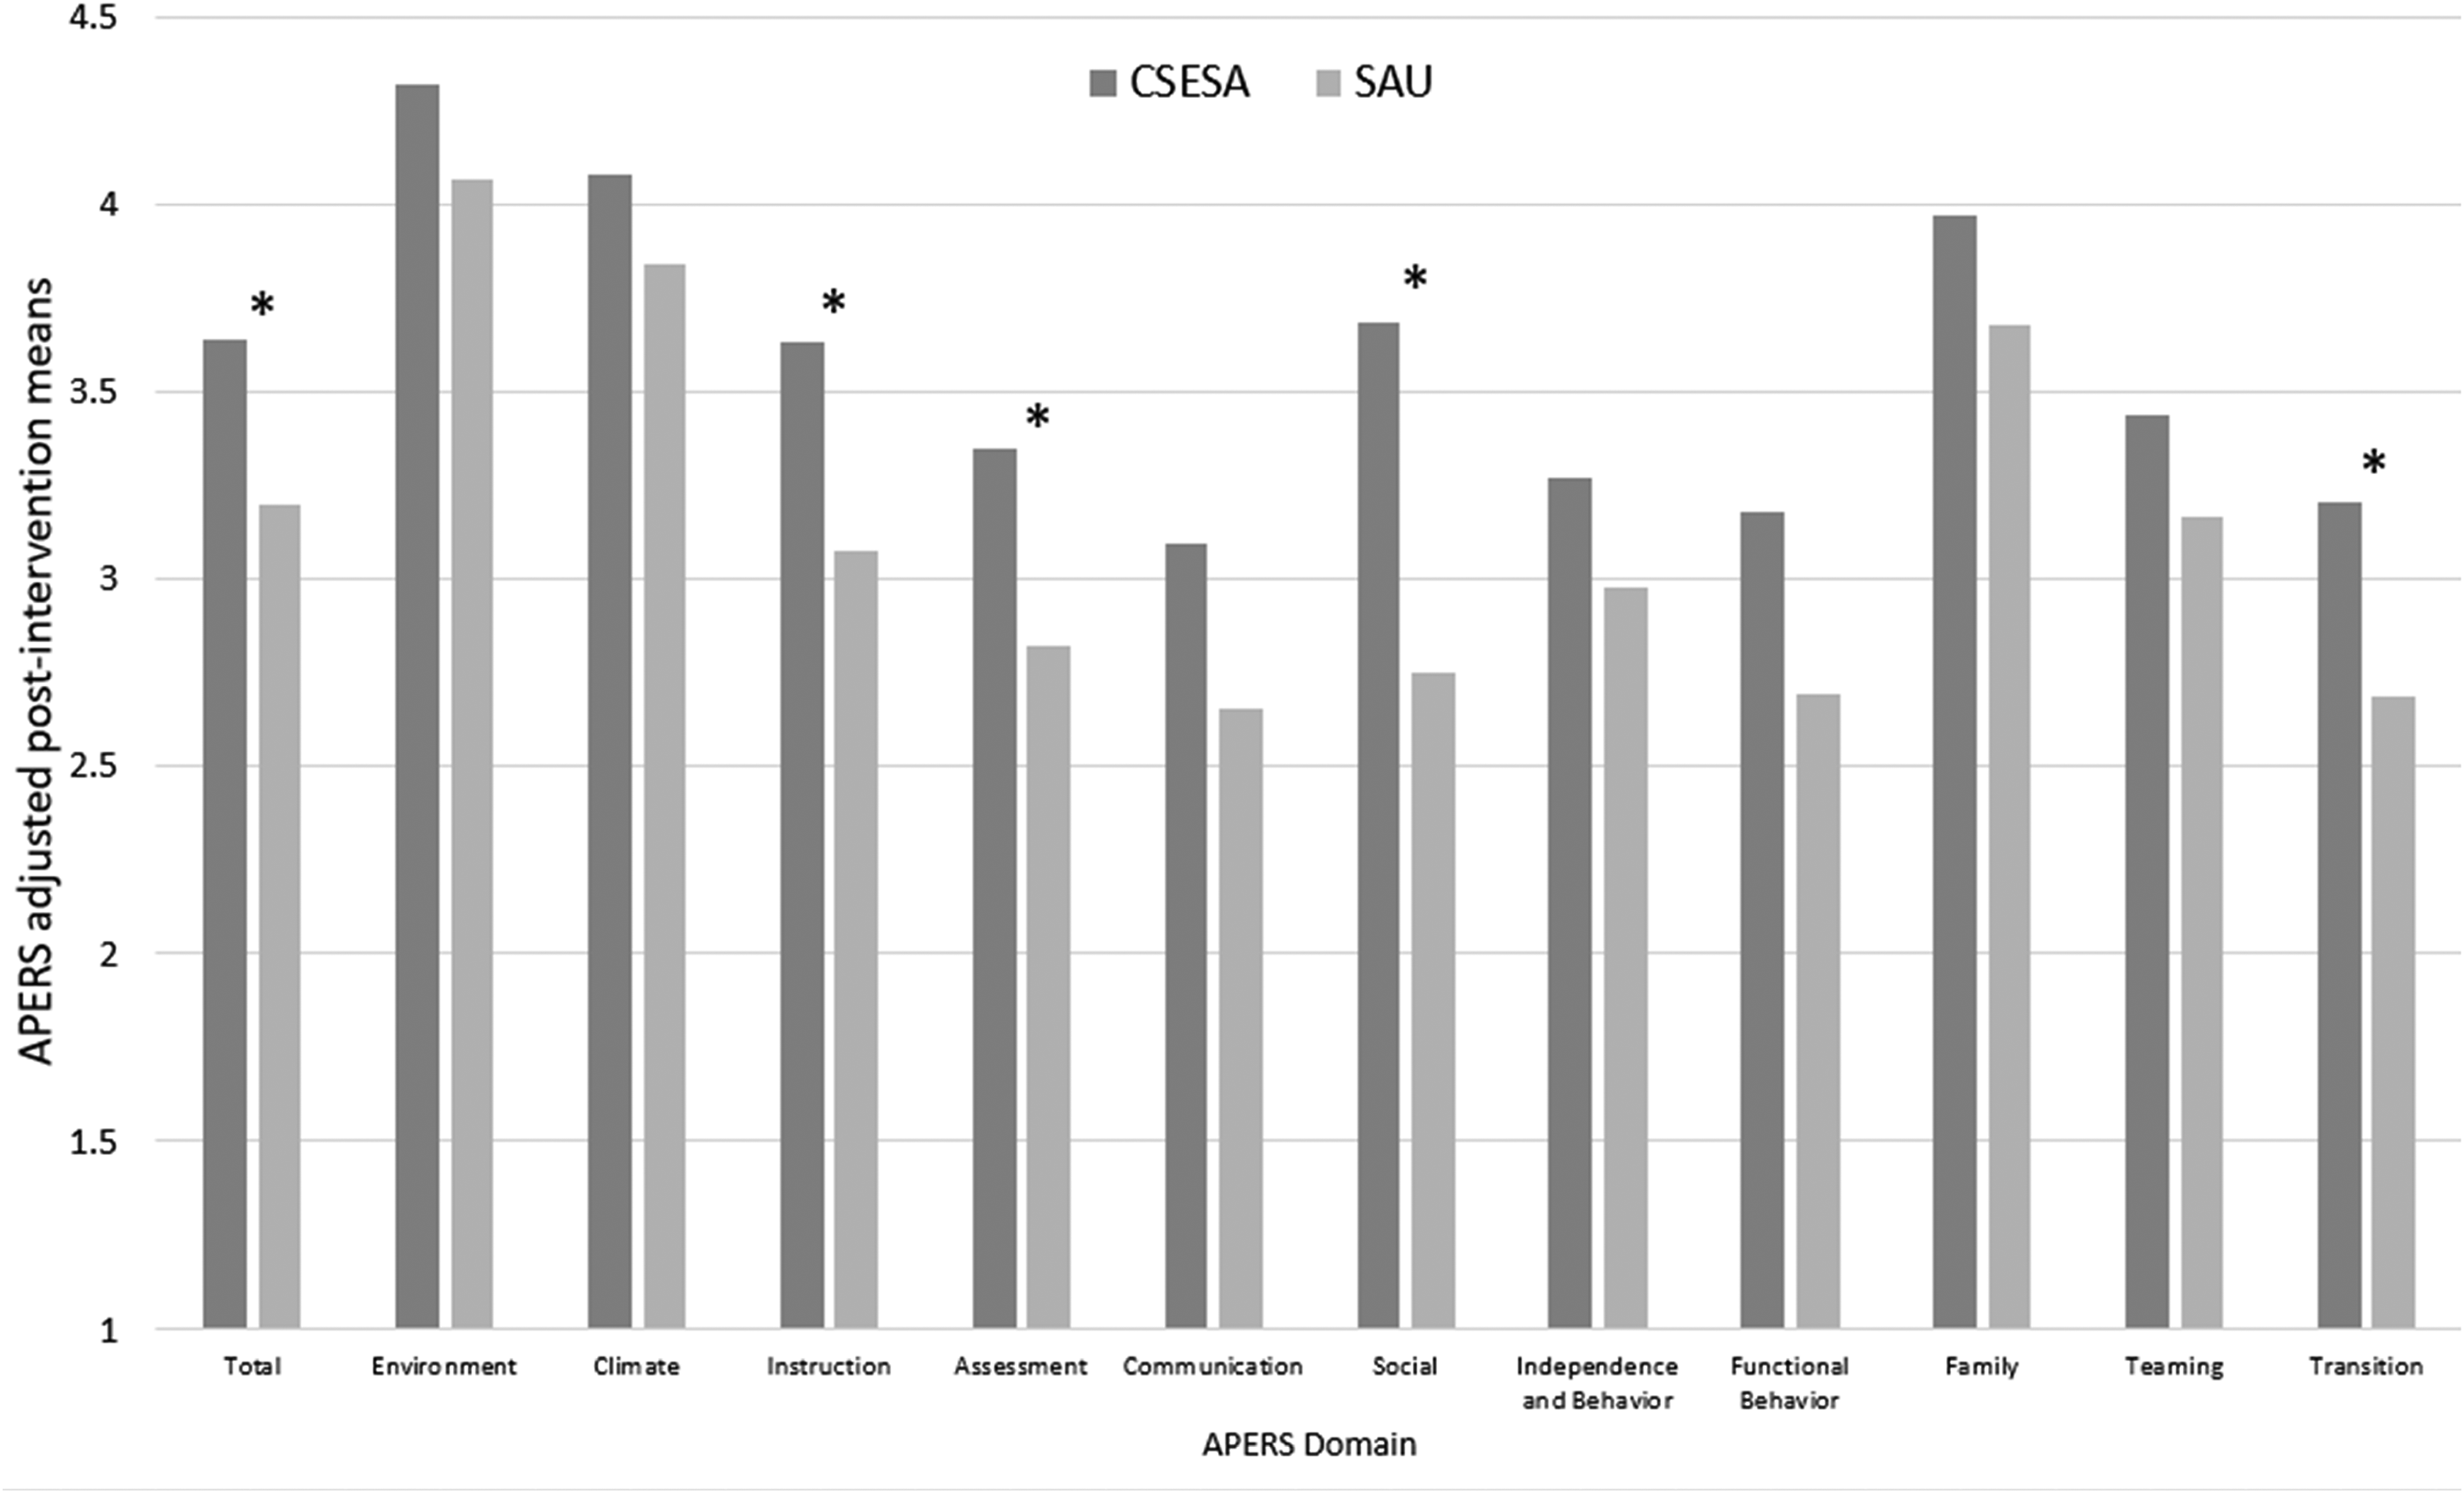
Autism Program Environment Rating Scale postintervention means adjusting for preintervention scores, site, and percentage of students in the school receiving free and reduced lunch, between Center on Secondary Education for Students with Autism (CSESA) and services-as-usual (SAU) schools. Asterisk indicates statistically significant difference between CSESA and SAU schools.
Does the CSESA Model Produce Changes in Students’ Acquisition of Their Individualized Educational Goals (Proximal Outcome)?
To evaluate the effects of CSESA on GAS outcomes, we employed a two-level (students within schools) hierarchical linear model (HLM) in which the student-level GAS outcomes are the dependent variables and school-level GAS effects are modeled in relation to the randomly assigned intervention condition. The models were fit using restricted maximum likelihood estimation. Details on the analysis are reported in the online supplemental materials. Results from the HLM analysis for each of the GAS outcomes are reported in Table 4. A significant difference favoring the CSESA group was found for total GAS scores, with a Cohen’s d effect size of 1.14. For the individual domains, the largest significant effect, favoring the CSESA program, was for social goals (effect size = 1.52), and there was also a statistically significant effect of large magnitude for academic and independence and behavior goals. The only outcome that failed to reach significance was for transition, although the estimated CSESA effect was also positive (effect size = 0.56).
GAS Descriptives and HLM-Based Estimates of CSESA Main Effects by GAS Outcome.
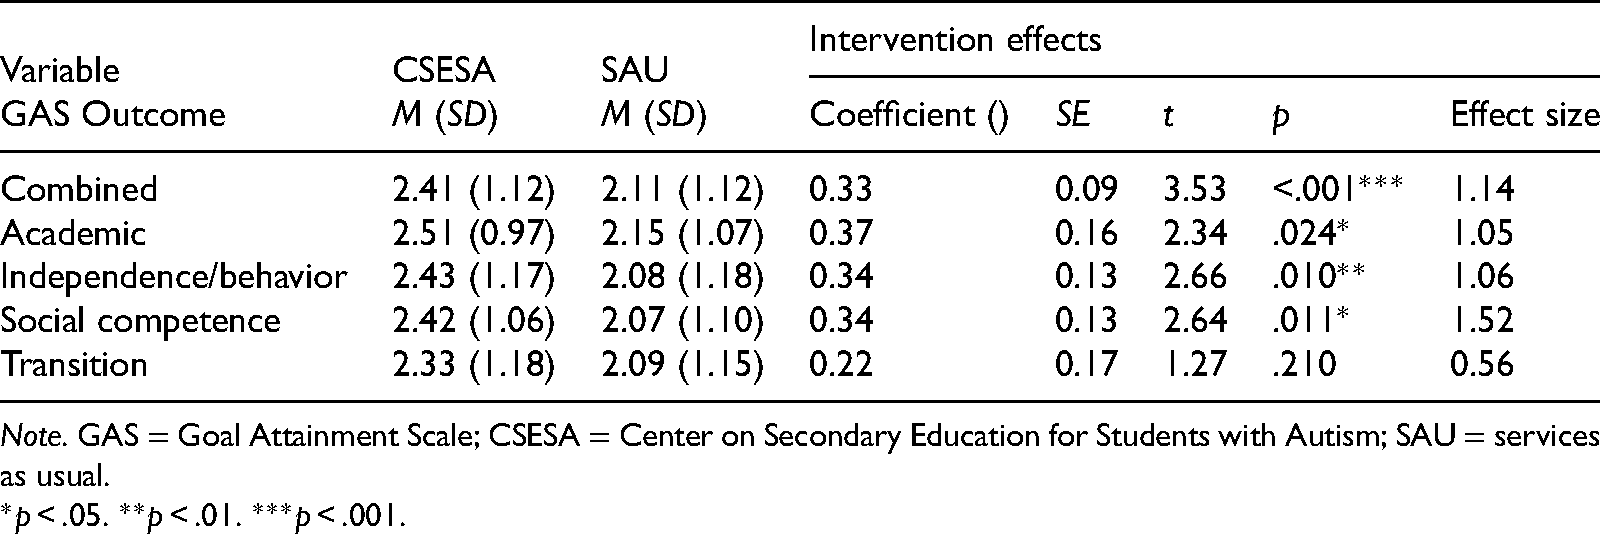
Note. GAS = Goal Attainment Scale; CSESA = Center on Secondary Education for Students with Autism; SAU = services as usual.
*p < .05. **p < .01. ***p < .001.
Does the CSESA Model Produce Positive Effects on Standardized Measures of Student Performance (Distal Outcome)?
The pretest and posttest means for the student variables are in Table 5. To evaluate the effects of CSESA on student outcomes on standardized variables, we conducted a two-level HLM in which the standardized postintervention measure is a student-level outcome variable, the standardized preintervention measure is a student-level predictor, and the randomly assigned intervention condition is a school-level predictor. Details on the analysis are reported in the online supplemental materials. Overall, the results indicated that there were no significant differences in the mean residualized change scores for CSESA compared with SAU schools for the standardized measures.
Pre- and Posttest Means of Outcome Measures.
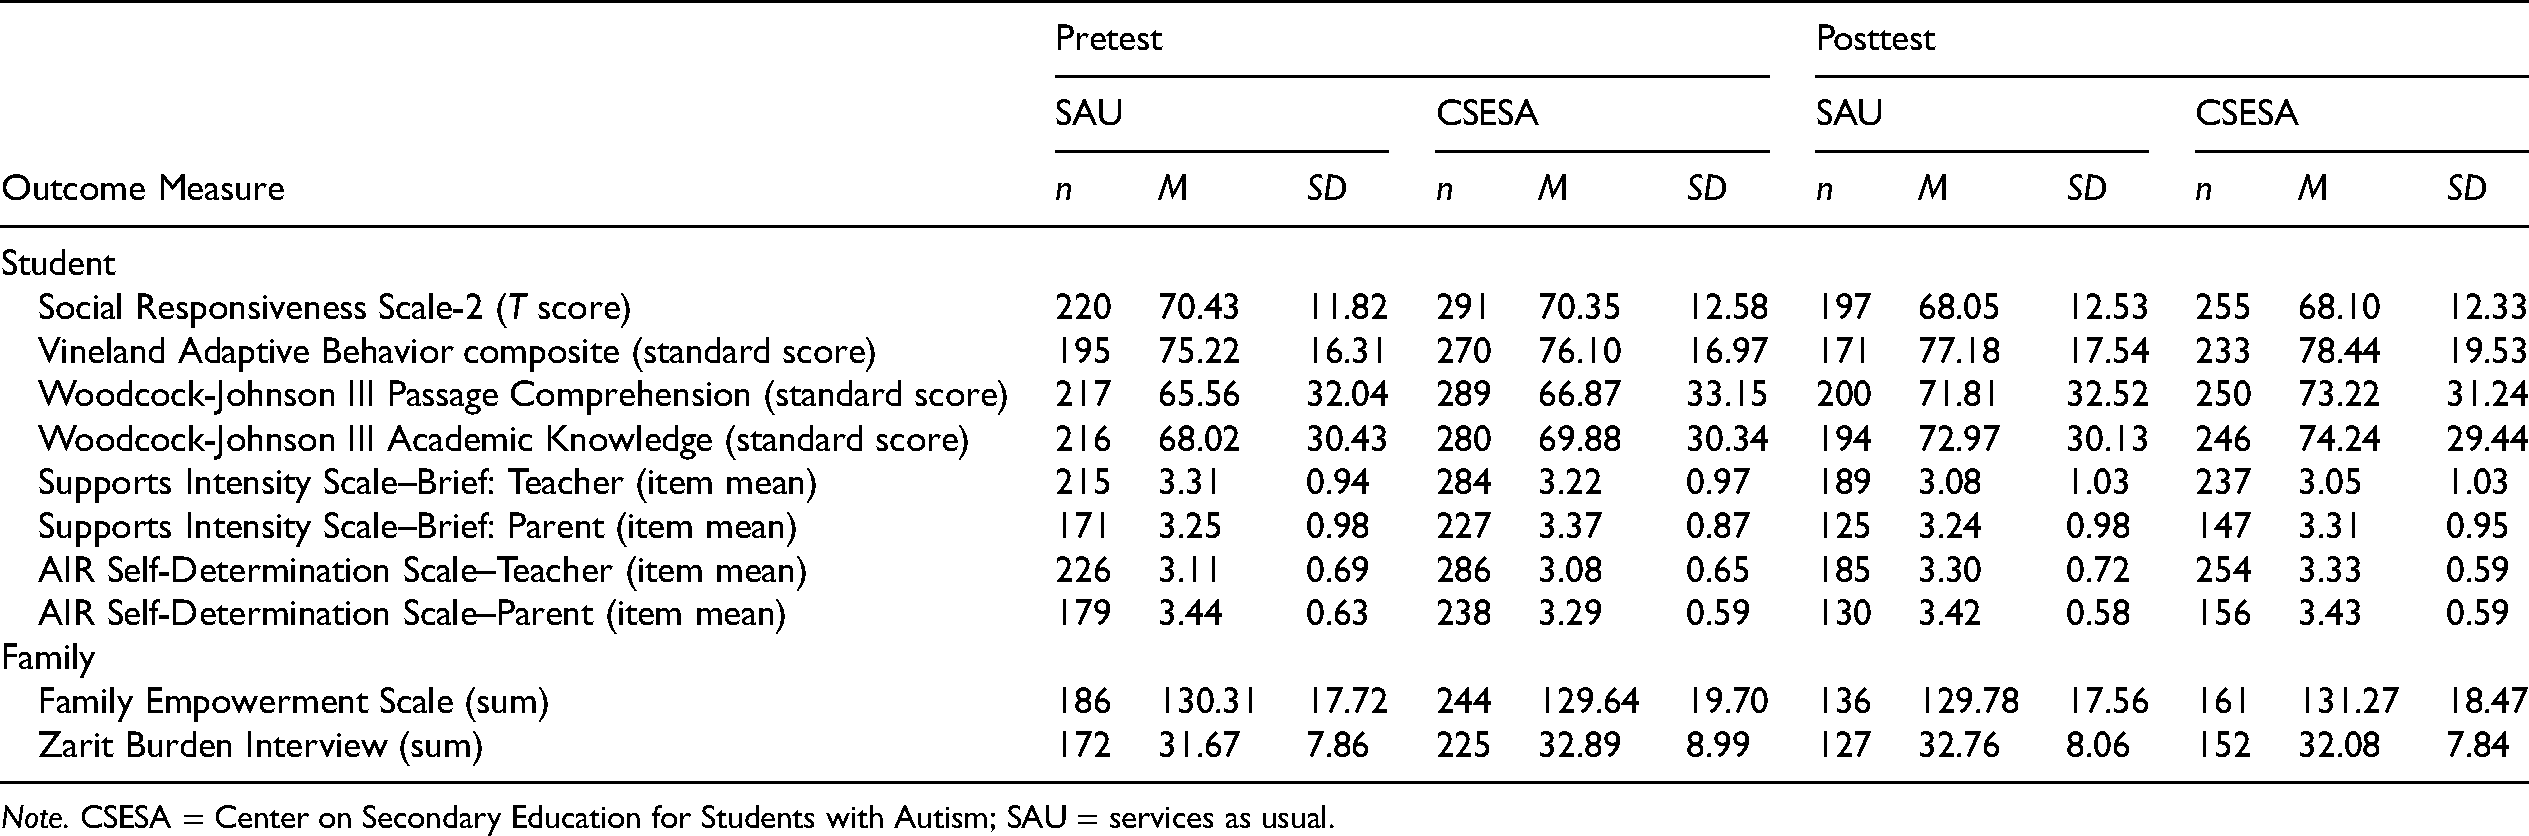
Note. CSESA = Center on Secondary Education for Students with Autism; SAU = services as usual.
Does the CSESA Model Have Positive Effects for Families?
The same analysis just reported and described in the supplemental materials was conducted for the Family Empowerment Scale and the Zarit Burden Interview. Means are reported in Table 5. Results showed no significant differences between CSESA and SAU schools.
What Is the Social Validity of the CSESA Model?
At the end of their 2-year implementation of the CSESA model, we asked A-team members to evaluate the social validity of the program using the adapted URP. The overall mean rating, from 107 A-team members across 20 CSESA schools (35% of eligible respondents), was 5.29 (SD = 0.64) out of 6.0. For individual features of the CSESA model, mean ratings were 5.37 (SD = 0.62) for training and coaching, 5.25 (SD = 0.89) for communication with CSESA staff, 4.61 (SD = 0.77) for participation in the CSESA project, and 5.25 (SD = 0.77) for usefulness and effectiveness of the CSESA model.
Discussion
The purpose of this study was to examine the efficacy of a comprehensive, school-based program for adolescents with autism. The first research question addressed program quality for students with autism. In a previous study, Kraemer et al. (2020) assessed program quality for the schools in the current study before intervention occurred, finding poor quality (i.e., mean ratings below 3.0) for the primary instructional domains (e.g., communication, social, and independence) as well as for programming related to transition. After the 2-year implementation, quality ratings were significantly higher for CSESA schools in comparison to the SAU schools. Importantly, the mean ratings across all APERS domains were above the 3.0 score (i.e., the APERS rating level indicating adequate quality) for the CSESA schools, but mean ratings were below the 3.0 level for SAU schools for three of four APERS domains most closely tied to CSESA program (communication, social, independence, behavior) as well as for the transition composite. These findings extend the work of Sam et al. (2021), who examined APERS scores in elementary schools before and after a yearlong intervention supporting teachers in their implementation of EBPs. They did not, however, find significant differences between their intervention- and control-group schools on the total APERS score, though additional analyses indicated a significant difference was found for the total ratings in inclusive programs but not for the special education classes (Sam et al., 2021). The APERS is a relatively new tool, and thus few programs have examined overall changes in program quality that result from intervention models implemented in schools, which could be a direction for future research.
The second question addressed in this study was about CSESA's effects on students’ goal attainment, a proximal student outcome. In the current study, significant effects favoring CSESA were found for total GAS mean ratings. These findings are similar to other studies that have had similar findings on GAS goals for students with autism. For example, in their examination of efficacy of the COMPASS project (i.e., a program-planning intervention) with high school students having autism, Ruble et al. (2018) found significant effects on the GAS for transition goals. This study extends the findings of positive GAS outcomes that have been noted in efficacy studies of school-based interventions with younger students (Dryden-Palmer et al., 2020; Ruble et al., 2010; Sam et al., 2020). This study extends the findings of positive GAS outcomes that have been noted in efficacy studies of school-based interventions with younger students
The third question addressed in this study was about the impact of CSESA on standardized, norm-referenced student outcome measures (distal outcomes). The research team employed a battery of standardized assessments as one type of student outcome measure for this project and found no significant difference between the CSESA and SAU conditions. Other school-based intervention programs have yielded nonsignificant effects on standardized measures (Mandell et al., 2013) but significant effects of measures more directly related to the intervention (Bacon et al., 2014; Boyd et al., 2018; Dryden-Palmer et al., 2020). Bacon et al. (2014) criticized standardized measures for “lacking of sensitivity for measuring small or slow progress, testing constraints that may affect the child's performance, and the lack of information provided by the assessments that can be used to guide treatment planning” (p. 1). Several factors may have contributed to the nonsignificant findings of the CSESA model. First, there may well be a “sleeper” effect for the CSESA intervention. The sleeper-effect phenomenon occurs in experimental studies when initial findings are nonconclusive but significant differences attributable to an intervention or program appear later (e.g., Barnett, 2011). It may take time for changes in program quality and proximal outcomes to affect student outcomes, so it is possible that with more time there will be a significant impact on student distal outcomes. Next, school staff turnover resulted in different informants completing rating scales at pretest and posttest. Staff who participated in the intervention components (e.g., implemented Social Competence Intervention) may have learned more about ability constructs (e.g., social competence) during the course of the intervention, and this may have affected posttest ratings (e.g., on the SRS-2). Perhaps most importantly, standardized assessments generate information about constructs (e.g., adaptive behavior). Teachers’ instruction is usually directed to individualized student goals rather than items on standardized measures, so one could expect that a GAS measure would map more closely onto the content taught than would standardized measures and be more sensitive to intervention effects. Last, it may be that the minimal intervention provided to SAU schools had some impact on student outcomes.
The fourth question addressed family outcomes. As autistic students move toward transition out of school and into the community, school-based programs may be as important for families as any time since the early intervention period. The Transitioning Together (TT) program was a feature of CSESA designed to prepare families for this transition, because family members become the major advocates for many autistic individuals after they leave school. We anticipated that the two standardized family measures would reflect positive family outcomes for CSESA students, which they did not. Of all the components, TT was the least implemented. Because the program was implemented outside of traditional school hours of operation, there were implementation challenges related to staff availability. When implemented, it was done with support from community agencies or other resources. Although TT is a valuable program for families and their adolescent autistic children (DaWalt et al., 2018), it may be out of the range of services that school are able to provide.
The final question related to the perceptions of the CSESA intervention and implementation process. Overall, the school staff provided positive ratings for the CSESA program. Given the complexity of high school environments and the competing priorities faced by high school educators, the high levels of social validity reinforced the importance of establishing these models in high school settings. Notably, the lowest rating (although still positive) was related to involvement in the CSESA project (as opposed to the CSESA model). Anecdotally, some of the tasks that were project related (e.g., pre- and postintervention standardized assessments) were not as well received compared with model-related tasks (e.g., Secondary School Success Checklist assessment that linked to goal development). Previous research has linked knowledge and social validity of specific EBPs to increased use of those EBPs (McNeill, 2019; Sulek et al., 2019), highlighting the importance of positive social validity ratings. Overall, the school staff provided positive ratings for the CSESA program
Limitations
We encountered significant challenges in conducting this cluster randomized design in typical high school settings over a 2-year period. There was substantial turnover in school personnel and leadership not related to the project, and we did not have demographic data on all A-team members and implementers, thus limiting our ability to link implementation variability and staff characteristics. Also, the nature and variability of class scheduling in high schools (e.g., class times alternating across days, block vs. standard classes, changes in teachers by semester) complicated planning and implementation of features of the model. The continuum of ability levels (e.g., some students with intellectual disability, some with average-to-high intellectual abilities) and autism severity required that we develop and implement different curricular approaches to address the same outcomes (e.g., different approaches developed to address reading comprehension for students with varied abilities; see Table 1). Similarly, the diploma track dictated in many instances the opportunities available (e.g., students in general diploma track had more limited access to curriculum linked to independent living skills and transition experiences). Although cluster randomized control trials are often identified as the gold standard for research in education, this study suggests they do not fit well with the realities of the public school context. Researchers from education (Lortie-Forgues & Inglis, 2019; Styles & Torgerson, 2018) and other disciplines (Bédécarrats et al., 2017; Cartwright, 2007) have also questioned the viability of randomized group methodology for examining efficacy of complex intervention programs.
Last, it was not possible to have assessors or informants (e.g., teachers, parents) who were uninformed about hypotheses, conditions, and so on except when the research staff administered the measures. Though coaches for individuals schools did collect fidelity data, they did not collect the APERS at their own schools, to control for possible bias, but APERS data collectors were not naive to the experimental condition, and interrater agreement, although acceptable, was lower than ideal. As such, readers should interpret these findings with caution.
Practical Implications and Future Directions
The current study has several practical implications. In most high schools, the learning needs of students with autism vary greatly, and for schools to meet those needs required a coordinated and comprehensive response. The key elements of such a response are (a) formation of team in the school with support from school leadership, (b) identification and adoption of practices that focus on such learning needs (e.g., social competence, behavior, academics, transition), (c) professional development, and (d) coaching support, at least during the early phases of implementation. The CSESA program provides practical guidance for such a school-based response to student learning needs. Notably, the program is “modular” (Kasari & Smith, 2013) in that school leaders could decide to adopt component features of the CSESA program (e.g., peer networks to promote social engagement, family support and education in preparation for transition, implementation of specific EBPs to increase independence).
Conclusion
The current efficacy study of the CSESA program is the largest study to date of a school-based program for autistic adolescents. It resulted in positive changes in the quality of the school and produced significantly more positive attainment of students’ learning goals, relative to standard practice, and was well received by program staff. Although labor-intensive and requiring a multiyear commitment, it was well received by the school autism teams. In addition, the next step will be to examine the young-adult outcomes of study participants as they and their families make their transitions out of school and into the community.
Supplemental Material
sj-docx-1-ec-10.1177_00144029211062589 - Supplemental material for Efficacy of a School-Based Comprehensive Intervention Program for Adolescents With Autism
Supplemental material, sj-docx-1-ec-10.1177_00144029211062589 for Efficacy of a School-Based Comprehensive Intervention Program for Adolescents With Autism by Kara Hume, Samuel L. Odom, Jessica R. Steinbrenner, Leann Smith DaWalt, Laura J. Hall, Bonnie Kraemer, Brianne Tomaszewski, Christopher Brum, Kate Szidon and Daniel M. Bolt in Exceptional Children
Supplemental Material
sj-docx-2-ec-10.1177_00144029211062589 - Supplemental material for Efficacy of a School-Based Comprehensive Intervention Program for Adolescents With Autism
Supplemental material, sj-docx-2-ec-10.1177_00144029211062589 for Efficacy of a School-Based Comprehensive Intervention Program for Adolescents With Autism by Kara Hume, Samuel L. Odom, Jessica R. Steinbrenner, Leann Smith DaWalt, Laura J. Hall, Bonnie Kraemer, Brianne Tomaszewski, Christopher Brum, Kate Szidon and Daniel M. Bolt in Exceptional Children
Footnotes
Notes
Authors’ Note
The work reported here was supported by the Institute of Education Sciences, U.S. Department of Education (grant R324C120006) awarded to UNC-Chapel Hill. The opinions expressed represent those of the authors and do not represent views of the Institute or the U.S. Department of Education.
Supplemental Material
Supplemental material for this article is available online.
Manuscript received December 2020; accepted October 2021.
References
Supplementary Material
Please find the following supplemental material available below.
For Open Access articles published under a Creative Commons License, all supplemental material carries the same license as the article it is associated with.
For non-Open Access articles published, all supplemental material carries a non-exclusive license, and permission requests for re-use of supplemental material or any part of supplemental material shall be sent directly to the copyright owner as specified in the copyright notice associated with the article.