
Abstract
The main objective of this article is to showcase the major activities/processes each exporter/importer needs to go through in any land port, seaport or airport. The article looks into the processes, time taken during various processes, the perceptions of stakeholders about the extent of challenges they face during these processes and the logistics costs. Finally, the article provides a comparison across exporting ports in terms of their efficiency in clearing cargo. However, we have also attempted to measure of the efficiency of the port in terms of cargo offloading.
Keywords
Introduction
At the outset, economies across the world in the last two decades have witnessed greater regional and economic integration due to gradual reduction in tariff and non-tariff barriers across nations. Independent nation states, such as those in Europe, have given way to economic communities, while in other countries, regional agreements about trade, investment and the mobility of people have reduced the barriers to a considerable extent to cross-border economic engagement. Most of the countries adopted outward-looking economic policies to promote growth and employment through expanding export-oriented activities. All countries nowadays court multinationals to promote growth and increase the productivity of investment. Typically, multinationals locate production processes across nations to reap benefits from lower cost of production and raw materials. This necessitates movement of parts, components, semi-manufactured goods and sub-assemblies across nations at a fast pace with minimal impediments/cost. Furthermore, increased competitive pressure in today’s world has made all firms to be cost conscious. The outsourcing to lower cost firms and countries has become a major source of cost reduction. Reduced inventory costs through just-in-time manufacturing and an efficient supply chain management has been another effective instrument for cost reduction. With worldwide fall in tariff levels, efficiency of supply chains and associated logistics costs have become core determinants of competitiveness for both firms and countries. This trend is now very much evident in the First World economies as well as in fast growing East Asian economies.
Of late, India has been proactive to make India a part of the global supply chains and a manufacturing hub. However, the high logistics cost in India as compared to other countries with similar environments and states of development is a matter of concern for the attainment of high manufacturing growth and to be a hub of the global supply chain (Armstrong & Associates, 2017; Pohit et al., 2019a). Several reasons are cited for the high logistics costs in India (AVALON Consulting, 2017; Cygnus Business Consulting & Research, 2007; Pohit, 2016). These include an unfavourable policy regime, lack of a multimodal transport system, the consequent heavy reliance on road transport, fragmented storage infrastructure, the presence of multiple stakeholders in the entire transport and storage value chain, inferior quality of road and port infrastructure, and the absence of technology intervention in storage/transportation and distribution activities. While everybody understands the need for keeping the logistics cost on the lower side, no considerable effort has been made in India to quantify the same and track its changes over the years. Pohit et al.’s (2019b) report on logistics cost throws light in this context that tried to understand the logistics costs across major domestic/export routes and to quantify the macro logistics costs of India. However, the study did not try to measure logistics costs across various activities within a port. To best of our knowledge, no attempt has been made by other researchers to measure the same in recent years.
No doubt, it is important to quantify the time required for various activities within port and to benchmark the same against international norms. The time loss in various activities within the port affects the exporter/importer adversely and, as a consequence, the competitiveness of the country. In this context, this article tries to map the major activities/processes each exporter needs to go through in the selected land port, seaport or airport. This enables us to look into the processes, time taken during various processes and perceptions of stakeholders about the extent of the challenges they face during these processes. Taking these factors into account, the article provides a comparison across exporting ports in terms of their efficiency in clearing cargo, which is measured in terms of time taken in various stages of cargo handling within a port.
Data and Methodology
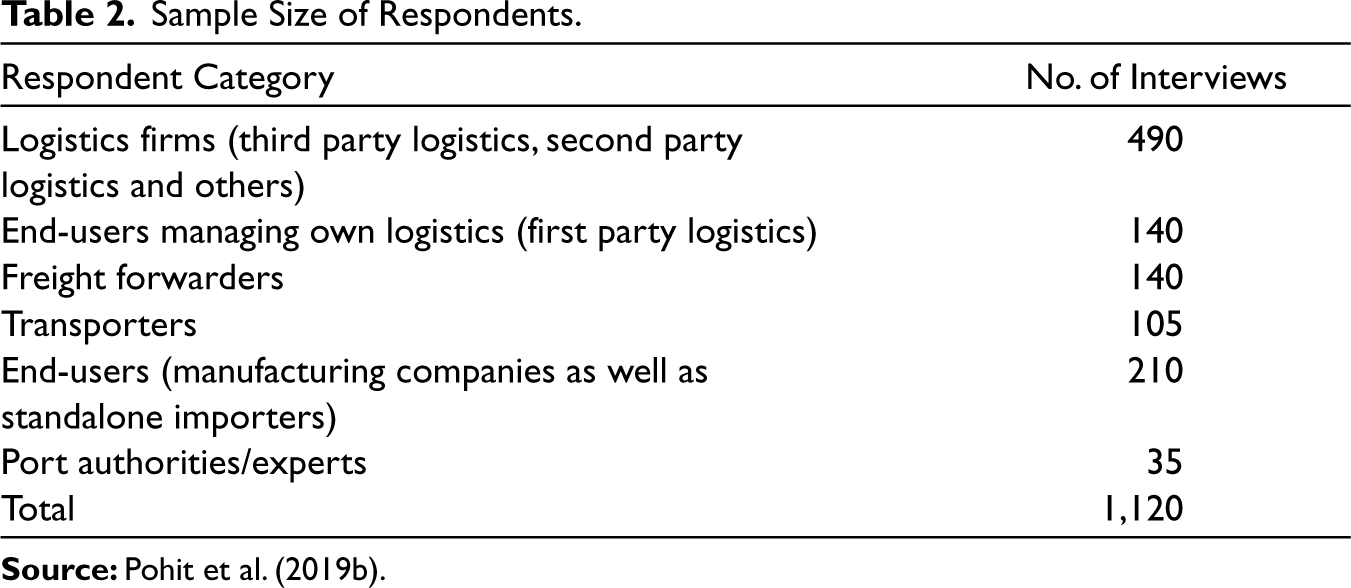
Given the limited published data in this area in India, we had to resort to a pan-India survey to collate information on the aforementioned issues. 1 The primary survey included interactions with the logistics firms (third-party logistics, second party logistics and Others), standalone warehouse operators, end users managing own logistics (first party logistics), freight forwarders/clearing agents, transporters, end users (manufacturing companies as well as standalone importers) and port authorities/experts. Interviews were conducted with two sets of stakeholders to collect data. First, interviews with the top officials of the companies were conducted using a semi-structured questionnaire. It is well understood that the top officials of companies at either the corporate offices or the regional offices would be well versed with relevant information about the sector and can provide the same with views from top level as well as grassroot level. Hence, in-depth discussions were held with this group with open-ended questions to obtain facts as well as their perceptions about various aspects of the logistics sector. However, certain information, such as logistics costs and similar ones that are standard hard numbers in nature, was captured through structured questionnaire from this group as well as others.
We have used 11 variables for the article from the entire date set used in Pohit et al. (2019b). These variables represent parameters such as logistics time, logistics costs and perception of the stakeholders about various logistics-related activities, primarily within the port area. It does not include transport cost of movement of merchandise outside the port premises. To make it a holistic assessment of the ports, considering origin and destination for products, we have considered indicators that represents activities in the ports. Following are the list of variables we have considered for our analysis:
Logistics time in hours, Demurrage cost as percent of logistics cost, Ease of customs and documentation measured on a scale of 1–10, with 1 being the least hindrance, Cost of customs clearings as share of total logistics cost, Speed money as percentage of logistics cost, Overall perception of bribes as hindrance to business, measured on a scale of 1–10, with 1 being the least hindrance, Harassment by gangs/pilferage or leakage measured on a scale of 1–10, with 1 being the least hindrance, Time taken in hours from unloading of cargo to customs check at storage yard, Time taken in hours from customs check at storage yard to goods finally move out of port for importers, Time taken in hours from the cargo transported to port to inspection by CEBC officials for exporters, and Time taken in hours from completion of CEBC official’s inspection to cargo loaded on vessel.
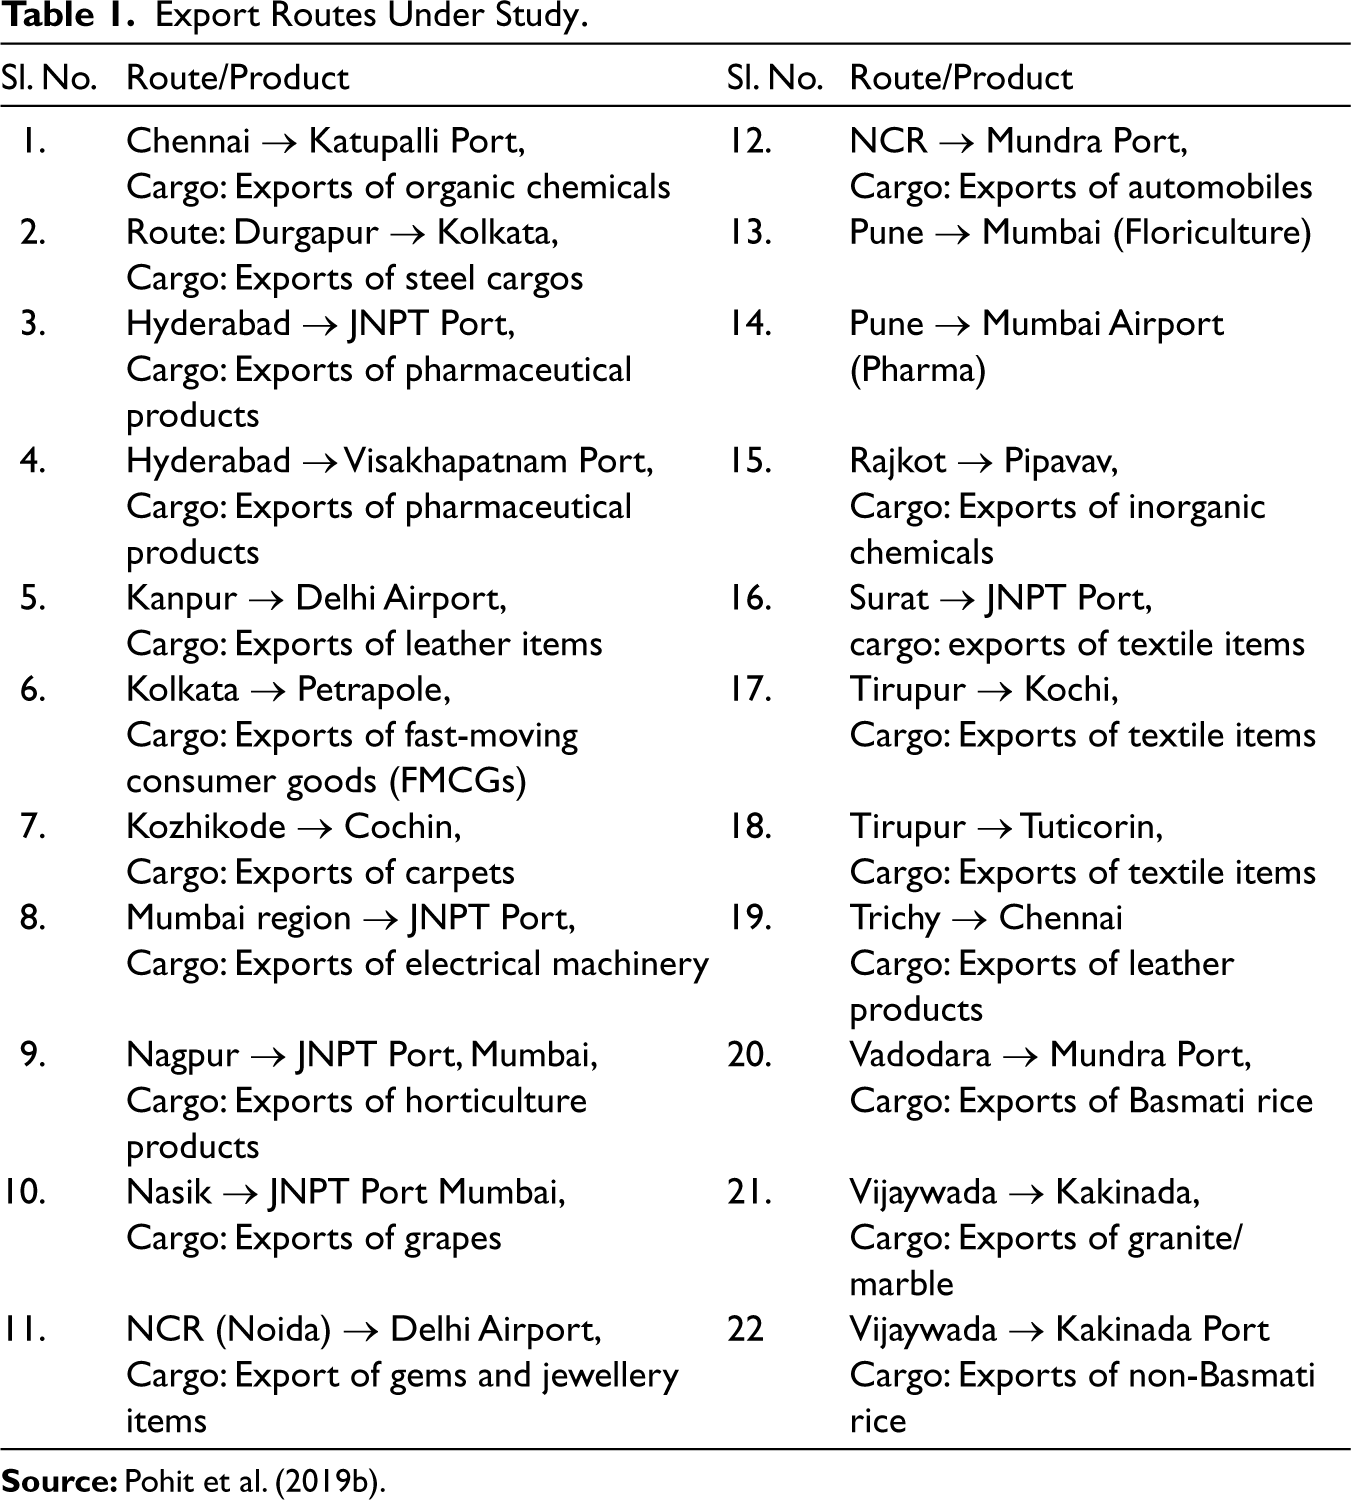
In our study, 22 major routes for export cargoes were selected (see Table 1). We have tried to ensure an all-India coverage. Here, we describe our selected routes and the commodities chosen for our study The sample size of the primary survey is given in Table 2.
Export Routes Under Study.
Sample Size of Respondents.
Creating the Index of Logistics Performance of the Ports
The logistics performance index of port is a summary measure of the performance parameters of the port based on the 11 logistics=-related parameters as mentioned earlier. Several methodologies are available for indexation purpose. These include a simple combination of variables as well as a model-based composite index. The choice of methodology often depends on whether weights are used to construct the composite index. These weights reflect the relative importance of each of the variables in capturing the phenomenon in question. Mostly, the model-based composite index is used when weights are to be determined in an unbiased manner. Otherwise, either equal weight or subjective weights are assigned to arrive at a composite index (see Kundu, 1980). Our data is a mix of continuous and categorical variables, and thus it does not allow us to opt for a model-based composite index. Since subjective weights are avoidable unless the relative important of the variables are known in a confirmed manner, the article avoids that option also. The best possible method for constructing a composite index is a simple linear combination of variables with equal weights. This study adopted the indexation methodology as used in Human Development Report 2020 (United Nations Development Programme [UNDP], 2020a) as well as in many other studies such as The Global Competitiveness Report 2019 (Schwab, 2019). The final index has been calculated in two steps as given:
Step 1: An index for each variable was created using the values for the best and the worst performers in terms of logistics.
This is done in order to transform the variable expressed in different units into indices between 0 and 1. These can be considered as ‘the natural zeros’ and ‘aspirational targets’, respectively, from which the performance indicators are standardised (UNDP, 2020b). The equation used for the purpose is given as follows:

Note that some of the port-related data is captured in a manner that was inversely related to logistics performance of the port. 2 To take care of this issue, the individual index was computed as 100 minus the index value obtained using the given formula. This translates the index value to be positively correlated with the performance. In other words, the individual index value is calculated in a manner that it can be interpreted as that the higher the index value, the better is the performance.
Step 2: All the individual index values were combined linearly to obtain the final composite index value. This assigns equal weight for all variables considered.
A critical point to be noted is that like most other indexation methodologies, the index constructed through this methodology is also relative in nature. It can only provide a comparative picture with the selected set of units considered for index computation. Comparing the index values with any entity outside this set is strictly not possible. Therefore, any comparison is valid within the set of the selected ports only for the current study.
Analysis of Results
Before presenting the index, it is worth understanding the process that every consignment needs to go through during export.
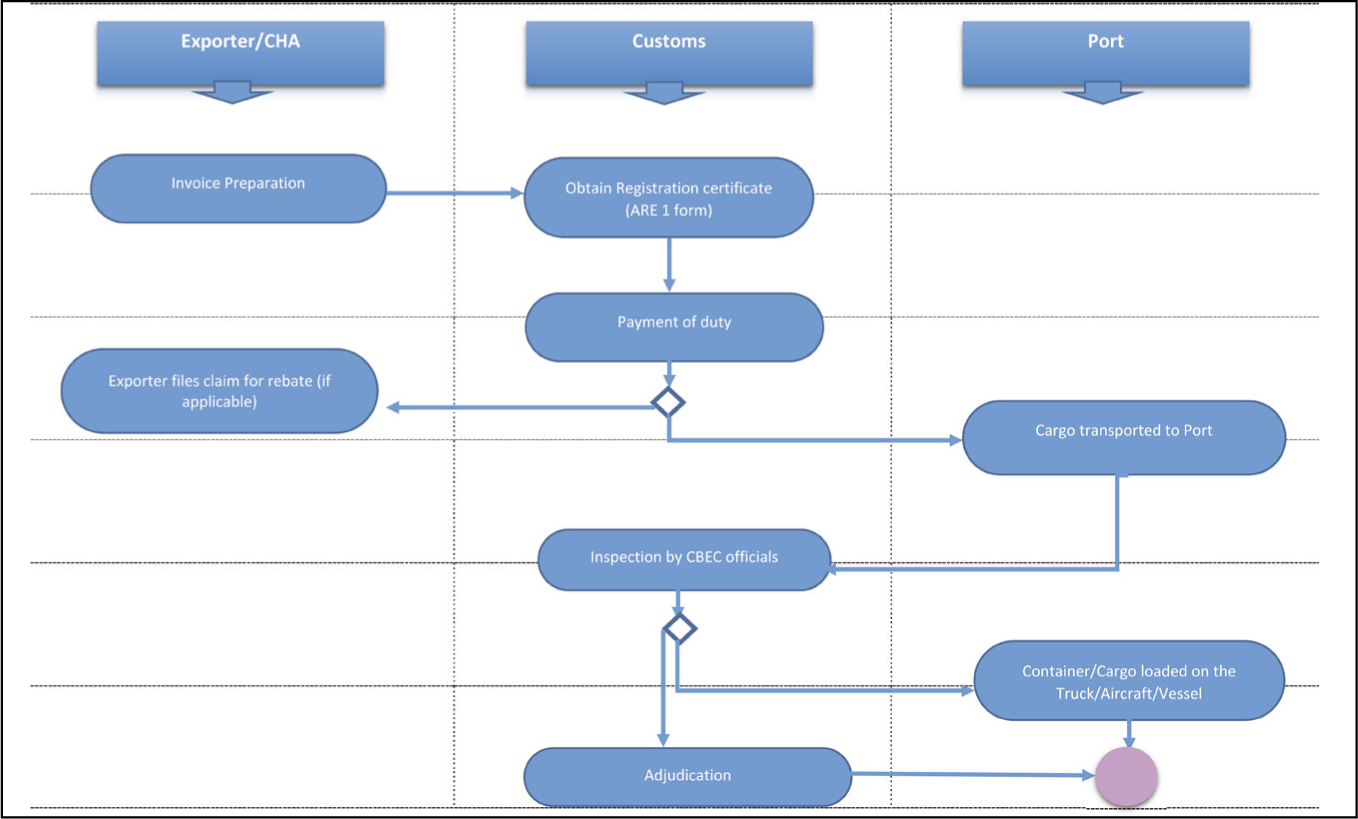
An export consignment goes through two major phases within a port once it reaches there (see Figure 1):
From the cargo transported to port till inspection of the cargo by CEBC officials. Completion of CEBC inspection till the cargo loaded on vessel/aircraft/truck.
We have analysed data for all individual ports that are exporting commodities to other countries. 3
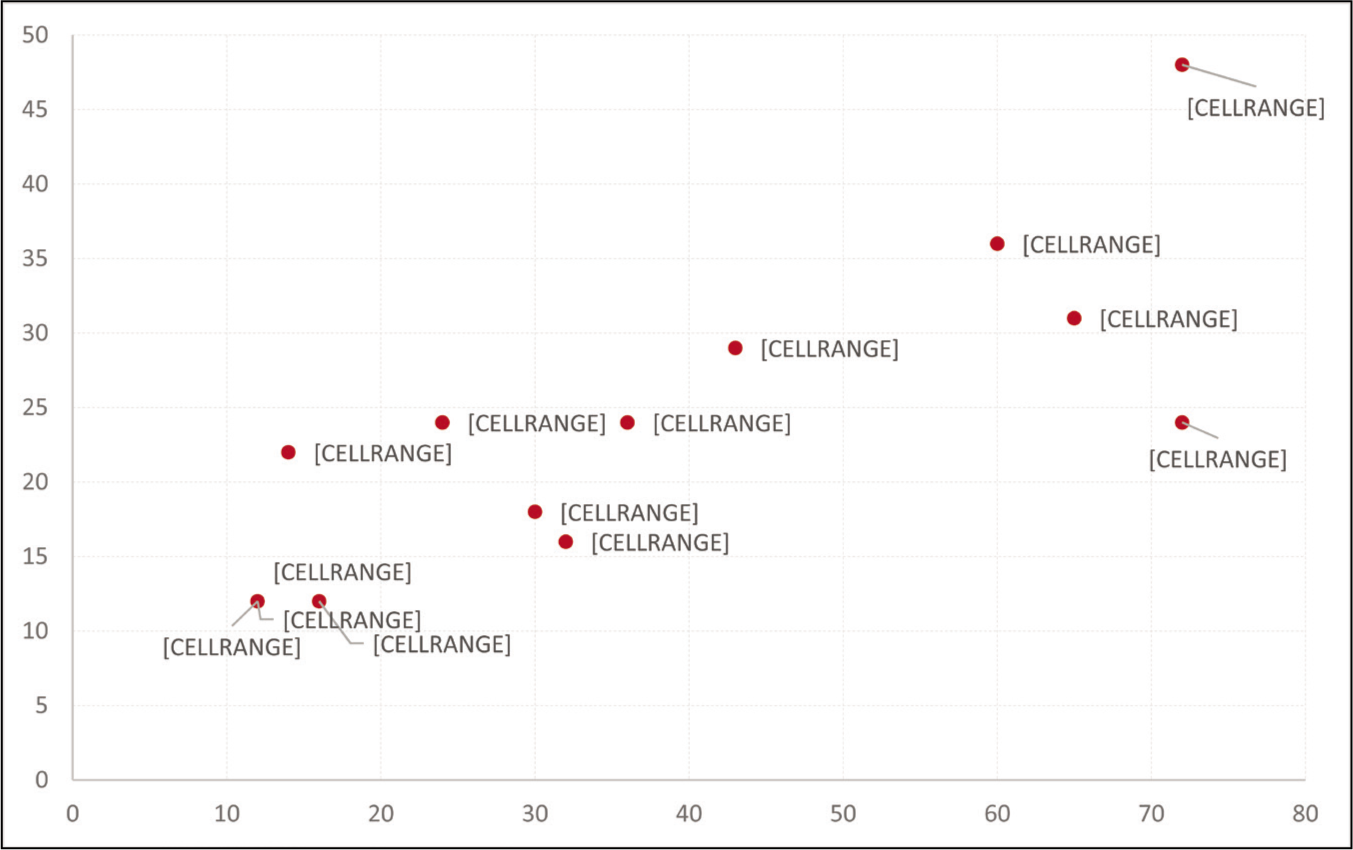
Large variation is observed in terms of average time taken for export consignments during these two processes as reported by exporters. The maximum and minimum time taken for each of these processes for export consignments are given as follows:
From the cargo transported to port till inspection of the cargo by CEBC officials—Maximum 72 hours and minimum 12 hours. From completion of CEBC inspection till the cargo loaded on vessel/aircraft/truck—Maximum 48 hours and minimum 12 hours.
An interesting observation from the data is that the performance of ports in terms of time taken in various activities within the port is more or less similar. We have examined the association between time taken during the above two broad activities within a port (Figure 2). The plot shows a correlation coefficient of 0.82 between these two variables. This suggests that if improvement of performance is planned, it needs to be planned in a holistic manner and not specifically for a particular activity. The reason being that the evidence from exporters feedback suggests that if the time needed for one activity in a port is higher compared to other ports, it is also higher for other activities in the respective port. Thus, performance improvement requires an overall enhancement of service quality of the ports instead of any one specific parameter.
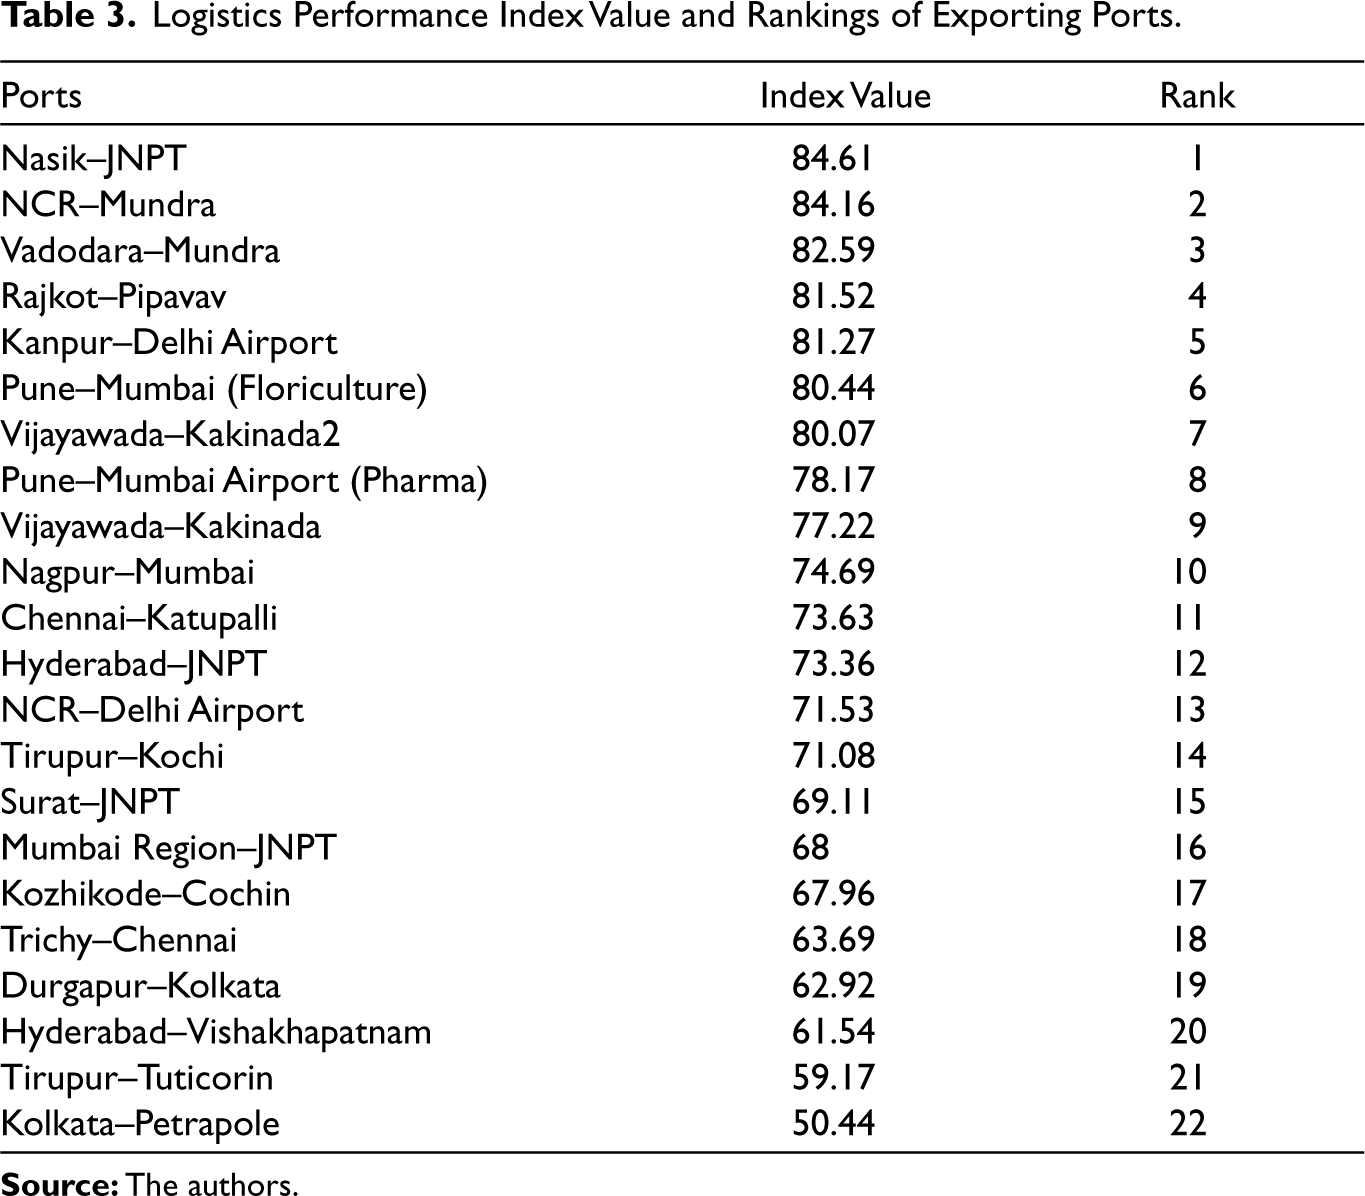
The performance of the exporting ports is presented in Figure 3 and Table 3. The analysis shows that the ports’ overall performance also depends upon the product that is being exported. For instance, JNPT is the top-ranking port as reported by exporters of Nasik–JNPT route who generally export grapes. However, JNPT ranks lower by the exporters who export pharmaceutical products or textile items in Hyderabad–JNPT route or Surat–JNPT route. This suggests that priorities may differ based on the perishable nature of the exporting products also. The top five ports in the country are JNPT, Mundra, Delhi airport and Mumbai airport. The four bottom ranking ports are Petrapole, Tuticorin, Vishakhapatnam, Kolkata and Chennai, in that order. An important aspect to notice is that the ports or airports located in the western and northern parts of the country are amongst the top performers. The ports located in the eastern and southern parts of the country are amongst the worst performers in general.
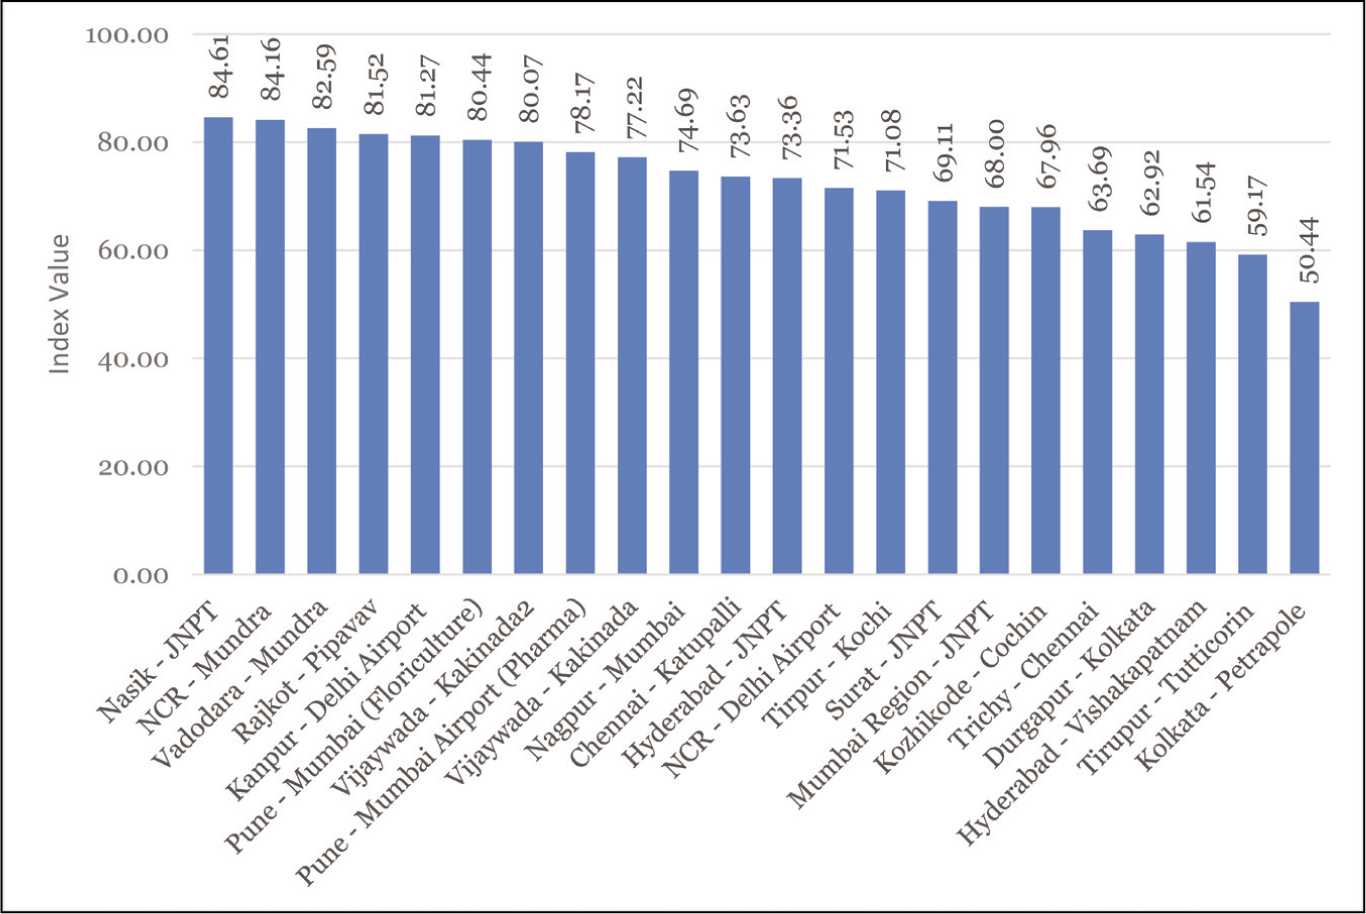
Logistics Performance Index Value and Rankings of Exporting Ports.
Two important implications of the study are critical for all stakeholders. The first one is that the exporters in the country are operating in a level playing field. The logistics cost varies significantly across ports. This affects the competitiveness of the exporters in the global market. However, this also allows them to work towards a cost-benefit before choosing a specific port/s for their consignments considering the entire logistics cost because of numerous factors. These factors also include the time taken within ports for specific activities. The study also throws light on performance of specific activities with each of the ports analysed. This is critical for decision-makers within port authorities as well as for policy-makers to devise a mechanism that can address key causes to reduce time taken within ports for various activities regarding export consignments. This will not only help the exporters but will also help India’s export scenario in global market through reducing prices commensurate to savings in logistic costs.
A few areas regarding process reengineering that the port authorities or policymakers need to look into are as follows:
Identifying existing non-value-adding activities or redundancies in the entire process do not improve performance but are time consuming, Duplications of work in terms of documents checking or material checking, Identifying inefficiency nodes or congestion points within ports, and streamline them to remove the root causes of the inefficiencies, Existing bottlenecks that affect quick clearance process on part of the officials, Wherever possible, technology and digitisation of documents/processes should be introduced so that human intervention can be reduced in areas that are more mechanical in nature.
Of course, further studies are required with exclusive focus on this that aim to identify key reasons for the delays thar occur in various ports for different activities and to suggest a process reengineering for the same. This should take care of each and every activity, or in other words micro-processes to understand the responsibilities, work burden and accountability at every node involved in processing export consignments. A system defining responsibility and accountability, including decision-making for each node involved, needs to be incorporated in the ecosystem through introducing proper standard operating procedure (SOPs) across all activities. This may help to create a seamless and transparent system, with the help of technology and digitisation wherever required, to help global export competitiveness of the country.
Concluding Remarks
This article has focused on logistics performance within the ports. with special attention given to time loss during various activities. The article asserts that efficiency in ports does not vary drastically for different activities when individual ports are considered. No single activity can be held responsible for overall loss in time within a specific port. Therefore, if ports need to be made efficient, it requires a change in efficiency level of all activities within the port. The study showcased that significant difference exists in the performance or efficiency across ports, as seen through indexation exercise. There is ample scope for several ports to address their efficiency in handling consignments and to catch up with the ports that are performing at a higher level. It is worthy to mention here that the ports of East and South India are significantly lagging in terms of efficiency compared to their counterparts in West India and North India. The sooner these lagging ports are able to address their efficiency laps in terms of logistics, the better it is for India to become more competitive in global market. While exporters should see a cost-benefit considering their expense in terms of logistics cost, the respective port authorities and policymakers should develop a mechanism to create a seamless system, with the help of technology and digitisation wherever required, to help global export competitiveness of the country. The scope for process reengineering should be explored to remove non-value adding, yet time consuming, nodes and identification of inefficient nodes in the process through understanding the micro-processes involved in the ecosystem. A transparent system defining responsibility and accountability including decision-making for each node involved needs to be incorporated in the ecosystem through introducing proper SOPs across all activities.
Footnotes
Declaration of Conflicting Interests
The authors declared no potential conflicts of interest with respect to the research, authorship and/or publication of this article.
Funding
The authors received no financial support for the research, authorship and/or publication of this article.