
Abstract
This article uses granular information on trade flows between India and its trading-partners to estimate the impact of price changes on the import basket in general. We first investigate whether a change in world prices at the commodity level triggers a reorganisation of trading partners. Second, we examine the degree of transmission of world prices to Indian import prices. Lastly, we look at whether India imports less from countries that charge a higher markup on a product. Our results indicate that a change in world prices does not significantly change the set of importing countries. Using the country–product level price changes, we find a higher degree of transmission as compared to the world prices. This provides an important policy implication. In order to determine how the transmission of world prices to import prices works, we need to pay attention to the product price changes in the partner countries rather than focusing on the world prices. Lastly, we find that India imports less of a particular product on average from a country that charges a higher markup for that product relative to the average export prices charged by that country.
Introduction
Over the years, growing market integration, trade competitiveness and the development of transport infrastructure have increased the number of trading partners. For instance, India alone imports approximately 4,585 products from 229 trading partners and has 21 partners on average for a product. 1 There has also been a significant increase in the number of producers of a certain commodity. This increase is a result of globalisation and technology transfer between countries (Behar & Venables, 2011; Vemuri & Siddiqi, 2009). Although a large number of countries now produce and export a particular product, the importing country may have a strong preference for a particular quality that is manufactured by a particular producer country (Tung, 2008). Controlling for such preference factors, it is likely that an importing country may move to a different producer/exporter located in a different country if this country offers a competitive price and, ceteris paribus, the quality of the product (Forbes, 2019). This move to a different country, however, is not straightforward because of the established trade and diplomatic relationship between the country and the associated increase in the cost of moving to a different partner (Amelung, 1991). Nonetheless, whenever there is a change in global prices, an importing country may benefit by moving to a partner that offers a competitive price. This reorganisation of the set of importing countries within a product has important implications for the transmission of the international prices to the import prices.
In this article, we first investigate whether a change in world prices at the commodity level triggers a reorganisation of trading partners. As the world price changes for a certain product, an importing partner may see an opportunity to move to a different set of trading partners (Forbes, 2019). This shift in trading partners may, however, depend on several factors that may include the importing country’s preference for partners, type of product, proximity with trading partners, trade agreements, tariffs, quality of the product and volume of imports, among others. For instance, if a product is heterogeneous in nature, then it is unlikely that any movement in world prices would change the set of trading partners, as the importing country may have a strong preference for the quality of the product imported from a particular country. On the other hand, if the product is homogeneous in nature, that is, the product does not differ much across the sellers, then a change in world prices may change the set of importing partners. 2 This is because for a homogeneous product, it is easier to find an importing partner that supplies the same product at a competitive price (Erkel‐Rousse and Mirza, 2002; Yeats, 1990). Second, we examine the degree of transmission of world prices to Indian import prices. To this end, we first look at how product-level world prices get transmitted to Indian import prices. However, looking at world prices may not reveal the entire transmission process, as India does not import from all the exporting countries. So, we extend the analysis by looking at country–product-level prices and checking if the transmission occurs with a higher degree when we consider only the partners that export the product to India. Lastly, we look at whether India imports less from countries that charge a higher markup on a product vis-a-vis their exports to other countries. We start with the hypothesis that gains from trade may induce an importer country to import less of a product from a country that charges a higher price.
Our results indicate that a change in world prices does not significantly change the set of importing countries. Neither are the results significant for homogeneous products. This insinuates the fact that trade relations, overhead costs and geographic proximity may play a bigger role in choosing the set of importing countries for a product. Thus, from a policy perspective, removing the impediments and a greater access to competitive exporters may result in gains from trade. This is because, as a consequence of an increase in the world price of a particular product, the importing country may move to a new partner supplying the same commodity but offering a competitive price. Second, we find that price transmission from world prices to Indian prices occurs relatively more for homogeneous products. Specifically, we find that a 1 percentage point (p.p) change in world prices on average increase India’s import prices by 0.1 p.p. We find a higher degree of transmission for homogeneous products, as these products may have rigid preferences in the domestic market and could also include essential commodities. Using the country–product level price changes, we find a higher degree of transmission (0.33 p.p change for a 1 p.p change in country-level prices) as compared to the world prices when all the countries are taken into account. This is primarily due to the fact that product price changes in the partner countries matter, not the average world price of that product. Here also we find that the degree of transmission is higher for homogeneous products as compared to heterogeneous products. This provides an important policy angle. In order to determine how the transmission of world prices to import prices work, we need to pay attention to the dynamics of price changes at product partner level rather than focusing on world prices. Focusing on world prices may underestimate the degree of transmission. Lastly, we find that the domestic country (India) imports less of a particular product on average from a country that charges a higher markup for the product relative to its average export price to other countries. Thus, price markup is an important determinant of the partner country’s weight in the import basket specific to the product.
Related Literature
Our article is related to two main strands of literature. First, our article contributes to the voluminous literature on price transmission and global integration. Price transmission mechanism is crucial in understanding the stability of international prices (Ghoshray, 2011). Several studies have examined the price transmission mechanism from world to domestic prices using econometric price transmission analysis (PTA) and simulations based on computable general equilibrium (CGE) models to quantify commodity-specific prices (Carter, 2019), particularly for petroleum products and agricultural commodities (Acharya et al., 2012; Ahmadi‐Esfahani, 2006; Alam, et al., 2015; Bakucs et al., 2013; Bordoloi & John, 2015; Dawson & Dey, 2002; Guivarch et al., 2009; Guo & Tanaka, 2019; Jha et al., 2008; Raj et al., 2008; Siddig & Grethe, 2014; Storm, 1994). The fundamental theoretical basis for price transmission dates back to the law of one price (LOP) and market integration (Fackler & Goodwin, 2001). Evidence suggests that changes in import prices are a predominant channel through which movements in world prices affect domestic prices. 3 In a free-market economy, the elasticity of price transmission (from world to domestic prices) is expected to be 1, while a zero elasticity indicates no transmission. Evidence relating to the degree to which world price signals are transmitted to domestic markets based on econometric PTA has been mixed (Hazell et al., 1990; Mundlak & Larson, 1992). Hazell et al. (1990), using data on 22 developing countries, find nearly full price transmission of world prices to export prices. However, the transmission to producer prices is much smaller because of trade restrictions and domestic distortions. Quiróz and Soto (1993) find that during the period 1966–1991, transmission from international prices to domestic prices remained low or non-existent for agricultural commodities. Interestingly, Morisset (1998) finds that an upward movement in global prices was transmitted to domestic prices in major industrial countries. This effect is not symmetrical in the case of downward revisions of global prices. Further, Sahoo et al. (2020) notes that the pass-through of global price shocks tends to be higher in case of emerging economies (EMEs) as compared to advance economies. In the case of EMEs, the degree of pass-through of global prices to domestic prices is significant in the long run but relatively weak in the short run. Overall, the literature has mostly focused on testing the ‘LOP’, with a focus on commodity-specific prices (Rajmal & Mishra, 2009). Our study contributes to this strand of literature by using detailed information on bilateral trade between India, a large emerging market economy, and all its trading partners. Unlike the earlier studies, we use the entire universe of products imported by India from all its trading partners to determine the import price of India.
The limited pass-through of global prices to domestic prices relates to factors such as demand and supply conditions, dependence on imports, depreciation of exchange rate (Mendali & Das, 2017; Ranadive & Burange, 2015) and policies focusing on stabilising domestic commodities. Chand (2008, 2009) also finds that factors such as a significant increase in domestic production and effective government intervention are some of the reasons why domestic prices are lower than world prices, particularly for rice and wheat. There is a large literature on the transmission of import prices to domestic inflation, employment, wages and productivity, among others (Autor et al., 2013; Forbes, 2019; Wang et al., 2018). Using the World Input–Output Database (WIOD), Auer et al. (2019) find the important role of intermediate input–output in determining inflation synchronisation across countries. Similarly, Forbes (2019) and Borio and Filardo (2007) also highlight the integration of countries in global supply chains (GVCs), playing significant role in dynamics of domestic inflation. Another strand of literature, using CGE modelling, evaluates not only direct import price transmission to domestic prices but also indirect effects via inputs to producer prices (Chadha et al., 1997; Ganesh-Kumar & Panda, 2009; Siddig & Grethe, 2014). The CGE model captures multiple price transmission channels as well as second-order effects in the value chain that determine final consumer price. Literature on price transmission using CGE modelling provides evidence that sectors with high-trade elasticity result in greater transmission of the world market price to the domestic market, whereas greater factor mobility and higher production elasticity result in lower price transmission (Siddig & Grethe, 2014). Most of the literature on price transmission in the Indian context has mostly assessed the impact of world prices and their transmission to domestic inflation (Bordoloi & John, 2015; Mendali & Das, 2017; Raj et al., 2008). However, the focus of our article is to estimate the first leg of price transmission, from world prices to domestic import prices, over all the commodities imported in India. To this end, our article provides evidence of price transmission from world price to domestic import price taking into account all commodities imported by India, which is not restricted to any particular set of commodities. 4
Second, our article contributes to the large literature on price variations and their impact on the direction of trade. Orcutt (1950) assessed the impact of changes in prices and exchange rates on both exports and imports. Extending the work, Leamer and Stern (2017) noted that the adjustments in trade flows are faster for large price or exchange rate variations compared to small changes. Bahmani-Oskooee (1986), using Almon lag model, examined the change in the magnitude of trade flows for a change in the price level (including import prices) and exchange rate. This article finds that import and export functions respond both to exchange rate and relative price changes, but the reaction is quicker in the case of exchange rates. Warner and Kreinin (1983) find that real income and relative import prices affect a country’s import volume. Tegene (1991) used quarterly Ethiopian trade flow data during 1973–1985 to assess the responsiveness of trade flows to changes in relative prices and exchange rate. Using a vector auto-regressive model, the article finds that the responses of trade flow, both export and import, are bigger for price changes compared to exchange rate variation. Also, it takes a shorter period for exchange rate changes to fully get realised compared to price changes. Extending the literature, Tung (2008) examined the dynamics of changes in partners’ costs and their impact on the direction of trade. The article finds that for some countries, there may be some initial threshold inertia with their current import suppliers, even if the cost of the product is not the cheapest. The author notes that stability in quality or delivery punctuality are some crucial reasons behind the country’s reluctance to switch to new partners simply because of lower costs. Our article contributes to this literature by examining whether a world price change induces a change in the trading partners using distance and GDP as indicators. We also test whether such price changes affect the direction of trade flow. Since over the years there has been a significant increase in product availability and competitiveness, it is important to examine the question of price transmission and partner choices. These questions are particularly important for a large, open economy like India, which has multiple trading partners. To the best of our knowledge, this is the first article to examine these questions for India using a large data set containing the universe of products imported from all trading partners.
Despite the rich theoretical literature on price competitiveness, there is limited empirical evidence that directly measures the extent to which variation in the prices of imported goods affects the trading profile of a country. Our study will add to the limited literature on understanding causal relation between imports prices of commodities and changes in the direction of imports.
We present the data and summary statistics in the second section. The third examines whether importing partners change with a change in world prices. The fourth presents the results on price transmission. The fifth shows whether product-level markups affect trade volume. Section 6 concludes.
Data and Summary Statistics
We use three main data sources in this article. We use information on trade value and volume to calculate product prices at the product–country level, the GDP and distance of the importing partners from India, and a classification of goods into homogeneous and non-homogeneous goods for our analysis. We describe each of these data sets below.
Product Prices
The core of our data for the empirical analysis comes from the World Integrated Trade Solutions Comtrade database (WITS Comtrade). This data set provides detailed custom-level trade data for countries by product at harmonised system (HS)-6 classification level. The data provide product-wise details of trade value in United States dollars (USD), volume of goods traded, quantity units, partner country, product description and income group of trade partners, among others, at an annual frequency. The level of granularity in this data set allows us to construct unit values that are not affected by the aggregation across countries and products. We use import data from India from 2005 until 2019. The year 2005 is chosen as this is the year when India started enforcing the TRIPS agreement of the WTO and was fully integrated into the global trade body (e.g., quotas and multifibre agreement (MFA) were abolished at WTO in the year 2004).
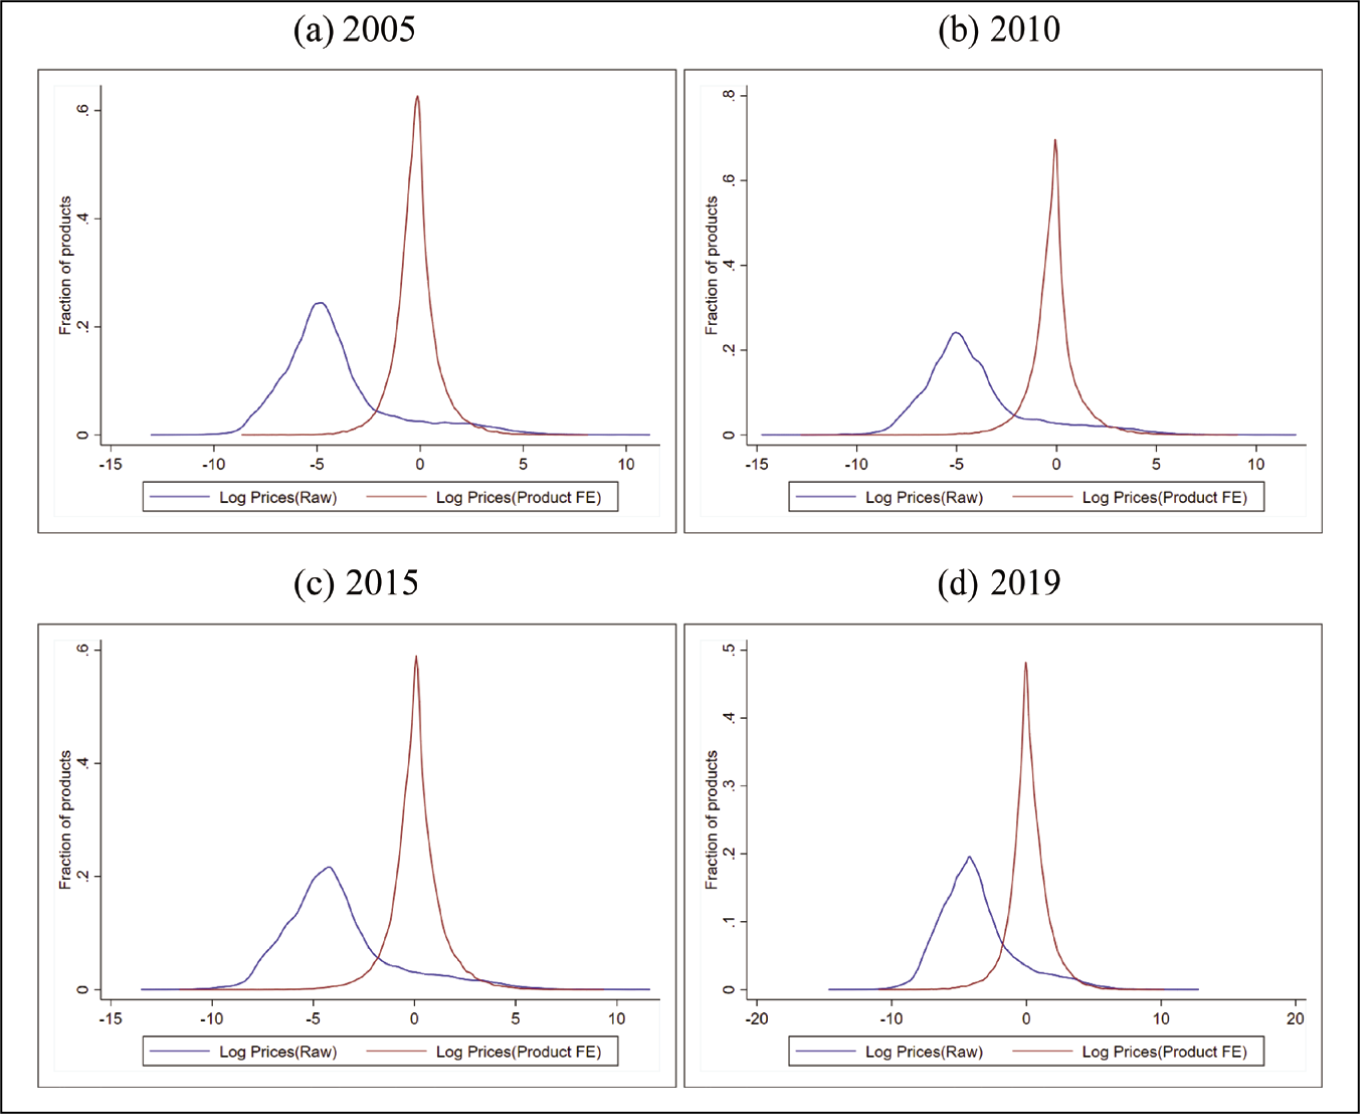
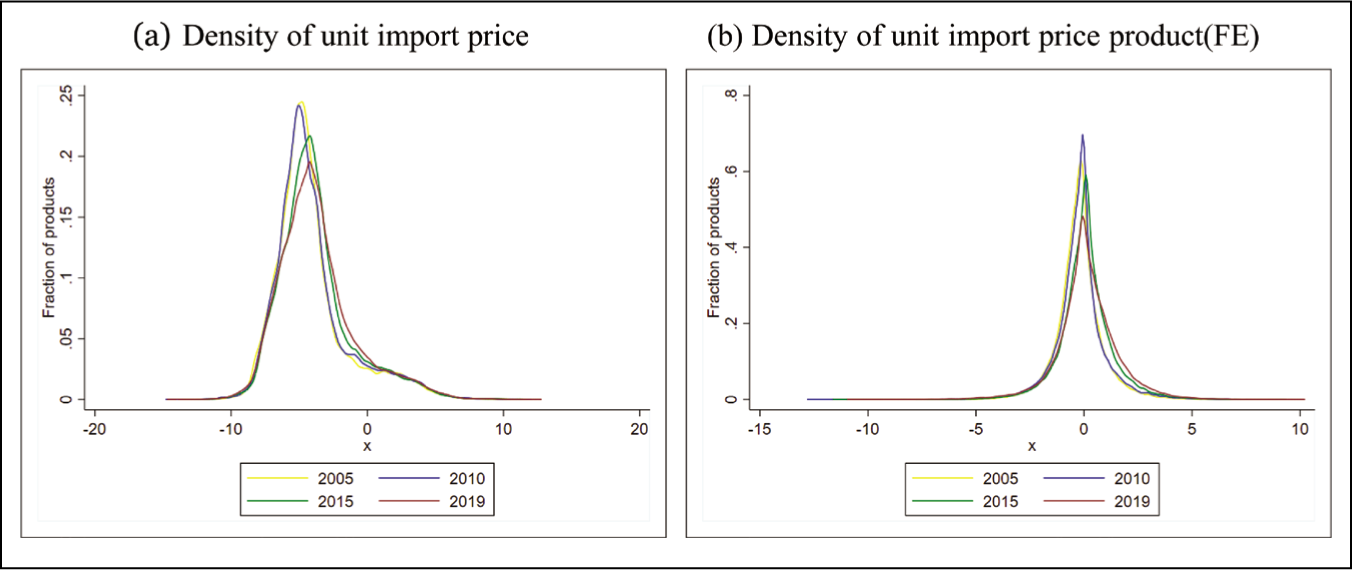
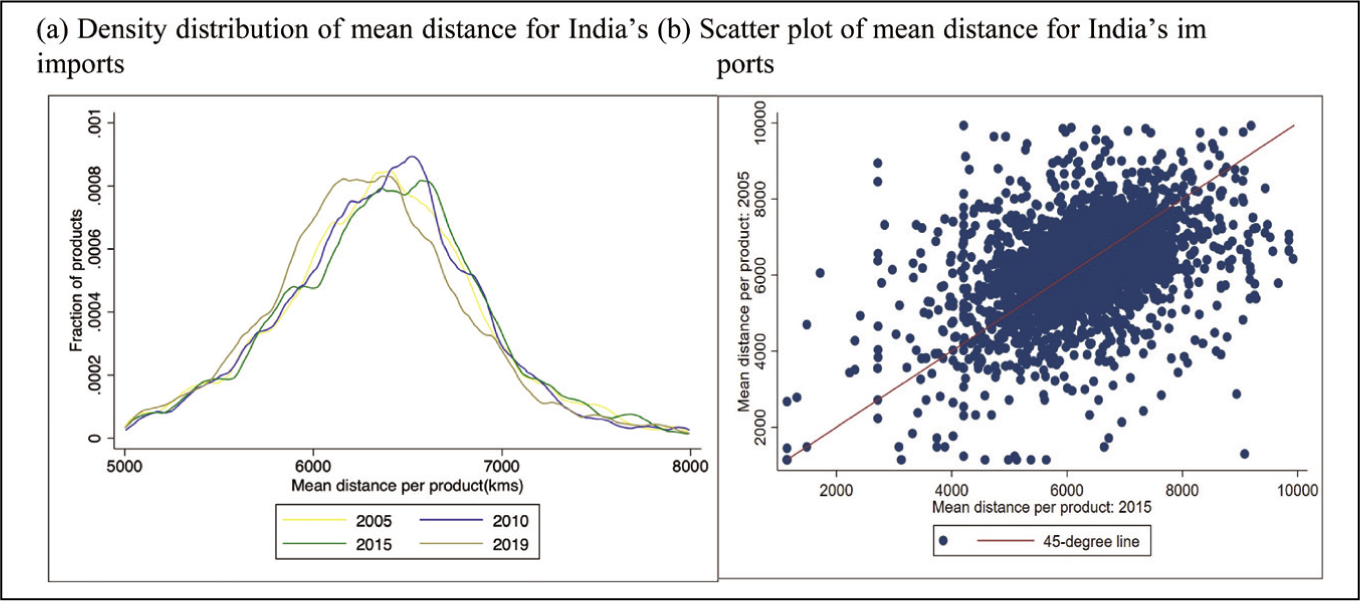
We create two panel datasets to determine the price transmission at the product level and country–product level. 5 The first dataset is created by mapping India’s import data at HS-6 product level to distance in km, GDP per capita in USD of partner countries (we describe this data set in the next subsection). Further, we map this dataset to product-level aggregate world price calculated using the aggregate world mirror export price of all the countries to the world. This allows us to detangle any product-level price transmission in India, even for the products for which international prices are unavailable. This sample comprises 1,430,802 observations over the time period 2005–2019, comprising 5,117 products over 229 countries. In the second panel, we map India’s import dataset at partner–product level to the average mirror export price charged by the partner country to the rest of the world. This allows us to understand the price transmission in India at the country–product level and answer our questions on the trading relationship at the country–product level. This sample comprises 7,569,332 observations over the time period 2005–2019, comprising 5,222 products over 243 countries. Figure 1 illustrates the kernel density distribution of log price (unit values) of the India’s imported products in the years 2005, 2010, 2015 and 2019. This gives us a snapshot of the price distribution of India’s imports at product HS-6 level over the years. As the prices are measured in terms of log and USD thousands, a large fraction of products have log prices less than zero. The mode of raw price distribution is around –5 for almost 20% of the products. However, controlling for product-fixed effects that factor out any time-invarying product-level factors like quality, we find that the price distribution is around zero, but the fraction of products at highest frequency is declining over the years. This means that the prices have become more distributed over the years, which may be due to the shift to low-cost importer or availability of many suppliers for a given product over the years. Figure 2 also captures the log of import price distribution over the years. We can clearly see positive skewness and decrease in the fraction of products at the highest frequency over the years.
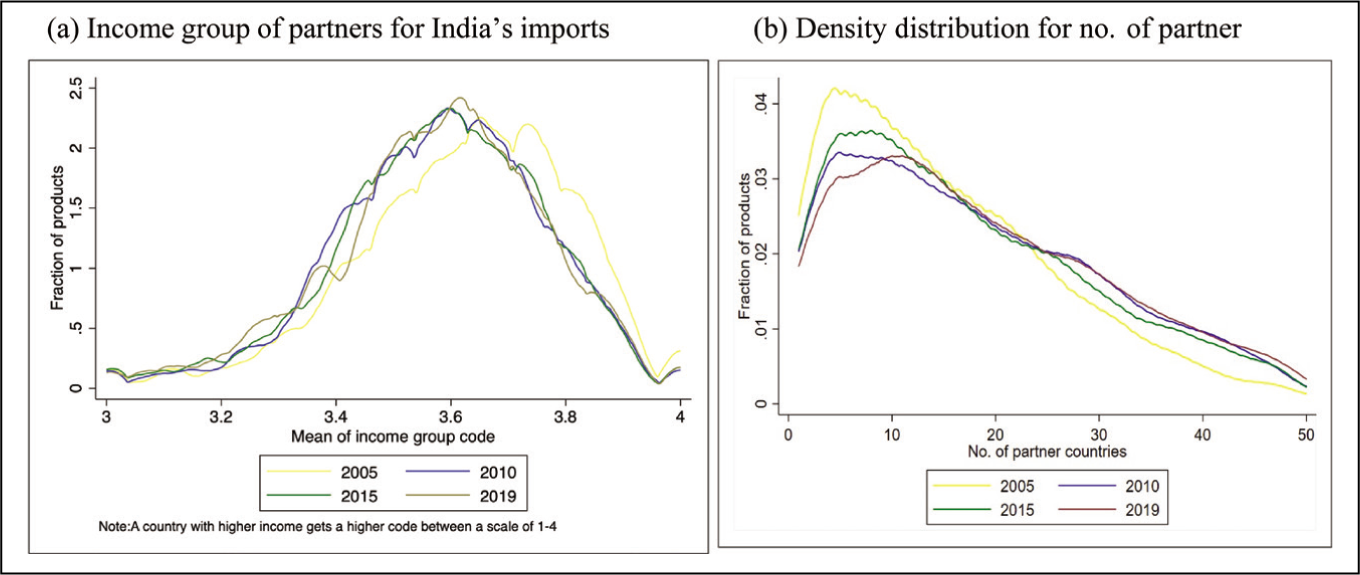
The process of globalisation has brought the world closer and reduced the impediments to trade among buyers and suppliers of products. This has resulted in the greater competition in the product space among the countries. Figure 4 shows the distribution of the number of partners over the entire product space at HS-6 commodity classification for India over the years 2005, 2010, 2015 and 2019. The figure shows there has been an increase in the number of import partners for India over the years. It means Indian buyers now have a greater choice for a given product. For our analysis, this also means that India has trading relationship with a large number of countries, and if any one country charges a higher price for a given product, then India can source its imports from other partners. Figure 4(b) plots the kernel density distribution of the number of partner countries. We find that in 2005, a large fraction of imported products were sourced from fewer countries. However, over the years, this concentration has decreased. For example, in the year 2015, around 0.035 fraction of products had 10 partner countries, but this figure decreased in the year 2019 to approximately 0.03 fraction of products. It also means that for each product, on average, the number of partner countries has increased over the years. The figure also shows that the fraction of products sourced from only one country has decreased over the years. Meaning that critical, unique products that were earlier imported from a set of selected countries are now being imported from other countries. This further corroborates increasing diversification/substitution among countries for a given product.
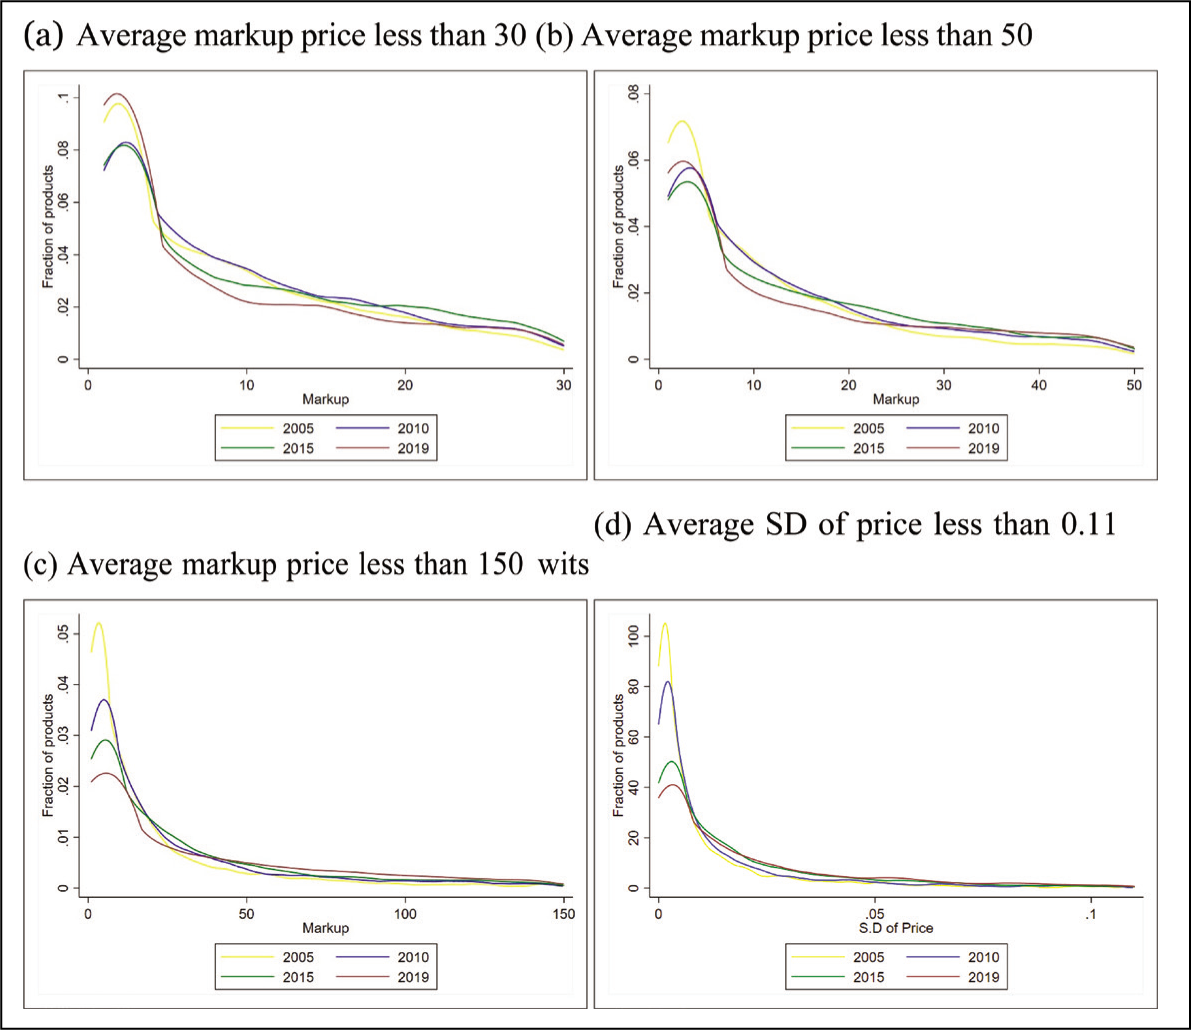
The next obvious question is to see how this competition among supplier countries impacts the markup in price within a product over the years. We calculate the average markup across countries within a product year by taking the ratio of maximum to minimum price. We make kernel density plots of average markup less than 30, 50 and 150 for the years 2005, 2010, 2015 and 2019. Figures 3(a)–(c) shows that the markups are getting distributed across products over the years as a lesser fraction of products have markup concentrated around the mode of distribution.
Figure 3(d) plots the kernel density of standard deviation within a product year of less than 0.11 for the years 2005, 2010, 2015 and 2019. We use the standard deviation of price as a proxy for the variety of commodities within a product group that are imported from different countries. For example, a variety of a certain commodity may be imported from more than one country at different prices. High-standard deviation within a product year may be attributed to the unique characteristics of the product. We find that the standard deviation has become more uniform over the product space during the period 2005–2019. This indicates that even though the SD may not have decreased, standard deviation has become more dispersed over product space in 2019 as comparison to 2005.
GDP and Distance
We obtain data on GDP per capita for countries from the World Bank’s World Development Indicators (WDI). We map the GDP of each partner country to India’s import database. We use the bilateral distance data of India’s import partners from the publicly available CEPII gravity database (Head et al., 2010) and map it to India’s trade database. 6 This mapping allows us to analyse the possible shift in the direction of trade with the change in price at the product level. Now, to understand the diversification of countries in India’s import profile, we plot kernel density for the mean income group of import partners over the product year. We map countries on a scale of 1–4 with increasing income for this exercise. The classification of income categories of partner countries is available in the WITS Comtrade database. Figure 4(a) illustrates that India has shifted its imports to lower-income countries in 2015 relative to 2005. Meaning some low-income countries are catching up with richer countries in producing products of equivalent quality at a competitive price. Figure 5 plots the kernel density plots for the average distance of partner countries over the product space over the years. We find that a large fraction of products are sourced from countries within a geographical distance of 4,000–8,000 km over the years 2005–2015, and this has not changed during this period. In summary, there are two important messages that come out of this data set. First, the number of import partners has increased within the product space, and second there has been a shift away from high-income countries to lower-income countries.
Homogeneous Goods Classification
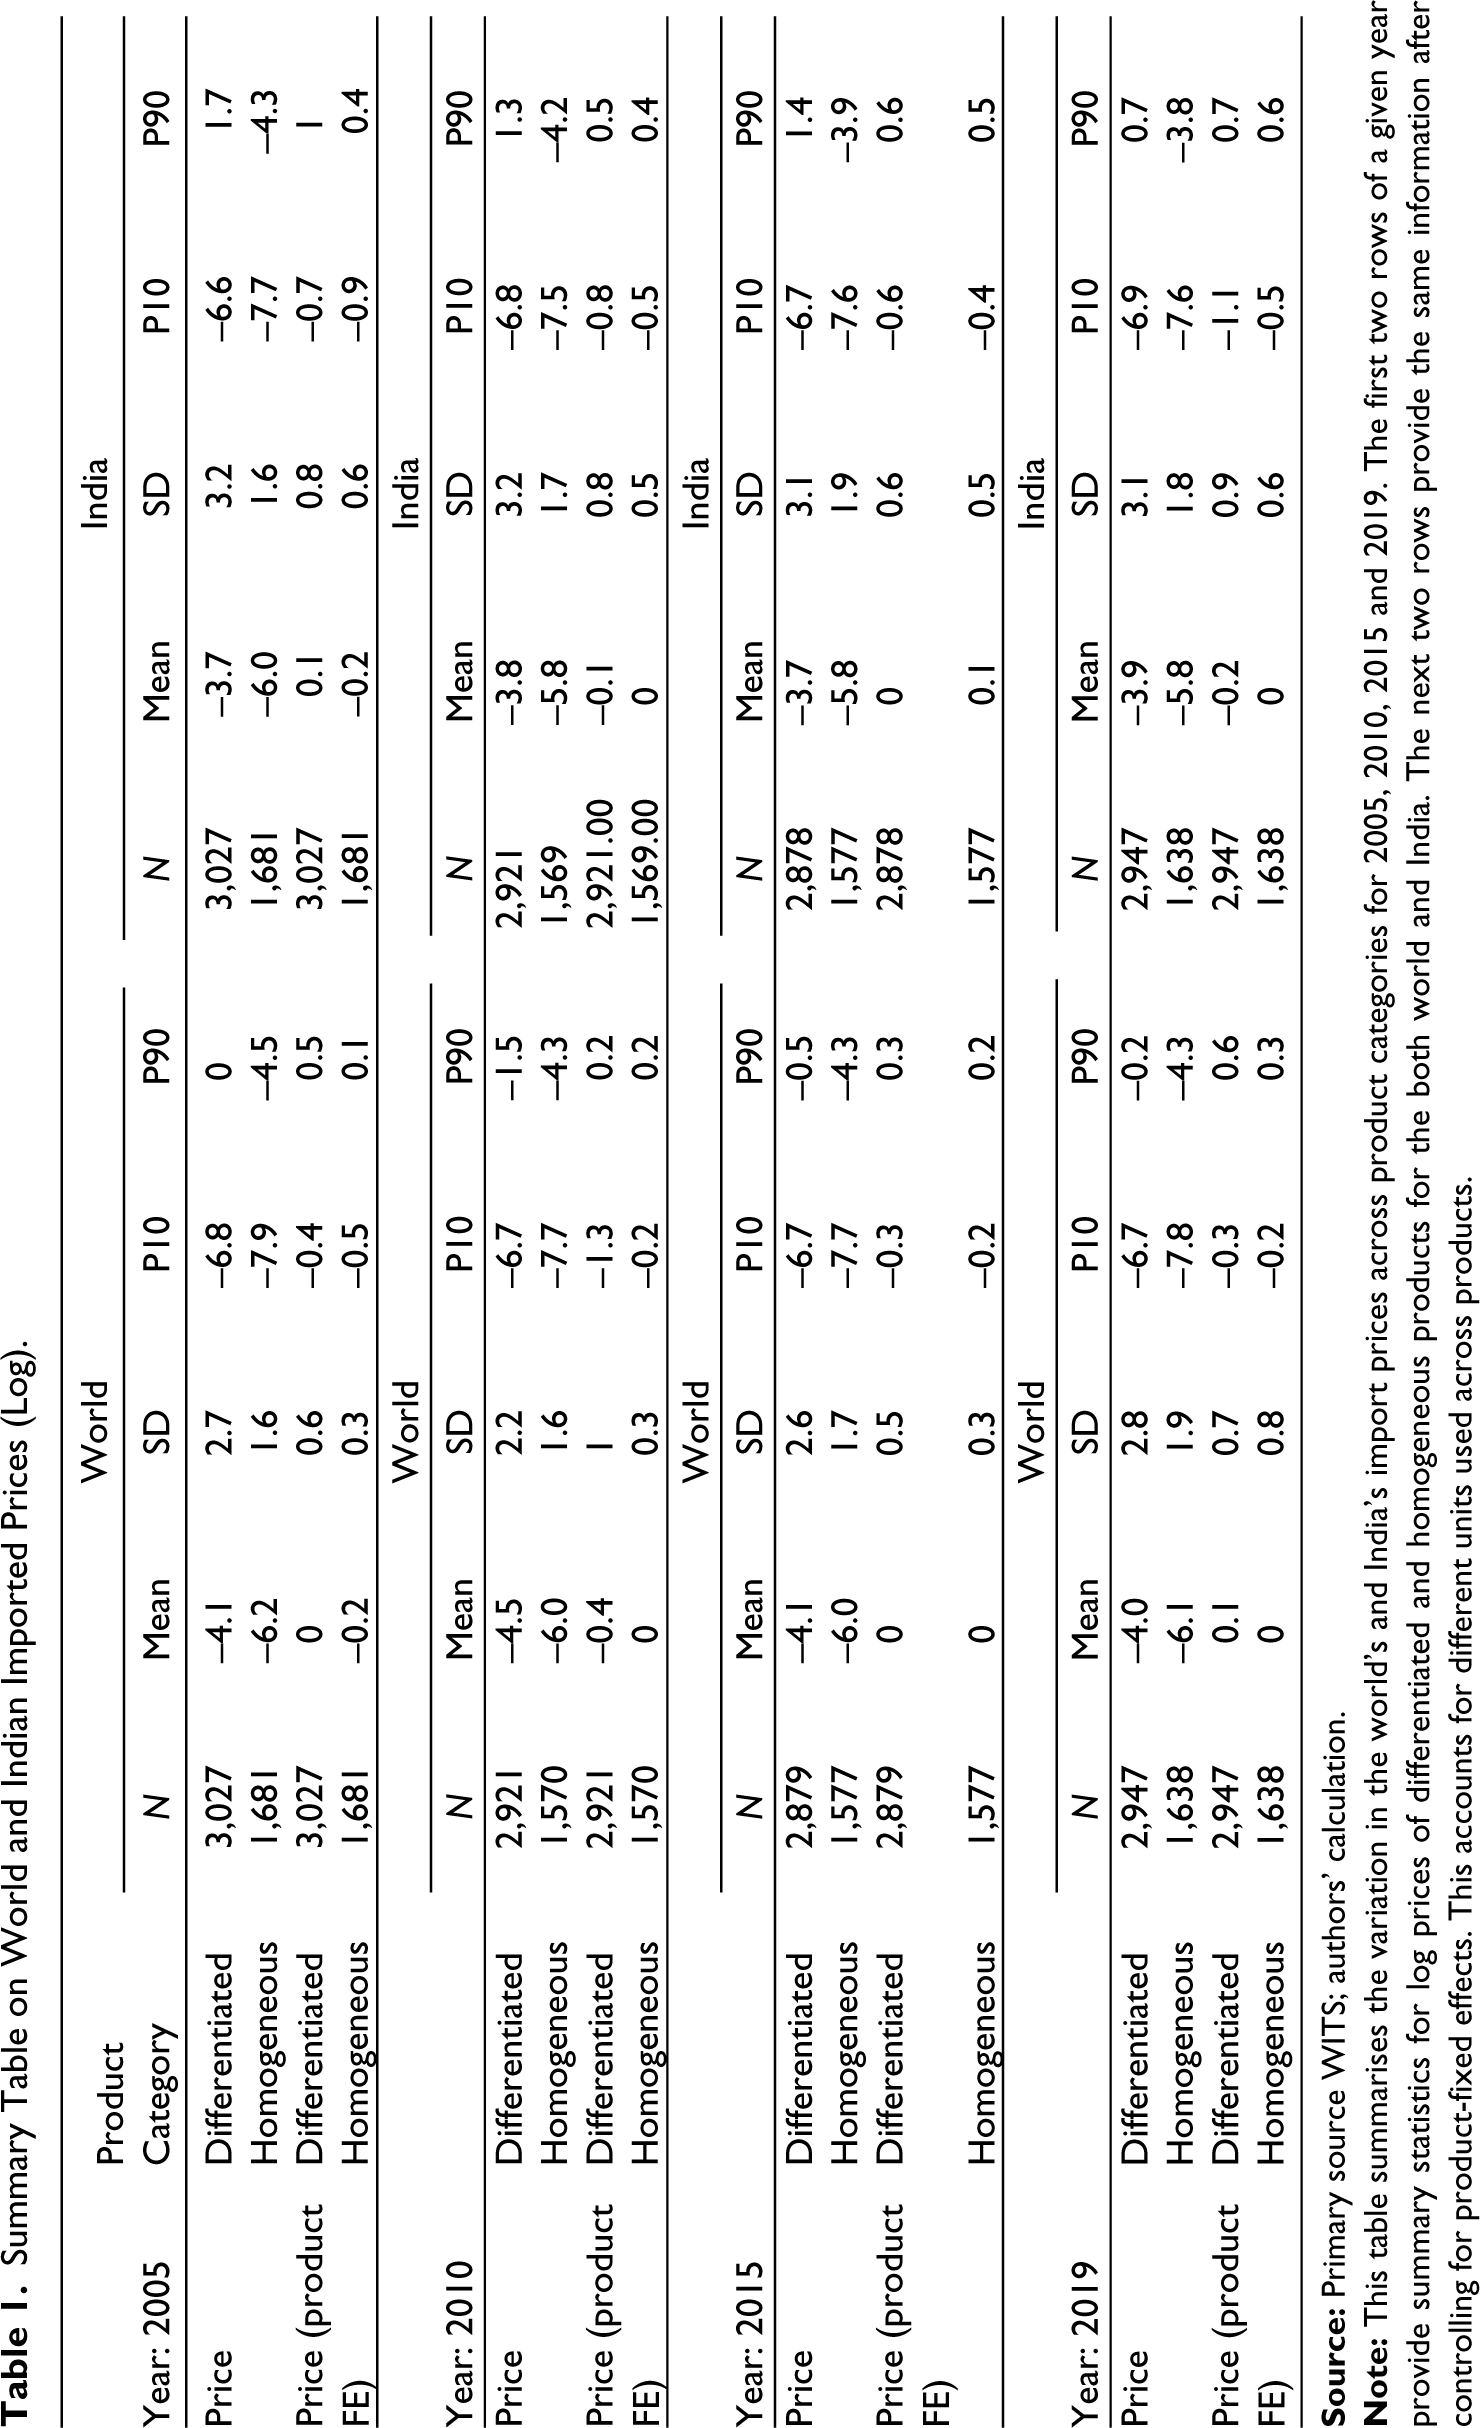
In addition to testing the relationship between the world and India’s imported prices, the article also assesses what kinds of product categories witness higher transmission. Given the variation in world prices, we expect that the extent and speed of transmission of world prices will differ across different product categories. For this analysis, we split the product category into differentiated and homogeneous goods using the Rauch (1999) classification. Seminal work by Rauch (1999) notes that the search cost for homogeneous products was much lower compared to differentiated goods. Researchers have used this classification to analyse price markups (Feenstra & Hanson, 2004), impact of networks on trade (Rauch & Trindade, 2002), effect of communication costs on trade (Fink et al., 2005; Tang, 2006), price stickiness (Gopinath & Rigobon, 2008) and variation of exchange rate transmission (Gopinath et al., 2010) across product categories. Our study contributes to the emerging literature on differentiated products. We examine the degree of price transmission between world and partner prices and India’s import price based on Rauch classification. The Rauch classification divides products at five-digit standard international trade classification (SITC) level into homogeneous, reference and differentiated products. These products are classified based on whether the product is (a) traded on an organised exchange (homogeneous); (b) not traded on an exchange but has some quoted ‘reference price’, such as in trade/industrial publications (reference) or (c) has no quoted price (differentiated). The classification then aggregates this information into four-digit SITC codes. For our analysis, we use concordance tables between SITC (Revision 2) and HS codes to transform the information at HS six-digit level. 7 In other words, all goods at six-digit HS level, which satisfied the above criteria, are included in the sample. Further, there are two versions of this classification—conservative and liberal scheme. Conservative classification scheme aimed at minimising the number of homogeneous/reference priced goods under ambiguities, and the other is ‘liberal’ classification where the number of such products is maximised. For our analysis, we have used the conservative classification scheme. The level of disaggregation of our data provided an advantage in the construction of imported prices at the both product level and identifying the commodities into homogeneous and differentiated goods. Table 1 presents the information on the world’s and India’s imported prices across years based on the classification, with prices in log terms. The table illustrates significant price disparity across products and years both for India and the world. We find that the average log price for differentiated goods is much higher compared to homogeneous goods, even after controlling for product-fixed effects. Also, the difference in the mean prices that the world and India pay for differentiated products is much higher, when compared to the prices they pay for homogeneous products for a given year. Further, in the case of differentiated products, India pays more compared to what the world pays on average. Interestingly, for a given year, the standard deviation for India’s imported price for differentiated commodities is higher in contrast to the rest of the world. For instance, in 2010, India’s standard deviation for differentiated product price was 3.2, whereas for world prices, it was 2.2. This highlights the extent of product heterogeneity in the differentiated product space. However, the standard deviation of log prices for homogeneous goods is almost similar for world and Indian prices.
Summary Table on World and Indian Imported Prices (Log).
Evidence from the empirical literature suggests that prices of traded commodities can vary depending on the characteristics of the importer and exporter such as income, factor abundance, distance, etc. (Baldwin & Harrigan, 2011; Flam & Helpman, 1987; Helble & Okubo, 2008). In particular, the literature assesses the relevance of income difference in shaping the trade flow. We compare the imported prices that India pays for differentiated and homogeneous goods across income groups classified by the World Bank. We find that prices on average are higher for commodities that are imported from higher-income countries, both for differentiated and homogeneous products. Also, a large fraction of India’s products are imported from high-income economies, but there is some shift away from these countries to other income groups over time. For instance, India imported 8.1% of differentiated products from low- and middle-income countries in 2019, which was 5.1% in 2005.
Do Importing Partners Change?
India imports approximately 4,585 commodities, and this number has changed over the years. For each product the country imports, there is a set of countries that supplies the imported product. The set of importing partners may be chosen on the basis of a number of factors, such as (a) the comparative advantage of the country in producing the commodity, (b) the quality and variety of the product desired by the domestic country, (c) trade and diplomatic relations with the country and/or (d) the price charged by the country for the product (Anderson et al., 2019; Besedeš & Prusa, 2006; Feenstra & Hanson, 2004; Hallak, 2006; Helpman, et al., 2008). Given the trade linkages and the contribution of a country to the global value chain, the global market is becoming increasingly competitive and fragmented. A country may lose its position in the global market unless it offers a competitive price for its products. On the other hand, the development of infrastructure, transport facilities and improvements in connectivity between the countries mean that an importing country may also move to a new partner country for procuring a certain product if it does not receive a competitive price.
Let us, for illustration, assume that country A is importing one product X from countries B and C. The entities A, B and C can also be thought of as individual traders trading in product X and located in different countries, with A being the importer. Suppose that countries other than B and C, say D and E also produce and export the commodity X. However, countries D and E have not offered a competitive price for product X, which is why country A has chosen B and C to be its trading partners. Now suppose that due to some exogenous factors, the average world price (average of prices charged by countries B, C, D and E) changes. In such a scenario, country A may receive relatively competitive offers from countries D and E and thus change the portfolio of its importing partners. This transition would, however, depend on the trading and diplomatic relationships between country A and the existing and prospective suppliers of the particular product.
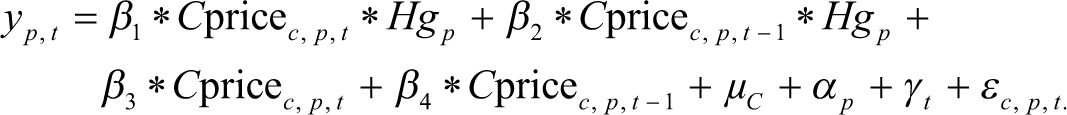
In this section, we analyse whether this transition occurs for India when there is a change in the world price for a particular product. We consider two indicators to capture this change: the average geographic distance between India and its importing partners and the average gross domestic product (GDP) for a particular product. The idea behind taking these two indicators is that both of these indicators would change within a product if there is a change in importing partners. We think that distance is a better indicator because it remains static between a pair of countries over a time period, whereas GDP may change over the years. However, after controlling for time trends in the data, GDP may also indicate a shift in partners towards high- or low-income countries. Additionally, we test whether this shift in partners occurs relatively more for homogeneous products. We hypothesise that for homogeneous products, it is relatively easier for the importing country to find a competing partner than for a product that is uniquely supplied by a handful of countries. We estimate the following equation:

The dependent variable in Equation (1) above denotes the average distance or GDP for a product p and at time t. On the right-hand side, W price denotes the world price for product p at time t, and Hg p denotes whether the product is homogeneous in nature. Since trade relations may take time to change due to prior commitments between traders, we include the contemporaneous and lagged values of world prices. αp and γt denote the product-fixed effects and year-fixed effects. There may be time-invarying characteristics of a product, such as quality, brand and domestic preference, that may affect the choice of importing partners. These unobservable characteristics are captured by the product-fixed effects. The year-fixed effects capture any major or minor event that may have occurred in a particular year that may in turn affect the choice of importing partners. For example, military tensions in a certain part of the world that specialises in a certain product in a particular year may affect the choice of importing partners. Coefficients β3 and β4 tell us if a change in world prices (contemporaneous and lagged) on average changes the portfolio of importing partners. The coefficients β1 and β2 tell us whether the change in importing partners happens relatively more for homogeneous products. For distance, the statistical significance of the coefficients is more important than the sign of the coefficients. A statistically significant coefficient would mean that a change in world prices triggers a change in importing partners. However, we are agnostic about whether the importing country enters into a trade relation with a country located geographically further away or nearer. For GDP, however, the sign of the coefficient tells us whether a price change triggers a move towards high- or low-income countries.
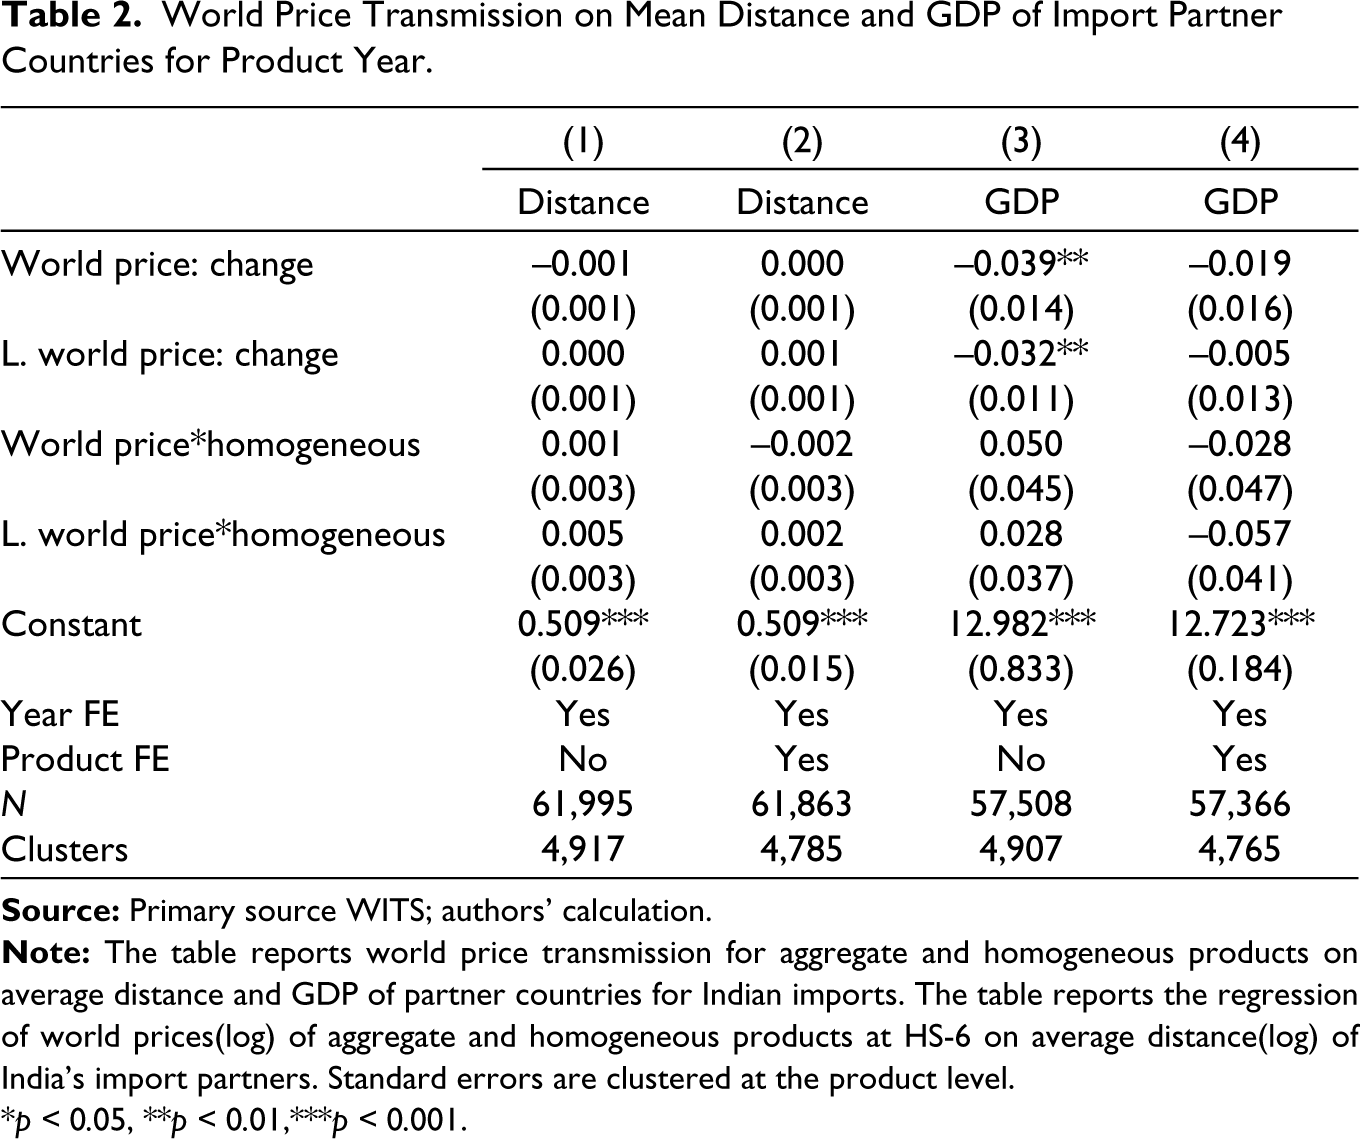
Table 2 below presents the results from estimating Equation (1). The first two rows correspond to distance as the dependent variable, while the last two columns correspond to GDP. Columns 1 and 3 do not include product-fixed effects, while columns 2 and 4 include them. The results show that none of the coefficients for the distance regressions (columns 1 and 2) are statistically significant. This means that a change in world prices for a particular product does not necessarily change the portfolio of importing partners. This result holds true even for homogeneous products. Thus, the relationship between the importing country and its partners remains sticky even after a change in world prices. For GDP, we find that an increase in world prices decreases the average GDP of the importing partners. This means that an increase in world prices makes the importing country to move to lower-income countries. However, this effect vanishes when we include product-fixed effects. This essentially means that the characteristics of the products (quality, preference, etc.) can explain the choice of partners. We do not find any significant effect for the homogeneous products.
World Price Transmission on Mean Distance and GDP of Import Partner Countries for Product Year.
*p < 0.05, **p < 0.01,***p < 0.001.
Overall, both the distance and GDP results show that a change in world prices does not necessarily change the importing partners for India. This may happen due to long-term trade relations between two countries or the overhead costs of changing partners are much larger than the price change itself. There could be stickiness in the preference for a particular product, in which case the importing country may choose to stick with the same set of partners even if the prices change. However, this aspect is somewhat, although not entirely, captured by the product-fixed effects.
Price Transmission
In the previous section, we showed that a change in price at the product level does not significantly affect the group of importing countries. This result suggests that whenever a price change occurs at the product level, given that the importing partners do not change, there will be a positive correlation with the direction of the price charged to India. Essentially, in the backdrop of the results shown in the previous section, the pass-through of the price change at the product level would likely be higher compared to the case where the importing country was free to move to other competing partners. In this section, we try to quantify the degree of this pass-through. We first focus on this pass-through by looking at the change in world prices for a particular product. This will give us an idea of the degree of the pass-through from world prices to Indian prices. In order to quantify this pass-through effect, we estimate the following equation:
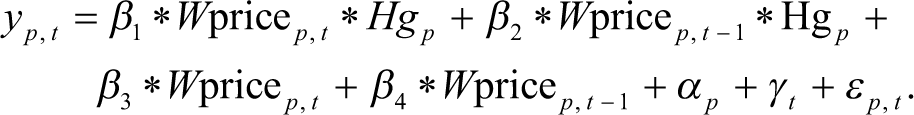
This equation is similar to Equation (1), with the dependent variable yp, t denoting the price faced by India for product p and at time t. The rest of the notations carry the same interpretation as in Equation (1). The coefficients β3 and β4 tell us the degree of transmission of world prices to Indian price (contemporaneous and lagged).
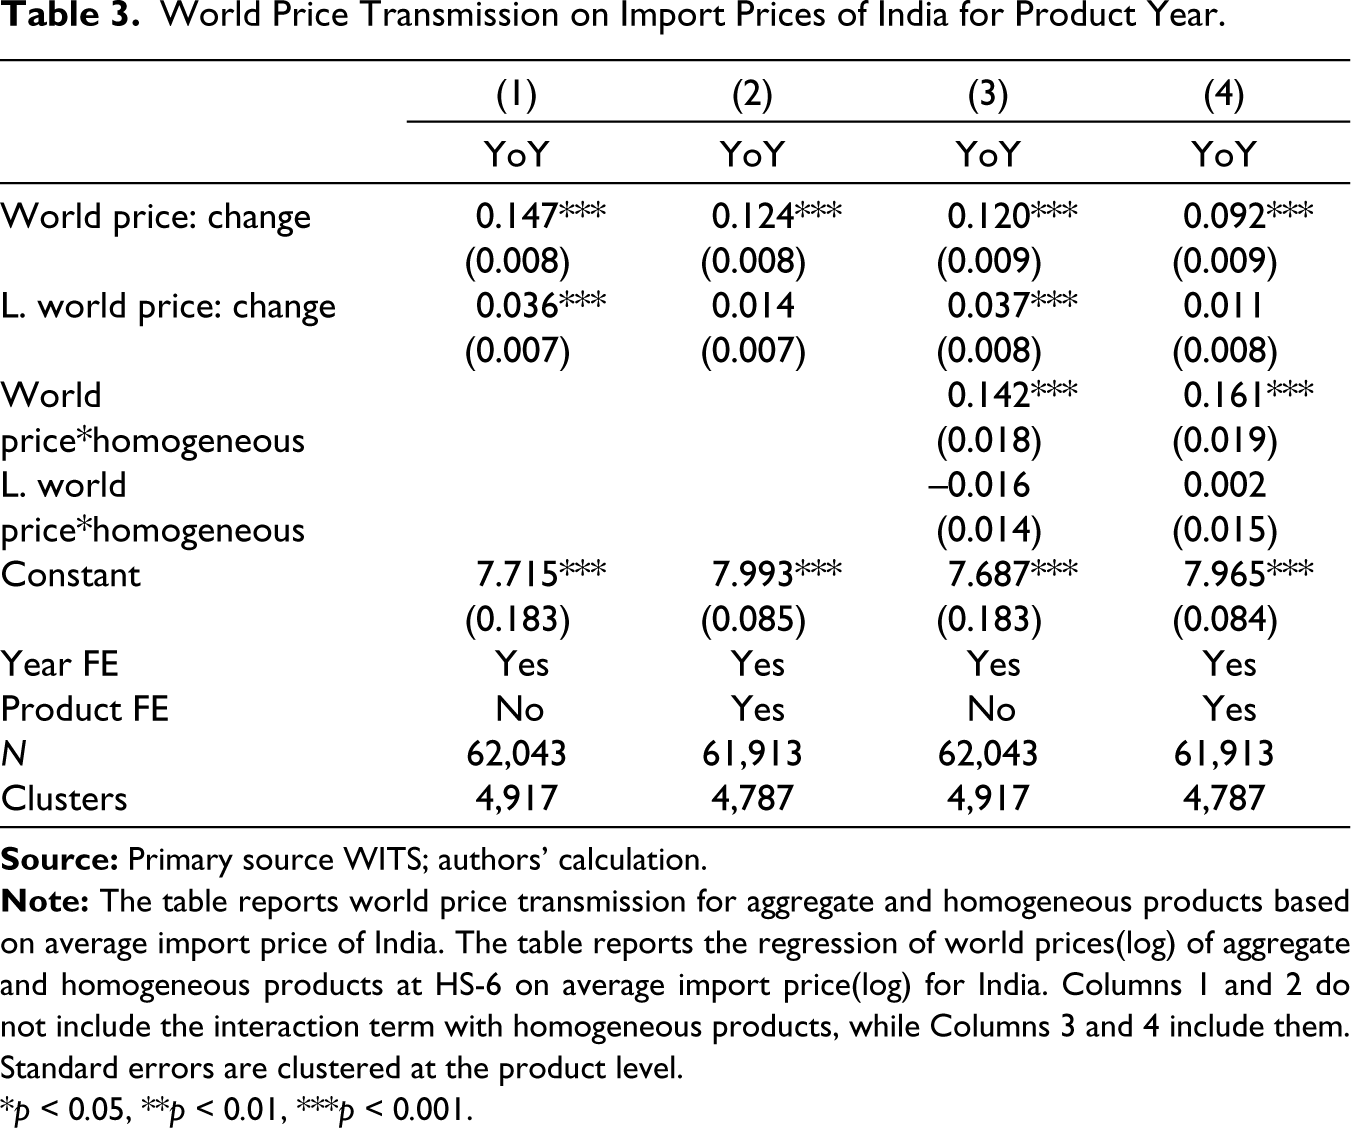
The coefficients β1 and β2 tell us if the degree of transmission is greater for the homogeneous products. We present the results from estimating Equation (2) in Table 3 below. Columns 1 and 2 in Table 3 report the results with and without product-fixed effects, respectively. We find that a contemporaneous change in world prices changes India’s prices in the same direction. Specifically, a 1 p.p changes in world prices changes India prices by 0.1 p.p. Although we find some effects from lagged changes, this effect dies down when we include product-fixed effects. Interestingly, we find that for homogeneous products, this contemporaneous effect is 0.16 p.p more relative to differentiated products.
World Price Transmission on Import Prices of India for Product Year.
*p < 0.05, **p < 0.01, ***p < 0.001.
Second, we focus on the country-level prices to quantify this pass-through. Essentially, not all countries in the world are exporting a particular product which India would be purchasing. In other words India imports, a particular product, only from a subset of all the exporting countries. Thus, for India, the pass-through may only happen when the prices charged by the importing partners change. For this analysis, we match the export prices charged by each country for a particular product to the import price reported by India from that country for that product. Essentially, we know how much the exporting country is charging for its export of a particular product and how much it charges from India. This analysis provides a granular evidence of the degree of pass-through as compared to the previous specification. For this analysis, we use the following specifications:
The dependent variable in Equation (3) is now the price change for product p, imported by India from country c and at time t. On the right-hand side, Cpricec, p, t denotes the average export price charged by country c for product p and at time t. As in the previous specifications, we include the lagged price change and interact the contemporaneous and the lagged values with the homogeneous products. The coefficients of the interaction terms will tell us if the price transmission is higher for the homogeneous products relative to the differentiated products. We include country-fixed effects (µc) in this specification that capture any time-invarying country-level factors that affect the prices charged by countries for a product. These factors may include quality, the technology used in production processes, and the country’s position in global value chains. The rest of the terms carry the same interpretations as in the previous specification. Since product prices in a country may fluctuate due to the exchange rate movements, we include a continuous time trend for that country. This time trend takes care of the bilateral exchange rate movement over the time period that may affect product prices.
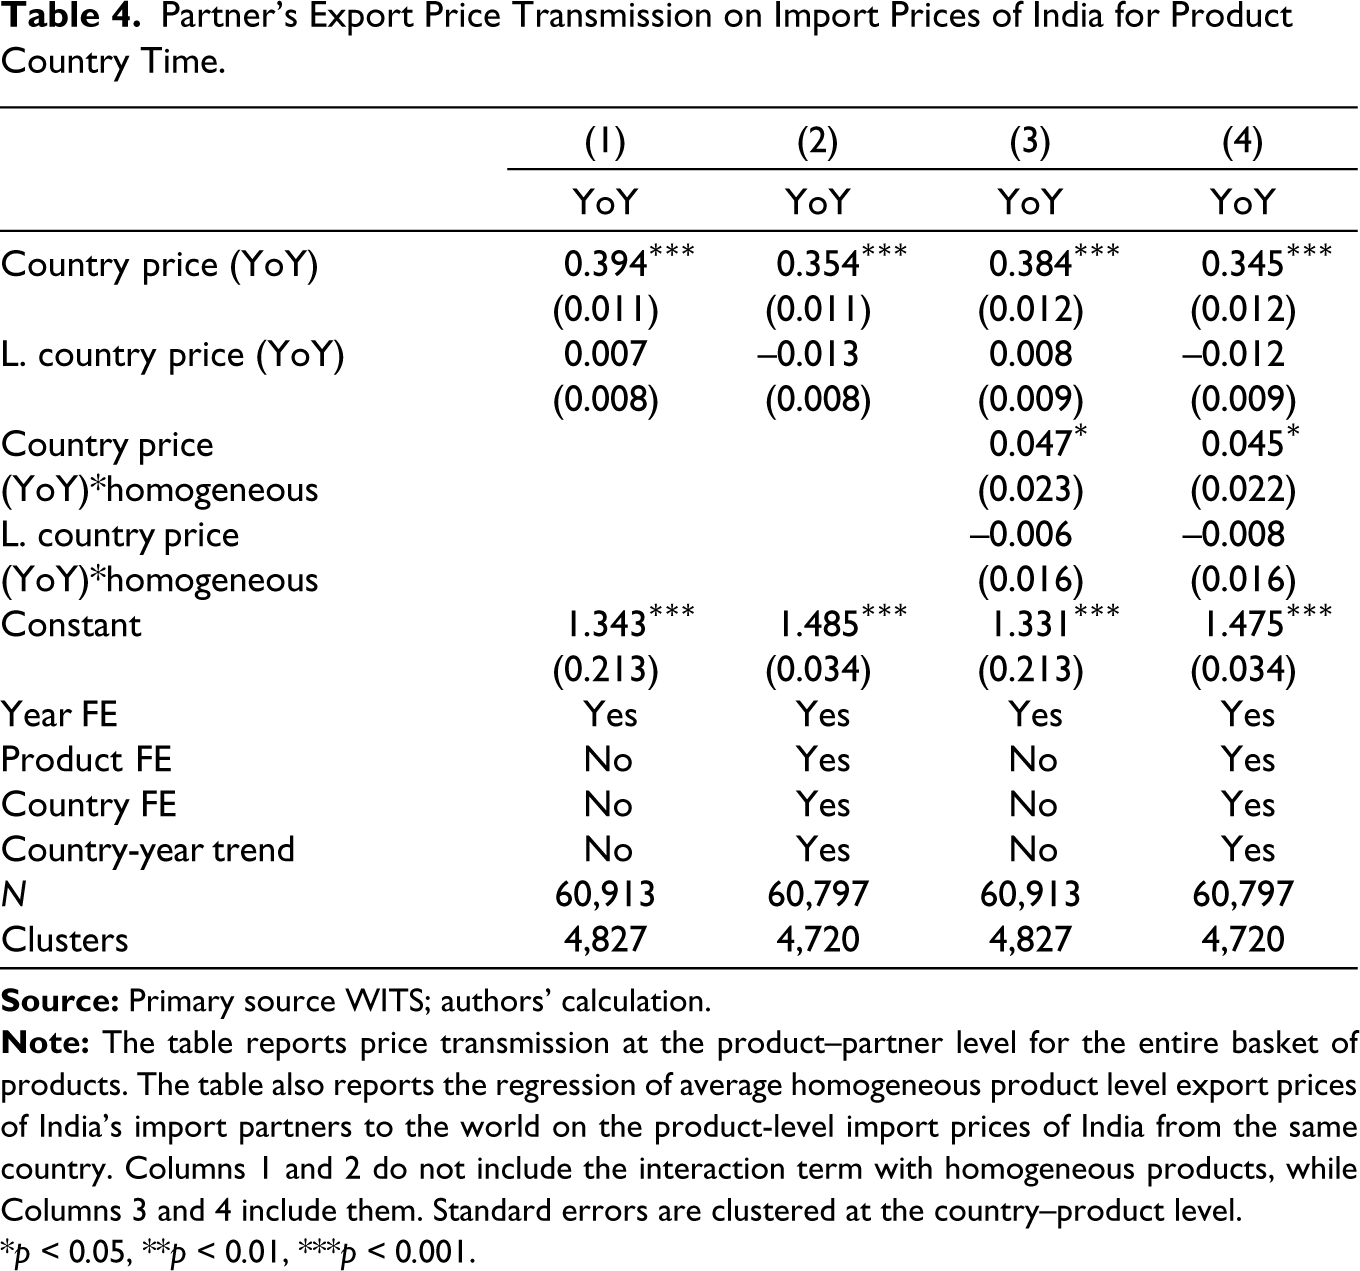
The estimation results for Equation (3) above are presented in Table 4. We find that price transmission occurs in a positive direction, and the coefficients are statistically significant. Specifically, a 1 p.p increase in the export prices charged by a country for a product increases the price of that product by 0.35 p.p. This estimate remains similar both with and without the product and country-fixed effects. Interestingly, and similar to the world prices, here also we find that the transmission is higher for homogeneous products by a margin of 0.05 p.p. However, this effect is only higher for a contemporaneous change, and it is statistically insignificant for the lagged change.
Comparing the results in Tables 3 and 4 (world and country levels), we infer that the transmission process is better captured when we consider the export prices for each product at the country level than at the world level. This is primarily because not all countries export a particular commodity to India. Thus, the transmission would be more pronounced when we consider the product-level price changes for the countries that are exporting the product to India. These results give us a sense that country-level prices are more important than world prices in the import price determination mechanism. For example, prices for imported products should take into account the prices charged by the countries India is importing from, rather than looking at the world prices.
Partner’s Export Price Transmission on Import Prices of India for Product Country Time.
*p < 0.05, **p < 0.01, ***p < 0.001.
Does a Higher Mark-Up Reduce the Quantity of Imports?
In the previous section, we looked in to how a change in product prices at the world and country levels gets transmitted to the import prices paid by the domestic country. We showed that the degree of transmission is higher when we consider the change in product prices by the countries that supply a particular product to the domestic country. The world prices of the products have a weaker transmission. In this section, we analyse whether a higher markup charged by a country for a product results in a lower quantity imported from that country. We define markup as the ratio of the price charged to India for a particular product by country X and the average export price of that product charged by country X to the rest of the world. Essentially, we are trying to capture whether the domestic country is importing a lesser quantity of product on average from a country that charges a higher markup. We estimate the following equation:
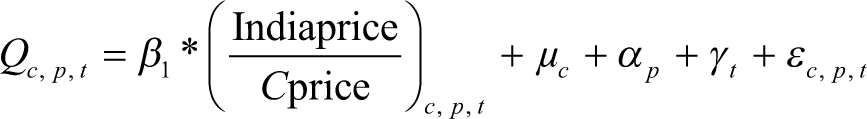
where Qc, p, t is the quantity of product p imported from country c at time t. On the right-hand side, we have the markup variable, which is the ratio of the India price and the average export price of product p charged by country c at time t. The rest of the variables carry the same interpretation as in Equation (3). The estimation results of this equation are presented in Table 5. We find that a higher markup results in a lower quantity imported. These effects are strong and significant regardless of the inclusion of the fixed effects in the specification. These results suggest that the domestic country imports less of a particular product on average from a country that charges a higher markup for that product relative to the average export prices offered by that country. Thus, price markup is an important determinant of partner country’s weight in the import basket specific to the product.
Difference in Partner’s Average Export Price and Import Prices of India on Quantity of Imports for Product Country Time.

*p < 0.05, **p < 0.01, ***p < 0.001.
Conclusion
Over the years, the market for traded goods has expanded in two directions. On the one hand, the product space has increased, that is, more products and their varieties are available in recent times, and this space is constantly expanding. On the other hand, the number of countries producing and trading a particular product has also increased, resulting in increased competition in the product space. These two changes have important implications for an importing country. Not only does an importing country now has larger access to the product space, but it also has access to different players in the market. Thus, if there is a change in product prices, the importing country may alter its trading partners in order to receive a competitive price. This article uses granular information on trade flows between India (a large open economy) and its trading partners to estimate the impact of price changes on the import basket in general. Specifically, we look at how a price change at the product level affects the mix of trading partners, and how this price change gets transmitted to the prices paid by the importing country.
Our results indicate that a price change at the product level does not necessarily induce a change in trading partners. This may be because trade relations are sticky and driven by distance, domestic preference for a particular product or bilateral relations between the two countries. We further find that, on average, a change in the world price of a particular product gets transmitted to the price charged to India. However, this degree of transmission is higher when we use bilateral trade information, that is, the average prices charged by the importing countries and not the average world prices. Further, we find that India imports less from countries that charge a higher markup price over and above the price charged to its other exporting partners.
Although we do not clearly identify the reasons why these frictions occur, two major policy implications come out from these findings. First, a country may benefit from removing the impediments that lie in the way of changing trading partners when there is a change in prices. A flexible market wherein the importing country can choose its partners on the basis of competitiveness may result in higher gains from trade. Second, price transmission from world prices to import prices depends on the partners the host country is importing from and less on the overall world prices. Thus, in order to identify the impact on prices of imported commodities, it is important to closely examine the trading partners rather than focusing only on the signals from world prices.
Footnotes
Declaration of Conflicts of Interest
The authors declared no potential conflicts of interest with respect to the research, authorship and/or publication of this article.
Funding
The authors received no financial support for the research, authorship and/or publication of this article.