
Abstract
Using a rich firm-level panel dataset of Indian manufacturing over 2010–2018, this study aims to identify the spillover effects associated with foreign direct investment (FDI). To this end, we distinguish spillover effects into horizontal (Intra-industry linkage) and vertical (backward or downstream and forward or upstream Inter-industry linkages) FDI channels. We employ various semi-parametric methods to tackle the endogeneity issues in productivity estimation. We find that backward spillover from the downstream multinational enterprises is the only source of total factor productivity gains. However, the magnitude of negative forward–vertical linkage is larger than the positive backward–vertical effect. The analysis also broadly compares technology spillovers for domestic and all firms in the sector. Finally, we investigate productivity spillover across industries based on their technology intensity. Our findings suggest that industry heterogeneity is a key driver of FDI spillover.
Introduction
Foreign direct investment (FDI) 1 is regarded as a prominent means for narrowing the productivity gap between developed and least developed countries (LDCs). This is because multinationals are often superior to domestic firms in terms of large-scale operation, investment in research and development activities, training, and hiring of skilled workers (Havranek & Irsova, 2011). In fact, many developing countries resort to various strategies to attract FDI through either fiscal or other incentive programmes. 2 Moreover, the handbook of statistics (UNCTAD, 2022) confirms that FDI continues to be an important source of external finance for LDCs—crucial for their sustainable development and eventual graduation. The report also highlights that global FDI inflows increased by 64% to US$1.6 trillion in 2021, 39% of which was contributed by developing economies in Asia.
Several previous studies have shown that multinational enterprises (MNEs) can help upgrade production facilities through technology spillover (Blomstrom & Kokko, 2001; Caves, 1974; Javorcik, 2004). 3 Generally, technology spillovers refer to positive externalities that trickle down from foreign to domestic firms resulting in productivity improvements through technology transfer (Bournakis, 2021; Bournakis et al., 2022). However, although sufficient research has tried to investigate the effects of FDI spillover on the productivity of domestic firms, many have been unable to provide definitive evidence. As a result, the outcome of these studies on FDI spillover is mainly inconclusive—varying from neutral effects to negative and positive ones (Aitken & Harrison, 1999; Caves, 1971; Javorcik, 2004). A similar case is encountered regarding findings pertaining to emerging economies, such as India (Kathuria, 2010; Lall, 1980; Mondal & Pant, 2018). Given the significance of MNEs, especially among developing nations, technology spillover continues to be a considerably ambiguous subject.
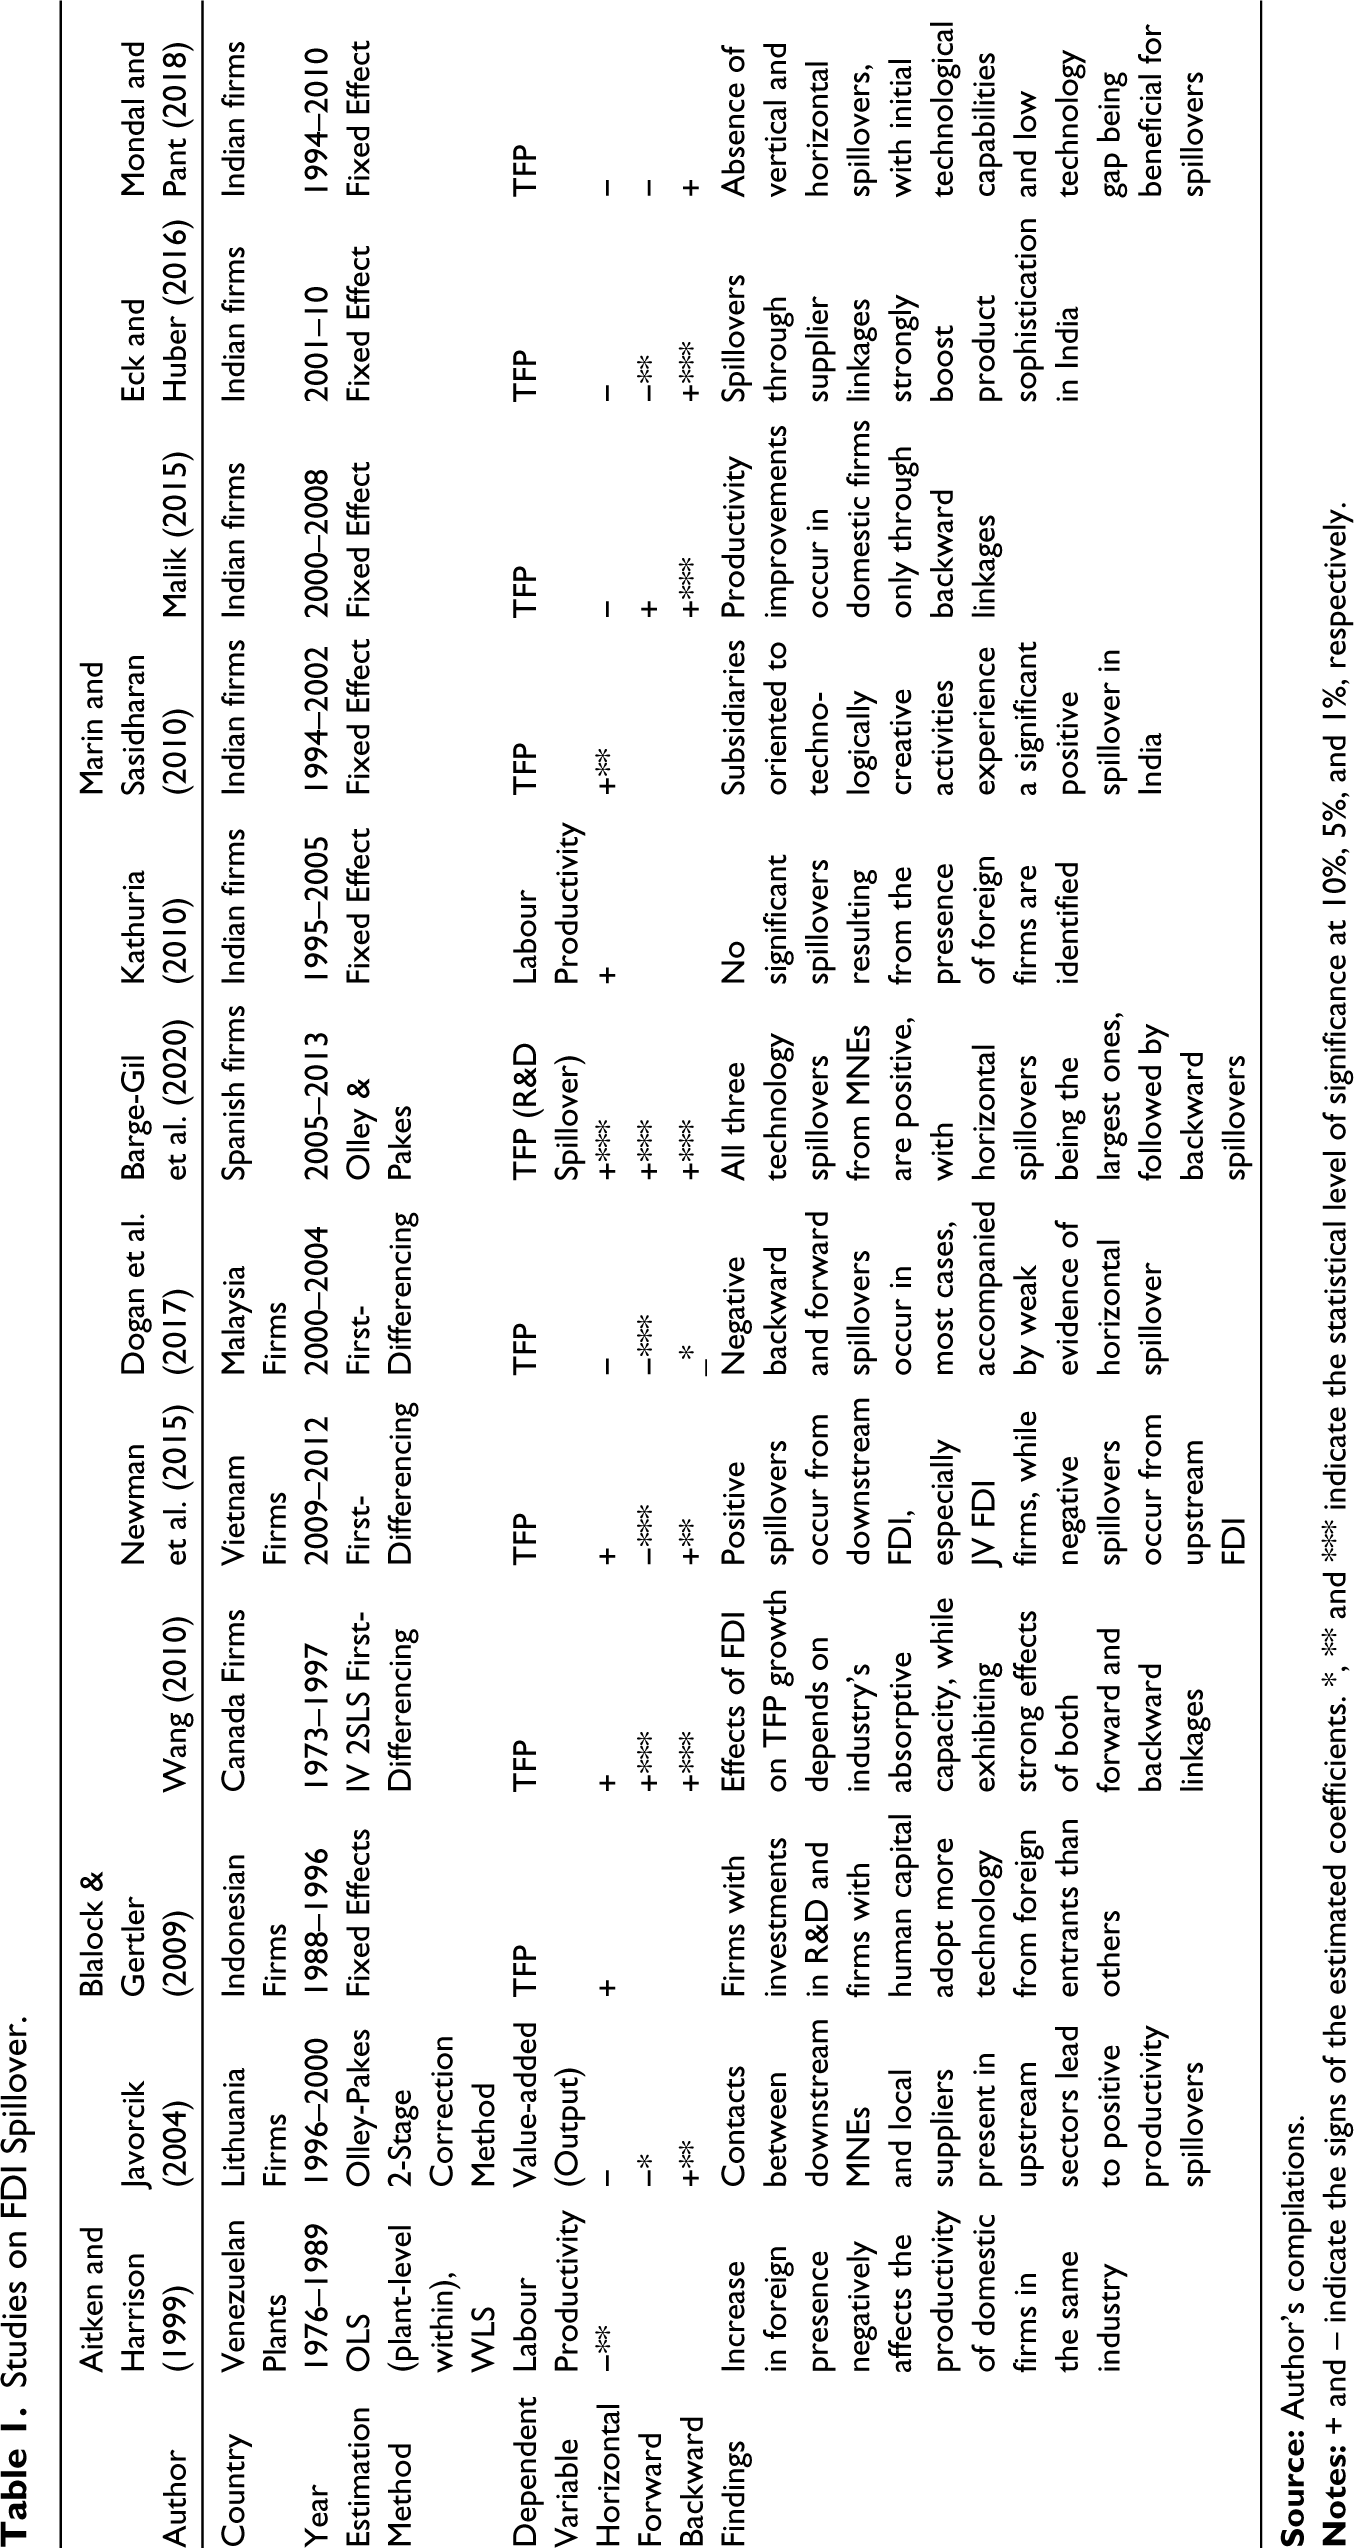
To address these mixed and contradictory results, the current study aims to re-examine the impact of FDI spillovers on the productivity of domestic firms. Considering this context, India is an interesting case to study since it has emerged as one of the most favourable destinations for foreign investments. Following the economic liberalisation of 1991, India has actively undertaken FDI and bilateral trade agreements to boost domestic production. In recent years, the government has opened up various entry routes and increased sectoral caps for foreign investments. The Indian government currently allows 100% FDI through automatic routes in the coal and mining, telecom, greenfield pharmaceuticals, and civil aviation sectors. Similarly, via the government route, 100% FDI is permitted for railway infrastructure, retail trading, e-commerce, and teleports, while 74% of foreign investment is allowed for private agencies and brownfield pharmaceuticals. 4 Additionally, India has been actively participating in global consolidation, predominantly through the purchase of imported technologies and technology transfer agreements (Confederation of Indian Industries report, 2017). 5 Despite these measures, a few limited studies provide a detailed analysis of the relationship between foreign presence and the productivity of domestic firms in the context of India (Table 1).
Studies on FDI Spillover.
This study empirically tests the presence or absence of FDI spillover through horizontal and vertical channels. Following the standard practice in the literature (Blalock & Gertler, 2008; Javorcik, 2004), FDI spillover in the Indian manufacturing sector 6 is estimated and quantified by regressing foreign presence on the productivity of domestic firms. In other words, this study measures foreign presence in terms of the proportion of output produced by foreign affiliates compared to the total output produced in the industry. Furthermore, the present study investigates the impact of FDI spillover at the firm level—an exercise that has two significant advantages. First, it permits the investigation of firms’ productivity over a long period rather than at one point of time. Second, it allows for examining spillover effects while controlling for other factors (Gorg & Strobl, 2001). We analyse both horizontal and vertical spillover channels of FDI using the Prowess firm-level database for Indian manufacturing provided by the Centre for Monitoring Indian Economy (CMIE), covering the period 2010–2018.
Our results confirm a positive spillover effect resulting from backward–vertical FDI, while no significant impact of horizontal FDI is identified. Furthermore, our analysis shows that a one-standard-deviation increase in foreign presence in the sourcing sector is associated with a two percent rise in each firm’s output in the supplying industry. In this context, it is interesting to note that the positive backward linkage is more prevalent in the case of domestic firms, where the increase in foreign presence by a one standard deviation leads to a nearly three percent rise in output. Similarly, the forward–vertical FDI channel reports a lesser negative effect for domestic firms compared to total manufacturing.
Next, this study explores spillover effects across industries, where industries are distinguished based on their technology intensity following the OECD classification (2011). The findings indicate the presence of a heterogeneous spillover pattern across sectors. Surprisingly, the study finds no significant spillover impact in the high-tech sector. Meanwhile, signs of spillover variables for the medium high-tech industries are similar to those for all manufacturing sectors. Moreover, unlike the high-tech sector, signs of horizontal spillover are positive for both low-tech and medium-low-tech industries. Therefore, this study highlights the crucial role played by the heterogeneous characteristics of host-country sectors in generating spillover effects. This analysis is essential from a policy point of view because it can guide the host-country government to adopt corrective measures to strengthen the technology spillover from foreign investments. Overall, our findings suggest that the heterogeneity of domestic industries is the key driver of FDI spillovers. Furthermore, we utilize different total factor productivity (TFP) estimates to test the robustness of our results.
This article contributes to the literature by providing an updated overview of FDI spillover in emerging economies, such as India. Since India is a large and fast-growing market, insights drawn from the findings on its spillover mechanism may be useful in the context of other emerging and developing economies. Moreover, while the existing literature is more focused on technology spillovers from foreign affiliates to firms in the manufacturing sector as a whole, this study makes an addition to it by examining the spillover impact on heterogeneous industries across different sectors.
The rest of this article is structured as follows: The second section provides a brief overview of the theoretical and empirical developments in FDI spillover literature. Following this, a snapshot of FDI inflows in India during the study period is presented in the third section. The fourth section illustrates the data sources and outlines procedures for constructing the variables of interest. Next, the fifth section deals with the estimation strategy, while the main findings are presented in the sixth section 6. Finally, the seventh section concludes this study by offering suitable policy suggestions.
Related Literature
In spillover literature, the main interest centers around transferring technology from MNEs to domestic firms and identifying the mechanism behind this process. Until now, international trade literature examined FDI spillover under two heads—horizontal and vertical. Horizontal FDI spillover (HFDI) occurs as a result of intra-industry linkage, wherein domestic and foreign firms operate in the same industry. Conversely, vertical FDI spillover (VFDI) takes place through the inter-industry linkage between domestic and foreign firms. The VFDI is further divided into forward and backward linkages—the former refers to spillover gains acquired by domestic firms on purchasing intermediate goods from foreign suppliers, and the latter considers the effects of domestic firms supplying intermediate goods to foreign firms.
The earliest discussion on productivity spillovers dates back to the initial works of Caves (1971), who examine the costs and benefits of foreign investments through technology spillover. Following Caves (1974), earlier studies increasingly consider spillover as a function of foreign presence (Findlay, 1978). Later empirical models mostly deal with extended and refined versions of this earlier work, maintaining the same basic approach (Blomstrom, 1986; Globerman, 1979). These studies primarily focus on the production function framework, where the share of foreign presence is used as one of the explanatory variables to measure labour productivity or its changes. All these studies, which use the aggregate data for the manufacturing sector, find a statistically significant positive coefficient for foreign presence. As a result, they conclude that spillovers exist at the industry level. These studies posit that the technology possessed by MNEs is a public good that can be transferred to domestic firms without cost through the demonstration and imitation effects (Das, 1987).
The second-generation theoretical literature argues that spillovers involve costs when foreign and domestic firms interact, suggesting that technology diffusion and transfer are endogenously determined (Wang & Blomström, 1992). However, Aitken and Harrison (1999) note the possibility of negative spillover effects. They identify the presence of a market-seeking or competence-exploiting nature in foreign firms, which may result in adverse market-stealing effects. Furthermore, they argue that multinationals have firm-specific advantages that lower their marginal costs, consequently allowing them to attract more demand, thus forcing domestic firms to cut production and increase their given average cost curve. Subsequent studies by Djankov and Hoekman (2000) for the Czech Republic and López-Córdova (2002) for Mexico yield similar results. Since then, the debate over FDI spillover on domestic firms’ productivity has been producing mixed results that are often poorly understood by policymakers, thus hampering potential economic growth.
Table 1 notes the mixed findings of previous studies on FDI spillover. While early studies, beginning with Caves (1974), focus more on analysing horizontal spillovers, the more recent ones have started examining vertical spillovers. On considering this extensive and emerging literature, the empirical evidence for the backward–vertical effect is found to be more prominent than for the other spillover channels. However, in the context of India, prior studies identify a larger significance in the case of horizontal spillover (Marin & Sasidharan, 2010; Pradeep et al., 2017).
Given the diversity of findings, this study re-examines the relationship between FDI and technology transfer using the standard approach of regressing foreign presence on firms’ TFP. Notably, our results are consistent with the findings of Javorcik (2004) and Eck and Huber (2016). Our result confirms the existence of a strong backward linkage, which we consider as supporting evidence for positive-vertical spillover through supply chains. However, it should be noted that the spillover pattern across industries is quite ambiguous.
Foreign Direct Investment in India
India provides an ideal setting to examine our proposed hypotheses. In 1991, the Indian economy opened up with liberalised investment policies, and today it has emerged as one of the most preferred destinations of foreign investors. Until 1991, India offered limited opportunities for foreign investors, where FDI was mainly confined to a few sectors, such as plantation and mining. The unprecedented economic crisis of 1991 led policymakers to remove restrictions on foreign equity participation and liberalise the industrial licensing system. Subsequently, these government reforms have resulted in increased FDI inflows into the country. According to the World Investment Report, ‘FDI to India, which has historically accounted for 70% to 80% of inflows to the sub-region, increased by 6% to US$42 billion. The Investment was strong in manufacturing, communication, and financial services—the top three industry recipients’ (UNCTAD, 2019). Figure 1 depicts the trend of FDI inflows into India for the period 2010–2018.
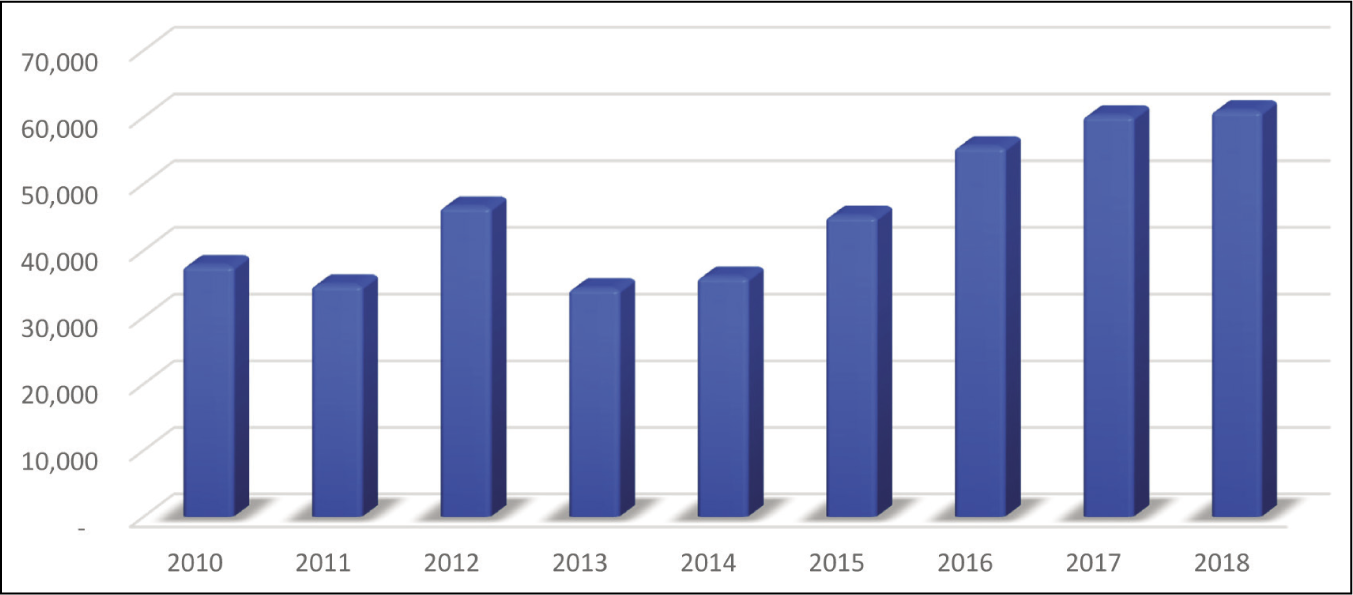
FDI inflows in India were US$ 45.15 billion in 2014–2015 and have continuously increased since then. Furthermore, positive features of the Indian economy, such as the availability of skilled and semi-skilled workforce, low wages, and policy initiatives of domestic governments, have been playing crucial roles in turning the country into a manufacturing hub. In addition, being the fifth-largest economy in the world, India is bestowed with an exponential consumer base that provides foreign investors with a larger market setting.
The sectoral distribution of FDI indicates a sharp decline in the case of traditional sectors, with the services and manufacturing sectors leading the path. 7 With more than 50% of the FDI share, the service sector’s FDI share is the largest, followed by the manufacturing sector. Major industries that attract FDI include the automobile industry, chemicals and allied products, and pharmaceuticals. 8 Interestingly, the metallurgical industry, which failed to attract foreign investment before 2000, has currently emerged as one of the major sectors to receive FDI. Similarly, the automobile industry has experienced a steep increase in foreign investment since 2000, accounting for US$ 20,846.12 million (2000–2014), due to the provision of 100% FDI in this sector. Moreover, an extensive inflow of foreign investments has been prevalent in the pharmaceutical industry as a result of multinational pharmaceutical corporations outsourcing many of their functions, such as R&D (Sagar, 2013).
Data Description
Data Sources and Sample
The current study utilises data sources—firm level and industry level. The firm-level panel dataset is obtained from the Prowess database provided by the Centre for Monitoring Indian Economy (CMIE), 9 which contains financial information on all listed and a larger set of unlisted Indian companies, covering most organized industrial activities in the country. 10 The Indian Companies Act of 1956 requires incorporated firms to disclose heads of expenditure of more than 1% of their turnover in their annual reports. Additionally, it compiles and provides detailed information at the firm level drawn from the income statements and balance sheets of the listed companies, which include information pertaining to sales, exports, imports, salaries and wages, raw materials, foreign promotion, R&D expenses, etc.
For this study, we use data over the period 2009–2010 to 2017–2018. Notably, the year of analysis begins from 2009 to 2010 to avoid measurement errors and uncertainties introduced by the global financial crisis of 2008. However, we have excluded four sectors—NIC 15, 18, 31, and 32—that do not report foreign presence during the given study period. In addition, all industries are grouped into four major sectors based on technological intensity (OECD, 2011). 11
The present study uses an unbalanced panel because very few firms exit from the dataset. For the data cleaning part, we have dropped firms reporting zero and negative sales figures, and those reporting after a gap are excluded. We consider only continuous observations of at least three years, which is essential for constructing the capital stock variable. Finally, to reduce the influence of extreme observations, all continuous variables are winsorised at the 1st and 99th percentiles. Finally, we are left with 31,470 observations across 5,574 firms belonging to 18 two-digit industries based on National Industrial Classification (NIC), 2008. Table 2, provides a snapshot of the sample firm-year observations used in the study.
Sample Firm-year Observations by Ownership.
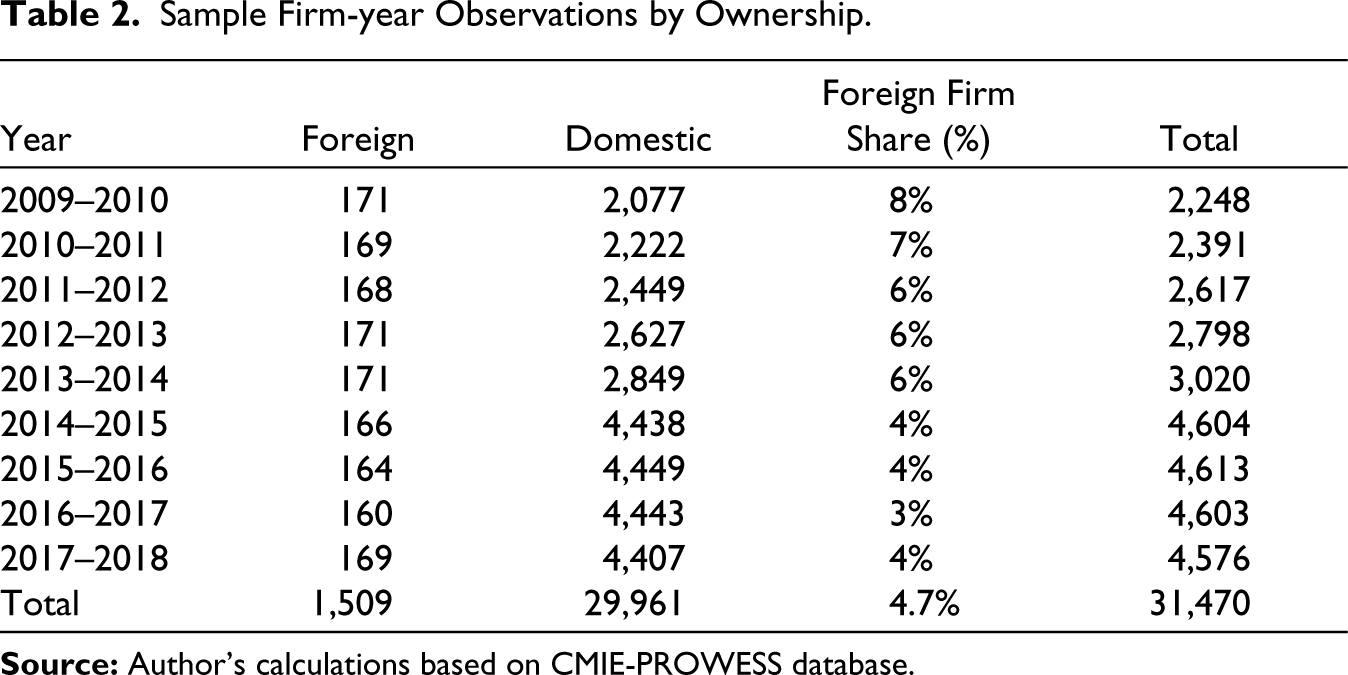
Apart from firm-level data, we also use industry-level information from the Annual Survey of Industries (ASI) to construct the labour variable and data from the Central Statistical Organization (CSO) to arrive at the industry-level price deflator. Additionally, we use the input–output transaction table provided by the Ministry of Statistics and Programme Implementation (MoSPI) of the Government of India in 2007–2008 to estimate the vertical spillovers of FDI. Firms with more than or equal to 10% foreign equity held by a foreign promoter are treated as foreign firms. Table 2 shows that around 5% of the sample firms are foreign owned.
Variable Description and Descriptive Statistics
This section focuses on defining and constructing the key variables of our interest—variables used for the production function estimation, spillover variables, and control variables.
Capital
The construction of capital stock follows the traditional perpetual inventory method (PIM) approach (Balakrishnan et al., 2000; Srivastava, 1996), which revalues the capital at historical cost according to a base year. The Prowess database reports the gross fixed assets (GFA) of firms in terms of historical cost. Moreover, the value of these fixed assets is based on three asset types—lands and buildings, machinery and other capital goods, and vehicles. In this study, we convert the reported historical GFA value into replacement cost based on a revaluation factor (Srivastava, 1996). To estimate the revaluation factor, we choose the base year as the one with the maximum number of observations, which is the year 2014–2015 in our case. Finally, we report the capital stock in real terms after deflating it at replacement cost by the wholesale price index for machinery and machine tools. 12
Labour
Only a few firms report the number of employees in Prowess, but it contains the wages and salaries of the firms. Therefore, to estimate the number of persons engaged in each firm, we have divided the salaries and wages at the firm level by the average wage rate, as follows:
No. of Employees Engaged Per Firm = Salaries and Wages/Average Wage Rate
Average industry wage rate is calculated using the industry-level information provided by the ASI as
Average Wage Rate = Total Emoluments/Total Persons Engaged
Energy
The energy variable is proxied by electricity expenses (Topalova & Khandelwal, 2011) incurred by firms. The Prowess database reports the ‘power and fuel expenses’ of the firms. These electricity expenses are converted into real terms using the electricity wholesale price index with 2011–2012 as the base year.
Output
The output variable refers to the total value of the output produced by a firm in a given year. Output is estimated as the deflated sale value, adjusted for changes in inventory and purchase of finished goods. Meanwhile, the Prowess database defines the purchase of finished goods as goods purchased from other manufacturers for resale. Therefore, we subtract the purchase of finished goods from sales to arrive at the output level of the firms. Notably, a positive increase in inventory was added to sales, while a decrease in the same is subtracted from sales to arrive at the output. Further, nominal values of the production function variables are deflated using the wholesale prices pertaining to each industry using the CSO data. 13
The spillover variables are constructed following Javorcik (2004) as well as Blalock and Gertler (2008). While horizontal spillover measures the extent of foreign presence in an industry, backward and forward linkages depict the generation of spillover effects in downstream and upstream sectors, respectively.
Horizontal Spillover
The horizontal spillover from FDI to domestic firms in the same industry is measured as follows:

Here, horizontal denotes the horizontal spillover effects, while subscript j refers to industry, i is the ith firm, i ∈ jt indicates a firm in a given industry, and t represents time. Hence, horizontal spillover reflects the share of foreign output in the total industry output.
Vertical Spillover
Vertical backward linkage measures the spillover prompted by the interaction between local upstream suppliers and multinational downstream customers in industries. Backward vertical spillover from downstream MNEs to local upstream suppliers is defined as follows:

Here, Horizontalkt captures the within-industry spillover effects and ∝
jk
denotes the share of the output of industry j supplied to industry k, where the former includes the output that is used only for intermediate products and excludes those used for final consumption. Notably, ∝
jk
is calculated using the input–output (I-O) transaction table provided by MoSPI (2007–2008). Vertical forward linkage is proxied by the degree of foreign presence in upstream industries. Forward vertical FDI captures the impact of spillover occurring through interactions between local downstream firms and multinational upstream firms, calculated as follows:

Here, Forwordjt is calculated by subtracting firm-level exports Xit, since the industry m’s exports cannot be consumed by industry j. It also excludes the within-industry consumption share. ∝ jm is computed using the I-O table, which denotes the share of inputs consumed by industry j from industry m. In this study, horizontal spillover for the electrical equipment manufacturing industry is found to be the largest, followed by the machinery and equipment industry. Similarly, the highest backward and forward spillovers are accounted for the basic metal and the coke and refined petroleum products industries, respectively. 14
Apart from these variables, we have also included a host of firm-specific control variables that may affect domestic firms’ productivity—age, firm size (Size), R&D intensity (R&Dint), and export intensity (EXPint). Previous studies have determined that a firm with a larger size and more experience can tackle competition and absorb spillover effects more efficiently (Griliches, 1991). Therefore, by controlling for age and firm size, we can expect to reduce the possibility of bias resulting from the excluded variables that change across domestic firms over time (Kathuria, 2002). We define the firms’ age as the years since the year of incorporation, while the deflated sales values indicate firm size. R&D intensity refers to the ratio of a firm’s R&D expenditure to its total sales. In other words, it measures the effect of R&D expenses on the productivity of firms (Mohnen, 2019). Similarly, export intensity is the ratio of a firm’s exports to its sales, and is used in this study to assess the impact of export activities on firms’ productivity. To account for the market concentration, we have included industry level variable HHI (Hirschman–Herfindahl index). The HHI index, which captures potential market competition effects, is expressed as
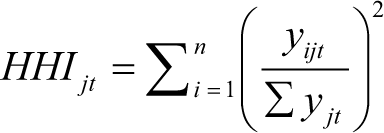
Here, yijt stands for sales of firm i of jth industry at time t. The HHI index captures the concentration effect, where a lower index value implies a less concentrated industry with more competition and vice versa. Leibenstein (1966) noted that X-inefficiency occurs when technical efficiency 15 is not achieved due to a lack of competition, leading to lower productivity of firms in the industry. Hence, there is a negative relationship between HHI and firm productivity. We have also included firm and time dummies to eliminate the omitted variable bias and time-invariant factor. By including these dummies, we control for the differences in firm and regional effects, such as firms’ long-term strategies, infrastructure, and technological opportunities (Bell & Marin, 2004). The summary statistics of discussed variables is given in Table 3.
Summary Statistics of Variables.
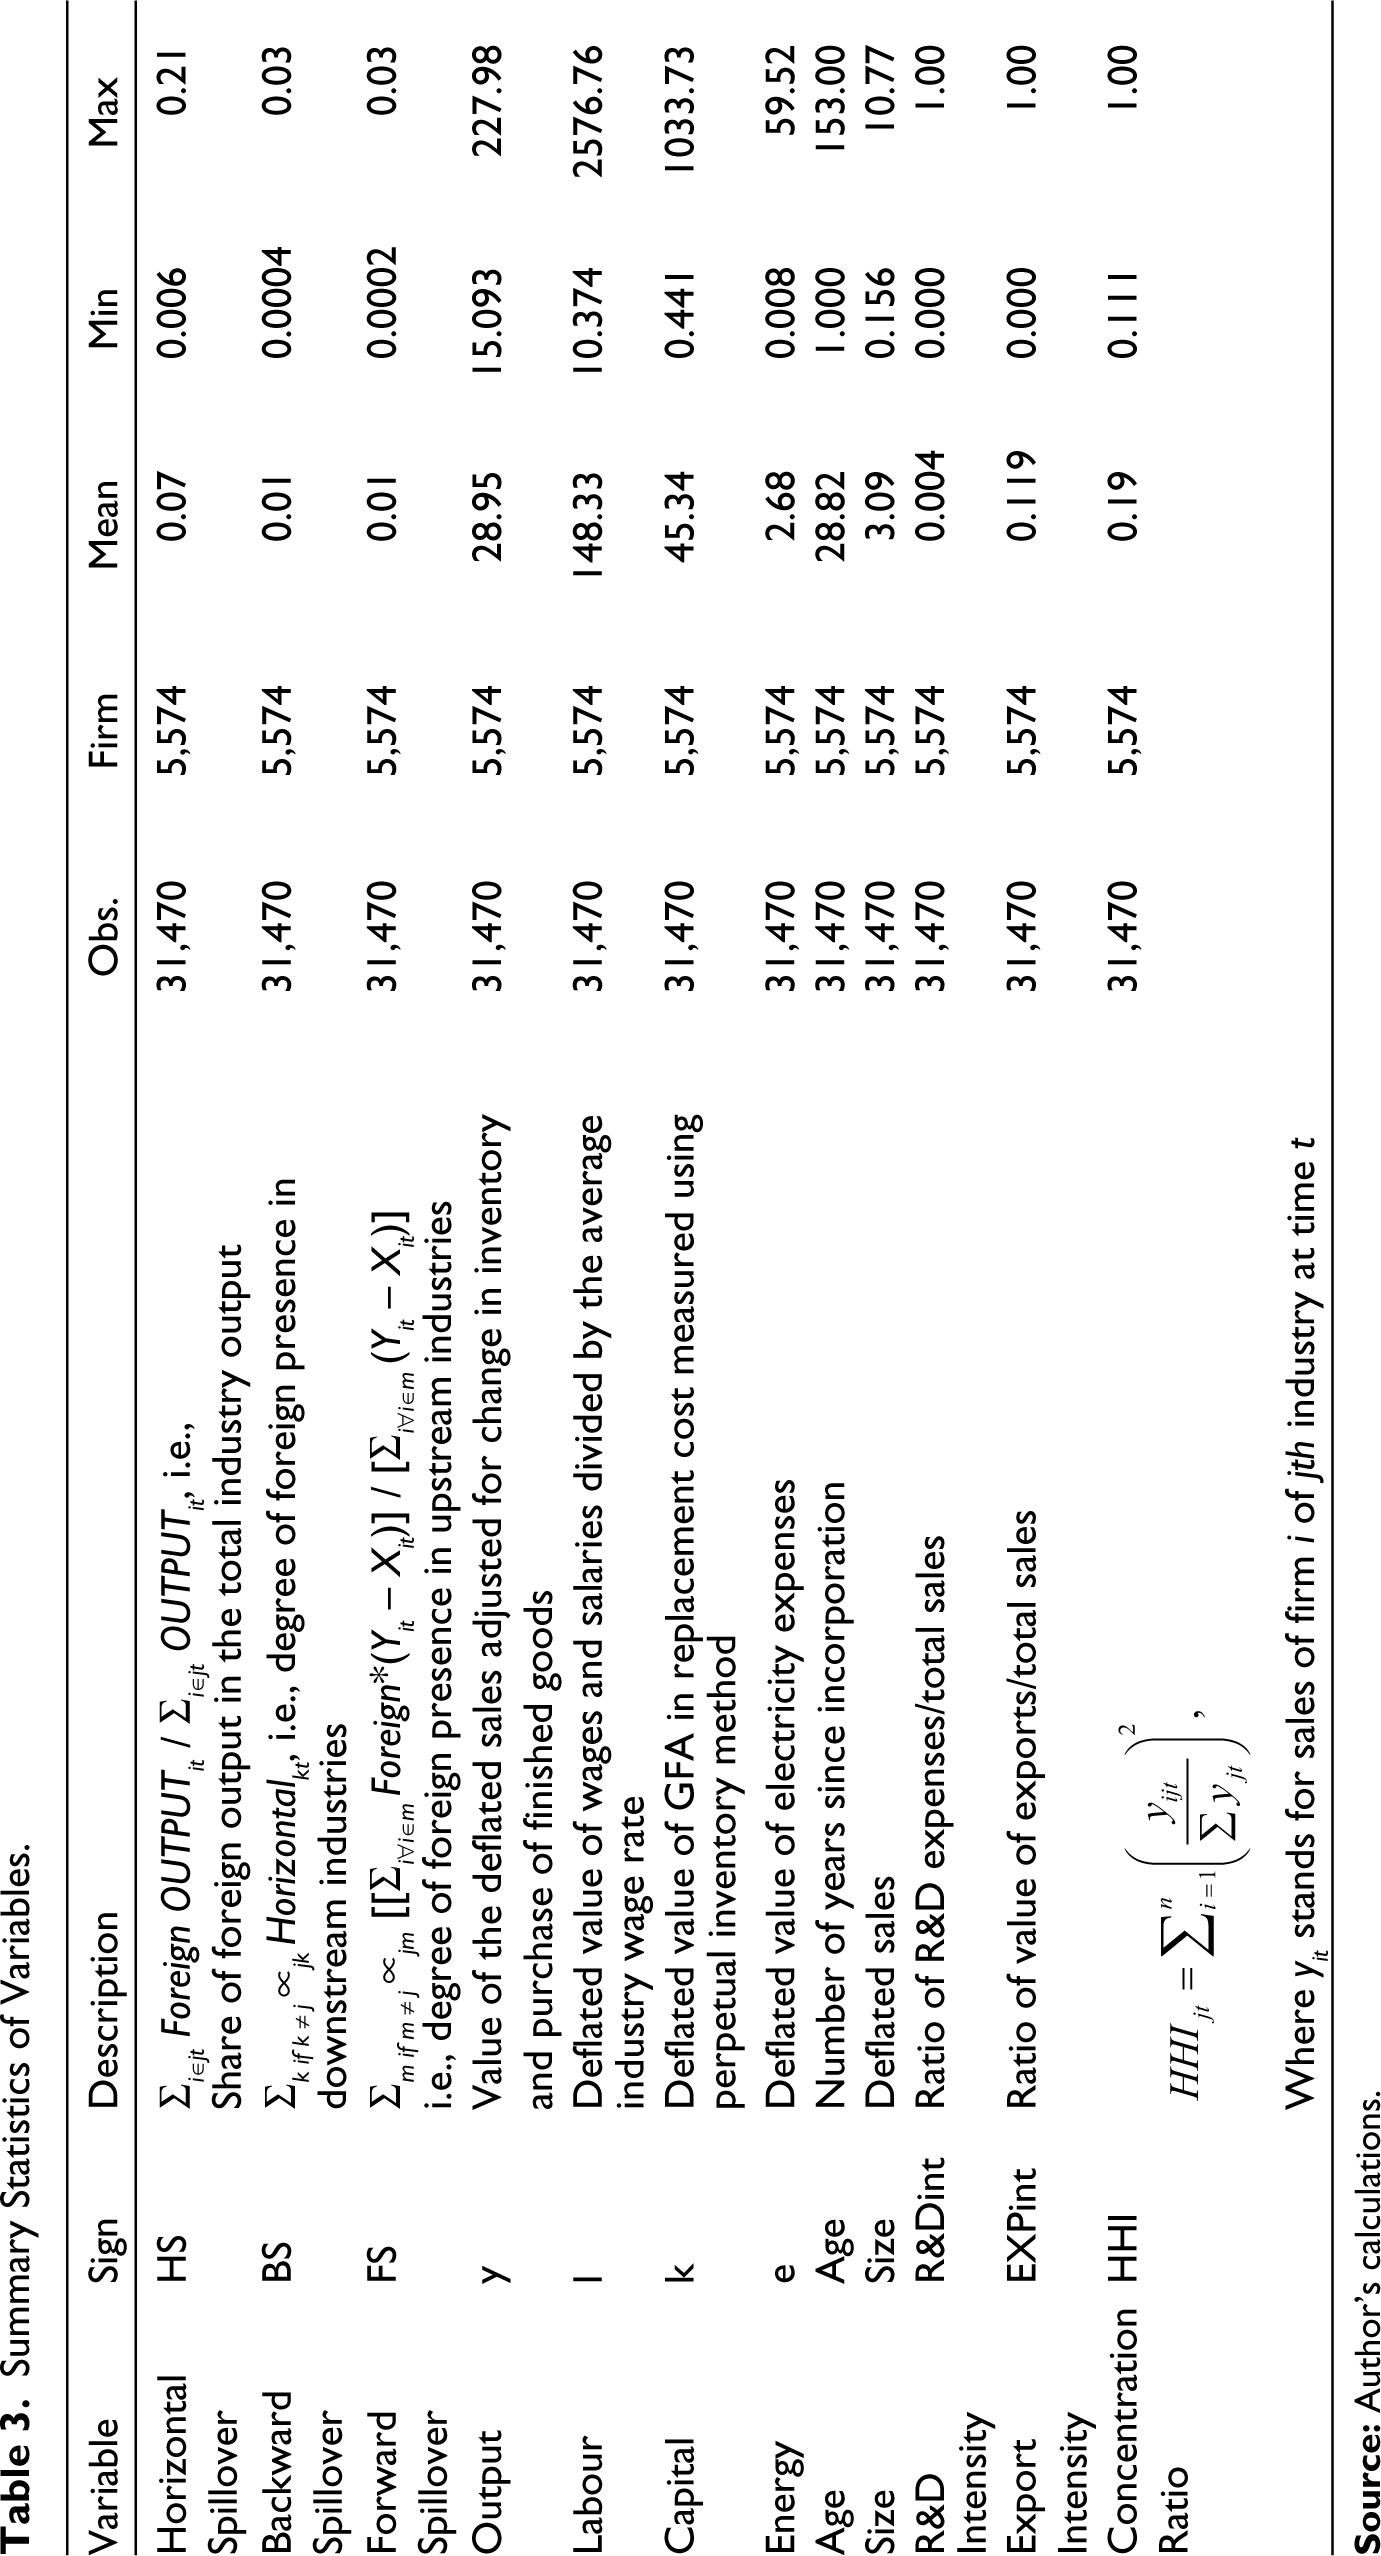
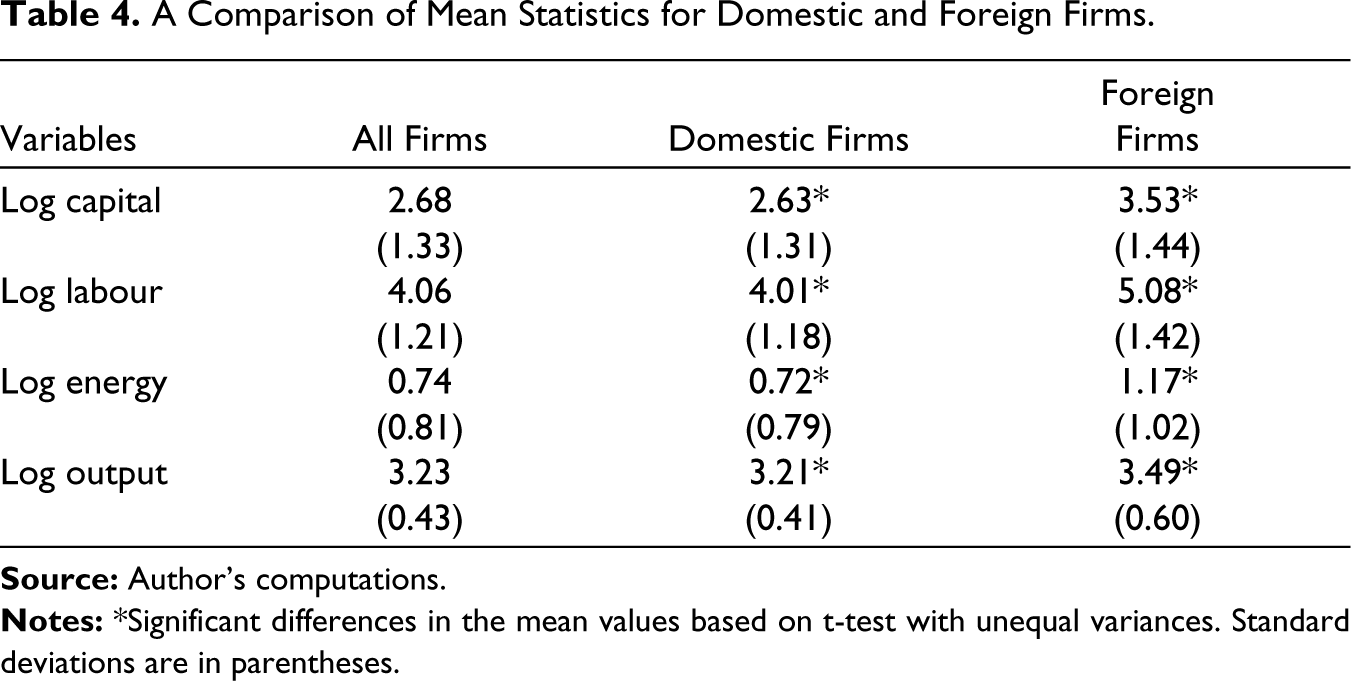
Table 4 displays the descriptive statistics for foreign and domestic firms, where it is evident that foreign industries are bigger owing to the large gap that exists between domestic and foreign firms. In other words, it emphasises the potential of domestic firms to learn from multinationals by participating in the spillover mechanism.
A Comparison of Mean Statistics for Domestic and Foreign Firms.
Estimation Strategy
This section explains the techniques used in the current study to develop the empirical model. We follow the standard practice in FDI-related spillover literature for examining spillover effects by modeling the spillover variables within the production function framework. Our empirical strategy involves a two-stage procedure—we begin by estimating firm-level TFP using the semi-parametric technique proposed by Ackerberg et al. (2015) and then regress the spillover variables on TFP to verify productivity spillovers.
Production Function Framework
First Step
The estimation process begins with implementing the conventional Cobb-Douglas (C-D) production function. Considering the logarithm of a C-D production function, the estimation equation for firm i in industry j at time t is represented as

Here, y, l, k, and e stand for output, labour, capital, and energy, respectively. The unobserved productivity shock or serially uncorrelated productivity shock (only observable to the firm manager, which influences the input choices) is represented by ωijt while the constant term β0 measures the mean efficiency level across industries. εijt is a pure random variable that captures the deviation from the mean due to measurement error, unexpected delays, or other external disturbances (Van Beveren, 2012). The subscript ijt denotes firm i, industry j, and time t.
Second Step
Next, we estimate our model by extending the Levinsohn and Petrin (2003) estimation procedure using the Ackerberg et al. (2015) technique to solve the multicollinearity and identification issues with the labour variable. The semi-parametric method proposed by Levinsohn and Petrin (L-P) considers the unobservable effects of inputs on productivity, thus producing reliable input estimates. It addresses crucial measurement issues, such as endogeneity of input choices or simultaneity bias and selection bias, while estimating the production function (Van Beveren, 2012). Simultaneity bias arises when input choices in the production process are simultaneously determined by the firm’s characteristics and its productivity performance (De Loecker, 2007). In other words, it refers to the correlation between unobserved productivity shocks and the input mix. Thus, selection bias arises when a firm’s decision to stay in the market is influenced by its productivity and expected future profitability. This, in turn, leads to an endogeneity 16 problem. In the presence of endogeneity, OLS produces biased estimates of input coefficients by treating labour and other input variables as exogenous. Since spillover effects are measured primarily in terms of productivity, obtaining consistent estimates is crucial for our analysis. Therefore, we use an adjusted L-P estimator using Ackerberg et al.’s (ACF) semi-parametric method to obtain the firm-level TFP.
To correct for endogeneity bias, Levinsohn and Petrin’s methodology uses intermediate inputs (material or energy variables) as a proxy for unobservable productivity shocks. On a similar line, we have taken energy as the proxy variable to tackle the endogeneity issue. However, based on this assumption, this proxy variable has a monotonic relationship with firm-specific unobserved productivity differences, conditional on the state variable, kijt. It means that the proxy variable eijt = et(ωijt kijt ). Under monotonicity conditions, the inverted energy demand function will be = ωijt(eijt kijt). Incorporating this function, we can rewrite Equation (5) as
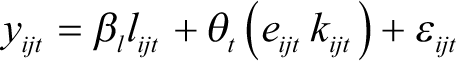
where θijt(eijt kijt)= β0 + βkkijt + βeeijt + ωt(eijt kijt).
The production function estimation using the L-P algorithm takes place in two stages. In the first stage, we estimate the conditional moments and βl, and in the second stage, βk and βe are estimated (Rijesh, 2023). 17 However, as in the real world, labour involves adjustment friction resulting from hiring or firing and search costs (Van Beveren, 2012). This implies that first-stage regression under the L-P estimation technique suffers from collinearity and identification problems. Therefore, we apply the criticism of the L-P method put forwarded by Ackerberg et al. to obtain firm-level TFP. ACF treats labour as a flexible input and considers its choice based on unobserved productivity ωijt Hence ACF technique suggest that the labour variable is also a function of state variables: lijt = l(ωijt kijt).Therefore, now the demand function of the intermediate input eijt = e(ωijt kijt lijt), which is still invertible as long as e is strongly increasing in ωijt. Under the ACF framework, all input variables, including labour, are estimated in the second stage.
Table 5 presents the results of the TFP estimation, where the productivity of the paper and paper products industry is the highest among the low-tech sectors. The motor vehicle and transport equipment industry is the most productive among the high-tech sectors. 18
Summary of TFP Estimation Under ACF Framework.
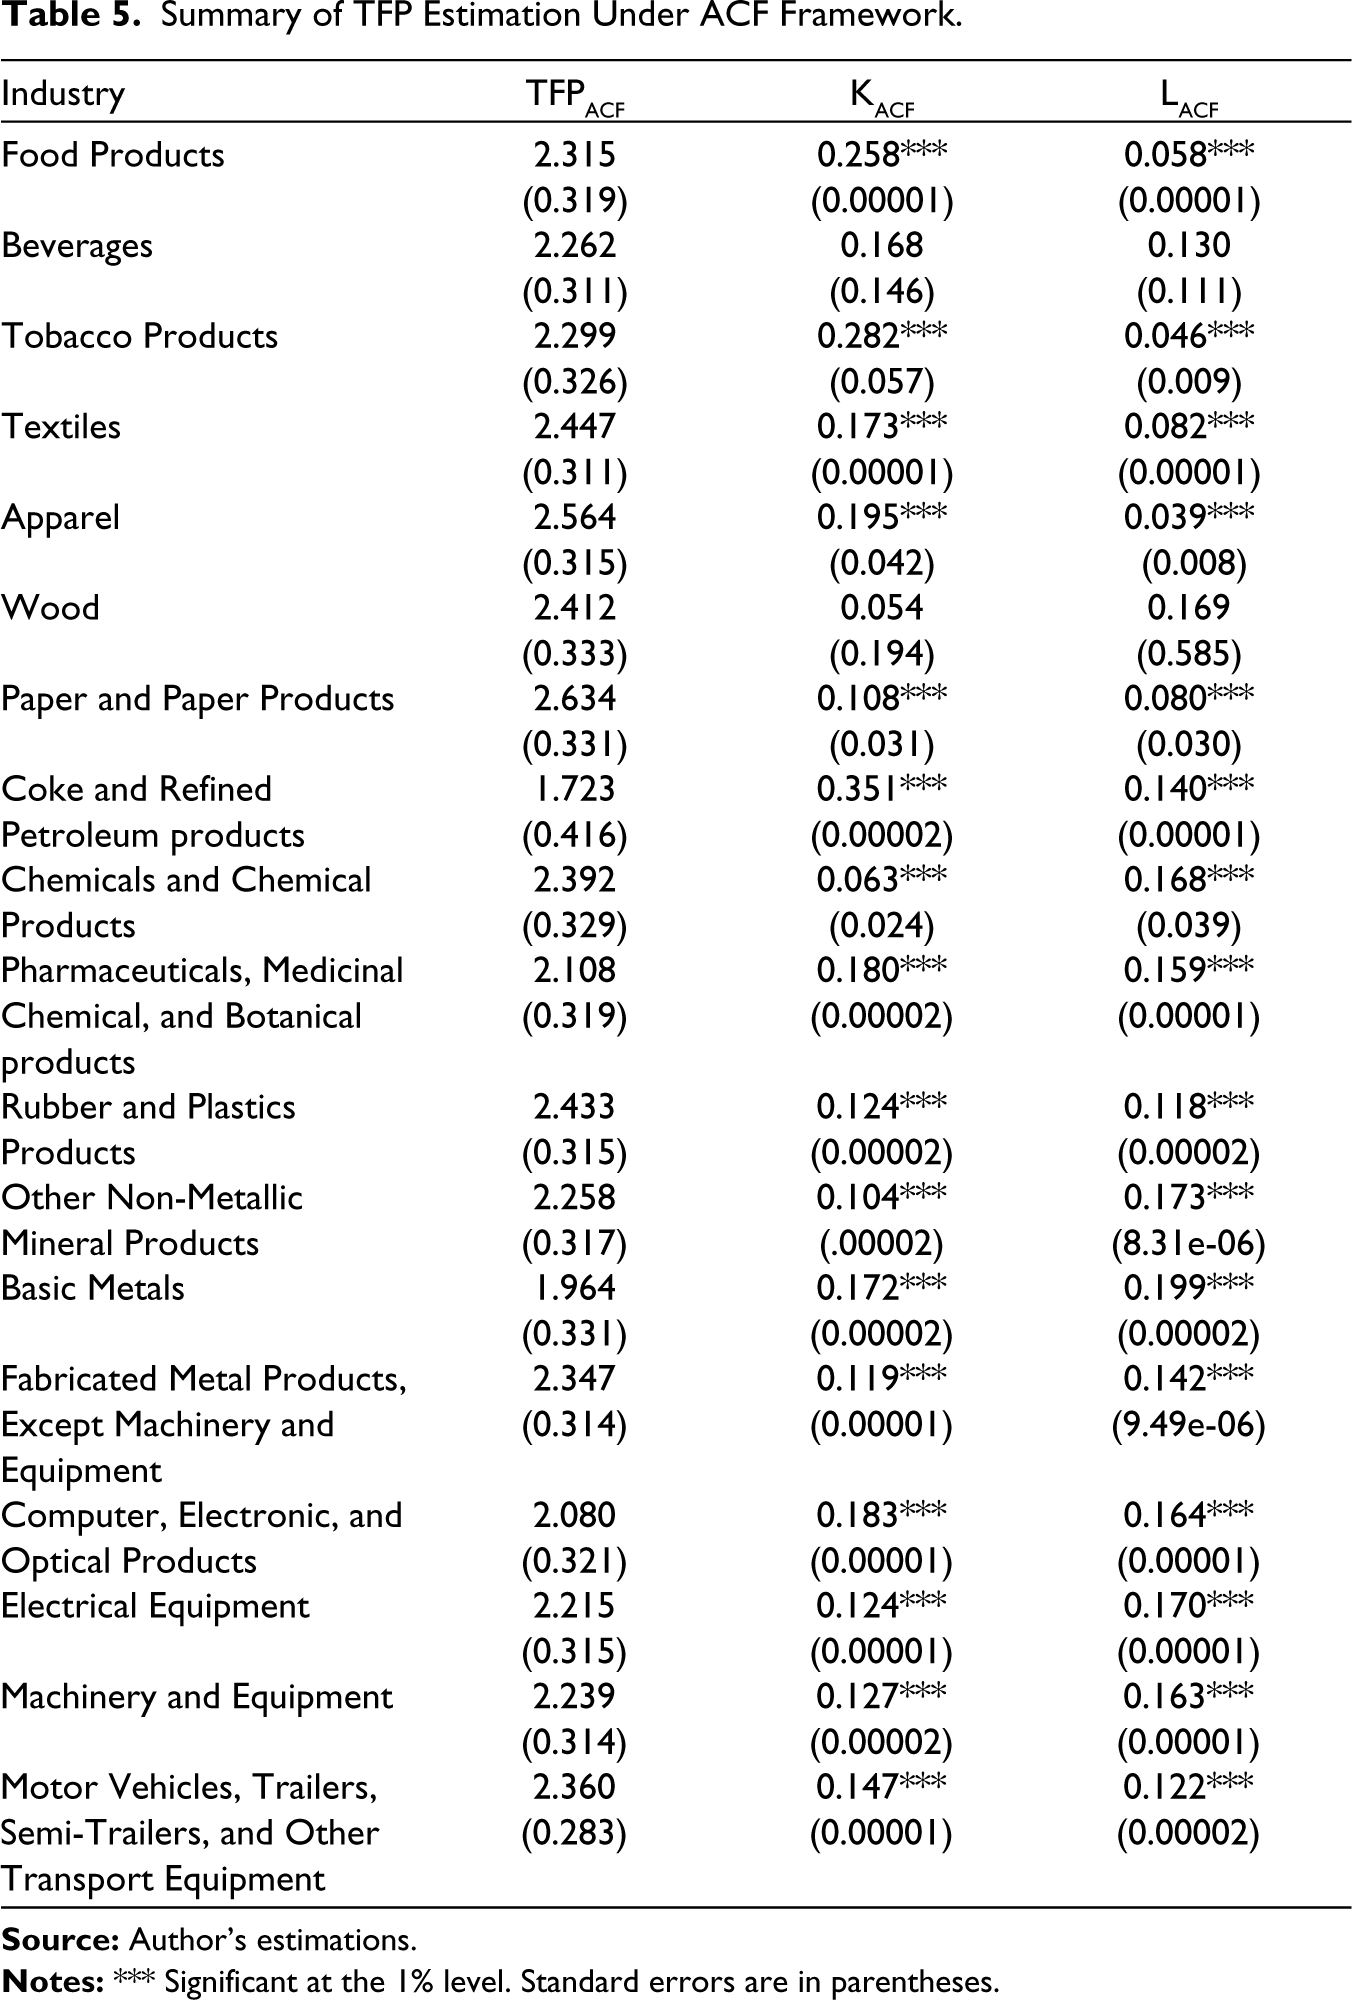
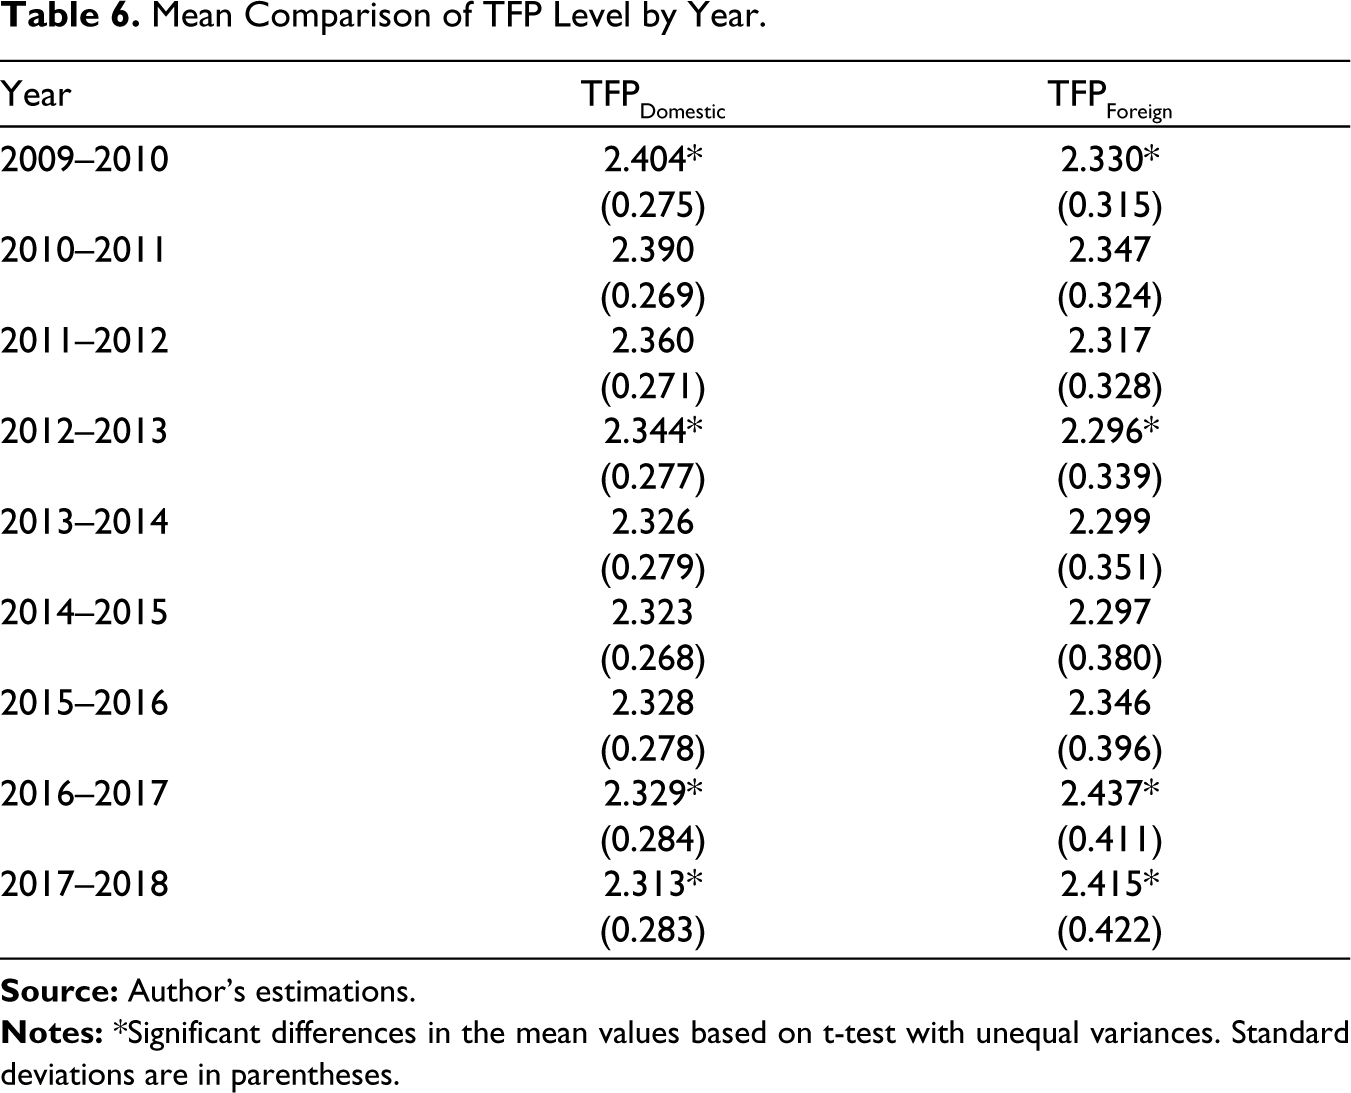
Table 6 compares the productivity of domestic firms and foreign affiliates over the period 2010–2018. Interestingly, we find that domestic firms are found to be as productive as their foreign counterparts during the initial years of the study period. However, from 2015 onwards, foreign firms are more productive than their domestic counterparts. The results show domestic firms and foreign subsidiaries record their highest productivity levels in 2009–2010 and 2016–2017, respectively.
Mean Comparison of TFP Level by Year.
Estimation of FDI Spillovers
The association between spillovers and productivity
18
is estimated using the fixed effects model, as follows:
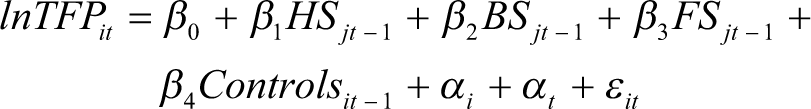
HS, BS, and FS denote horizontal, backward, and forward spillovers, respectively. As mentioned earlier, Controls stands for age, firm size, HHI, R&D, and export intensity. Meanwhile, αi and αt represent the firm and time-fixed effects. Notably, fixed effects control for unobserved heterogeneity, which might affect the level of FDI. This can be explained by considering, for instance, productivity levels that vary across firms and industries. Hence, including firm and time-fixed effects reduces the potential problem of omitting unobservable variables, which might influence the relation between FDI inflows and the level of productivity. More specifically, fixed effects are deployed to remove firm-specific, industry, and regional fixed effects, such as heterogeneous long-term strategies of firms and differences in the regional infrastructure and/or technological opportunity of sectors (Marin & Sasidharan, 2010).
Next, we consider a one-year lag in FDI spillover variables to address any potential endogeneity/identification problems arising out of the cherry-picking behavior of multinationals, as pointed out by Aitken and Harrison (1999). Furthermore, by introducing Controls, we intend to minimize other possible biases in the estimators arising from the exclusion of critical unobservables that change across firms and over time (such as the managerial abilities of domestic firms).
Empirical Results
FDI Spillover Effects on Firms’ Productivity
The estimation results obtained from Equation (7) are presented in Table 7, where a positive and significant effect of backward spillover is identified. Columns (1)–(3) of Table 7 consider the spillover variables without any controls. The findings highlight that both the FDI channels significantly affect firm-level productivity in the absence of control variables, wherein vertical FDI and negative horizontal FDI are significant at the 1% and 5% levels, respectively. The negative effect of horizontal spillover proves that MNEs belonging to the same industry strongly safeguard their technology, posing tough competition to their domestic counterparts. In other words, since domestic firms are unable to adopt new methods to upgrade themselves, they are not sufficiently competitive in the same industries. However, on extending the baseline specification after controlling for firm size, the significance of negative intra-industry linkage is found to be insignificant.
FDI Spillovers in Indian Manufacturing.
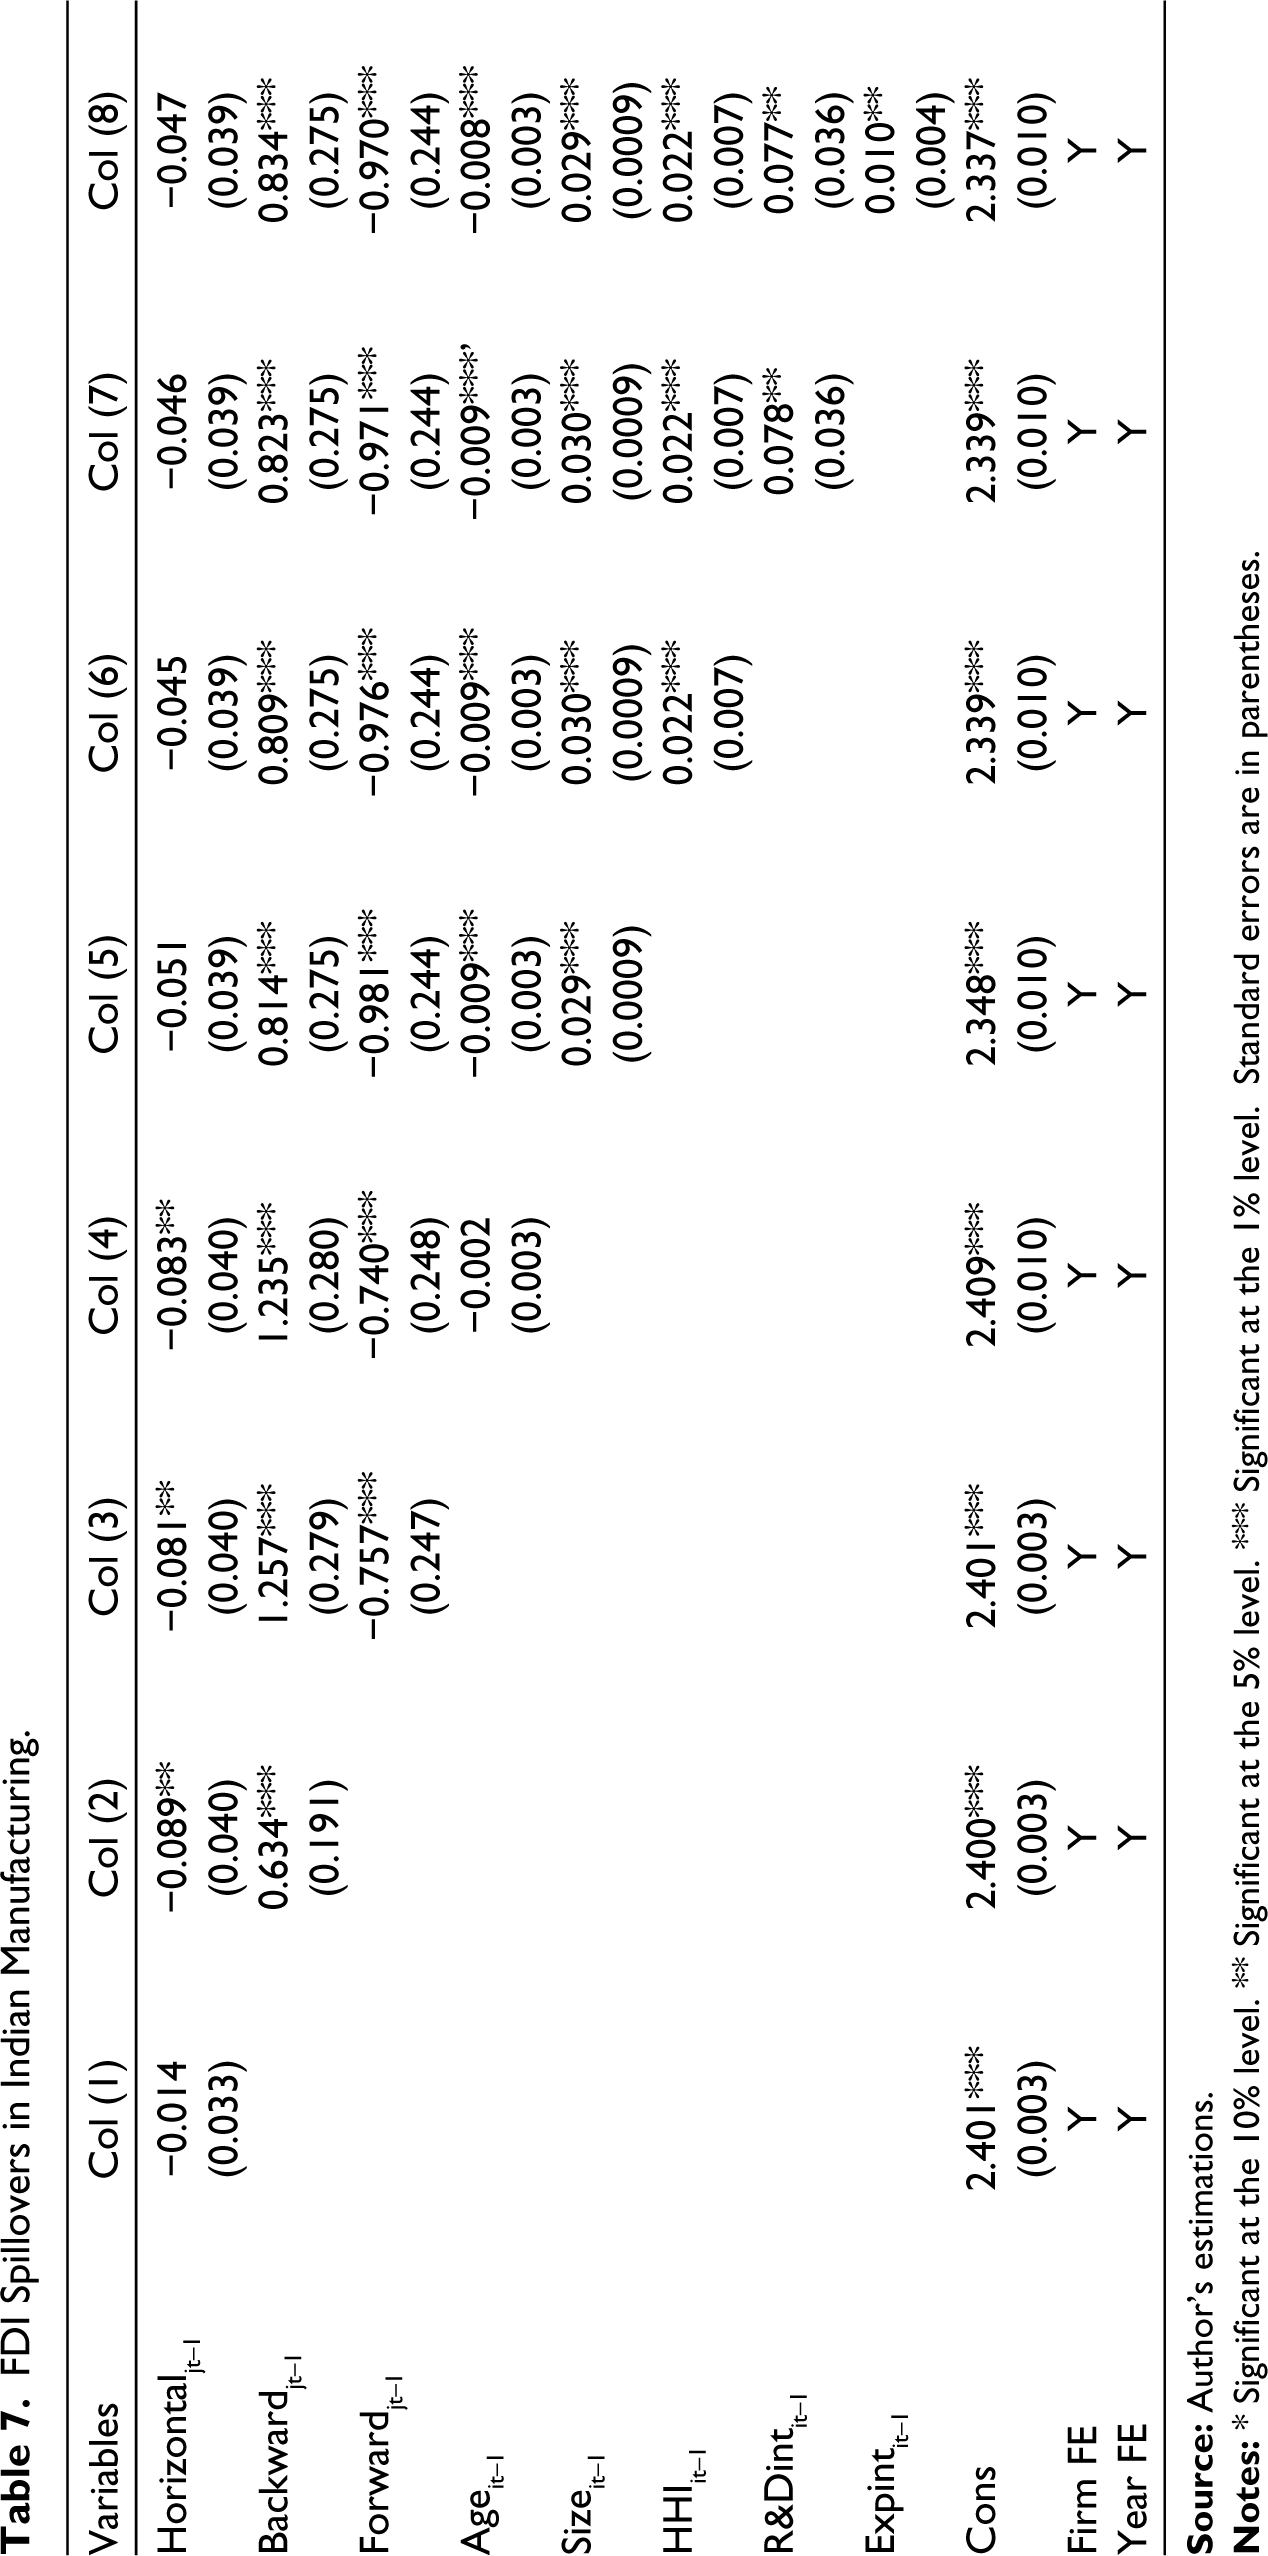
Columns (4)–(6) capture the variations in the spillover process in the presence of control variables. Column (4) shows that controlling for the age of the firm does not lead to any change in the baseline model. In contrast, controlling for firm size leads to insignificant negative horizontal FDI. These results indicate that introducing controls reduces the magnitude of spillover variables while the signs remain unchanged. Furthermore, considering R&D and export intensity as the controls, the results remain the same. Column (8) denotes the results obtained on including all control variables. Overall, our analysis suggests that MNE activities in the downstream sector generate positive spillover benefits for the host country’s firms.
Conversely, the forward spillover effect is found to be negative and significant. This means that intermediate goods supplied by MNEs do not benefit their domestic customers. The negative impact of horizontal spillovers implies the presence of a technology gap between domestic and foreign firms, which makes domestic firms unfit for competition. On a similar line, if a significant technology gap exists, domestic firms might be unable to add value to the highly sophisticated intermediate goods. This is because more productive firms are better able to adopt foreign inputs into their production process and are thus at less of a disadvantage from the presence of MNEs (Carluccio & Fally, 2013). Another explanation, supported by Eck and Huber (2016), could be that more sophisticated inputs are already available to Indian firms through imports. As Goldberg et al. (2009) find, from 1991 onwards, post-liberalisation spurs the import of higher quality inputs and, in turn, the production of higher quality outputs.
Interestingly, the current study identifies a significant positive result in the case of backward spillover, showing that a one standard deviation increase in the presence of downstream MNEs increases the average productivity level of a domestic firm by 2.8%. Therefore, we can argue that the incentive for MNEs to obtain sophisticated intermediate inputs from their upstream suppliers plays a dominant role in the spillover process. This also signifies that domestic suppliers of intermediate goods stand to gain from the expertise of downstream MNEs.
As for the controls, we find highly significant effects of Age, Firm Size, and HHI (competition effect). The negative coefficient of Age confirms that younger firms have a higher productivity level. In contrast, expectedly, the sign for Size is positive, indicating that a 1% increase in firm size leads, on average, to a 3% rise in productivity. Similarly, the effects of R&D and Export Intensity are found to be positive and significant at the 5% level. Additionally, a positive and significant HHI coefficient indicates that high concentration among firms in the Indian manufacturing industry increases firm productivity.
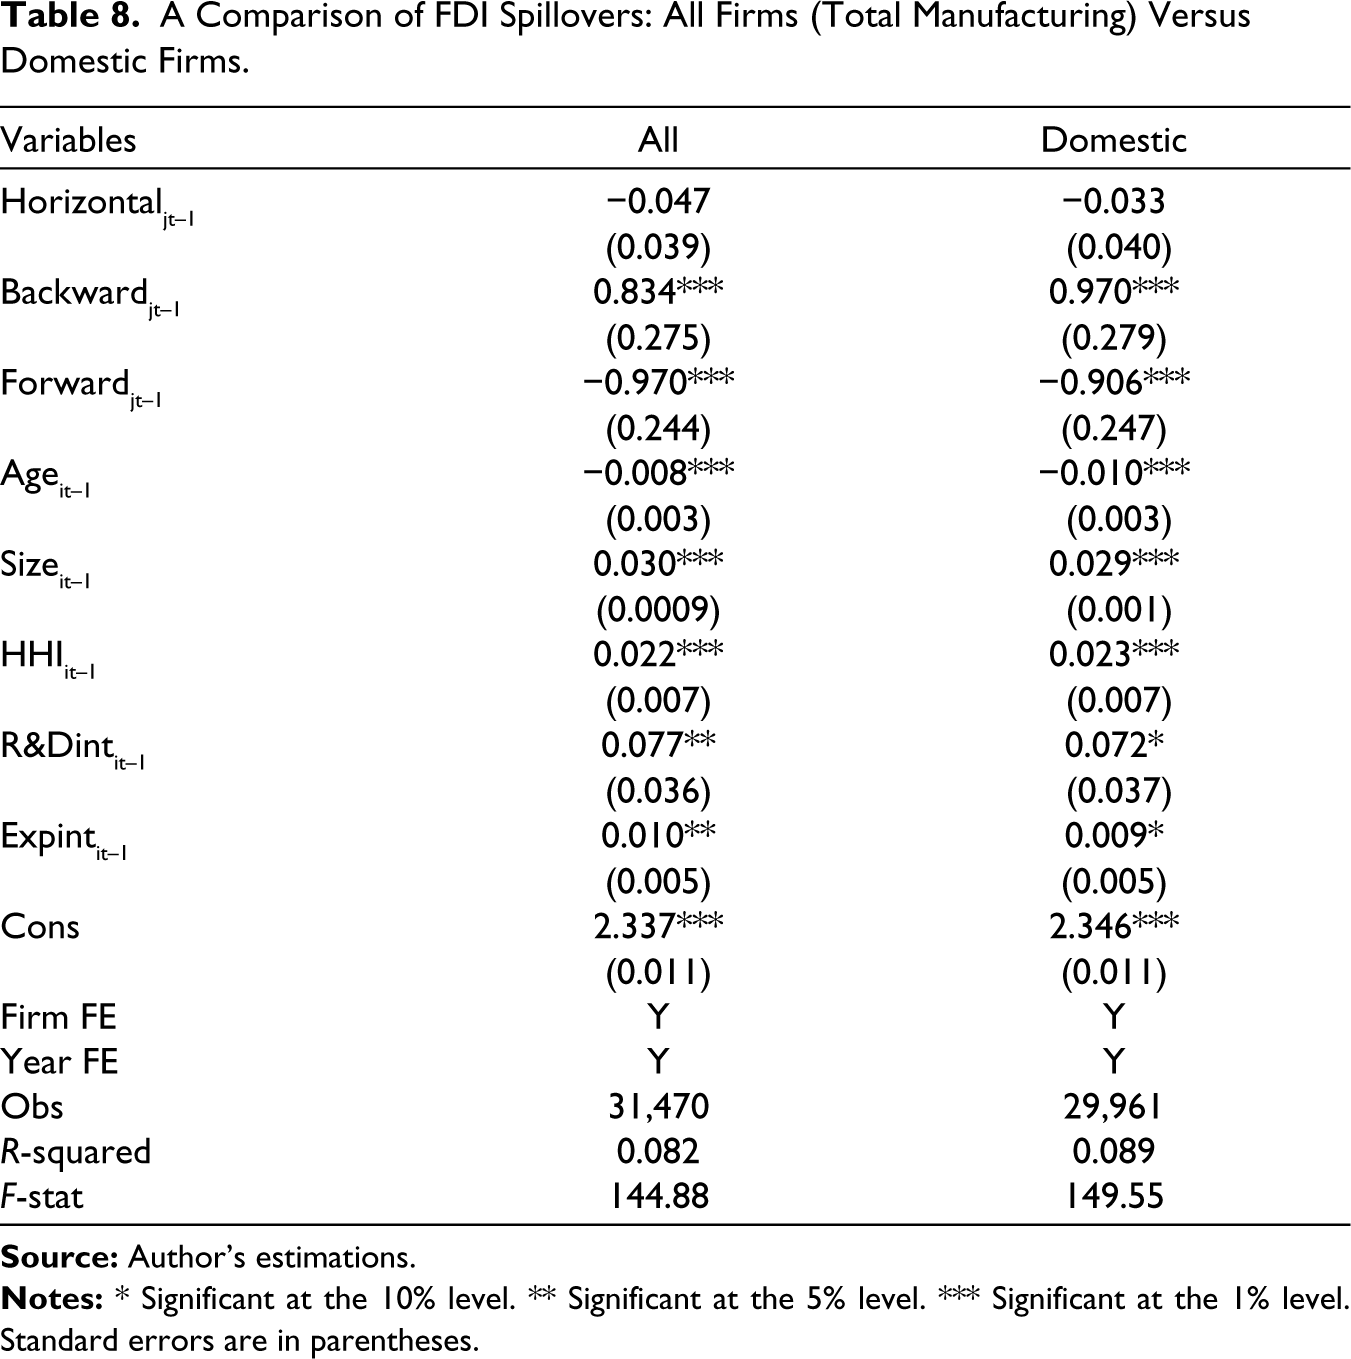
A comparison of the results for domestic and total manufacturing, present in Table 8, shows that the effects of FDI spillover are very similar. This supports our argument that domestic firms actively participate in the spillover process.
A Comparison of FDI Spillovers: All Firms (Total Manufacturing) Versus Domestic Firms.
Does Industry Heterogeneity Matter?
Assuming that the activities of foreign firms vary across the manufacturing industry, this study further examines their spillover impacts under two heads—the high-tech (high and medium-high-tech) sector and the low-tech (low and medium-low-tech) sector, respectively. Table 9 presents the results of this investigation. While backward spillover is found to be positive and significant only for medium-high-tech industries, the forward channel is significantly negative for the medium-high and medium-low-tech sectors. This denotes that the presence of foreign firms leads to a decrease in the productivity of these industries, indicating that MNEs are successful in restricting their knowledge and technical skills. Interestingly, our results show a significant positive effect of horizontal FDI for low and medium-low manufacturing, reflecting the potential of these industries to gain from the presence of foreign firms within the same industry. Moreover, among the controls, Firm Size is significant across all sectors.
FDI Spillovers Based on Technology Intensity.
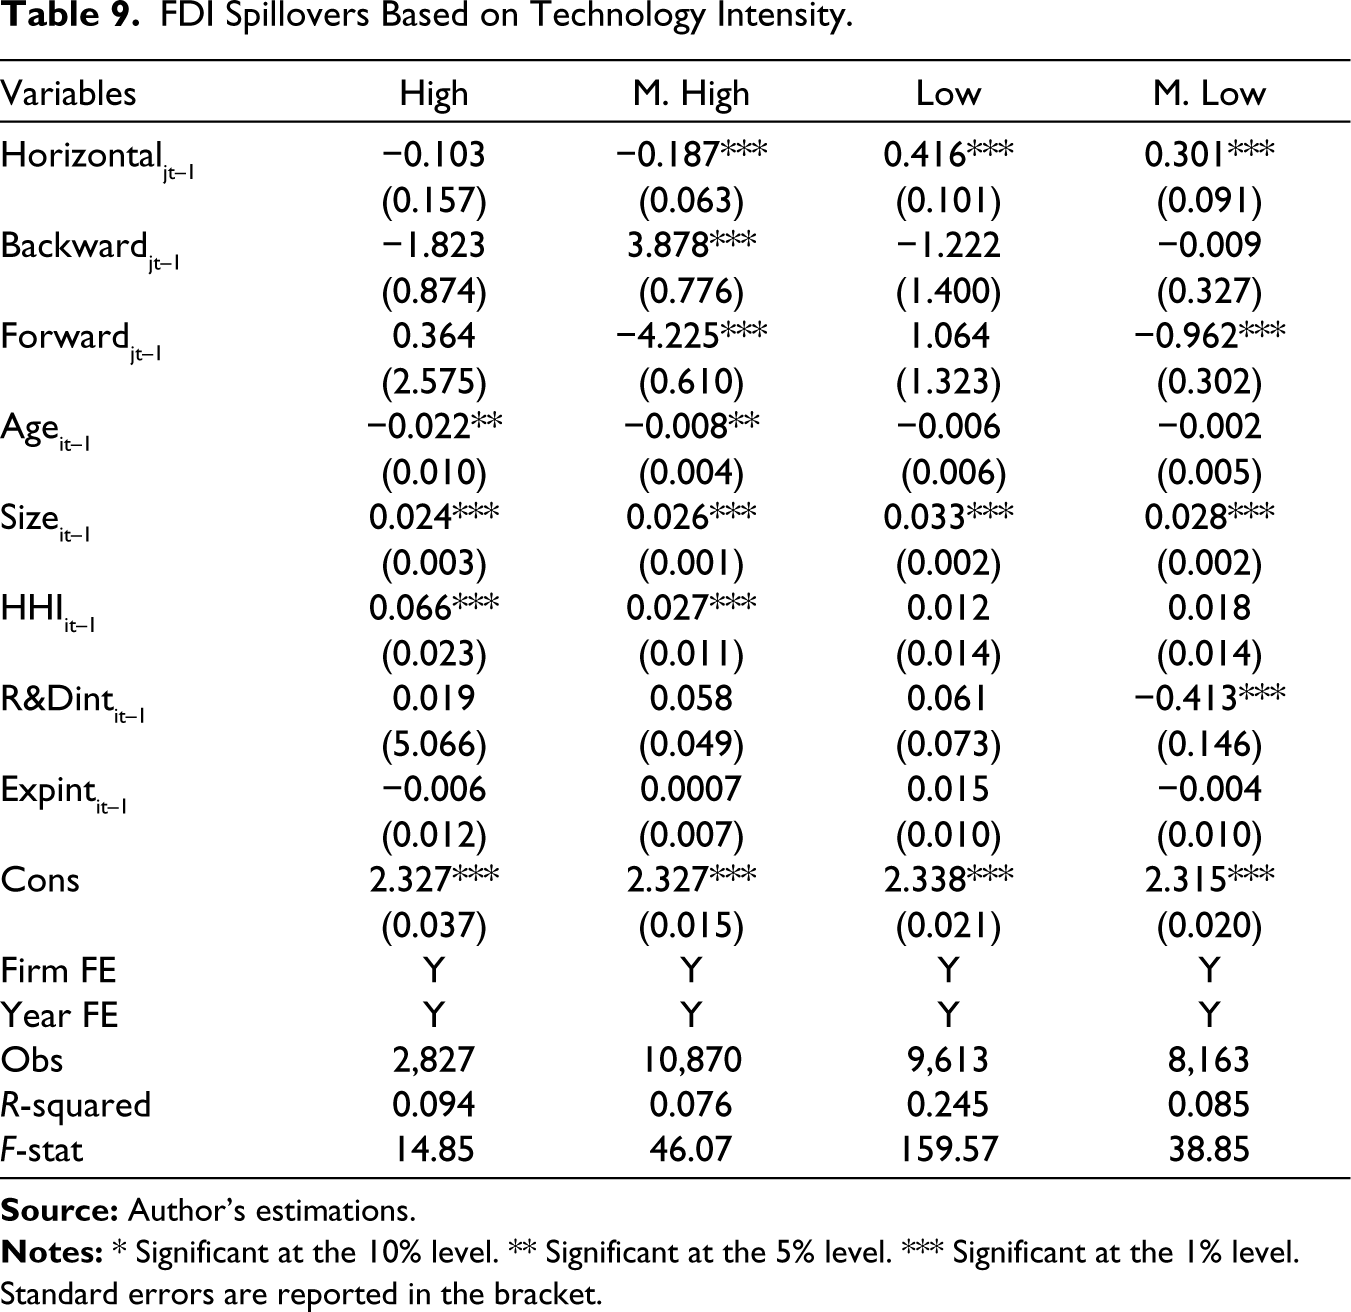
Standard errors are reported in the bracket.
In summary, we identify the presence of a positive backward spillover in the Indian manufacturing sector. Our results are striking while taking into account the sectoral heterogeneity. Only the medium-high-tech industry benefits from downstream FDI, while FDI in the same sector (horizontal FDI) positively contributes to the productivity of domestic firms in the low-tech and medium-low-tech sectors. Moreover, negative forward externalities from MNEs reduce domestic productivity levels for medium-high and medium-low-tech industries.
Robustness Check
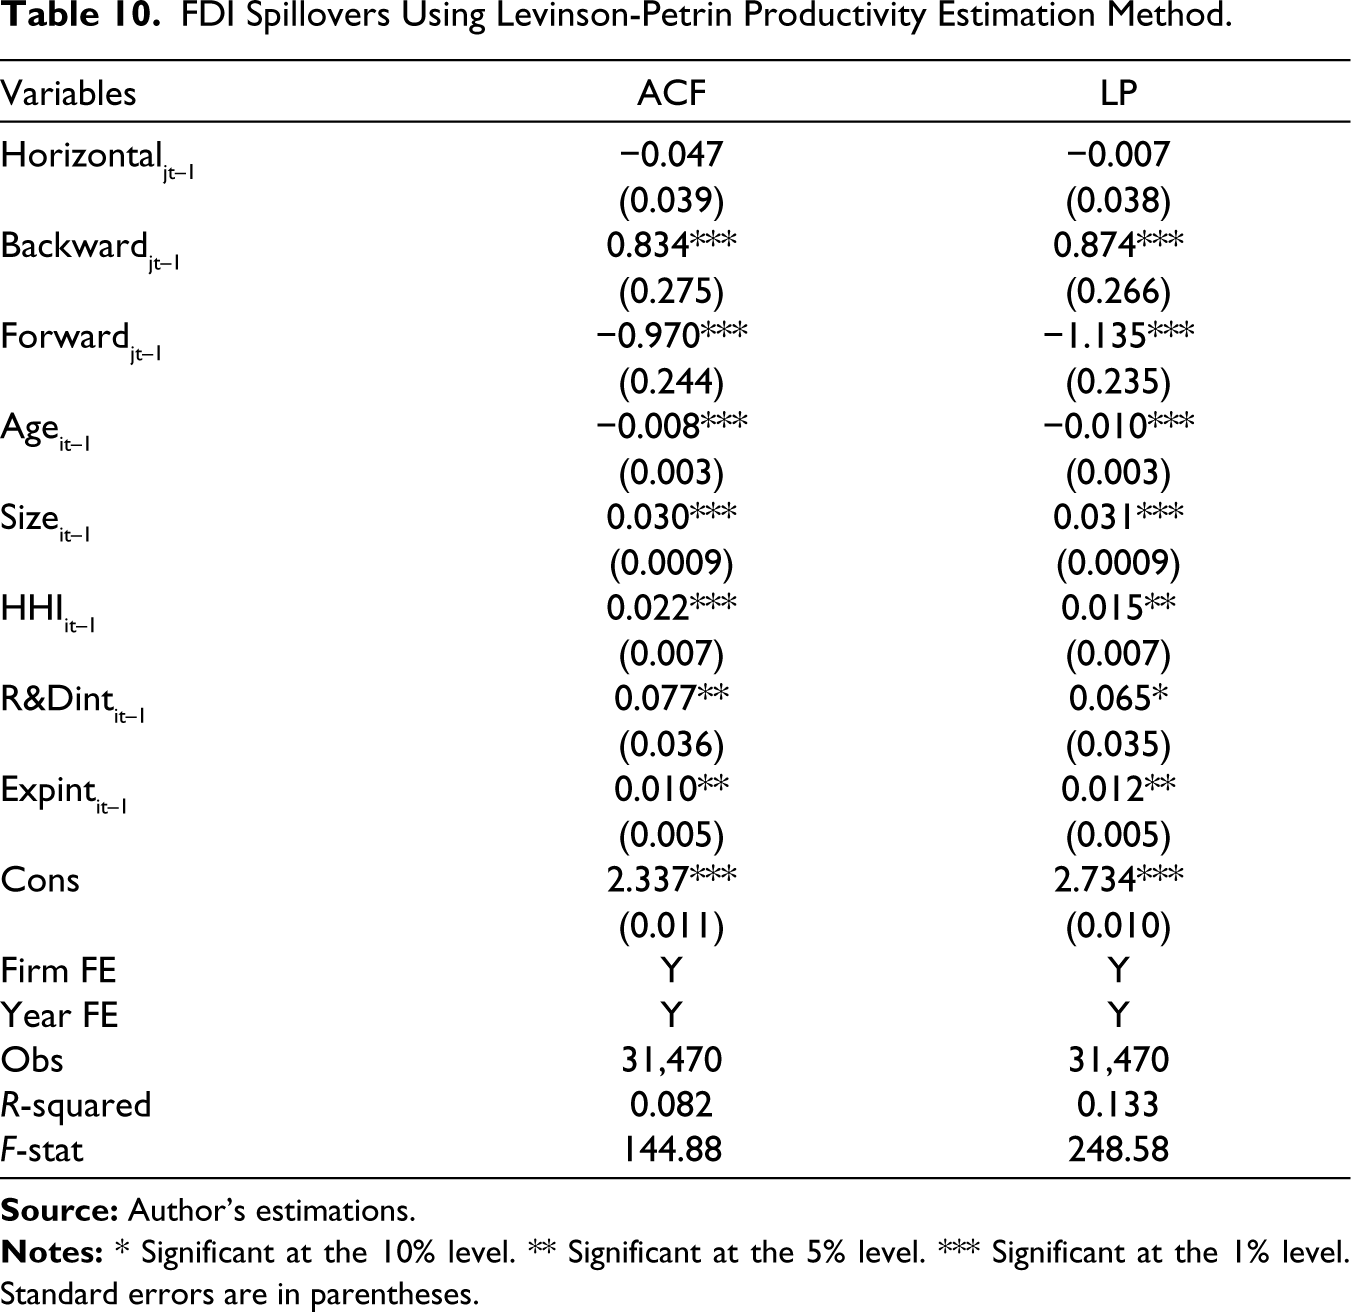
To further verify the robustness of our results, we conduct fixed estimations using the TFP estimates obtained from the L-P method. As noted in Table 10, the L-P estimator also produces similar results as earlier. To check for possible endogeneity issues arising from R&D and export intensities, we have carried out the estimation dropping for R&Dint and EXPint (Column 6, Table 7). The results remain unchanged.
FDI Spillovers Using Levinson-Petrin Productivity Estimation Method.
Conclusion
This study examines the spillover effects of FDI in the Indian manufacturing sector over the period 2009–2010 to 2017–2018. We identify a significant positive spillover effect resulting from backward linkage, indicating that domestic suppliers benefit the most in contact with foreign customers. This result confirms that downstream firms are more incentivized to transfer their knowledge and technologies to upstream suppliers than to their rivals in the same industry. Furthermore, the industry-wise analysis shows no consistent trend among the different kinds of spillover effects, which vary due to their heterogeneous characteristics. More specifically, the most significant finding of this article highlights the role of sectoral heterogeneity in the spillover process. The results show a positive backward linkage in medium-high-tech firms, suggesting that government policies should aim to encourage MNEs to downstream manufacturing. In contrast, for low- and medium-low-tech industries, the presence of MNEs in the same sector should be encouraged. However, since this study analyses the FDI spillover framework specifically in the Indian context, it is difficult to generalise its findings across countries. Hence, a cross-country level analysis could provide a better understanding of the effect of FDI spillovers on the productivity of local firms.
Supplementary Material
The supplementary material for this article is available online.
Footnotes
Acknowledgements
The author extends gratitude to Professor Subash S and Prof. Nadia Doytch for their constant support and valuable feedback. Suggestions received at various international conferences (17th EAEA International Convention, 2022 & Vietnam Symposium in International Business, 2022) are acknowledged. The author would like to thank anonymous referees and the Editors for constructive comments. Lastly, I thank Dr Ketan Reddy, Sarthak Basu and Jayati Chatterjee for their thoughtful suggestions, reading, and comments.
Compliance with Ethical Standards
The manuscript is original and has not been published, nor is it under consideration for publication elsewhere.
Declaration of Conflicting Interests
The author declared no potential conflicts of interest with respect to the research, authorship and/or publication of this article.
Funding
The author received no financial support for the research, authorship and/or publication of this article.
Notes
References
Supplementary Material
Please find the following supplemental material available below.
For Open Access articles published under a Creative Commons License, all supplemental material carries the same license as the article it is associated with.
For non-Open Access articles published, all supplemental material carries a non-exclusive license, and permission requests for re-use of supplemental material or any part of supplemental material shall be sent directly to the copyright owner as specified in the copyright notice associated with the article.