
Abstract
Although presented as essential catalysts for economic development, the actual effects of foreign direct investment on host economies sometimes remain ambiguous and context-dependent. This study examines the impact of foreign direct investment (FDI) on domestic investment within West African nations, using a panel of 14 countries over the period from 2000 to 2019. The analysis employs the autoregressive distributed lag (ARDL) model in error correction form, estimated using the pooled mean group (PMG) method. The findings suggest that, in the long term, FDI has a crowding-out effect on domestic investment in West Africa, whereas in the short term, it has a temporary leverage effect. Furthermore, the study reveals that the return to equilibrium of domestic investment, following a short-term deviation, is slow and gradual.
In light of these findings, it is recommended that the governments of the region implement safety nets to regulate incoming FDI. Additionally, ensuring that the objectives of companies receiving FDI extend beyond mere profit maximisation to include the promotion of sustainable development within the host countries is crucial.
Introduction
The upsurge in foreign capital flows on a global scale, particularly in developing countries, has prompted many authors to question the effects of foreign direct investment (FDI) on domestic investment. This is due to the economic changes that occurred during the 1980s, notably the development of financial markets and the internationalisation of capital movements. Whether in developed or developing economies, attitudes towards FDI have changed considerably, and most countries have liberalised their investment policies to attract foreign capital (Aluko et al., 2021; Ndiaye & Xu, 2016).
In West Africa, FDI flows increased from $2.075b in 2001 to $9.768b by 2020. Over the periods 2001–2010 and 2011–2020, they averaged $7.485b and $12.339b, respectively (UNCTAD, 2021). Gross fixed capital formation increased from $56.162b in 2001 to $126.794b in 2020, averaging $77.062b between 2001 and 2010 and $113.826b between 2011 and 2020. The percentage of GDP increased from 16.72% in 2001 to 23.19% in 2020 (UNCTAD, 2022). From 2015 to 2021, budget deficits in West Africa averaged 4.2% of GDP, exceeding the 3% GDP budget deficit threshold considered a key convergence criterion in the region. This budget deficit in West Africa even increased to 5.5% of GDP in 2022, while it decreased in the four other regions of Africa (AfDB, 2024). These statistics reflect the inadequacy of investment in enabling development, a significant part of which may result from FDI decisions. The latter refers to capital flows whose purpose for the investing firm is to create or expand a subsidiary in a foreign country.
At the theoretical level, the so-called ‘eclectic’ approach developed by Dunning (1988, 2001), the first to develop an economic explanation for FDI, has been one of the theoretical frameworks used as a basis for most studies. Drawing on the theory of industrial organisation, he showed that investors seek three types of advantages (ownership, location and internalisation) through their decision to relocate or settle in another country. Thus, firms relocate their production to exploit specific advantages that may be managerial, technological, financial, commercial or market advantages.
While a handful of studies have examined the effect of FDI on domestic investment in Sub-Saharan Africa, including a few West African countries, only the studies by Ereghan (2012) and Yao and Drama (2019), to the best of our knowledge, have used West Africa as a specific case. Ereghan (2012), in his investigation of the dynamic linkages between FDI and domestic investment in 10 ECOWAS countries, reported that FDI crowds out domestic investment. Yao and Drama (2019) reached the same result for seven WAEMU countries. In contrast, other studies (Jude, 2019) found that FDI inflows stimulated domestic investment. In our knowledge, these studies have not taken into account certain key factors such as financial development, debt servicing and export diversification, which are crucial variables in explaining FDI in such a context. However, FDI flows are generally associated with reduced credit constraints, especially in low-income countries, debt reduction and the integration of host economies into global value chains. Diversification requires investment in new sectors, skill development and the creation of sustainable jobs. Unlike trade openness, export diversification goes beyond measuring trade intensity to capture the qualitative aspect of trade, particularly its structure and potential for transformation and value creation. Furthermore, trade openness can mask vulnerabilities to external shocks if it is concentrated on exports of a few products. This is even more justified when we consider that all countries in the region were considered dependent on primary products (UNCTAD, 2022), which can make them vulnerable to external shocks. Furthermore, the development of value chains promoted by the African Continental Free Trade Area (AfCFTA) is an opportunity for these countries. If FDI crowds out domestic investment, efforts to attract FDI in recent years to fill the investment gap could undermine development objectives. Understanding the effects of FDI on domestic investment is a source of concern. Therefore, this research asks the following question: What is the effect of FDI on domestic investment in West African countries?
This study examines the effect of FDI on domestic investment in West African countries. To answer this question, we assume that FDI has a leverage effect on domestic investments in West Africa.
This study differs from others in three ways. First, it contributes to the literature by adopting a novel approach. Indeed, in the analysis, we include the effects of FDI in West African countries as additional determinants of domestic investment, such as financial development, export diversification and debt service. Second, we focus on West African countries with a particular interest in the issue of domestic capital formation. This would promote a better understanding of the effects of FDI on domestic investment, allowing for a clearer understanding of why some areas fail to take advantage of FDI, whereas others succeed. Third, the autoregressive distributed lag model, which is better suited for examining the effects of FDI on domestic investment, was used.
The remainder of this article is organised as follows. The second section presents a literature review of FDI and domestic investment. The third section presents the methodology and data sources used in the study. The fourth section reports the main results and discussion, and the fifth section presents the conclusion and policy implications.
Literature Review
The analysis of the effect of FDI on domestic investment has animated the debate on both theoretical and empirical levels. Thus, several theories have provided elements of answers to the evolution of FDI, and this differs according to the schools of thought and the approach. Before Hymer (1960) proposed a new vision in 1960, the analysis of capital movements was part of the classical financial theory. Pioneering works such as Keynes’s liquidity theory (1936), the theory of international interest rate differentials and the portfolio theory of Markowitz (1959) and Tobin (1958) viewed these capital flows as the result of arbitrage or decisions aimed at maximising investors’ returns and utility. As a result, FDI obeys the logic of seeking higher returns and plays an undeniable role in the search for an optimal decision in the sense that it allows a firm to mitigate its risks owing to a large diversification of its assets.
Moreover, the theoretical work of Chenery and Strout (1966) and Barro et al. (1992) argued that, in general, foreign capital inflows could increase the rate of output growth by supplementing domestic savings available to finance investment and accelerating the rate of capital accumulation. In addition to the abundant literature on FDI, the absence of a theoretical framework directly linking FDI with domestic investment leads us to consider the so-called ‘eclectic’ approach or ‘OLI paradigm’ developed by Dunning (1977, 1988, 2001). It is an ideal framework for understanding the effects of multinational firms (MNFs) through FDI in this research because it proposes an economic explanation of FDI and integrates several theories, notably the theories of industrial organisation (Caves, 1971; Hymer, 1976) and international trade. In addition, FDI is considered to be the result of a combination of elements such as: specific so-called property advantages (imperfect competition), advantages linked to location (comparative advantages) or advantages linked to internationalisation (internalisation of transaction costs) (Dunning, 1988). These elements include both factors internal to the firm (country) and exogenous factors related to the situation of the host countries. Firms relocate their production to exploit specific advantages, which may be managerial, technological, financial, commercial or market-related.
Empirically, FDI can generate stimulus effects, crowding-out effects or neutral effects on domestic investment. Diallo et al. (2021) sought to disentangle the contradictory effects between FDI and private domestic investment with data from 40 Sub-Saharan African countries over the period 1980–2017. Using an error-correction ARDL methodology, they showed that FDI has substantial long-run crowding effects on private domestic investment. Similarly, Borensztein et al. (1998) also concluded, based on a regression on panel data for 69 developing countries in Sub-Saharan Africa and Latin America covering the period 1970–1989, that FDI has a crowding-out effect on domestic investment.
On the other hand, some opponents of FDI have argued that FDI is harmful to domestic investment (Göçer et al., 2014; Morrissey & Udomkerdmongkol, 2012). In Sub-Saharan Africa, Lahimer (2018) used the Arellano and Bond (1991) methodology applied to a panel of Sub-Saharan African countries over the period 1990–2005 to analyse the effects of FDI on domestic investment. He found that FDI has short- and long-term crowding-out effects on domestic investment even when countries are distinguished according to their export specialisations.
Particularly in West Africa, Yao and Drama (2019) analysed the effect of FDI on domestic private investment for seven Francophone ECOWAS countries. By adopting Blundell and Bond’s (1998) generalised method of moments system (GMM-Sys), they found that FDI crowds out domestic private investment. Moreover, using the World Bank’s good governance indicators, they showed that the crowding-out effect is greater in countries with good governance in terms of political stability and control of corruption.
Similarly, Ereghan (2012) examined the crowding-out effect of FDI on domestic investment in West Africa. Using a cointegration technique and panel data from 10 ECOWAS countries for the period 1970–2008, he also concluded that FDI inflows crowd out domestic investment in the region. In his study, he used marginal capital output, FDI, the real GDP growth rate, trade openness and the real exchange rate.
Finally, some authors (Agosin & Machado, 2005; Sağlam & Yalta, 2011; Wang, 2010) have found in their investigations on the effects of FDI that there is no link with domestic investment. This research is based on the hypothesis that FDI has a positive knock-on effect on the formation and level of domestic investment.
Overall, in the West African region, firms that invest generally have either better market access or more advanced technology than local firms. Therefore, setting up a region allows them to benefit more from internalisations linked to market imperfections. In addition, West Africa offers a large market, cheap labour, abundant natural resources, and tax and legal incentives (investment codes), which constitute the substantial advantages of relocation. Finally, to the best of our knowledge, the work on West Africa has not taken into account financial development, debt servicing or export diversification, which are crucial variables in explaining FDI in this region.
Data Sources and Methodology
Data Sources
The data used in this study come from the UNCTAD statistics database of the United Nations Conference on Trade and Development (UNCTAD, 2020), the socio-economic database of the African Development Bank Group (AfDB, 2020) and the World Development Indicators (WDI, 2020) of the World Bank. This study focuses on a panel of 14 West African countries, including Benin, Burkina Faso, Côte d’Ivoire, Gambia, Ghana, Guinea, Guinea-Bissau, Liberia, Mali, Niger, Nigeria, Senegal, Sierra Leone and Togo, and covers the period from 2000 to 2019. The sample selection is based on the availability of the data for each variable. The definitions and measurements of the variables used in the model, including domestic investment, FDI, financial development, debt services, domestic saving, gross domestic product, inflation, export diversification and exchange rate, are presented in Appendix A.
Model Specification
This study uses the theoretical model developed by Agosin and Machado (2005) to analyse the impact of FDI. Domestic investment (Id, t) is represented as a process of adjustment towards a desired capital stock, influenced by growth expectations (Ge) and the output gap (y), while incorporating the influence of real foreign investment (fdi) via current and past FDI flows (Appendix B). Considering the liquidity constraints related to financing in developing countries and adaptive expectations, the authors arrive at the following final theoretical model:

Where
Thus, following Farla et al. (2016) and Lahimer (2018), we derive the following empirical equations:

where DI represents domestic investment, FDI represents foreign direct investment, FD represents financial development, DS represents domestic savings, RGDP represents economic growth, INF represents inflation, DSX represents debt service, DIV represents diversification of exports, ER represents exchange rate, α1 represents the error-correction term, μi represents the country-specific effect, t represents the time and εi, t represents the error term. To determine the behavioural relationship (short- and long-run effects) between FDI and domestic investment and to correct for likely endogeneity, the specification of the above model takes the ARDL (p, q1, q2, …, qk)
1
form of Pesaran and Shin (1999). The equation to be estimated becomes:

where X is a set of independent variables; φi is the speed of adjustment (φi < 0); α and δ are the short-term coefficients of the lagged dependent variable and the independent variables, respectively; β represents the long-term coefficients; and p and q are the optimal lags. The identification of the crowding-out and/or stimulus effect is done by interpreting the estimated short- and long-run coefficients of FDI. A positive and statistically significant coefficient of FDI indicates a leverage effect depending on the time horizon, whereas a negative and statistically significant coefficient indicates a crowding-out effect of domestic investment by FDI. The neutral effect is materialised by the absence of the statistical significance of FDI.
Estimation Technique
The estimation method adopted in this study is the autoregressive distributed lag (ARDL) panel approach. This estimation method includes three estimators, including the pooled mean group (PMG), the mean group (MG) and the dynamic fixed effect (DFE), which were proposed by Pesaran and Smith (1995) and Pesaran et al. (1999). These three estimators were implemented to choose the most appropriate estimation method. According to Pesaran and Shin (1999), panel ARDL is applicable only when the variables under study are integrated of order I(1), I(0) or a mixture of both. Additionally, this approach requires the existence of a long-run relationship and serially uncorrelated residuals. The PMG method has the advantage of addressing the problem of heterogeneity by allowing the short-run coefficients and error variables to differ across countries but assuming the homogeneity of the long-run coefficient by grouping countries in the long run (Pesaran et al., 1999). In addition, it gives consistent coefficients despite the possible presence of endogeneity because it includes lags of the dependent and independent variables.
Results and Discussion
Descriptive Statistics and Correlation Analysis of Data
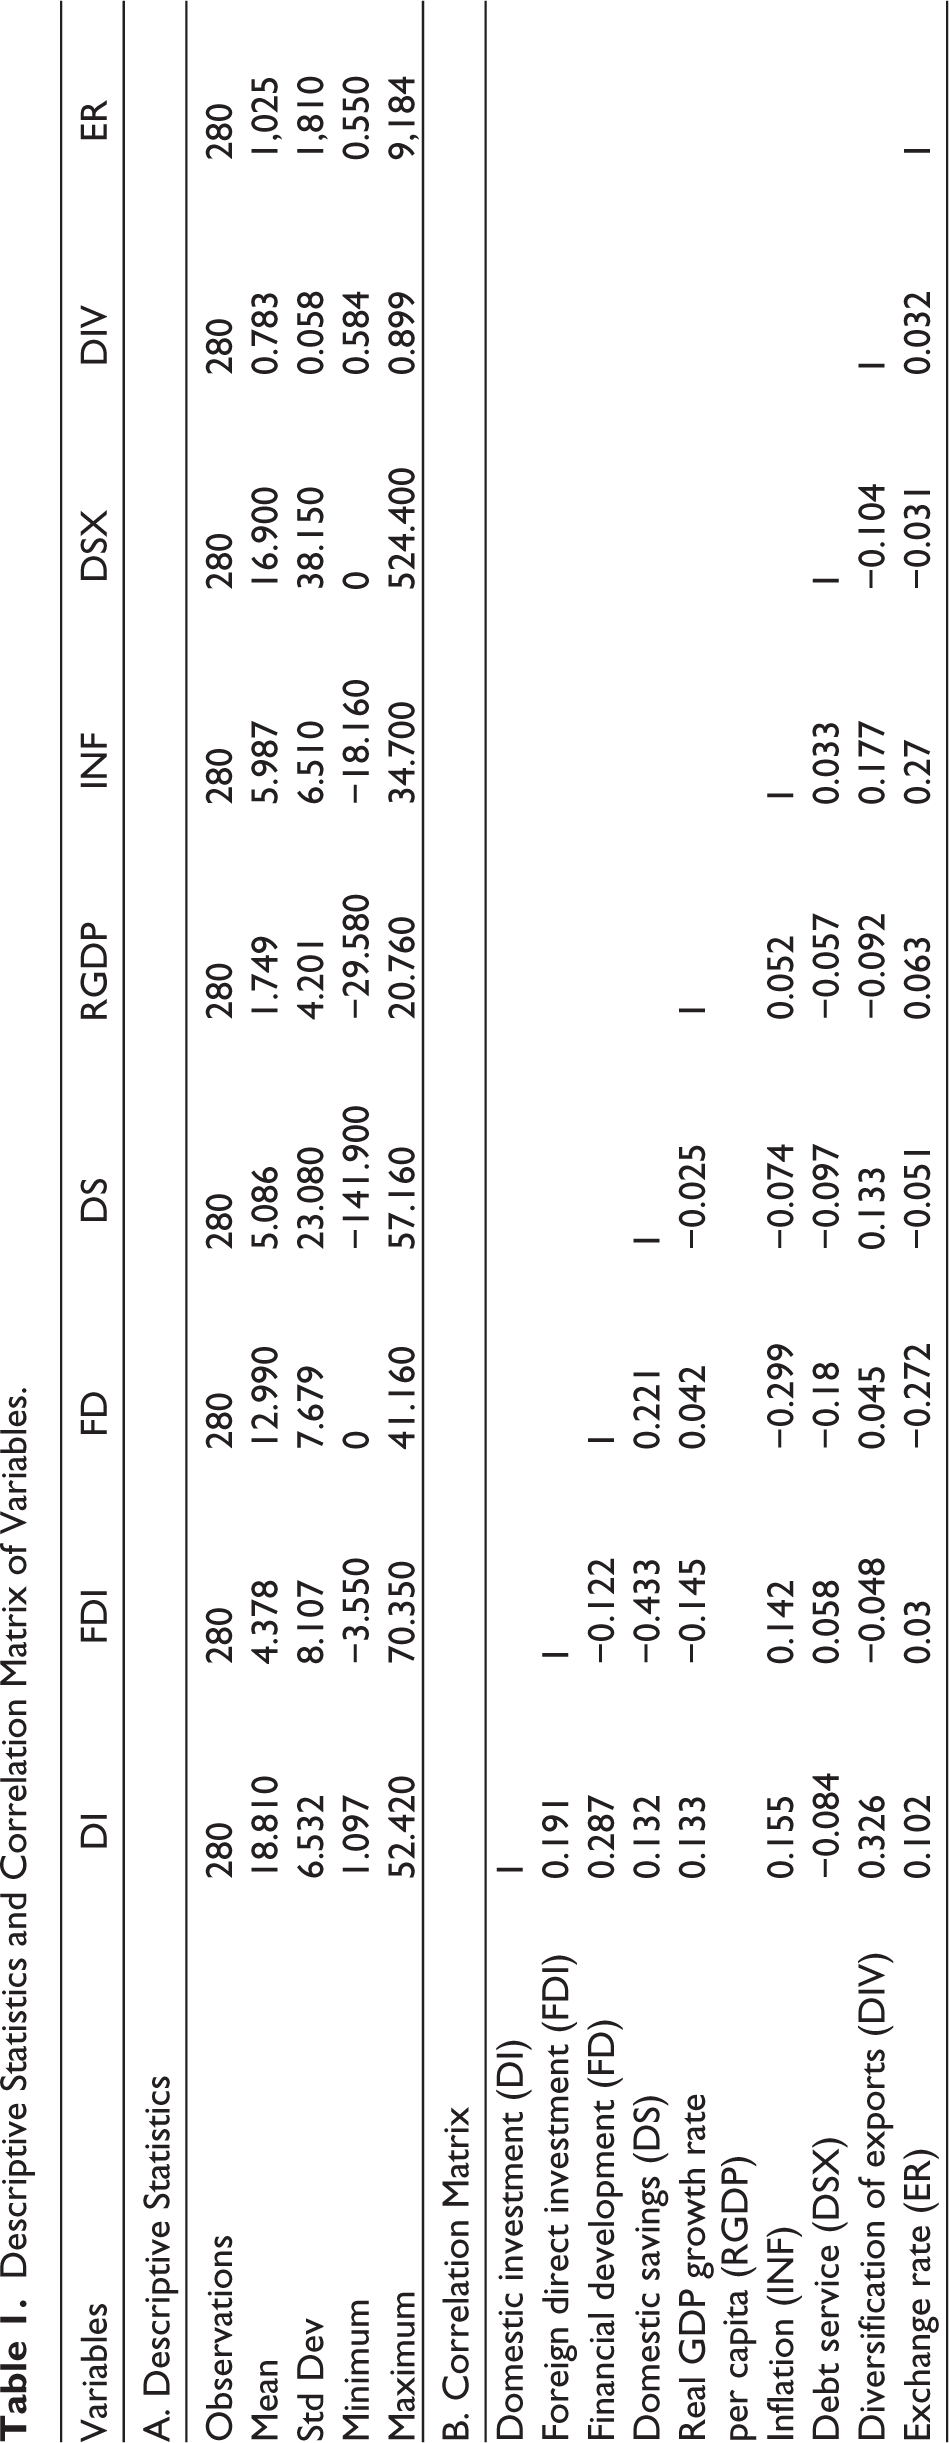
Table 1 presents a summary of the descriptive statistics and the correlation matrix. Overall, the descriptive statistics show that on average, domestic investment is increasing by 18.809 per year, with a small standard deviation of 6.532. The average levels of FDI and financial development are 4.378 and 12.898, respectively, with standard deviations of 8.106 and 7.67. The debt service, domestic savings and exchange rate variables are the most volatile in the sample, with standard deviations of 38.155, 23.085 and 1,809.961, respectively. The variables with the smallest deviations from their mean are export diversification (a standard deviation of 0.058 for a mean of 0.783), real GDP growth rate/head (a standard deviation of 4.20 for a mean of 1.749), and inflation (a standard deviation of 6.51 for a mean of 5.987). The sample also includes extreme values. The lowest value is recorded for domestic savings (−141.973), whereas the exchange rate reaches the highest level (9,183.876).
Descriptive Statistics and Correlation Matrix of Variables.
Unit Root Test
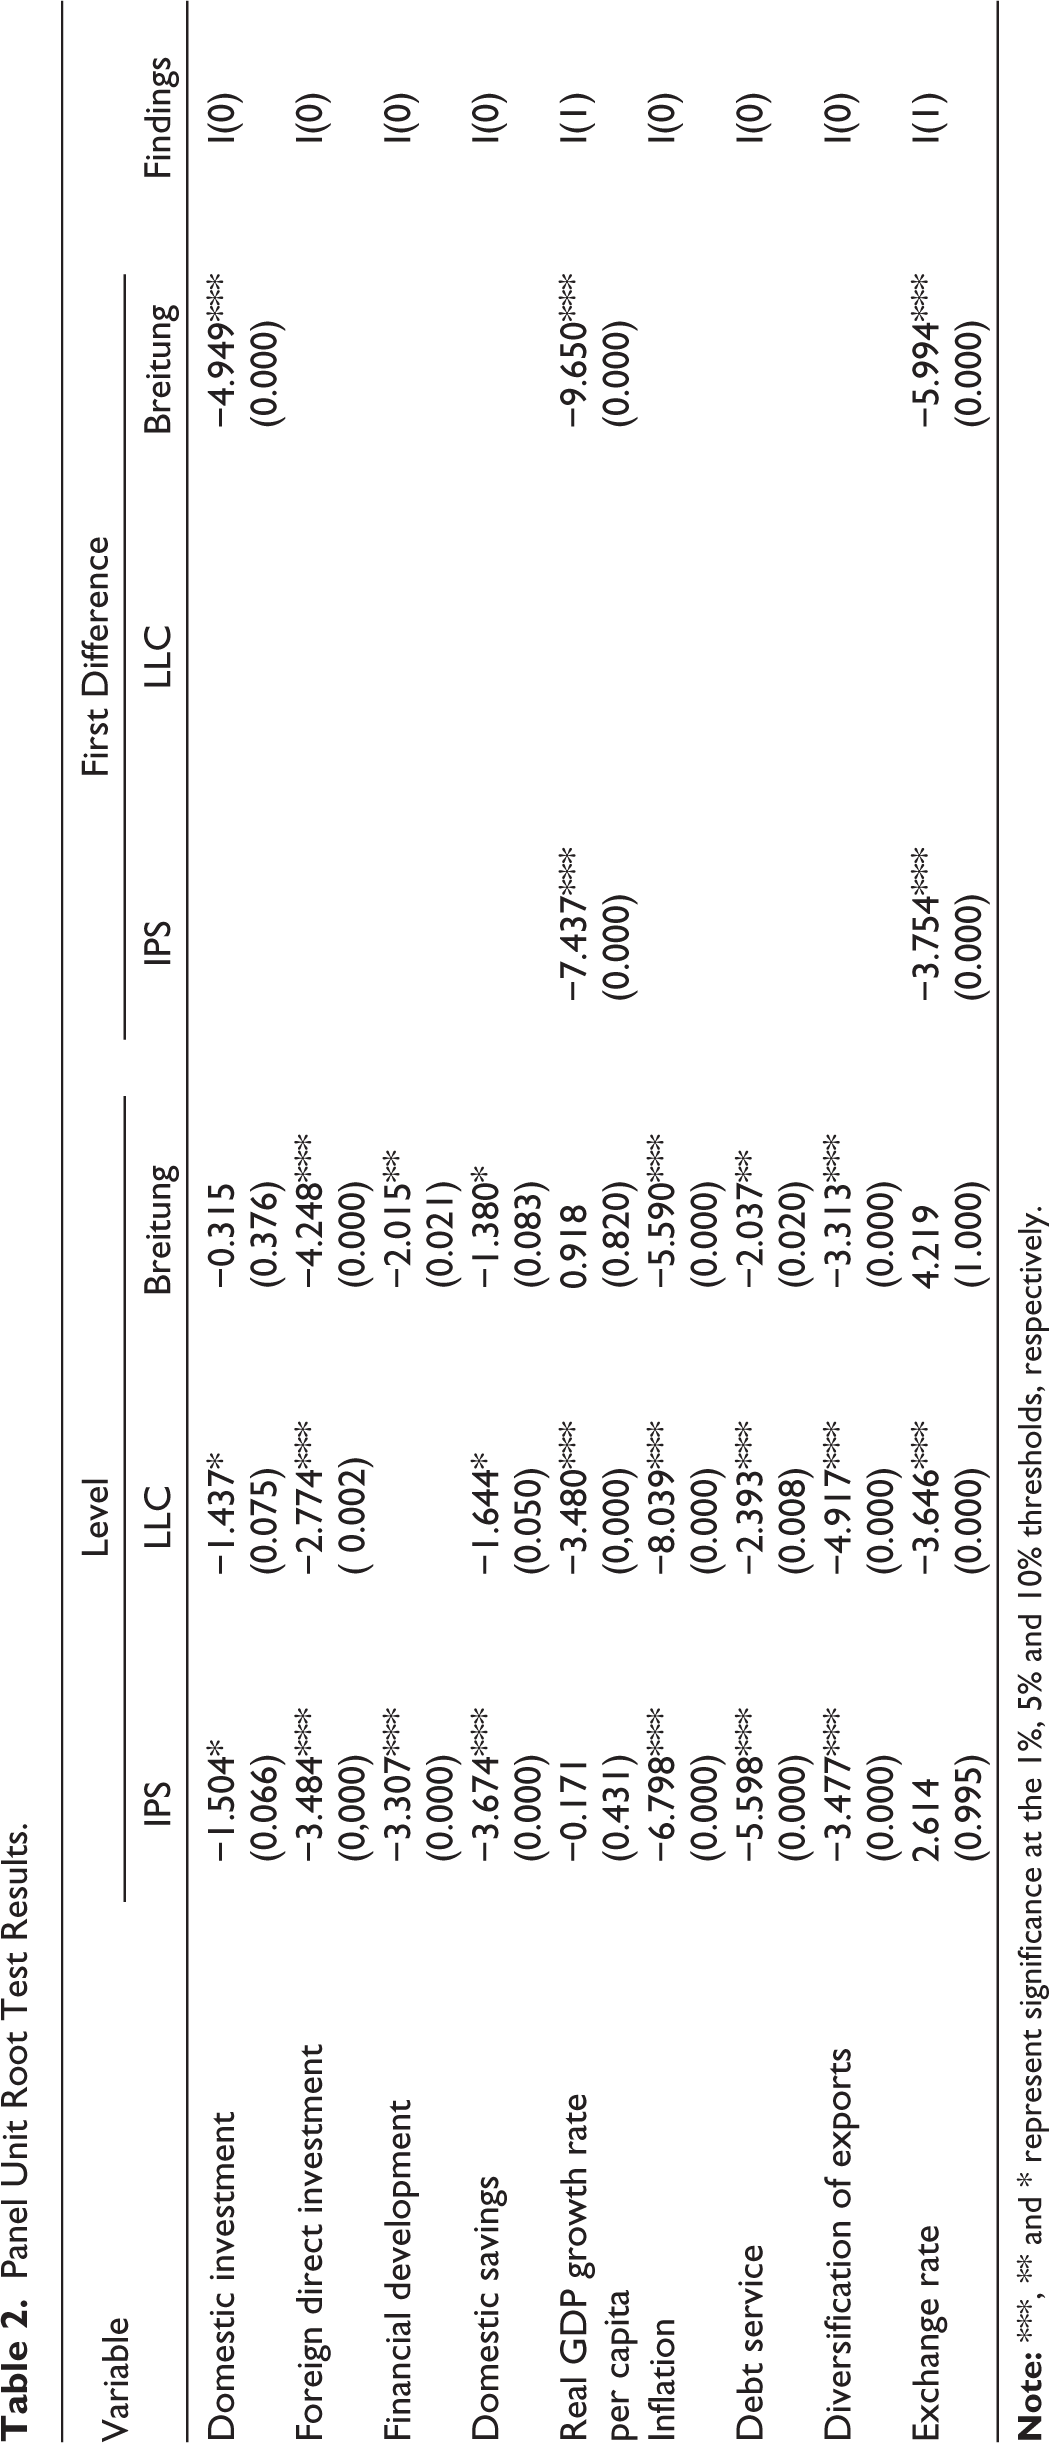
The unit root tests of Im et al. (2003), Levin et al. (2002) and Breitung and Das (2005) were used in this study to ensure that the variables are not integrated of order I(2). The choice of these tests is based on the results of the interindividual dependence test (statistic = 0.379; p value = .705) developed by Pesaran (2015), which revealed a lack of interindividual dependence of individuals in the sample.
The results of the unit root tests carried out (Table 2) confirm that the growth rates of real GDP per capita and the exchange rate are stationary in the first difference, I(1), whereas the variables FDI, financial development, debt service, export diversification, domestic savings and inflation are all stationary at the level I(0). Because of these mixed integration orders, the panel ARDL approach is more appropriate than the traditional panel cointegration test (Pesaran & Shin, 1999).
Panel Unit Root Test Results.
Cointegration Test
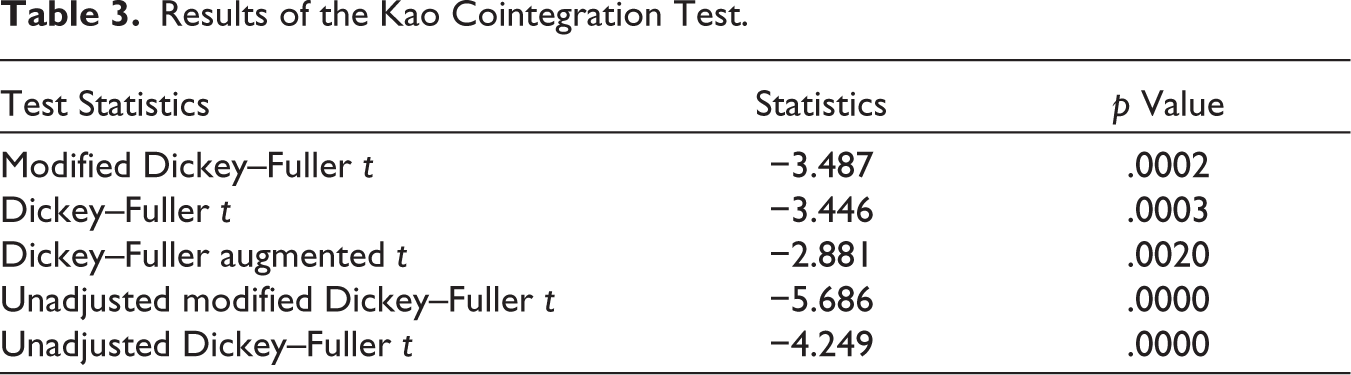
Owing to the lack of interindividual dependence in the panel and the limited sample size, the residual-based cointegration test proposed by Kao (1999) was employed to test whether there is evidence of a cointegrating relationship between the variables.
The results in Table 3 show that all five test statistics are significant. Thus, the null hypothesis of no cointegration is rejected, indicating that the variables have a long-term relationship (cointegrated) with domestic investment. Hence, the PMG, MG and DFE estimators were used to estimate the parameters of the equation.
Results of the Kao Cointegration Test.
Presentation of the Estimation Results
The Hausman (1978) test allows a comparison of the efficiency and consistency between the estimators of PMG, MG and DFE. The values of the pairwise test presented in Table 5 show that the hypothesis of homogeneity of the long-term coefficients cannot be rejected. Therefore, the PMG method is preferred over MG and DFE methods. In the remaining part of this article, only the results derived from the PMG are considered for analysis.
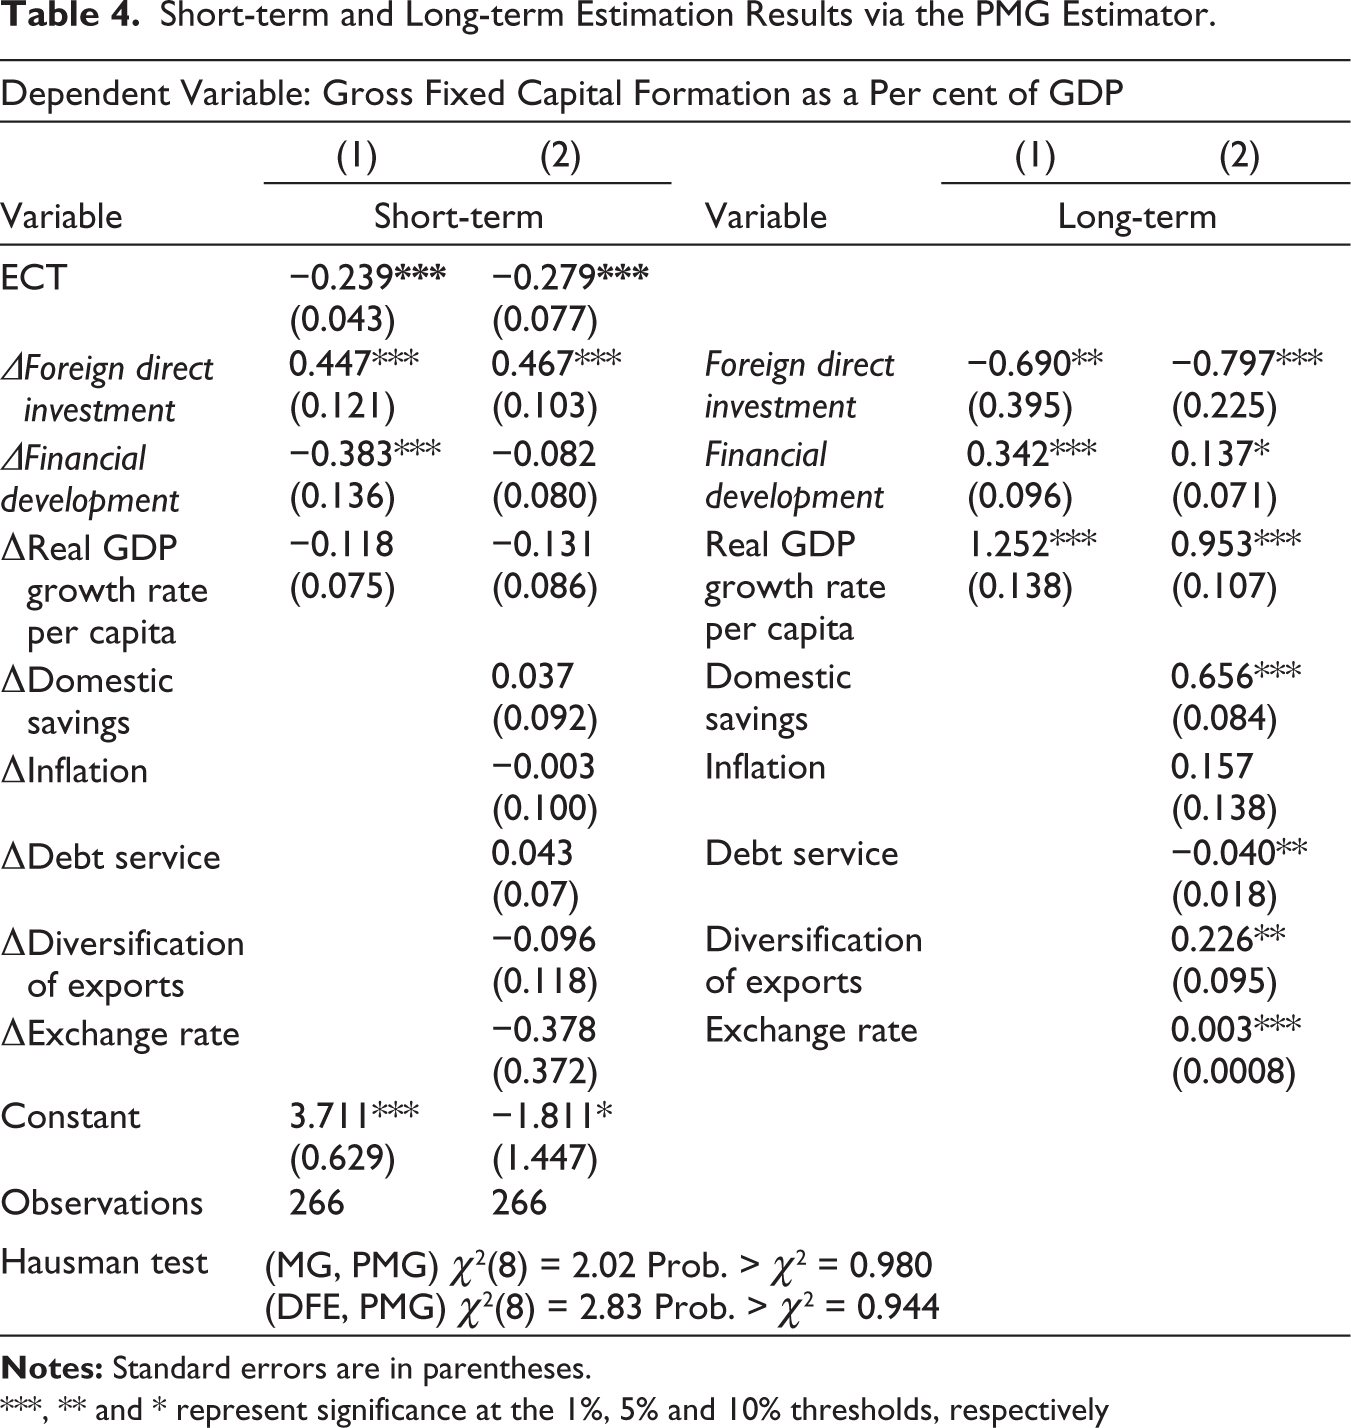
For the short-term results, Table 4 shows that FDI is significant at the 1% level, regardless of the estimate. Financial development presents negative coefficients that are significant only in Estimate 1 at the 1% level. In addition, the adjustment coefficients or recall forces (ECTs) are negative and significant at the 1% level, regardless of the estimate, thus confirming the long-term relationship.
Short-term and Long-term Estimation Results via the PMG Estimator.
***, ** and * represent significance at the 1%, 5% and 10% thresholds, respectively
In the long-term results presented in Table 4, FDI is negatively related to domestic investment and significant at the 5%and 1% thresholds in Estimates 1 and 2, respectively. Financial development is significant at the 1% and 10% thresholds in Estimates 1 and 2, respectively. The growth rate of GDP/head has positive coefficients that are statistically significant at the 1% level in all estimates. Domestic savings and exchange rate are significant at the 1% level and positively related to domestic investment. Debt service is significant at the 5%level and is negatively associated with domestic investment. Export diversification is significantly and positively related to domestic investment at the 5% level.
Discussion of the Results
The adjustment coefficients or recall forces (ECTs) (−0.239 in Estimate 1 and −0.279 in Estimate 2) are negative, between 0 and 1 in absolute value, and significant at the 1% level, thus confirming the existence of a slow error-correction mechanism and the validity of the two estimates. Thus, after a short-term deviation, domestic investment will be recalled to equilibrium after 4 years, 2 months and 6 days for Estimate 1 and 3 years and 7 months for Estimate 2, that is, 23.9% and 27.9%, respectively, of the successive correction of the imbalances of previous years.
On average, a 1 percentage point increase in FDI in Estimate 1 leads, ceteris paribus, to a 0.447 percentage point increase in domestic investment in the short run, compared with a 0.69 percentage point decrease in the long term in Estimate 1. Similarly, a 1 percentage point increase in FDI in Estimate 2 leads to a 0.797 percentage point decrease in domestic investment in the long run, compared with a 0.467 percentage point increase in the short run. These positive short-term coefficients reflect the temporary leverage effect of FDI on domestic investment, whereas in the long run, FDI crowds out domestic investment in West Africa. This mixed effect could be explained by the weakness of positive externalities and the inadequacy of compensation between the stimulus and crowding-out mechanisms. Indeed, in the short term, the entry of FDI into a country where there is already investment by domestic firms of the same type may lead the latter to invest more to become more competitive. Additionally, FDI inflows may reduce interest rates or increase the credit available to finance new domestic investments. However, in the long run, given the high technological superiority of FDI firms and their access to international capital markets, their investments are more likely to displace the investments of domestic firms or even cause them to fail than to induce them to invest. Thus, domestic investments may be crowded out by the monopolistic tendencies of FDI-led multinational firms. Similarly, infrastructure bottlenecks, exacerbated credit constraints or financing of unproductive investments, profit shifting by foreign investors and less-favourable business climates limit the ability of local firms to adapt and reduce the benefits to countries in the zone. This result is consistent with the dependency theory, which posits that the attractiveness of FDI does not significantly affect the increase in gross domestic product (GDP). According to these theories, the benefits derived from FDI by host countries are insufficient because the dividends generated are transferred to the investors’ country of origin (Kuncoro, 2006; Weisskopf, 1972). Our results corroborate those of Ereghan (2012) and Yao and Drama (2019). Indeed, the latter showed that FDI has a crowding-out effect on domestic investments in 10 ECOWAS countries and 7 WAEMU countries. Moreover, these results contradict those of Farla et al. (2016), who showed that FDI had a positive influence on the overall level of investment for a panel of developing countries. Moreover, according to the latter, this difference is justified by the problems of specification of the model and aggregation bias (choice of domestic investment variable) when examining the relationship between FDI and domestic investment.
In the long term, financial development promotes domestic investment despite the initial negative impact of credit defaults on early-stage projects. This correlation can be explained by intermediaries’ better risk management and efficient allocation of resources to profitable projects. These results validate classical theories (McKinnon, 1973; Shaw, 1973) and Boateng et al.’s (2017) study, showing that a developed financial market facilitates access to finance in Sub-Saharan Africa.
A 1 percentage point increase in the growth rate of real/head increases the domestic investment by 1.252 and 0.953 points. This gain stimulates the consumption of durable goods and provides banks with liquidity to finance projects. This result validates the investment accelerator theory, consistent with Boateng et al. (2017).
The results show that domestic savings, debt servicing, export diversification and exchange rates significantly influence domestic investment. A 1 percentage point increase in domestic savings increases investment by 0.656 percentage point in the long term by facilitating the mobilisation of capital (Al-Sadig, 2013). Conversely, a 1 percentage point increase in debt servicing reduces investment by 0.04 percentage point, as debt payments are perceived as a deferred tax that discourages investment and growth (Krugman, 1988), thereby hindering private investment in Sub-Saharan African countries (Diallo et al., 2021).
Simultaneously, a 1 percentage point increase in the exchange rate leads to a 0.003 percentage point increase in long-term investment. This is explained by currency volatility plays and the opportunity to acquire domestic assets at lower costs, which is consistent with the results of Jude (2019) for countries in transition. Finally, a 1 percentage point increase in export diversification stimulates investment by 0.226 percentage point through a catalytic effect on the local industrial fabric, confirming the observations of Diallo et al. (2021) for Sub-Saharan Africa.
Robustness Analysis
The sensitivity of the results was tested by the dynamic ordinary least squares (DOLS) estimator of Pedroni (2001). This estimator not only generates consistent parameter estimates in relatively small samples but also controls for likely endogeneity of regressors, multicollinearity, heteroskedasticity and serial correlation (An et al., 2020).
The results in Columns 1 and 2 of Table 5 show that the coefficients on FDI are negative and significant at the 1% level in the long run, as in the baseline estimate. An increase in FDI of 1 percentage point in Estimates 1 and 2 leads to a decrease in domestic investment of 0.689 and 0.48 percentage points, respectively. These negative effects confirm the crowding-out effect of FDI on domestic investment in the long run. As for financial development, it has positive and significant coefficients at the 10% and 1% thresholds in the long run in Estimates 1 and 2, respectively. The other independent variables are statistically significant and positive or negative. Overall, the results obtained with robustness do not differ significantly from the baseline results, except for small differences that may be due to the methodology used.
Results of the Robustness Analysis Using the DOLS Method.
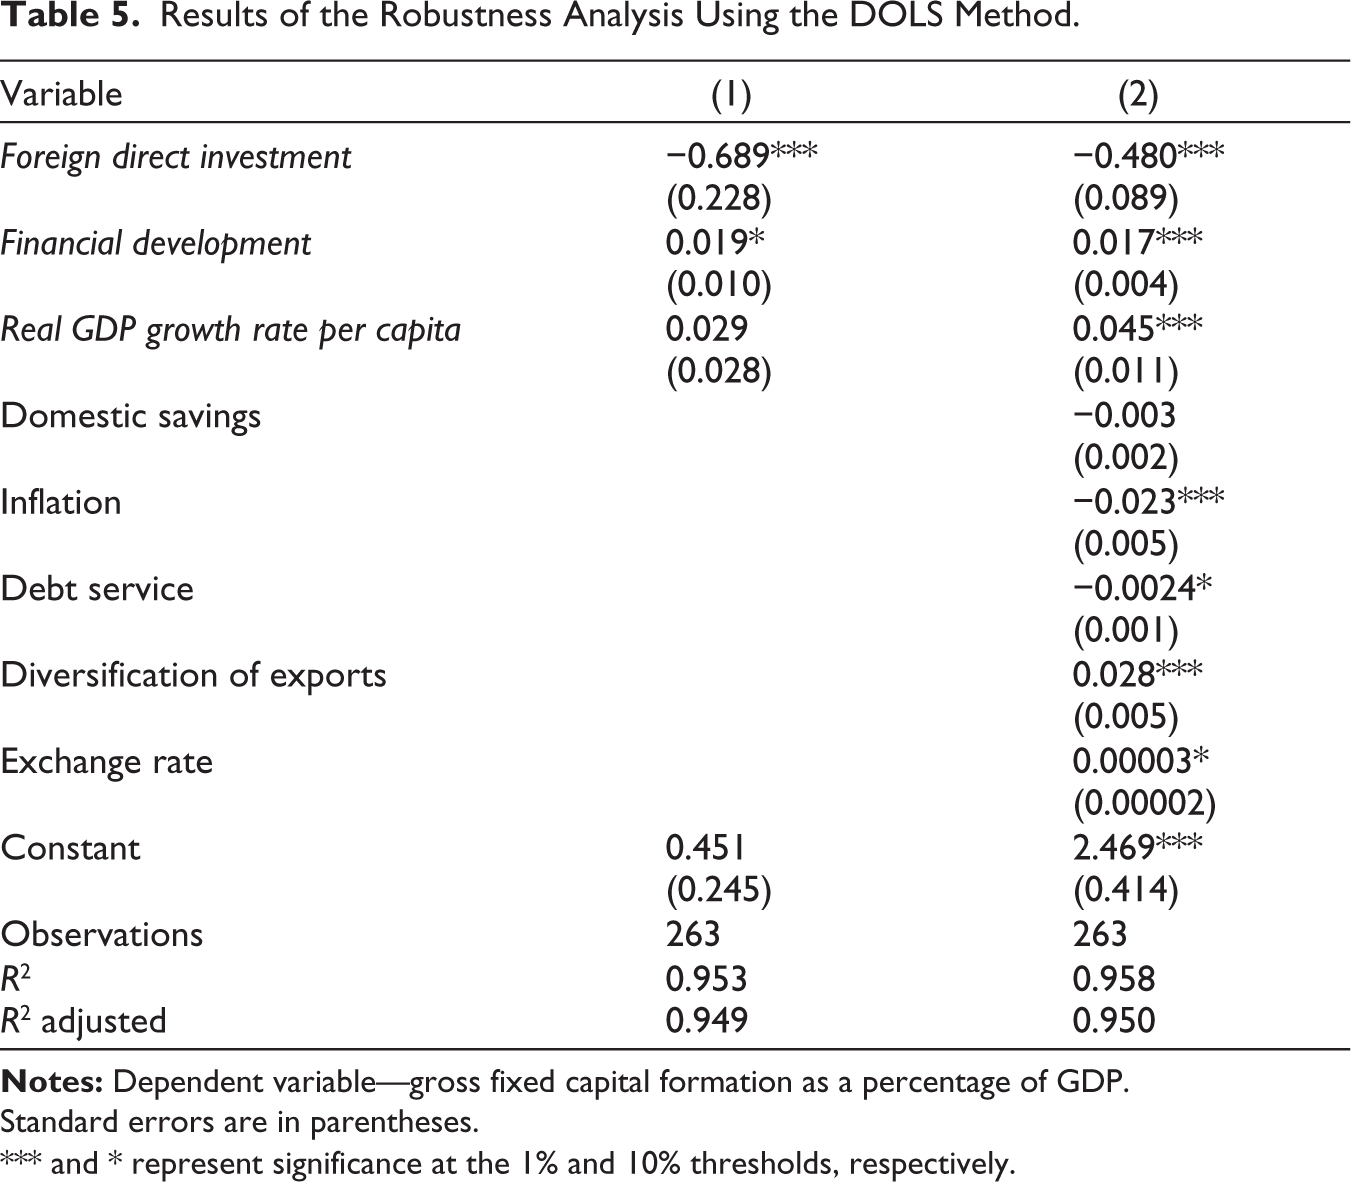
Standard errors are in parentheses.
*** and * represent significance at the 1% and 10% thresholds, respectively.
Conclusion and Economic Policy Implications
Domestic investment and FDI represent major issues in a nation’s economic development. Therefore, the overall objective of this study is to empirically examine the effect of FDI inflows on domestic investment in West African countries using panel data on 14 West African countries from 2000 to 2019.
Thus, eclectic and investment theory models were used to examine the link between FDI and domestic investment. In addition, financial development, debt service, domestic savings, economic growth, inflation, export diversification and the exchange rate were used as control variables.
The method was used to detect the short- and long-term effects of FDI. The results show that FDI has a crowding-out effect on domestic investment in West Africa in the long run, whereas it has a temporary leverage effect on investment in the short run. Moreover, financial development has a positive and significant effect on domestic investments. Consequently, financial development is a catalyst for domestic investment and, by extension, FDI, as it is a transit channel for these financial flows. Economic growth, domestic savings, export diversification and exchange rate have positive long-term influences on domestic investment, whereas debt service has a negative impact. In addition, the analysis shows that the speed of adjustment towards equilibrium is slow and represents annual rates of 23.9% and 27.9%, respectively.
These results indicate that FDI is harmful to West African countries in the long term. However, a well-developed financial system can support foreign investors’ investment plans and the expansion of innovative activities in host countries, leading to technological spillovers for domestic firms. In addition, it helps build the resilience of local firms by ensuring that they have sufficient resources to compete with FDI inflows.
Safety nets should be put in place to filter inward FDI and ensure that the objective of FDI companies is not only to maximise profits but also to support sustainable development in host countries.
The main limitation of this empirical research is that not all countries in West Africa are considered due to the unavailability of data. Furthermore, future research could investigate the individual effects of FDI by disaggregating it into green-field FDI or M&A FDI, for example, or by economic sector.
Supplemental Material
Supplemental material for this article is available online.
Footnotes
Data Availability
Data are available upon request.
Declaration of Conflicting Interests
The author declared no potential conflicts of interest with respect to the research, authorship and/or publication of this article.
Funding
The author received no financial support for the research, authorship and/or publication of this article.
Note
References
Supplementary Material
Please find the following supplemental material available below.
For Open Access articles published under a Creative Commons License, all supplemental material carries the same license as the article it is associated with.
For non-Open Access articles published, all supplemental material carries a non-exclusive license, and permission requests for re-use of supplemental material or any part of supplemental material shall be sent directly to the copyright owner as specified in the copyright notice associated with the article.