
Abstract
This study offers a comprehensive examination of India’s bilateral services exports at a disaggregated sectoral level, covering 12 service sectors and 180 partner countries during 2005–2021. Using the OECD-WTO BaTiS data set within a gravity framework, it identifies the trends and factors driving India’s services exports. We augment the analysis by calculating gravity-based, sector-specific ad valorem estimates of non-tariff barriers imposed by partner countries. Our findings suggest that the United States, the United Kingdom, Singapore, the Netherlands and Germany impose the least barriers on Indian services. Gravity results indicate that, unlike in goods trade, geographical distance has a weaker and less-robust effect on service flows, while linguistic ties play a more important role. India’s services exports are typically higher than countries with which it has strong goods–trade relationships, but trade agreements do not significantly boost services exports. Sector-specific factors—mobile cellular penetration for telecom, shipping connectivity for transport and R&D share in GDP for other business services—also emerge as significant. By conducting a sectoral analysis for a large set of partner countries, the study contributes novel empirical evidence to an underexplored dimension of trade from a major emerging economy perspective.
Introduction
In 1995, the General Agreement on Trade in Services (GATS) came into force as part of the establishment of the WTO, marking the first multilateral framework to govern services trade. Prior to this, global trade agreements primarily focused on merchandise trade. The introduction of GATS institutionalised the progressive liberalization of services trade. Over the next two decades, the value of commercial services exports increased by more than 500% between 1995 and 2023. 1 The outsourcing of services from developed to developing countries further spurred this growth (Bhagwati, 1984). India’s IT sector, the Philippines’ business process outsourcing services, and China’s fintech and e-commerce boom are notable examples. In recent years, services trade has outpaced merchandise trade: in 2022, world services exports grew by 14.3% versus 11.4% for goods (UNCTAD, 2023); in 2023, services grew by 9%, while goods declined by 5% (WTO, 2024).
Goods and services differ in two fundamental ways. First, goods require cross-border shipment, whereas many services do not, implying that geographical distance may matter less for services trade. Second, services barriers are primarily regulatory rather than tariff-based (see Copeland & Mattoo, 2008; Dee et al., 2003). A foreign university or professional cannot simply pay a tariff to operate abroad but must comply with host-country legal and procedural requirements. Consequently, trade costs for goods and services must be quantified differently.
Services also display substantial sectoral heterogeneity, and aggregation can obscure heterogeneity. Telecom and ICT exports depend on digital infrastructure (Freund & Weinhold, 2004); a common language facilitates communication-intensive sectors (Lennon, 2009; Walsh, 2008), and travel exports are shaped by political stability and safety (Neumayer, 2004). These differences justify incorporating sector-specific variables alongside standard gravity determinants.
Building on this, the study contributes in two ways. First, it provides a data-driven gravity-based estimation of non-tariff barriers affecting India’s services exports, constructing annual partner- and sector-level measures. To our knowledge, sector- and country-specific restrictions on India’s services exports have not previously been modelled. Second, using bilateral sectoral data, this article estimates both overall and sector-specific determinants of India’s services exports within a gravity framework.
Our focus on India is motivated by three stylised facts: (a) services accounted for 49.6% of India’s GDP in 2024, exceeding manufacturing and agriculture; 2 (b) services have become central to employment generation, with their share in the total employment rising from 21% in 1991 to 31.46% in 2023; and (c) India’s share in global services exports increased from below 1% in the 1980s to nearly 4% in 2021, ranking above countries such as Japan and Switzerland and third among developing economies after China and Singapore (Figures A1(a) and (b)). Since 2007, India has consistently recorded a services trade surplus, in contrast to its persistent merchandise trade deficit (Figure A2).
Our estimation reveals that non-tariff barriers facing Indian services exports are lowest in partner countries, such as the United States, the United Kingdom, Germany, the Netherlands and Singapore. Distance exerts a weaker and less-robust dampening effect on services trade than on goods. A common official language significantly boosts exports across telecom, business services, transport and travel. Larger population and higher per capita income in partner countries increase exports across most categories. Free trade agreements are insignificant, reflecting low utilisation rates. Beyond standard gravity variables, strong goods–trade ties are associated with higher services trade. Sector-specific variables—such as the telecom index, R&D intensity and shipping connectivity index—are significant at the 10% level, though traditional gravity variables (language, market size, income) remain more robust determinants.
The rest of the article is organised as follows. The second section provides a review of the literature. In the third section, we provide a description of the data and discuss some key descriptive statistics. The methodological background and econometric models are presented in the fourth section. The fifth section presents the results, and the sixth section provides the concluding remarks.
Review of Literature
Although goods trade is extensively studied, systematic research on services trade gained momentum only from the mid-1980s (see Francois and Hoekman, 2010, for a detailed review). The separability of goods and services was highlighted in Bhagwati (1984), while Deardorff (1984) extended the comparative advantage framework to services, conceptualising them as trade in intermediate inputs, factor movements and location-specific activities. Sampson and Snape (1985) built on this, and formalized the four modes of supply, later embedded in the GATS framework.
Empirically, the gravity model has become the workhorse for analysing trade flows. Studies show that it performs well for both goods and services, particularly when incorporating regulatory and sector-specific variables. Over time, a substantial literature has used this framework to analyse services exports.
Distance effects remain debated. Some studies find significant negative effects, particularly for proximity-dependent sectors (Anderson et al., 2018; Burger et al., 2014; Gru¨nfeld & Moxnes, 2003; Kimura & Lee, 2006; Li et al., 2025; Van der Marel & Shepherd, 2013), while others find weak or insignificant effects (Lejour & de Palva Verheijden, 2004; Lennon, 2009; Walsh, 2008). Evidence increasingly suggests sectoral heterogeneity and declining distance elasticities over time.
Core gravity variables—GDP, population and GDP per capita—are consistently significant across estimation techniques (Ariu & Nilsson Hakkala, 2025; Kimura & Lee, 2006; Walsh, 2008). A common language strongly facilitates communication-intensive sectors (Anderson et al., 2018; Reverdy, 2023). Additionally, non-conventional determinants include time-zone differences (Hellmanzik & Schmitz, 2016; Sinha Roy et al., 2024), temperature (Walsh, 2008), ICT infrastructure (Freund & Weinhold, 2004; Kox & Nordås, 2007), RD intensity and corruption perceptions (Lennon, 2009).
Given the absence of tariffs in services trade, considerable work measures non-tariff barriers. The OECD’s Services Trade Restrictiveness Index (STRI) is widely used, with evidence showing that lower restrictiveness reduces trade costs (Benz Jaax, 2020). Alternative approaches estimate services trade costs by: (a) including regulatory indicators in a gravity model (Van der Marel & Shepherd, 2013), (b) using constant elasticity of substitution (CES; Fontagné et al., 2011; Miroudot et al., 2013) or (c) structural gravity frameworks (Anderson et al., 2018).
Most empirical work focuses on OECD economies due to data constraints. Exceptions include studies on Vietnam (Dao et al., 2014), China (Tang et al., 2013) and Africa (Ariu & Ogliari, 2023). India-specific research is relatively limited. Studies document India’s comparative advantage in IT services (Burange et al., 2010), its outlier status in services exports (Eichengreen & Gupta, 2013) and the roles of GDP, language, exchange rates, infrastructure and human capital (Das & Sarma, 2021; De, 2013; Sahoo & Dash, 2014). However, most studies rely on aggregate or non-bilateral data.
This study contributes by estimating sector-specific determinants of India’s services exports using the OECD-WTO BaTiS data set, which provides bilateral, disaggregated coverage for nearly 180 countries. To the best of our knowledge, no prior study models India’s services exports at this level of sectoral detail while incorporating sector-specific trade restrictions.
Data and Descriptive Statistics
Data
This study constructs a panel dataset to: (a) estimate partner-country and sector-specific STBs and (b) examine the determinants of India’s bilateral services exports at the sectoral level. Bilateral services trade data are drawn from the OECD-WTO BaTiS data set, 3 covering 12 service sectors 4 for 2005–2021. 5
Core gravity variables are obtained from the CEPII database, including bilateral distance, common language, colonial ties and partner-country population. Political stability is controlled for using the World Governance Indicators. 6 Additional variables are sourced from the World Development Indicators (WDI). Tables A3 and A4 provide detailed descriptions and summary statistics.
We also construct additional explanatory variables. India’s partner-specific real exchange rate is estimated using Reserve Bank of India (RBI) data, while merchandise export shares are computed from the Ministry of Commerce data. A key contribution is the estimation of overall and sector-specific STBs 7 following the methodology of Fontagné et al. (2011), which itself builds on Park (2002). This index quantifies the level of policy-induced barriers to services trade. The section ‘Estimation of Services Trade Barrier’ details the index construction.
Descriptive Statistics
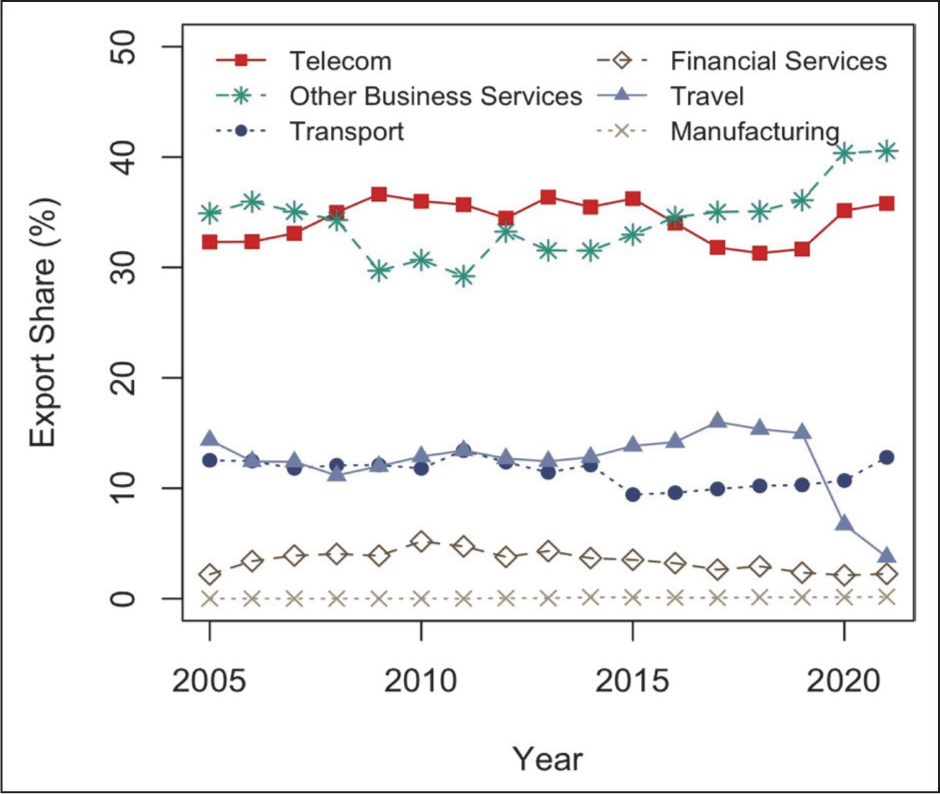
India’s services export basket is dominated by a few key sectors, with other business services (OBS)—including R&D and consultancy—emerging as the leading contributor since 2016. As depicted in Figure 1, in 2021, OBS accounted for around 40% of India’s total services exports. This is followed by telecommunications at 35%. Travel and transport are next, both exceeding 10%. Financial and manufacturing services have negligible shares. OBS, telecommunications, and travel and transport comprise approximately 90% of India’s total services exports.
Turning to destination markets, developed and developing countries account for 55% and 45% of India’s services exports, respectively. However, in terms of real value, exports to developed partners—led by the United States, followed by Great Britain, Switzerland and Japan—are significantly higher (refer to Figure A3(a)). Among developing partners, China, Hong Kong, Singapore, the UAE and Saudi Arabia dominate, though export values generally remain below their developed counterparts (see Figure A3(b)).
To identify areas of relative efficiency, we compute the revealed comparative advantage (RCA) indices for all service sectors across different years. RCA (Balassa, 1965) is the ratio of a country’s share of a commodity in its total exports to the share of world exports of that commodity in overall world exports. The RCA of country i in sector k and year t is calculated as follows:
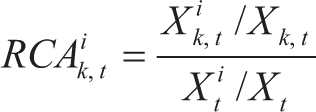
where Xik, t is country i’s exports in sector k during time period t. Xk, t denotes world exports of sector k during time period t. The denominator is the share of the total exports of country i (Xit) in the total world exports (Xt).
If the ratio takes a value greater than unity, it implies that the country has a comparative advantage in that product. From Figure 2, it is evident that India’s average annual RCA from 2005 to 2021 has been the highest in the telecommunications sector, followed by OBS. 8 On average, the RCA for telecommunications averaged just above 3, and that for OBS has been around 1.5 (refer to Table A2). Until 2020, these were the only two sectors in which India consistently demonstrated RCA > 1, indicating relative efficiency in exporting these services. However, the RCA for telecommunications has shown a declining trend, with only marginal signs of stabilization between 2020 and 2021. 9 It should also be noted that India continues to lag significantly in other service sectors, suggesting limited international competitiveness outside of core strengths.
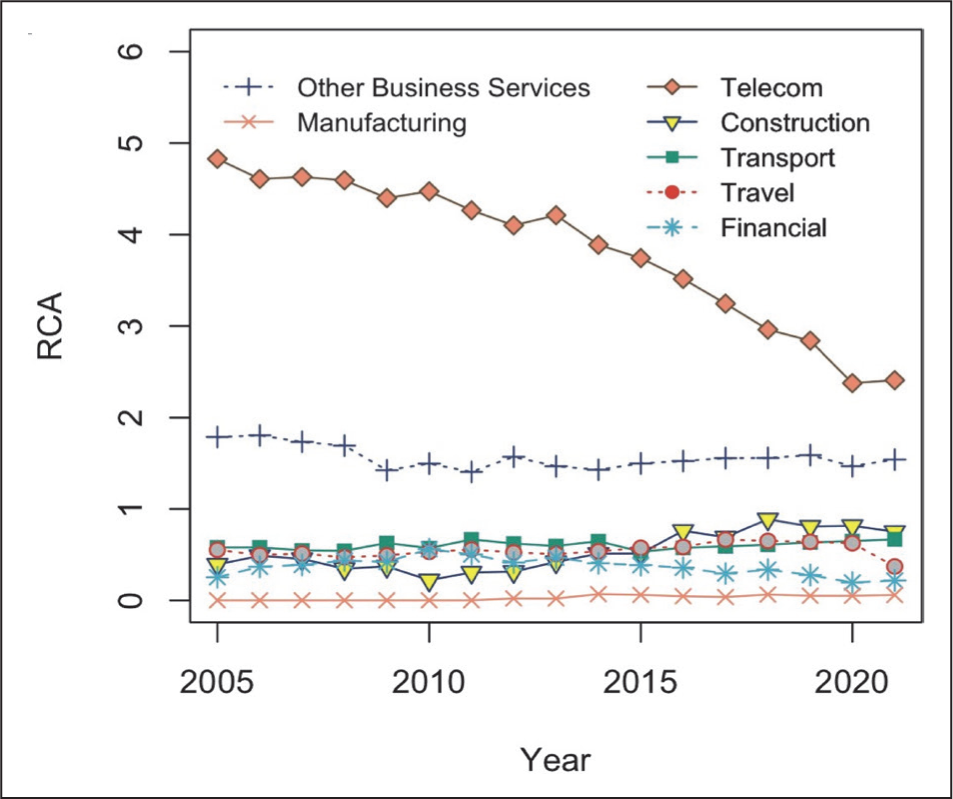
Figure A4 presents the sector-wise RCA profiles of other developing countries, offering a comparison. In Figures A4(a) and A4(b), India stands out with a significantly higher RCA in OBS and telecommunications as compared to China, Singapore and the UAE, highlighting its strong specialization. However, India’s RCA remains notably low in transport (Figure A4(c)) and travel (Figure A4(d)) services, indicating weak competitiveness in these areas. That said, India has shown recent improvement in travel exports, overtaking Singapore, suggesting a nascent shift in comparative advantage. To further examine the drivers of services exports, the next section discusses the econometric model employed in the study.
Methodology
Gravity Model
This study analyses the determinants of India’s services exports—both in aggregate and at the sectoral level—by employing a gravity model framework. The foundational formulation of the gravity model can be traced back to Tinbergen (1962), who introduced it as an empirical analogy to Newton’s law of gravitation. In its simplest form, bilateral trade flows between two countries were modelled to be proportional to their economic sizes and inversely related to the distance between them.
Subsequent theoretical advances, most notably by Anderson and Van Wincoop (2003), introduced a theoretically grounded gravity model derived from a CES utility function under general equilibrium. Importantly, it highlighted that traditional specifications omit multilateral resistance terms—factors reflecting the relative trade barriers a country faces with all partners, not just bilaterally.
Another major development in estimating the gravity model was the Poison pseudo-maximum likelihood (PPML) estimator (Silva & Tenreyro, 2006). PPML was a significant improvement upon methods which produce biased estimates in the presence of heteroskedasticity and zero trade flows—both common in trade data. Based on these considerations, in this study we employ a PPML model with high-dimensional fixed effects (HDFE) 10 (Correia et al., 2020). This approach allows for zero trade flows, controls for multilateral resistance via importer and exporter fixed effects, and accounts for unobserved heterogeneity.
Choice of Variables
The gravity model used in this study includes standard determinants of trade commonly applied in goods and services literature: (a) geographical distance between capitals, (b) common official language dummy, (c) partner-country population, (d) GDP per capita of partner-country, (e) free/regional trade agreement dummy and (f) political stability of the partner country.
Since the focus is India’s services exports, India-specific variables are absorbed through exporter fixed effects. The analysis covers four key sectors— telecommunications, OBS, travel and transport. Sector-specific variables are drawn mainly from the WDI database. For telecommunications, mobile cellular subscriptions per 100 people (Eichengreen & Gupta, 2013) proxy telecom penetration. For transport, we include (a) the UNCTAD Liner Shipping Connectivity Index (2004 = 100), measuring integration into global shipping networks, 11 and (b) air-transport freight (million ton-km), capturing logistics capacity. 12 For OBS, we use R&D expenditure (% GDP) and FDI inflows as proxies for innovation and investment climate, consistent with Evangelista et al. (2015) and Fillat Castejon et al. (2008).
Additionally, two variables are constructed: India’s bilateral real exchange rate (RBI data), where higher values imply INR appreciation, and partner share in India’s merchandise exports (Ministry of Commerce data), capturing goods–services linkages.
Estimation of Services Trade Barrier
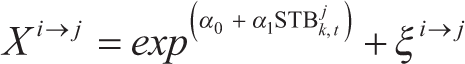
We estimate tariff equivalents of STBs following Park (2002) and Fontagné et al. (2011) using estimated residuals from the gravity equation. An estimate of protection in the service sector k, imposed by country j in year t (STB k, j, t ), is derived in two steps:
Step 1: We first predict the expected value of exports to partner country j in sector k using a standard gravity equation:

Where
The predicted values of exports
Step 2: STB is computed as follows:
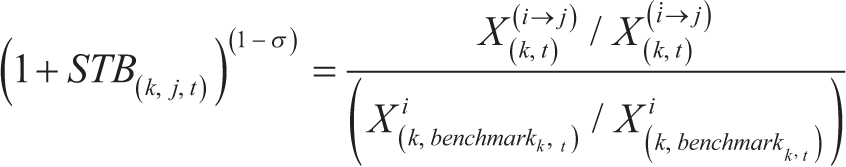
For Equation 3 to be well-defined, the elasticity of substitution (σ), which captures the sensitivity to trade costs, should be greater than 1. Consistent with prior literature, we set σ = 5.6.
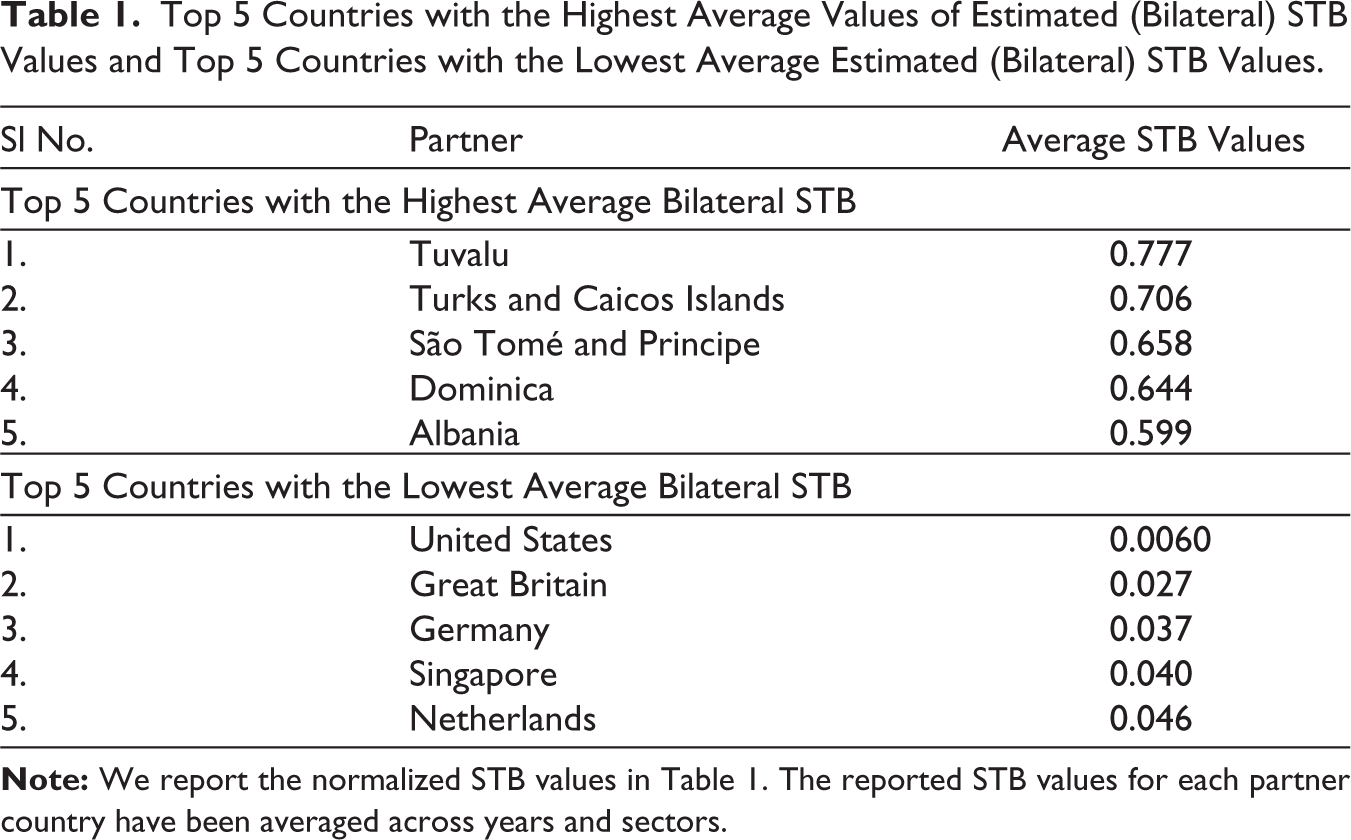
In our sample, the benchmark countries are typically the United States or China, reflecting high trade integration and low restrictions. 13 STBs are computed both bilaterally (India-specific) and generally (common for all partner countries). Lower values indicate lower barriers. Major partners such as the United States, the United Kingdom and Singapore show low STBs, while low-trade partners show high values (see Table 1 and Figure A5).
Top 5 Countries with the Highest Average Values of Estimated (Bilateral) STB Values and Top 5 Countries with the Lowest Average Estimated (Bilateral) STB Values.
Econometric Model
To capture the effect of explanatory variables other than STB on India’s service-sector exports, we first decompose exports into two parts: (a) expected exports, given STB (i.e., exports predicted from STB), and (b) exports uncorrelated with STB (residuals). This is shown in Equation 4:
The predicted values of exports obtained from Equation 4 are subtracted from the actual values of exports to obtain residual exports (ξˆ), capturing exports after purging out the effect of STB. Residual exports are then regressed on gravity determinants:

Equation 5 is estimated using PPML for a multi-way panel data set spanning 180 partner countries and 12 service sectors, for the years 2005–2021. Zi, j, t is the vector of bilateral variables (distance, exchange rate, merchandise export share, etc.). Di, j, t includes dummies (e.g., common official languages, common colonisers and FTAs). Wj, t captures partner characteristics (GDP per capita, population and political stability). λj, ηk and τt are partner-country, sector and year fixed effects, respectively.
A priori, higher income and population are expected to increase exports. Distance may be weak or negative in services. Common language, colonial ties and FTAs should promote exports. Goods export linkages likely indicate complementarity.
Finally, the sector-specific regression is as follows:

Here, the vector Sj, t captures the explanatory variables specific to service sector k (i.e., telecommunications, OBSs, travel and transport sectors). The other variables in Equation 6 remain the same as that in Equation 5.
Results
The section ‘Results Based on All Service Sectors’ presents the full-sample results (Equation 5) and the section ‘Sector-specific Results (Regression Equation 6)’ presents the sector-specific models (Equation 6). We check multicollinearity using pairwise correlations (see Figure A6), which shows no major concerns. The only high correlation is between air-transport freight and FDI, but this does not affect results as they are never included jointly in any specification.
Results Based on All Service Sectors
Table 2 reports results for India’s total services exports across sectors, partners and years. All variables except two are significant. The model yields an R² of 0.75, indicating good fit. The presence of zero trade flows justifies PPML estimation, with standard errors clustered at the partner level.
Determinants of India’s Services Exports: Results of the Gravity Model (Overall Regression Including All Sectors).
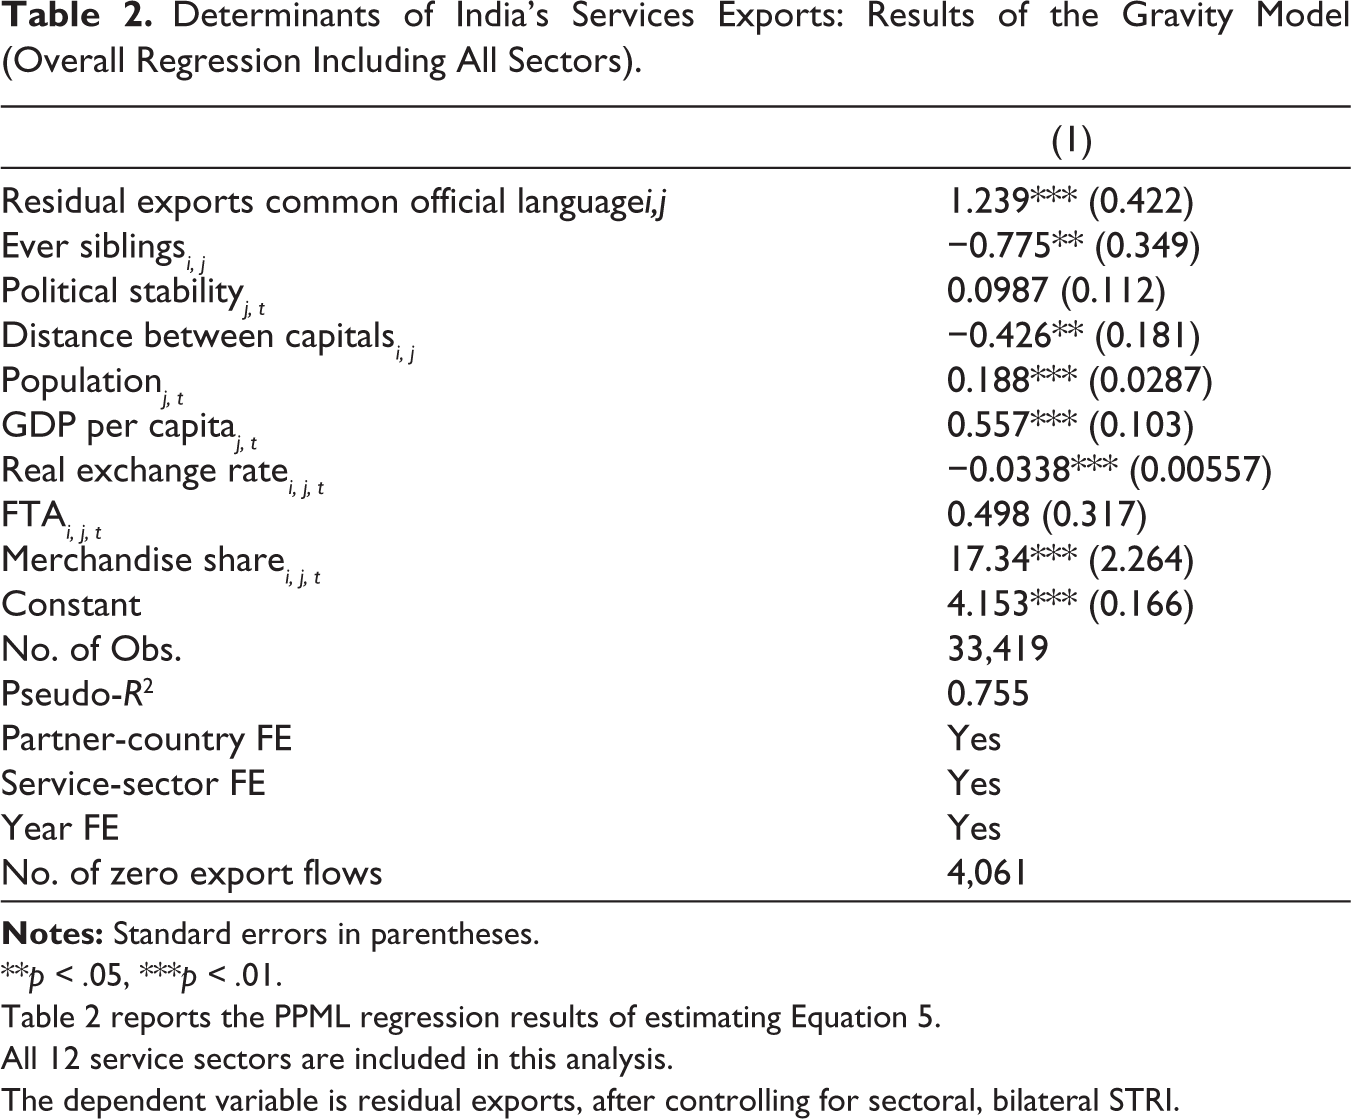
**p < .05, ***p < .01.
Table 2 reports the PPML regression results of estimating Equation 5.
All 12 service sectors are included in this analysis.
The dependent variable is residual exports, after controlling for sectoral, bilateral STRI.
Common language significantly increases exports, consistent with Anderson and Van Wincoop (2003) and Kimura and Lee (2006), reflecting the importance of linguistic proximity in reducing transaction costs in services. In contrast, sharing a colonial link (‘Ever Siblings’) is significantly negative, contrary to findings in the goods and services literature (Ariu & Ogliari, 2023; Head & Mayer, 2014). This may reflect lower trade complementarities, resulting in a weak demand in many former colonies for India’s skill-intensive services, consistent with Head et al. (2010) on the erosion of colonial trade links.
Distance remains negative and significant, though smaller in magnitude (−0.43) than in goods trade. FTAs are insignificant, consistent with the evidence that India’s agreements have not significantly boosted services exports due to low utilisation, complex rules and high compliance costs (Chanda & Tokas, 2020; Pandey & Unnikrishnan, 2023). Goods–trade linkages strongly promote services exports, supporting complementarities between goods and services (Kimura & Lee, 2006; Lennon, 2009). GDP per capita, population and the real exchange rate are all significant with expected signs: richer and larger markets import more services, while currency appreciation reduces India’s exports.
To examine the heterogeneity of the determinants by the development level, we split partner countries into developed and developing groups (following the UN (2014) categorisation) and re-estimate the model (Table 3). 14 Several differences emerge from the baseline results.
Determinants of India’s Services Exports: Results of Gravity Model Estimation (Developed and Developing Partner Country).
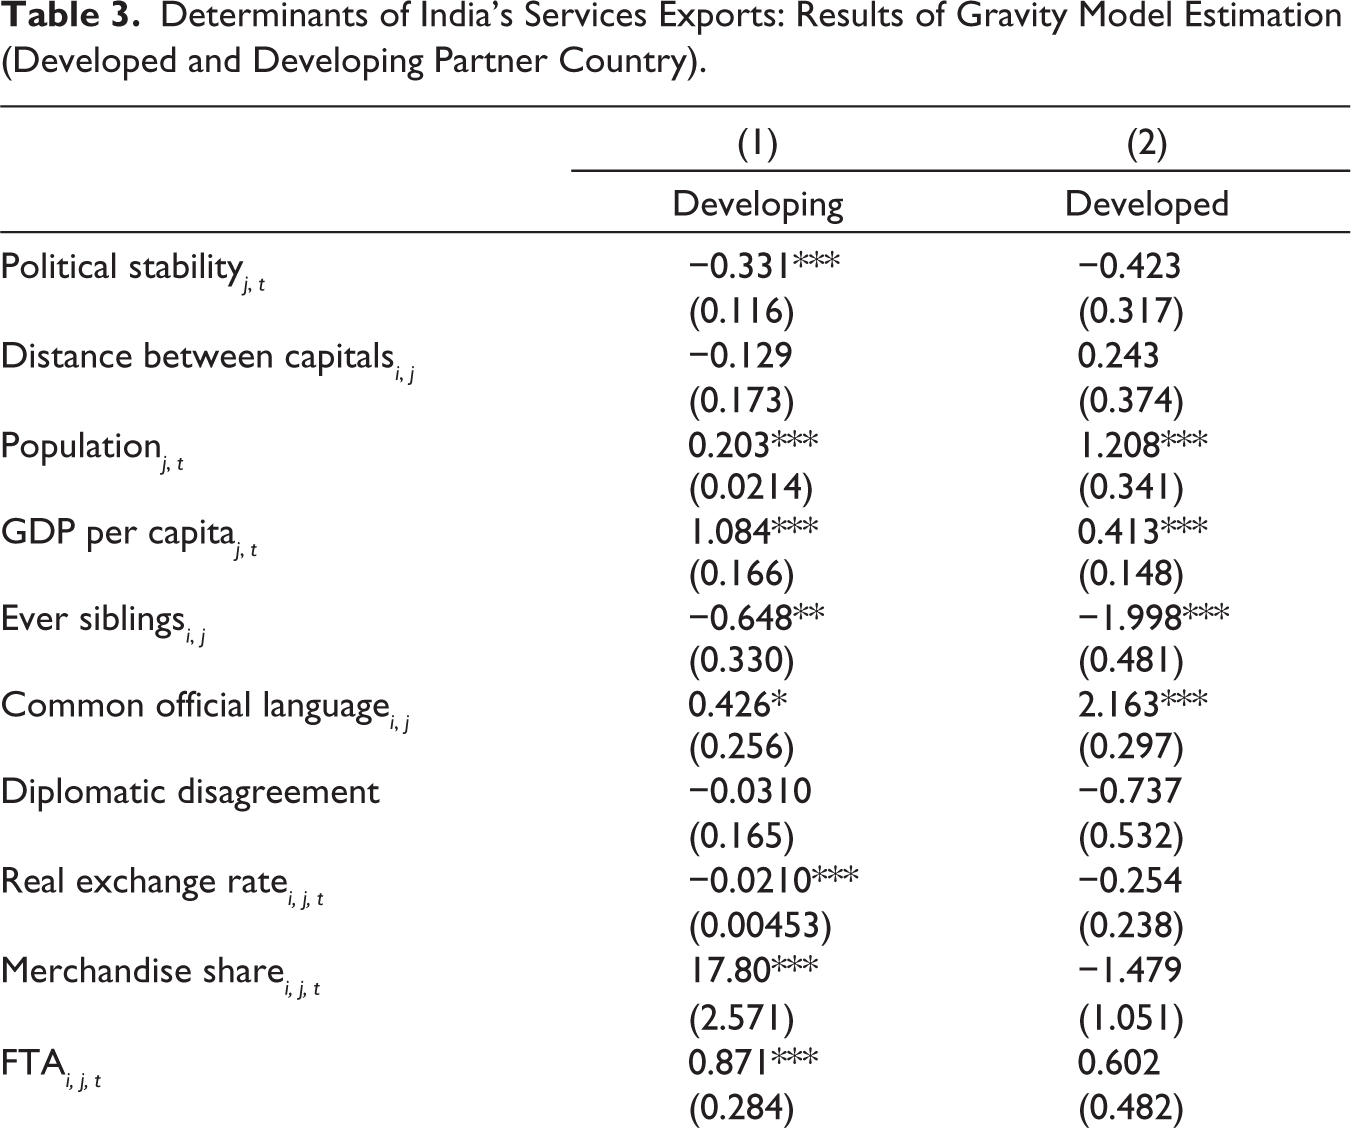
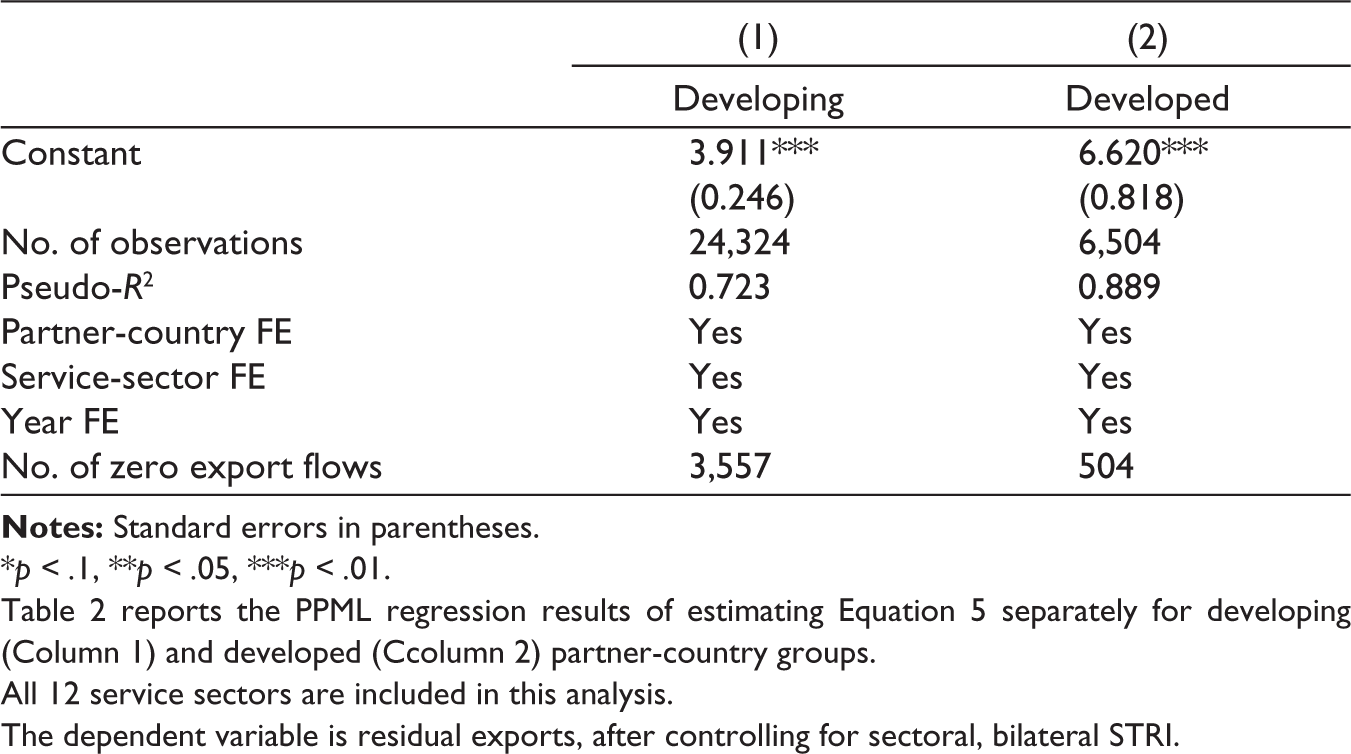
*p < .1, **p < .05, ***p < .01.
Table 2 reports the PPML regression results of estimating Equation 5 separately for developing (Column 1) and developed (Ccolumn 2) partner-country groups.
All 12 service sectors are included in this analysis.
The dependent variable is residual exports, after controlling for sectoral, bilateral STRI.
Distance becomes insignificant in both samples, suggesting that geographical proximity may not be a robust determinant for services trade. FTAs matter only for developing countries, likely because India already has deep service linkages with its key developed partners (e.g., the United States, the United Kingdom and Germany), whereas most agreements (e.g., ASEAN and Sri Lanka) are with developing economies.
Other gravity variables retain their signs but differ in magnitude. GDP per capita has a stronger effect for developing countries, consistent with rising income being more important for the demand at lower income levels. In contrast, common language, colonial links and population matter more for developed partners. The large effect of language for developed countries reflects India’s strong exports of IT and business services to English-speaking economies such as the United States and the United Kingdom, where communication-intensive services dominate. Similarly, population has a stronger effect in developed markets, likely due to higher purchasing power, making market size more economically meaningful.
Goods–services linkages remain significant across both groups, confirming complementarities between merchandise and services trade. The exchange rate is significant only for developing countries, suggesting a more elastic demand in these markets. Political variables show weak effects: diplomatic disagreement is insignificant in both samples. Political stability is negative for developing countries, likely driven by India’s strong service ties with relatively less stable economies such as Saudi Arabia and China in the sample.
Sector-specific Results (Regression Equation 6)
This section presents sectoral regression results for telecommunications (Column 1), travel (Column 2), transport (Column 3) and OBS (Column 4) in Table 4. Along with standard gravity variables, we include sector-specific determinants.
Determinants of India’s Services Exports: Results of Gravity Model Estimation (Sector-wise Analysis).
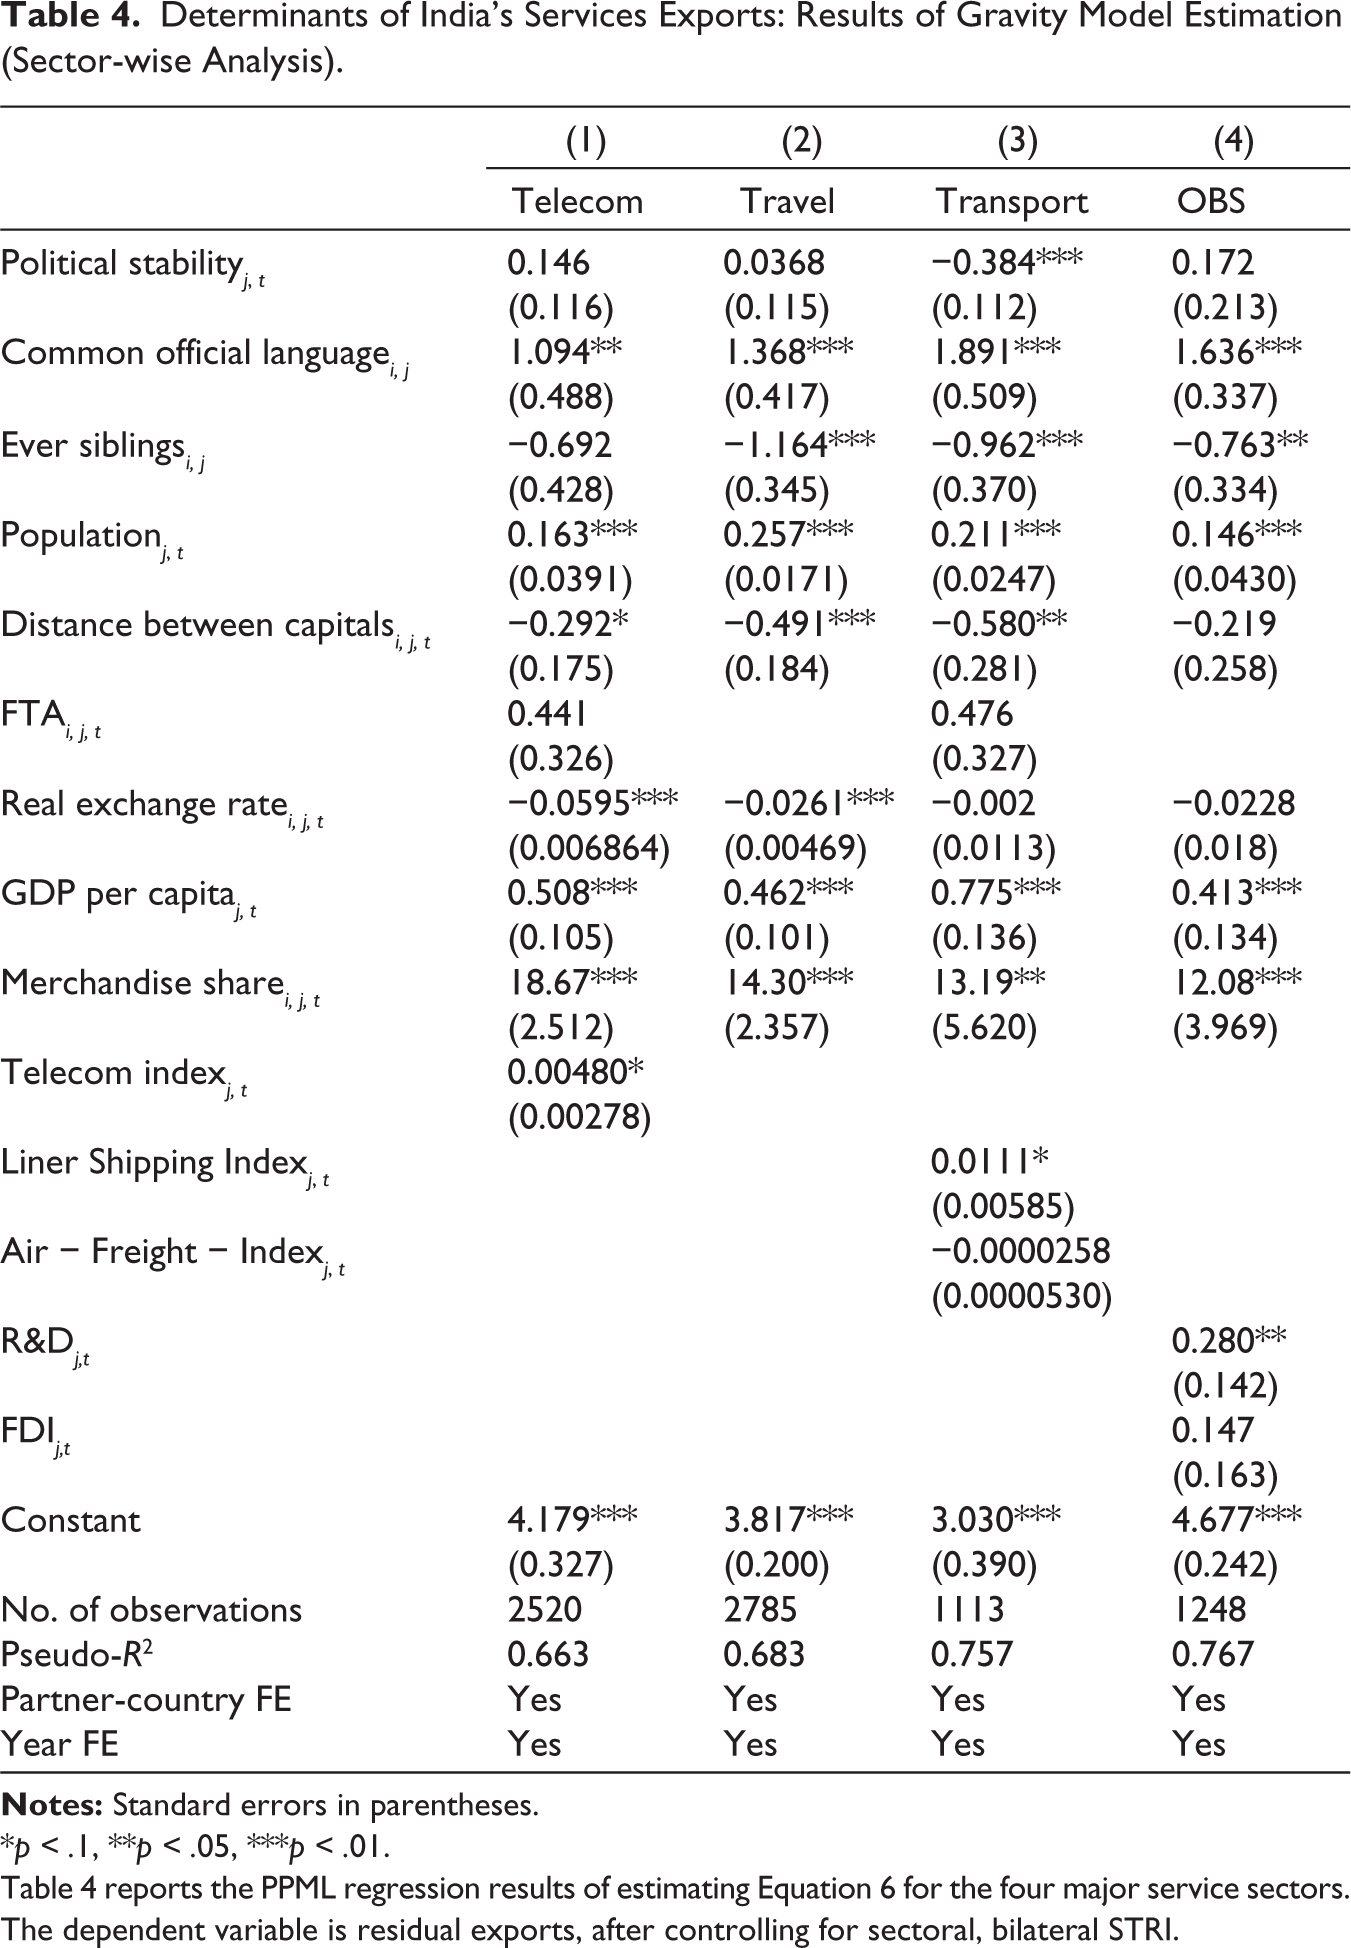
*p < .1, **p < .05, ***p < .01.
Table 4 reports the PPML regression results of estimating Equation 6 for the four major service sectors.
The dependent variable is residual exports, after controlling for sectoral, bilateral STRI.
Common results across sectors show that a shared official language, 15 higher GDP per capita and population of the partner country, and stronger merchandise trade links all significantly increase services exports. A common colonial link reduces exports in most sectors, except telecommunications, where it is insignificant. Distance shows heterogeneous effects: it negatively affects travel and transport: sectors where physical proximity matters, but is insignificant for OBS, where services are digitally tradable. In telecommunications, distance is only weakly significant (10%), again reflecting reduced relevance of geography in communication services. Political stability and FTAs are generally insignificant across sectors, consistent with earlier results.
Sector-specific variables show expected patterns. In telecommunications, the Telecom Penetration Index is positive and significant, indicating that better telecom infrastructure in partner countries supports higher exports. In transport, air freight is insignificant, but the Liner Shipping Index is positive and weakly significant, highlighting the role of maritime connectivity. In OBS, R&D intensity positively affects exports, while FDI is insignificant. The overall model fit ranges from 0.66 to 0.76, indicating that 66%–76% of the variation in residual exports is explained.
Conclusion
This study advances the literature on services trade in India by providing a detailed examination of the trends and determinants of India’s bilateral services exports across 12 sectors and ~180 partner countries between 2005 and 2021. Despite India’s growing role in global services trade (~4% share), empirical evidence remains limited due to data constraints and the heterogeneous nature of services.
We show that India’s exports are concentrated in telecommunications and OBSs, where it retains comparative advantage. However, RCA in telecommunications has declined over time, not due to falling exports but due to rising global competition, particularly from Ireland and China. Transport and travel remain relatively weak in comparative advantage terms. Major services export destinations include the United States, the United Kingdom, China, Hong Kong and Singapore.
We estimate sector-specific STBs using gravity residuals and find that countries such as the United States, the United Kingdom, Germany, the Netherlands and Singapore impose the lowest barriers on Indian services. Controlling for STBs, we also estimate the sectoral gravity model to investigate the determinants of Indias services exports. Results show that distance is less important for services than goods 16 and becomes insignificant in OBS and in developed-country subsamples, highlighting the reduced role of geography in digitally deliverable services.
Heterogeneity is evident across country groups. Population and language matter more for developed-country partners, reflecting stronger market size and communication-driven demand (especially for IT and consulting services). In contrast, GDP per capita and exchange rates matter more for developing countries, indicating more price-sensitive demand. Goods–services linkages remain consistently strong, confirming complementarities between merchandise and services trade. FTAs are largely insignificant, suggesting limited effectiveness and low utilisation of India’s agreements.
Sector-specific drivers also matter: telecom infrastructure supports telecom exports, shipping connectivity boosts transport exports and R&D intensity drives OBS exports. Overall, this study highlights the structure and determinants of India’s services trade and shows that traditional trade frictions behave differently in services, especially in digitally intensive sectors. Future work could build on this analysis by using more finely disaggregated data, distinguishing between types of non-tariff barriers—such as regulatory, technical and financial barriers—and employing different estimation techniques to measure STBs.
Supplemental Material
Supplemental material for this article is available online.
Footnotes
Data Availability Statement
All data used in this study are publicly available. For more details, see the section ‘Data’ in the article.
Declaration of Conflicting Interests
The authors declared no potential conflicts of interest with respect to the research, authorship and/or publication of this article.
Funding
The authors received no financial support for the research, authorship and/or publication of this article.
Notes
References
Supplementary Material
Please find the following supplemental material available below.
For Open Access articles published under a Creative Commons License, all supplemental material carries the same license as the article it is associated with.
For non-Open Access articles published, all supplemental material carries a non-exclusive license, and permission requests for re-use of supplemental material or any part of supplemental material shall be sent directly to the copyright owner as specified in the copyright notice associated with the article.