






Abstract
This study examines productivity spillovers across Turkish sectors and investigates the impact of global value chain participation on productivity within and across sectors using the World Input–Output Database 2016. An input–output weight matrix is constructed to model inter-sectoral dependencies, and a spatial autoregressive model is estimated to capture the transmission of productivity shocks through sectoral linkages. The relationship between GVC participation—through backward and forward linkages—and productivity is also analysed. The findings reveal significant productivity spillovers across all sectors through intermediate input dependencies. Backward linkages are associated with a ‘local’ substitution pattern that decreases productivity, while forward linkages increase it across sectors. To account for sectoral heterogeneity, manufacturing and service sectors are examined separately. In manufacturing, backward linkages show a negative impact on productivity both within and across sectors, while forward linkages exhibit significant local effects. In services, productivity increases with forward linkages across sectors.
Introduction
With advances in transportation and communication technologies, improvement of infrastructure facilities and falling trade barriers, international economic integration has grown rapidly and become organised around the concept of global value chain (GVC). Access to new modes of specialisation has led firms to slice production into tasks performed at different locations to optimise factor costs (Feenstra & Hanson, 1997; Grossman & Rossi-Hansberg, 2008). The fragmentation of the production process has stimulated substantial growth in trade in final and intermediate goods, where intermediate goods and services cross borders multiple times along supply chains. As a result, the multiple counting of the value-added along these chains makes traditional trade indicators a poor approximation of the trade statistics. New measures of trade-in value-added have been introduced to capture economies’ integration into the GVC. In particular, the share of foreign value-added embodied in exports is used as a measure of linkages (GVC participation from an importer’s standpoint), while the share of value-added embodied in third countries’ exports is used as a measure of linkages (GVC participation from an exporter’s standpoint; Hummels et al., 2001; Koopman et al., 2014).
The impact of participation in the GVC on economies has been increasingly explored, with particular emphasis on employment, productivity and knowledge spillovers. Constantinescu et al. (2019) studied the impact of backward linkages on productivity for 40 countries across 13 manufacturing industries and concluded that GVC integration boosts productivity. However, their study does not account for cross-sector productivity spillovers or the indirect effects of GVC participation, which are central to our analysis. Moreover, this article focuses on Türkiye and captures features specific to its economy, making the estimation results more targeted in capturing the associations between trade indicators and productivity. Baldwin and Robert-Nicoud (2014) note that productivity gains associated with GVC integration may accrue through different channels, such as increased competition, access to a wider variety of inputs, learning externalities and technology spillovers. Using intercountry input–output tables, Kummritz (2016) empirically examines the impact of GVC integration on labour productivity and finds that labour productivity rises significantly with forward linkages but is not associated with backward linkages. Dine (2019) studies the impact of backward and forward linkages on employment in Türkiye and finds that employment rises with backward linkages and declines with forward linkages, while also reporting significant spillover effects across industries.
Dine and Chalil (2021) examine the impact of GVC backward linkages and the domestic content in exports (DVA) on labour productivity and employment in Japan. They find that DVA boosts both productivity and employment, while backward linkages reduce productivity and displace labour, particularly in service sectors.
This article builds upon and advances the previously cited studies. First, we introduce a spatial econometric framework to model the cross-industry productivity diffusion via input–output linkages. This enables us to estimate not only the direct effects of GVC participation but also indirect effects transmitted across sectors, which were not accounted for in Dine and Chalil’s (2021) analysis for Japan. Second, this article extends the Japanese analysis to the case of an emerging economy, which enables examining the GVC participation impact on productivity for different economic structures and levels of development.
Industries are interconnected through the use of intermediate inputs in their production processes. Balassa (1961) argues that linkages between sectors are key sources of productivity spillovers and that the magnitude of these spillovers is further amplified by the transmission of technological improvements.
While the impact of GVC participation on productivity is well documented in the literature, little has been done to examine the cross-sector productivity transmission effects that arise through input–output dependencies. Some exceptions are the studies by Badinger and Egger (2008) and Dine (2019). Badinger and Egger (2008) employ a spatial econometric approach to model total factor productivity spillovers at the research and development (R&D) industry level, as well as residual spillovers unrelated to knowledge spillovers, using an autoregressive error model. They document significant intra- and inter-industry knowledge spillover effects in productivity. Dine (2019) uses a spatial lag of X (SLX) model to examine the impact of GVC integration on employment in Türkiye as well as the associated spillover effects, reporting significant direct and indirect effects of GVC participation on employment.
This study focuses on productivity spillovers and the impact of GVC participation, through backward and forward linkages, on labour productivity in Türkiye, using the World Input–Output Database (WIOD) 2016 and socio-economic accounts (SEA). The impact of international trade on productivity in Türkiye has been examined in the literature. Filiztekin (2004) demonstrates that trade liberalisation and increased import and export penetration enhance productivity at the sector level. Ozler and Yilmaz (2009) conveyed that a decline in trade barriers is significantly associated with productivity improvement in manufacturing sectors. Altun et al. (2025) find that while backward GVC participation lowers labour productivity, forward linkages increase productivity.
This study takes a step further in exploring and understanding how international trade affects productivity at the sector level in Türkiye. To the best of our knowledge, this article is the first to examine the implications of GVC participation on labour productivity in Türkiye while empirically analysing cross-sector productivity spillover effects through input–output linkages. That is, we argue that changes in labour productivity in one sector are likely to be transmitted to other sectors through input–output relations. Furthermore, we hypothesise that changes in GVC participation through backward and forward linkages in one sector are likely to affect productivity not only in that sector but also in sectors connected to it via input–output linkages. These channels of spillover transmission are modelled using a row-standardised input–output weight matrix.
Our results are threefold. First, using a spatial autoregressive (SAR) model selected based on goodness-of-fit criteria, we document significant spillover effects across sectors via input–output linkages. Second, we find that a 10% increase in backward linkages is associated with a 1.2% decrease in overall labour productivity, whereas a 10% increase in forward linkages leads to a 0.95% increase in overall labour productivity. Third, a sectoral decomposition reveals that the negative effect of backward linkages on productivity is mainly driven by manufacturing sectors, due to import competition crowding out domestic value-added, while productivity rises with forward linkages in services, consistent with learning-by-exporting mechanisms.
Data
WIOD and SEA Data
This study uses the WIOD 2016 and the SEA, compiled by Timmer et al. (2015). The WIOD provides data on input–output and final goods flows for 43 countries across 56 sectors from 2000 to 2014. The SEA contains information on employment, value-added, capital stock and other variables over the same period (2000–2014). Combining these two data sets enables the calculation of backward and forward linkages as well as labour productivity.
Labour productivity is calculated as the value-added per employee. We calculate backward linkages, forward linkages and labour productivity for all sectors in all countries in the WIOD, then restrict our analysis to sectors in Türkiye. A summary of the main variables is reported in Table 1.
Summary Statistics of the Variables.
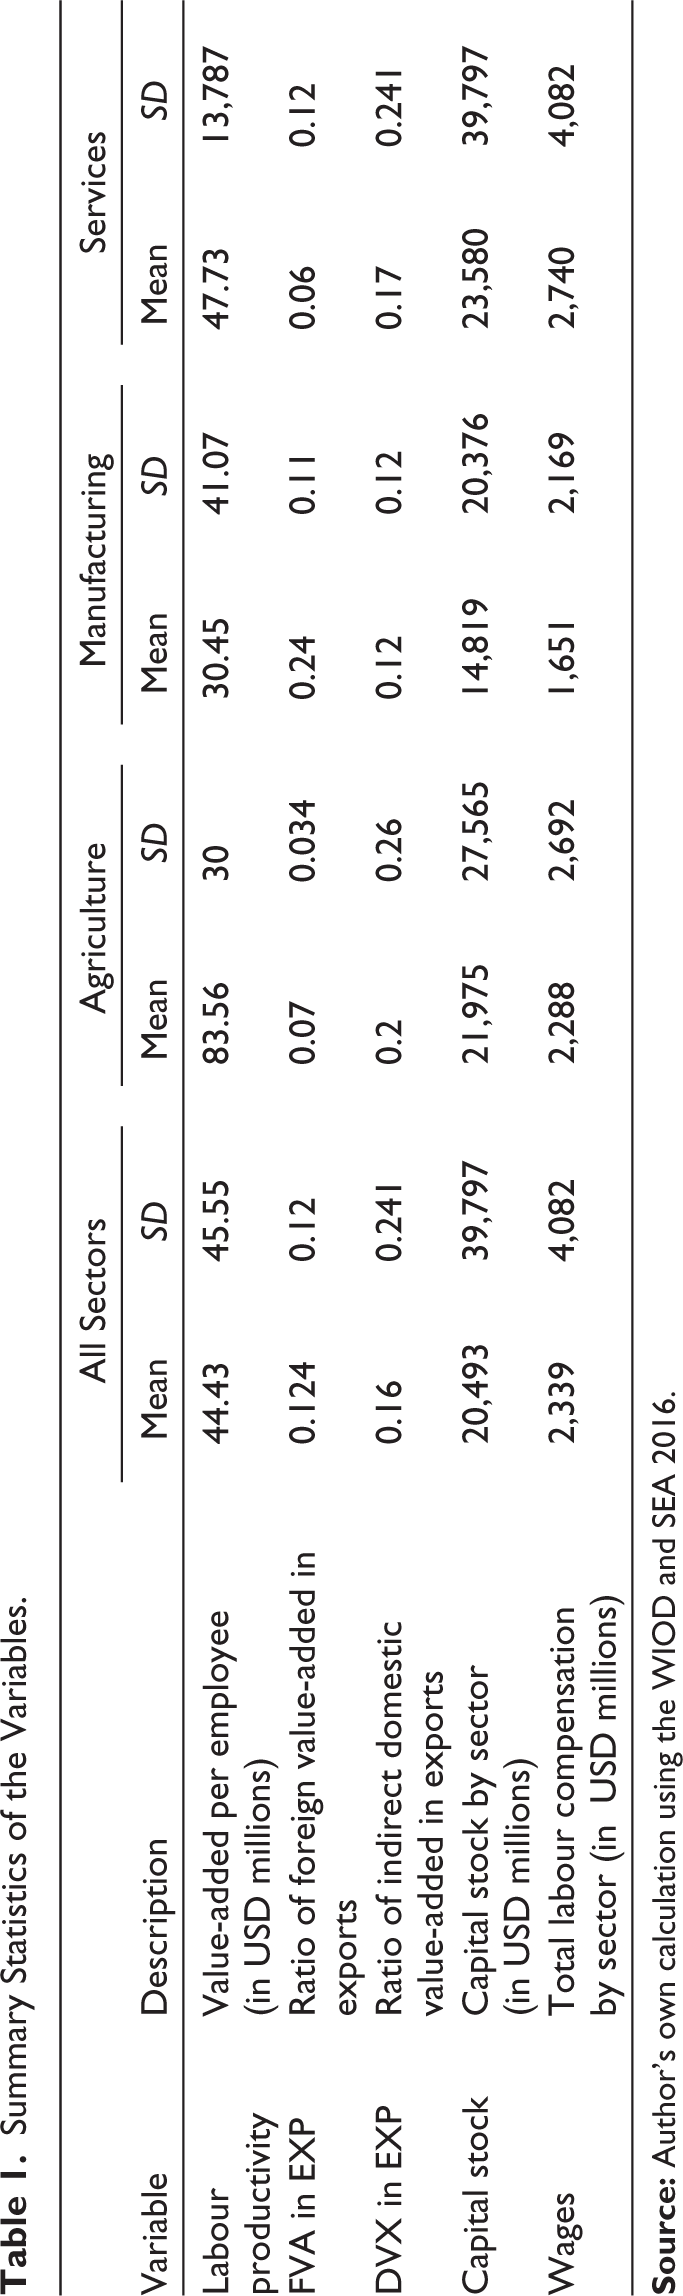
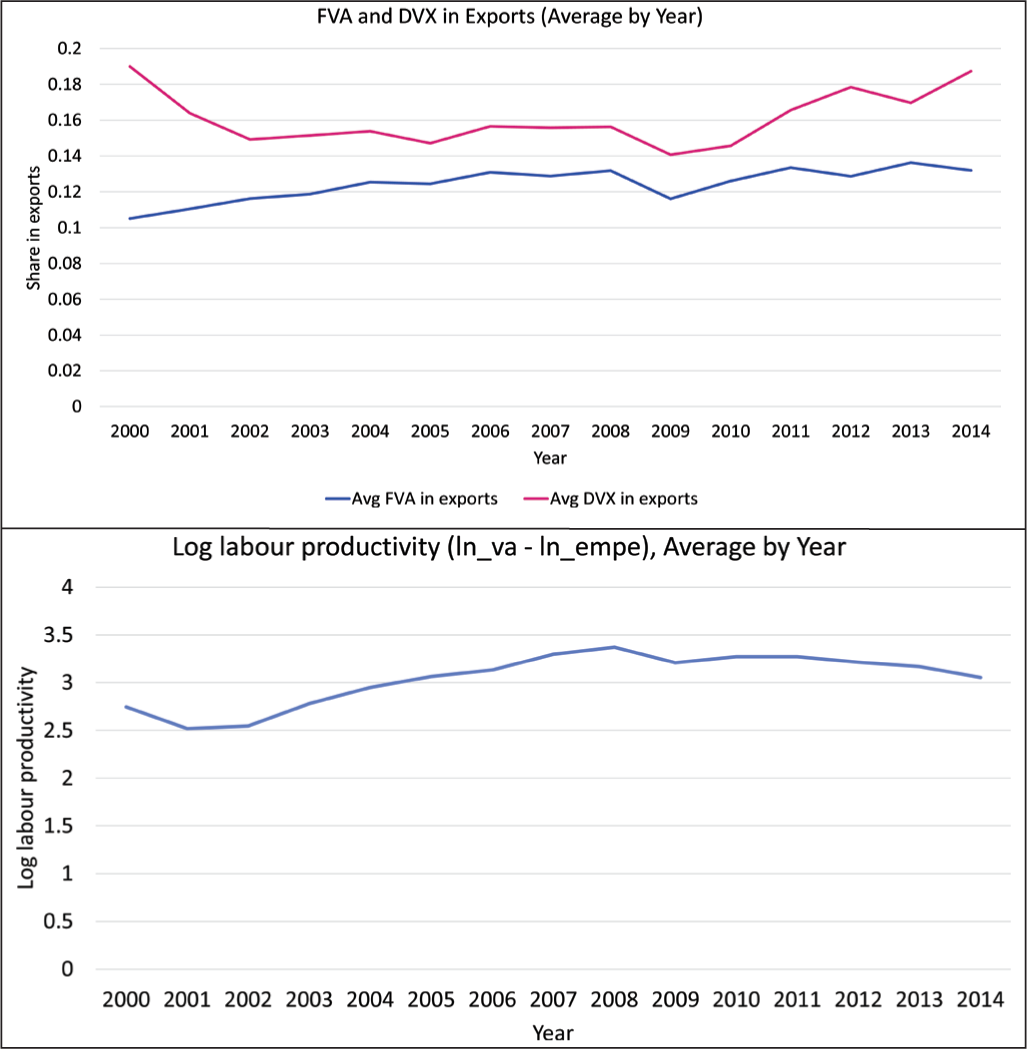
Figure 1 illustrates the average time trends for labour productivity, backward linkages (foreign value-added (FVA) in exports) and forward linkages (indirect value-added (DVX) in exports) over the period 2000–2014. FVA in exports shows a steady increase, reflecting Türkiye’s growing integration into global value chains. DVX in exports remains relatively stable with slight growth. Labour productivity rose sharply during the mid-2000s, reflecting recovery and structural reforms after the 2001 Turkish economic crisis, and peaked around 2007–2008. However, it declined substantially following the 2008 global financial crisis, reflecting the adverse impacts of reduced global demand and economic slowdown.
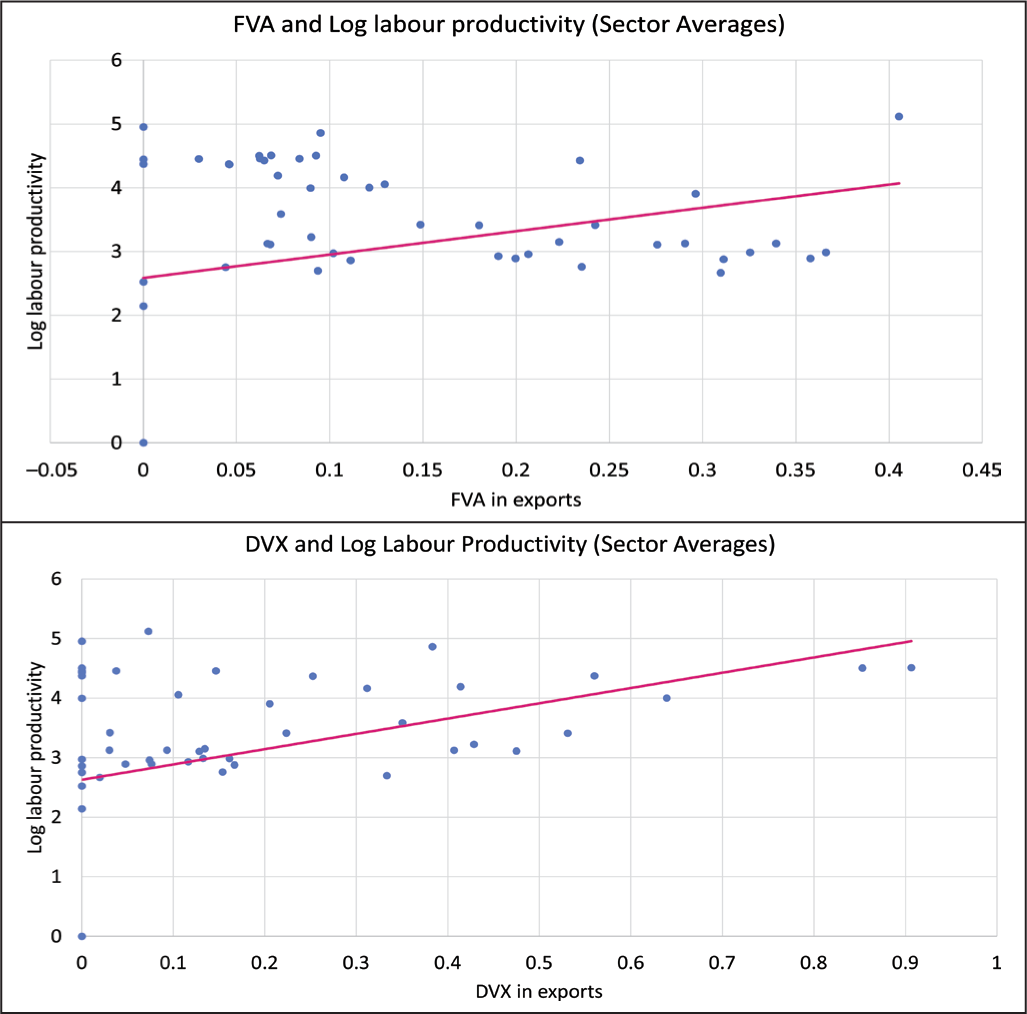
The scatterplot in Figure 2 shows the time averages for labour productivity and backward (FVA) and forward (DVX) linkages. The variables appear to be positively correlated with labour productivity, exhibiting upward trends. However, these visible associations are likely driven by additional unobservable factors, suggesting the need for an econometric approach that can properly capture the relationships while controlling for both sector heterogeneity and time-variant shocks.
Input–Output Weight Matrix
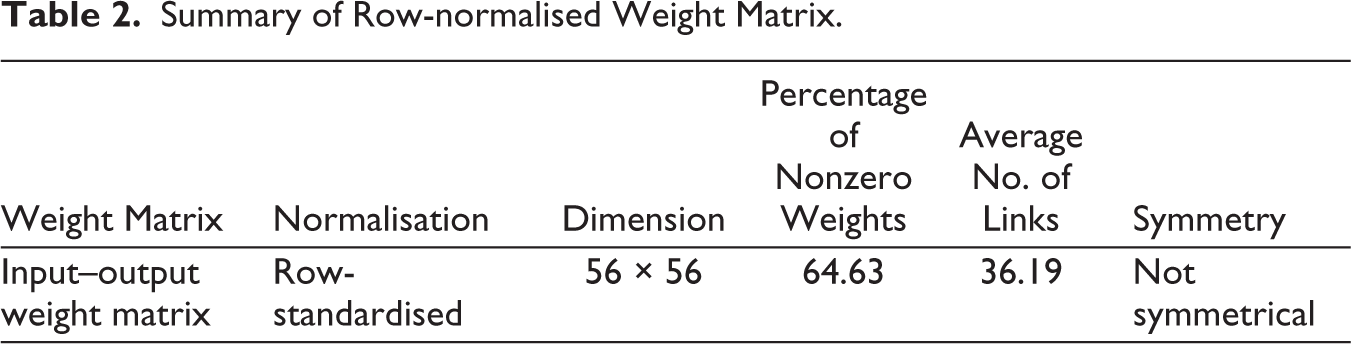
In this study, we capture connections between sectors using input–output relations. We consider the average use of intermediates over the study period as a proxy for cross-sector connections in terms of intermediate goods and services used in production. We therefore calculate the time-averaged value of intermediate use for each sector and use it to construct a weight matrix whose column entries are formed by the average purchase of intermediates by sector j sourced from sector i, resulting in a 56×56 matrix. To address measurement-unit errors, we row-standardise the matrix, ensuring proper implementation in the spatial model specifications. This process yields a row-standardised weight matrix that captures interdependencies between sectors through input–output linkages.
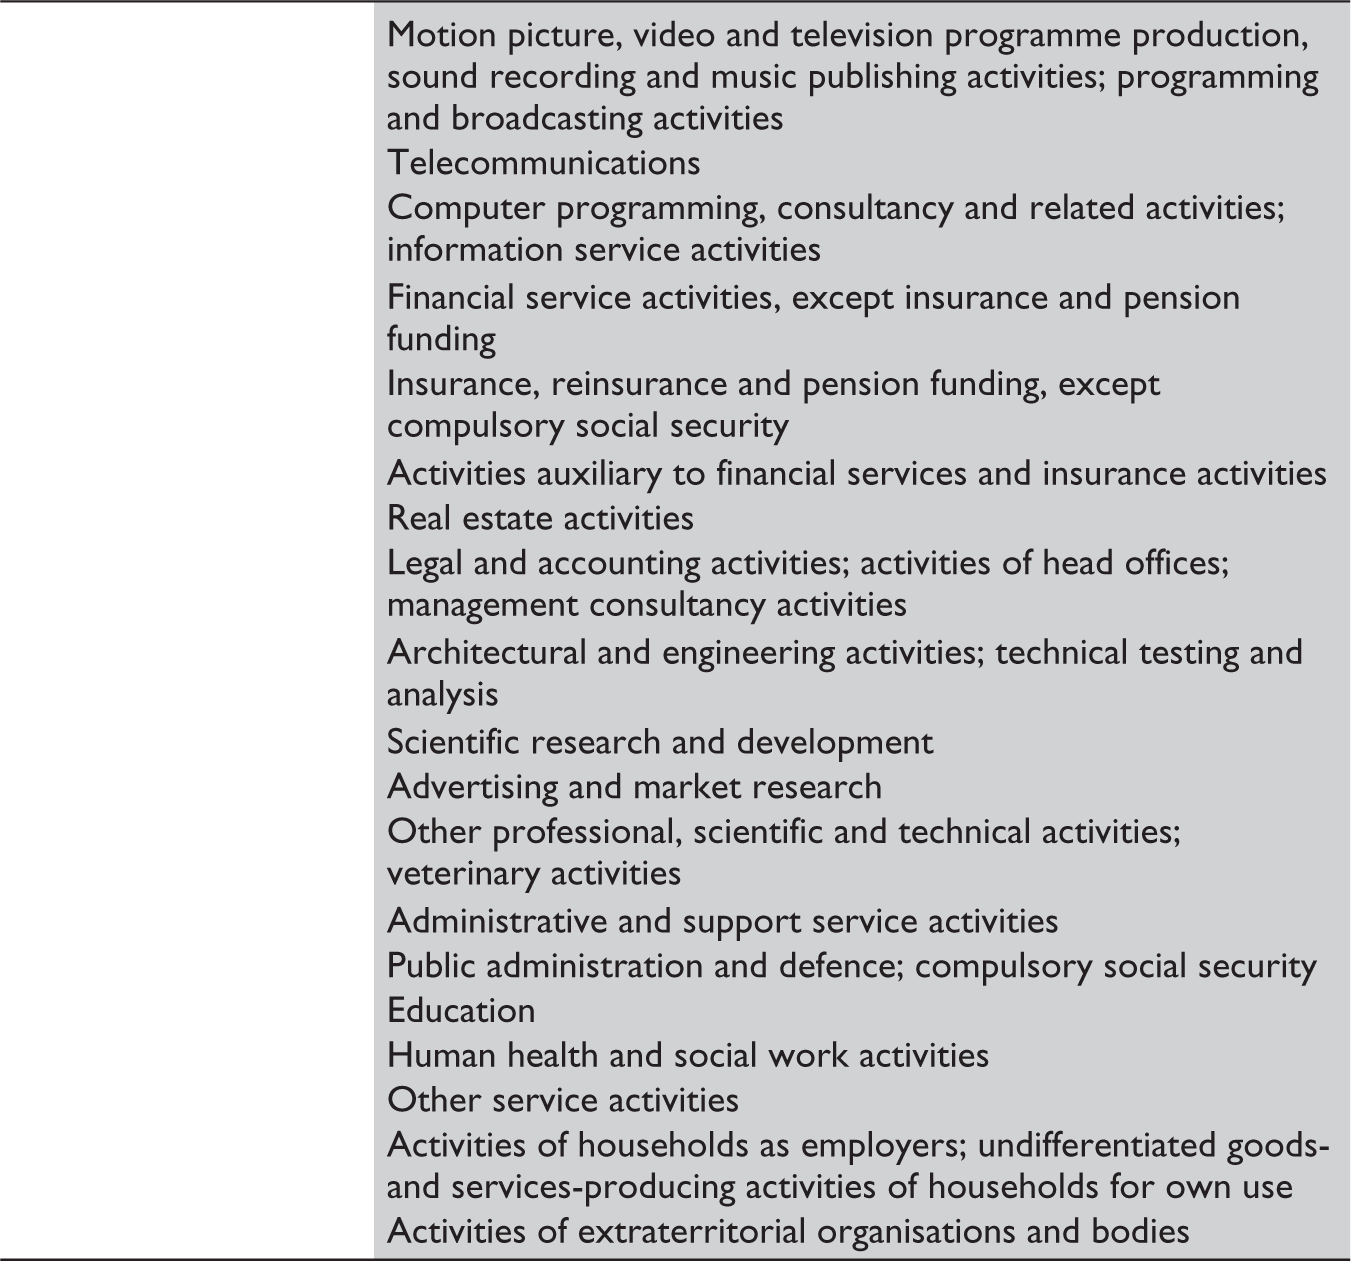
The sectors used in this study are based on the International Standard Industrial Classification of All Economic Activities, Revision 4 (ISIC Rev. 4), which is the industry classification system underlying the WIOD 2016 database. The WIOD organises its 56 sectors according to this classification, covering the full range of economic activities from agriculture and mining to manufacturing and services. The mapping between the WIOD sector codes and ISIC Rev. 4 groups is provided in the WIOD documentation (Timmer et al., 2015).
If the weight matrix captures only the average interdependence between these broad sectors, it may understate the intensity of linkages between specific sub-sectors while overstating others. Finer disaggregation is associated with several challenges. First, more disaggregated input–output tables require detailed data on inter-industry transactions, which are typically available only at the national level through supply-and-use tables and may not be harmonised across countries for the construction of a global input–output database like the WIOD. Second, increasing the number of sectors raises the dimensionality of the weight matrix, which can lead to estimation challenges in the spatial econometric model.
Methodology and Empirical Models
This study follows Hummels et al. (2001) in calculating backward and forward linkages using the WIOD.
Backward linkages are calculated as the share of FVA in exports to gross exports—that is, the import of intermediates used in a country’s exports, normalised by gross exports. Forward linkages are calculated as the share of exports of intermediates used in third-country exports to gross exports. The WIOD provides information on the export and import of goods according to end use as well as origin and destination, enabling the tracing of the value-added content in exports and imports.
Empirical Models
The econometric approach follows Constantinescu et al. (2019) and rests on a production specification that manifests the value-added in sector i in time t as a function of the inputs of capital stock K and labour L as follows:

where Ait is the technology shifter of sector i in time t, assumed here to be driven by trade-related variables
Summary of Row-normalised Weight Matrix.
Dividing the production function by the labour input, assuming a Cobb–Douglas production function and taking the logarithm yield the following model specification:

where Pit is the labour productivity and Ki, t is the capital in sector i and time t. We control for sectors’ heterogeneity and time-variant components by adding sector- and time-fixed effect parameters ϕi and τt, respectively. Adding a stochastic error term, the equation becomes as follows:

We augment the model with a wage variable, arguing that higher wages tend to motivate higher productivity (Becker, 1964; Shapiro & Stiglitz, 1984). Including wages may be regarded as a source of reverse causality because higher productivity would induce higher wages (through rent-sharing, skill upgrading, etc.), which in turn could raise productivity further. We attempt to address this simultaneity by using lagged explanatory variables, expecting productivity to react to changes in the explanatory variables with a delay.

The regression coefficients are interpreted as elasticities. That is, as percentage changes in the dependent variable caused by percentage changes in the corresponding explanatory variable.
A key contribution of this study is to examine spillover effects that may arise in labour productivity across sectors. To illustrate, consider two sectors, a and b, where sector a relies on intermediates sourced from sector b (and vice versa). Assume a stochastic shock boosts productivity in sector b. This shock is likely to transmit to sector a, causing productivity in sector a to rise as well. In fact, sector a’s access to intermediates from sector b will increase, leading to productivity growth. Consequently, this study examines productivity spillovers across sectors in Türkiye through the use of intermediates as a channel of transmission (Amiti & Konings, 2007).
It is unlikely that variables included in Equation 4 are readily able to capture latent influences. That is, the spillover effects can be caused by omitted variables that are not included in the econometric specification (LeSage & Pace, 2009). One way of modelling the spillover effects is by adding an input–output weight-dependent variable ρW to the right-hand side of the regression, where W is the weight matrix capturing sectors’ interconnections. Therefore, the transmission of productivity throughout sector linkages is considered in the model specification. In spatial econometrics, the SAR model, which includes a spatial lag of the dependent variable, is often considered. In this study, we use the SAR model with an input–output weight matrix W, where each element wij measures the strength of the input–output linkage between sector i and sector j, based on intermediate input flows.

Or in a matrix form:

In this specification, changes in explanatory variables in one sector, which are referred to as direct effects, do not influence productivity only in that sector, but potentially in all the other sectors through the input–output relations, which are referred to as indirect effects. Furthermore, changes in the productivity in one sector are transmitted to connected sectors through the input–output relations, with the magnitude of the average effect captured by a dependence parameter ρ. This specification also helps address endogeneity due to omitted variables correlated with the dependent variable across sectors. Consequently, the coefficients of the independent variables are not marginal effects, because the partial derivative of the dependent variable with respect to a given explanatory variable is not equal to the corresponding coefficient. This can be seen by writing the model in Equation6 as a data-generating process:

Equation 6 specifies the SAR model as follows:

where y is the vector of labour productivity across sectors, W is the input–output weight matrix, Wy is the spatial lag (i.e., the weighted average of productivity in interconnected sectors) and ρ is the spatial autoregressive parameter. The key insight is that the inclusion of Wy on the right-hand side creates a system of simultaneous equations, whereby productivity in sector i depends on productivity in all sectors j that supply intermediates to i (or receive intermediates from i), as captured by the weights wij. This means that a productivity shock in one sector propagates to connected sectors through the input–output network, and the magnitude of this propagation is governed by ρ and the structure of W.
Equation 7 rewrites the SAR model as a data-generating process by solving for y:

The term (I − ρW)⁻¹ is the Leontief inverse of the spatial system. The partial derivative of y with respect to an explanatory variable in sector k yields:

This derivative is a matrix. The diagonal elements represent the direct effects, the impact of a change in an explanatory variable in sector i on the productivity in sector i itself, which includes feedback loops passing through connected sectors and returning to sector i. The off-diagonal elements represent the indirect effects, the impact of a change in an explanatory variable in sector i on productivity in sector j (where j ≠ i), transmitted through the input–output linkages. The total effect is the sum of direct and indirect effects. Intuitively, when backward linkages increase in sector i, productivity in sector i is directly affected (the substitution effect), but this change also affects the productivity in sectors that are connected to sector i through the input–output network, as they experience changes in the demand for their intermediates. These cross-sector transmissions constitute the indirect effects (LeSage & Pace, 2009).
Moreover, a significant dependence parameter ρ suggests ‘global spillover effects’, whereby changes in productivity in one sector set in motion a sequence of adjustments throughout sectors with feedback effects. This motivates testing whether spillover effects are local or global in nature. Local spillover effects are confined to sectors with similar characteristics, which we can capture by allowing an autoregressive process in the error term, as in Equation 8:

The specification in Equation8 is known in the literature as the Spatial Error Model (SEM). In this model, the coefficients are straightforwardly interpreted as marginal effects because the dependence parameter in the error term (λ) does not enter into the computation of partial derivatives. We also clarify whether spillovers are global or local using Wald and likelihood–ratio tests.
Results
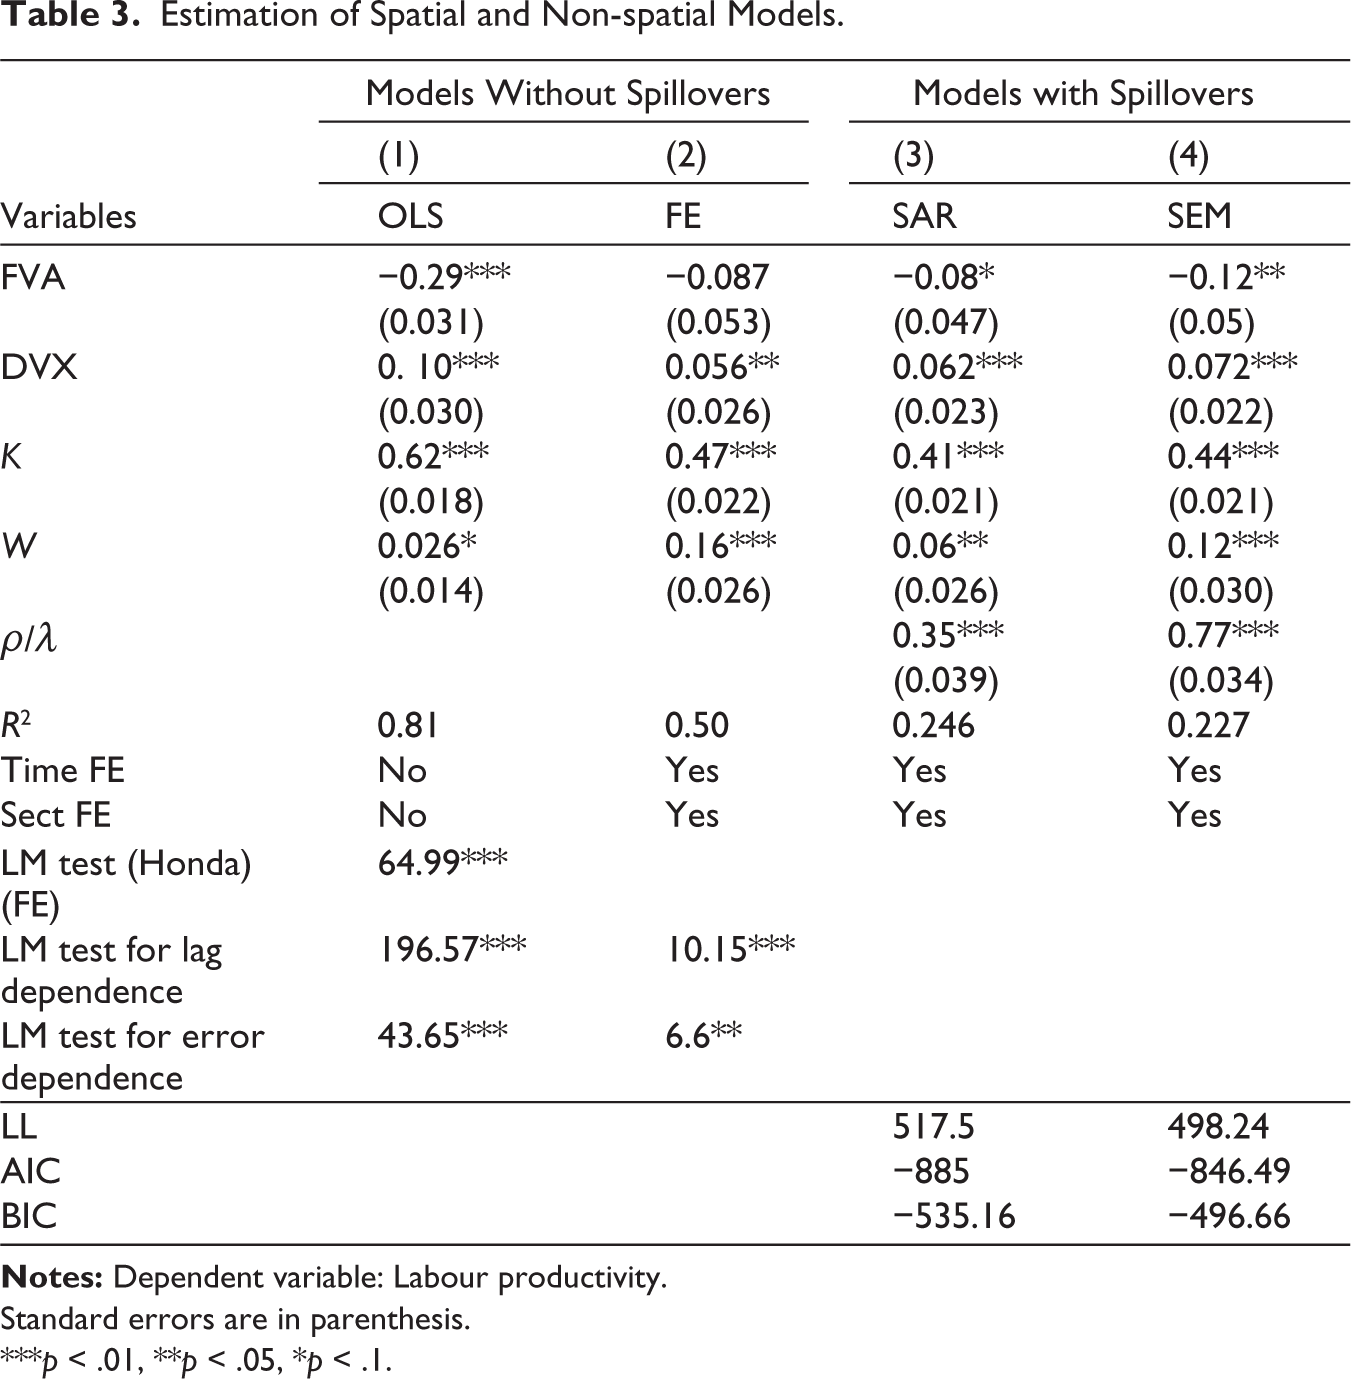
Table3 provides the estimation results of the econometric models introduced above. We first estimate the pooled ordinary least squares (OLS) and fixed-effects (FE) models without accounting for spillover effects. In Column1, the OLS estimates indicate that backward linkages are negatively associated with labour productivity, with an effect magnitude of –0.29, suggesting that productivity declines as the import of inputs used in exports grows. Labour productivity rises with forward linkages—that is, the export of inputs used in another country’s exports to third economies. Labour productivity also increases with capital stock and wages. The OLS model serves here as a benchmark as we move to more advanced econometric models.
Estimation of Spatial and Non-spatial Models.
Standard errors are in parenthesis.
***p < .01, **p < .05, *p < .1.
Honda’s Lagrange multiplier test points to significant sector and time effects. In Column2, we estimate the FE model, controlling for sector and year fixed effects. The results show that while the effect of backward linkages on productivity is insignificant, the effect of forward linkages is positive and significant, suggesting that by supplying inputs to downstream GVC participants, Turkish sectors gain exposure to advanced technologies, larger markets and economies of scale, which drive productivity improvements (Constantinescu etal., 2019; Kummritz, 2016).
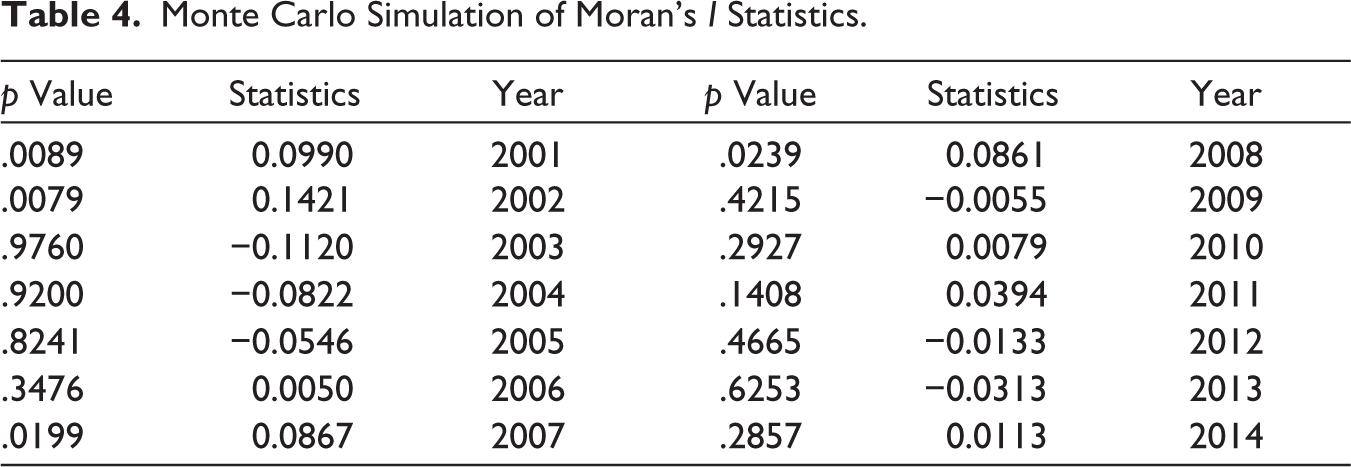
Although the FE model presents a significant improvement compared to pooled OLS, it fails to account for spillover effects that may arise from sector interconnections, which can manifest either in the error term or in the dependent variable. We test the error terms for interdependencies through the input–output weight matrix in the FE model using Moran’sI statistics. Table4 provides the test results.
Monte Carlo Simulation of Moran’s I Statistics.
Moran’s I is a measure of spatial autocorrelation that tests whether the values of a variable observed across cross-sectional units (in our case, sectors) are randomly distributed or exhibit systematic patterns of correlation that are consistent with the structure of a pre-specified weight matrix. Formally, Moran’s I is computed as:

where N is the number of sectors, wij are the elements of the row-standardised input–output weight matrix W, xi is the labour productivity residual in sector i, x– is the mean of the residuals and S is the sum of all weight matrix elements. In our context, a statistically significant positive Moran’s I indicates that sectors with high productivity residuals tend to be connected—through input–output linkages—to other sectors that also exhibit high productivity residuals, and similarly for low residuals. In other words, productivity residuals are not independent across sectors but exhibit systematic clustering, consistent with the interdependencies captured by the weight matrix. To assess statistical significance, we employ a Monte Carlo randomisation procedure in which the observed residuals are randomly permuted across sectors, generating a reference distribution of Moran’s I under the null hypothesis of no spatial autocorrelation. A significant result implies that cross-sector interdependencies, as modelled by the input–output weight matrix, are present in the residuals, and therefore, a spatial econometric model is warranted.
We generate Moran’s I 3 statistics using a Monte Carlo randomisation technique to form the distributions. The results show several significant Moran’sI statistics, suggesting cross-sector interdependencies that need to be addressed. Moreover, in Table3, the LM test for error dependence further supports Moran’sI results. Interestingly, the LM test points to significant spillover in the dependent variable, suggesting the need to identify the nature of spillovers across sectors.
To do so, we estimate both the SAR model, including the Wy term, and the SEM model, including the weighted error term Wϵ. Table 3 shows that the spillover parameters ρ for the SAR model and λ for the SEM model are both positive and statistically significant.
As previously noted, the SAR model points to global spillover effects, while the SEM model points to local spillovers confined within sectors with non–null entries in the weight matrix. It is therefore necessary to determine the nature of the spillover effects before interpreting the results.
Elhorst (2010) conveys that, in the case of strong dependencies, the goodness-of-fit criterion can be adequate for model selection. That is, one can choose the model exhibiting the highest goodness-of-fit values. Following Elhorst (2010) and according to Table 3, the likelihood, AIC and BIC statistics point to the SAR model as the data-generating process. Therefore, the spillover effects are global, and changes in explanatory variables affect productivity within and across sectors, as translated by the significance of the spatial parameter ρ.
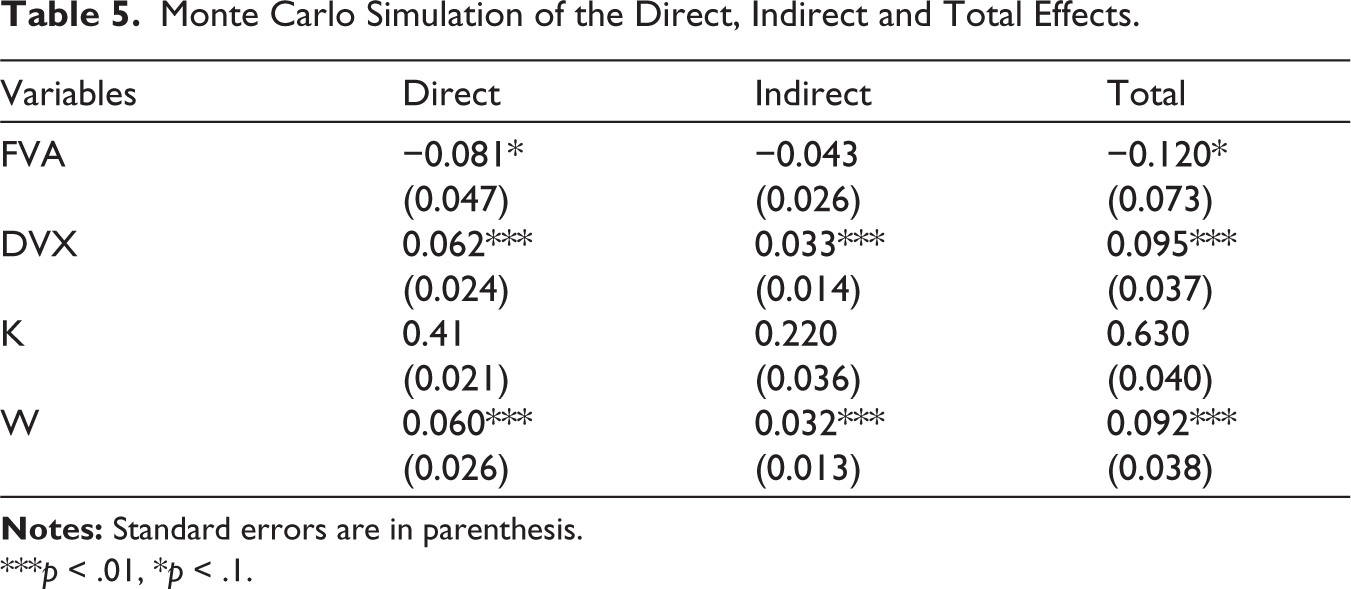
As emphasised earlier, direct and indirect effects do not correspond to marginal effects in SAR models. Hence, following LeSage and Pace (2009), we simulate the distributions of the direct, indirect and total effects by drawing from a multivariate normal distribution of the point estimates reported in Table3; the results are shown in Table5.
Monte Carlo Simulation of the Direct, Indirect and Total Effects.
***p < .01, *p < .1.
First, failing to account for spillover effects in labour productivity leads to underestimating total effects in the FE model specification. The coefficient of backward linkages becomes statistically significant, with a total effect of –0.12, suggesting that productivity declines as imports of intermediates used in exports increase. Backward linkages measure the share of FVA in a country’s exports; when this share rises, domestic value-added constitutes a smaller portion of gross output. Since labour productivity is measured as value-added per worker, a compositional shift from domestic to FVA reduces the numerator without a proportionate reduction in employment, lowering measured productivity. Imported intermediates thus replace domestically produced ones, eroding the domestic value-added base. This substitution channel is particularly relevant for Türkiye, where many manufacturing sectors operate in the middle of the smile curve with low value-added content. Altun et al. (2025) confirm this pattern for Turkish firms, finding that backward GVC participation lowers productivity, especially in low-tech firms, due to limited spillovers from foreign suppliers. Similarly, Dine and Chalil (2021) report a negative effect of backward linkages on productivity in Japan, suggesting the substitution effect dominates across diverse economic structures. We acknowledge that the conventional positive channel—through cost reduction and input variety—may operate for specific sectors or firm types, but the net effect in the Turkish manufacturing context tilts negative.
Another mechanism through which backward linkages lower productivity is through composition, quality and innovation effects. Not all imported intermediates carry the same productivity-enhancing potential. When the increase in backward linkages is driven by low-cost, low-technology intermediates sourced from lower-wage economies, the expected technology transfer and learning effects may be minimal, while competitive pressure from cheaper imports can erode the market share of domestic suppliers. Furthermore, easy access to foreign inputs can reduce incentives for domestic R&D and process innovation, crowding out domestic supplier industries—particularly in sectors with low R&D intensity, as is the case for Turkish manufacturing (OECD, 2016).
These findings point to the importance of examining the cross-country effect of backward linkages on productivity while controlling for sector interconnections and spillover effects.
We find that labour productivity rises with forward linkages both within and across sectors. In particular, a 10% increase in forward linkages increases labour productivity by an overall effect of up to 0.95%. These findings show that ignoring spillover effects across sectors leads to an underestimation of the magnitude of the effects on productivity.
Finally, productivity rises with wages both within and across sectors, which aligns with the efficiency-wage theory, where firms pay workers above-market wages to boost productivity. High wages reduce turnover, attract skilled workers and increase the cost of job loss, leading employees to increase their effort, which in turn raises productivity.
Next, we examine the impact of GVC participation on productivity while accounting for spillover effects separately for manufacturing and service sectors. On the one hand, GVC participation in manufacturing often involves tangible tradable goods. Spillovers may arise from technology embedded in imports (backward) or from learning through supplying specialised inputs (forward). Conversely, service-sector GVC participation is associated with intangible goods, and spillovers may come from knowledge transfer and exposure to foreign demands via forward linkages. The smile curve implies that a high value-added is captured in pre- and post-manufacturing stages. Manufacturing sectors positioned near the middle of the smile curve capture the lowest value-added in the chain; therefore, their productivity is more sensitive to cost competition from imported intermediates, suggesting a negative effect of backward linkages (Dine & Chalil 2021). On the other hand, service sectors are more engaged in high-value-added segments of the chain, making their productivity more susceptible to benefits from knowledge-intensive linkages and market integration (forward linkages; De Loecker, 2013). This indicates that productivity in manufacturing and service sectors may be structurally different. While studies such as Constantinescu etal. (2019) have focused on manufacturing sectors and omitted services due to trade-intensity and data-accuracy concerns, we believe that the WIOD and SEA data sets allow for a systematic approximation that can provide essential information on productivity diffusion and GVC participation in service sectors. Consequently, we first estimate spillovers and GVC participation for manufacturing sectors 4 and then extend the estimation to include service sectors. 5
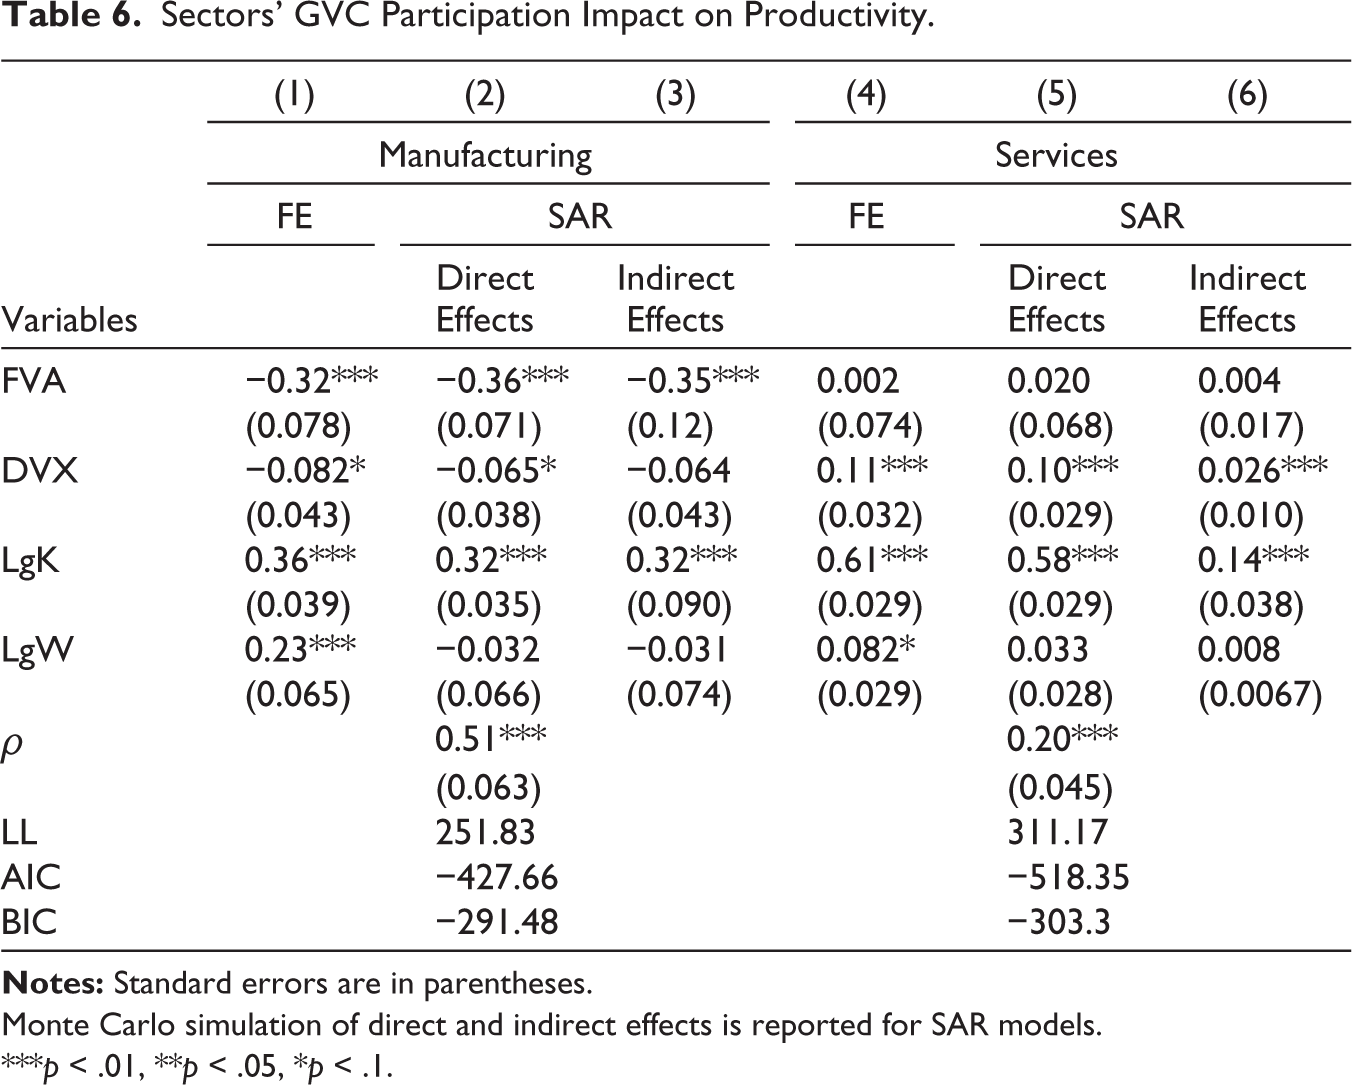
The FE model results are provided in Column1 for manufacturing sectors and Column4 for service sectors. Columns2 and3 show the SAR model results for manufacturing, and Columns5 and6 show the SAR model results for services.
We find that the autoregressive parameter ρ is significant and positive at a magnitude of 0.51 for manufacturing and 0.20 for service sectors, indicating a significant positive diffusion in productivity across manufacturing and service sectors along the input–output channels.
The direct and indirect effects of explanatory variables on labour productivity are reported directly in Table6. The estimation results reveal a negative association between backward linkages and labour productivity in manufacturing industries. Specifically, a 10% increase in backward linkages is associated with a 3.6% decline in labour productivity within a sector and a 3.5% decline across sectors.
Sectors’ GVC Participation Impact on Productivity.
Monte Carlo simulation of direct and indirect effects is reported for SAR models.
***p < .01, **p < .05, *p < .1.
The negative association between backward linkages and productivity found in the earlier results (Tables3 and5) appears to be driven largely by manufacturing backward linkages. Specifically, imports of intermediates used in exports act as substitutes for domestic goods in manufacturing, which diminishes the domestic value-added and subsequently reduces productivity. We find that a 10% increase in forward linkages in a manufacturing sector leads to a 0.65% decline in productivity at the 10% significance level, although we had expected a positive association through learning-by-doing. Turkish firms may lack the R&D intensity needed to internalise these benefits (OECD, 2016).
In Columns5 and6, productivity increases significantly with forward linkages, with significant spillovers across service sectors. Specifically, a 10% increase in forward linkages is associated with a 1% increase in labour productivity, with indirect effects of 0.26%. These findings are consistent with existing literature suggesting that export-oriented firms tend to be more productive than firms less involved in export activities. These gains are realised through learning-by-exporting and technology dissemination (De Loecker, 2013). The results also indicate that the learning-by-exporting process is not confined to sectors with high forward linkages but propagates among sectors through input–output dependencies. Finally, labour productivity rises significantly with capital stock, with notable spillover effects. Increasing capital contributes to boosting workers’ performance, leading to higher productivity. Indirect effects can be seen as a consequence of improved technological spillovers through capital-accumulation processes, which contribute to increased productivity.
Concluding Remarks
In this study, we examine productivity spillovers across Turkish sectors and analyse the impact of GVC participation—through backward and forward linkages —on labour productivity.
We employ spatial econometric models to capture interdependencies between sectors and to model transmission mechanisms through an input–output weight matrix. Estimating the SAR model, we establish that productivity exhibits significant spillover effects, consistent with Balassa’s (1961) hypothesis that linkages between sectors are key sources of productivity diffusion.
Our findings indicate that GVC participation through backward linkages is negatively associated with productivity at the manufacturing industry level, causing productivity declines both within and across sectors. This lends support to the substitution hypothesis, whereby imported intermediates crowd out domestic production, thereby reducing value-added and productivity. Conversely, GVC participation via forward linkages fosters productivity gains within and across service sectors.
Importantly, this study underscores Balassa’s (1961) proposition that inter-industry linkages are primary channels of productivity spillovers. Understanding these channels and the mechanisms through which spillovers occur across industries is essential for designing effective policies aimed at better capturing the gains associated with GVC participation and their impact on labour productivity.
A limitation of the study is the period of coverage of the study, which is determined by the coverage of the WIOD 2016 release, the most recent version of this database available. Several developments have occurred since 2014 that could potentially be considered in the estimated relationships. First, the escalation of trade tensions between the United States and China beginning in 2018 has reshaped global supply chains, with firms reconsidering their reliance on distant suppliers and exploring diversification and reshoring strategies (IMF, 2020). Second, the COVID-19 pandemic exposed critical vulnerabilities in GVCs, leading to widespread supply disruptions and a renewed emphasis on supply chain resilience, which may have affected the cost–benefit calculus of backward and forward participation (World Bank, 2021). Third, Türkiye experienced significant currency depreciation and inflationary pressures after 2018, which likely affected the competitiveness of its exports and the relative cost of imported intermediates, thereby influencing both backward and forward linkages.
If recent years were added, we would expect the following changes. On the one hand, the negative association between backward linkages and productivity in manufacturing may be attenuated if Turkish firms have progressively moved towards higher-quality imported inputs that embed more sophisticated technology, consistent with the quality-ladder hypothesis. On the other hand, trade shocks could have reconfigured the supply chains and amplified the substitution effect if firms replace domestic suppliers with alternative foreign sources. For forward linkages, the growing importance of digital services and the reorientation of Turkish exports towards new markets could strengthen the learning-by-exporting channel, particularly in service sectors.
Footnotes
Declaration of Conflicting Interests
The author declared no potential conflicts of interest with respect to the research, authorship and/or publication of this article.
Funding
The author received no financial support for the research, authorship and/or publication of this article.
Appendix
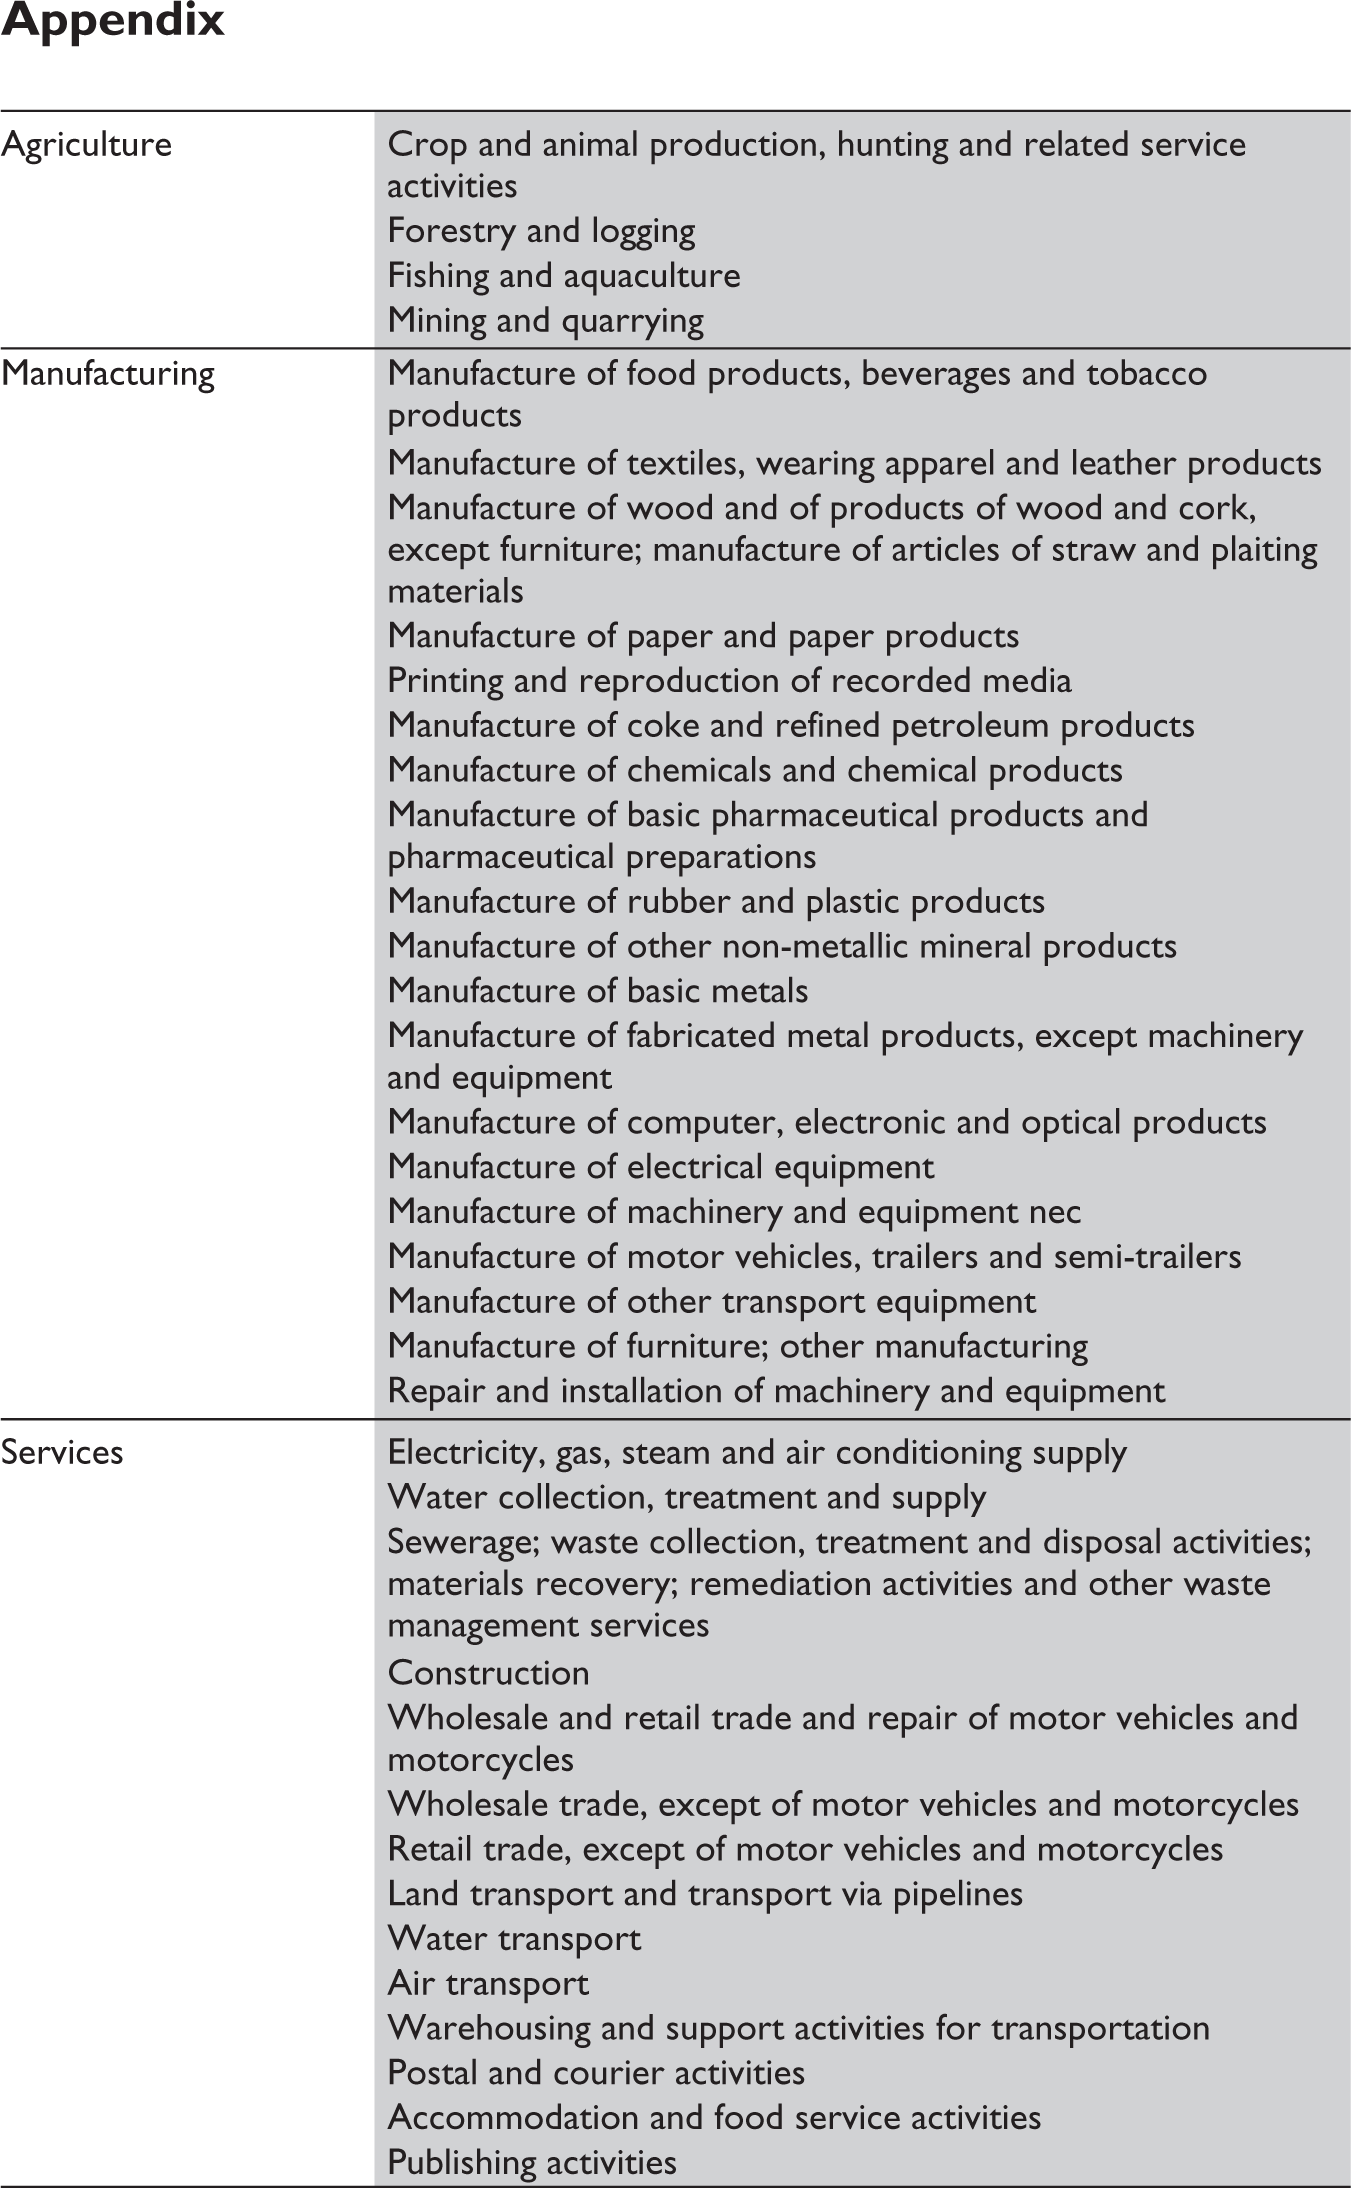
| Agriculture | Crop and animal production, hunting and related service activities |
| Forestry and logging | |
| Fishing and aquaculture | |
| Mining and quarrying | |
| Manufacturing | Manufacture of food products, beverages and tobacco products |
| Manufacture of textiles, wearing apparel and leather products | |
| Manufacture of wood and of products of wood and cork, except furniture; manufacture of articles of straw and plaiting materials | |
| Manufacture of paper and paper products | |
| Printing and reproduction of recorded media | |
| Manufacture of coke and refined petroleum products | |
| Manufacture of chemicals and chemical products | |
| Manufacture of basic pharmaceutical products and pharmaceutical preparations | |
| Manufacture of rubber and plastic products | |
| Manufacture of other non-metallic mineral products | |
| Manufacture of basic metals | |
| Manufacture of fabricated metal products, except machinery and equipment | |
| Manufacture of computer, electronic and optical products | |
| Manufacture of electrical equipment | |
| Manufacture of machinery and equipment nec | |
| Manufacture of motor vehicles, trailers and semi-trailers | |
| Manufacture of other transport equipment | |
| Manufacture of furniture; other manufacturing | |
| Repair and installation of machinery and equipment | |
| Services | Electricity, gas, steam and air conditioning supply |
| Water collection, treatment and supply | |
| Sewerage; waste collection, treatment and disposal activities; materials recovery; remediation activities and other waste management services | |
| Construction | |
| Wholesale and retail trade and repair of motor vehicles and motorcycles | |
| Wholesale trade, except of motor vehicles and motorcycles | |
| Retail trade, except of motor vehicles and motorcycles | |
| Land transport and transport via pipelines | |
| Water transport | |
| Air transport | |
| Warehousing and support activities for transportation | |
| Postal and courier activities | |
| Accommodation and food service activities | |
| Publishing activities | |
| Motion picture, video and television programme production, sound recording and music publishing activities; programming and broadcasting activities | |
| Telecommunications | |
| Computer programming, consultancy and related activities; information service activities | |
| Financial service activities, except insurance and pension funding | |
| Insurance, reinsurance and pension funding, except compulsory social security | |
| Activities auxiliary to financial services and insurance activities | |
| Real estate activities | |
| Legal and accounting activities; activities of head offices; management consultancy activities | |
| Architectural and engineering activities; technical testing and analysis | |
| Scientific research and development | |
| Advertising and market research | |
| Other professional, scientific and technical activities; veterinary activities | |
| Administrative and support service activities | |
| Public administration and defence; compulsory social security | |
| Education | |
| Human health and social work activities | |
| Other service activities | |
| Activities of households as employers; undifferentiated goods- and services-producing activities of households for own use | |
| Activities of extraterritorial organisations and bodies |