
Abstract
This study provides baseline data to assist researchers in conducting future studies exploring the developmental trajectories of young gifted learners on measures of cognitive ability and achievement. The study includes common neuropsychological tests associated with preliteracy and the early-reading process as well as markers for inattention and executive functioning skills. Using a sample of kindergarteners identified as gifted, the results indicated that despite intelligence quotient scores in the very superior range and high means on traditional achievement measures, great variability was observed within the sample on several benchmarking measures of cognitive, academic, neuropsychological, and executive functioning. Additionally, only an average mean score on a visual–motor processing neuropsychological measure was obtained. Four neuropsychological measures provided important loadings in canonical correlations with achievement: Oromotor Sequences, Repetition of Nonsense Words, Beery-Buktenica Developmental Test of Visual-Motor Integration scores, and Speeded Naming. In addition to providing baseline data on these measures, the results also offer support for defining giftedness as a developmental process.
While universal agreement has not been reached on the definition of giftedness, most current definitions emphasize giftedness as a developmental process (National Association for Gifted Children [NAGC], 2010; Subotnik, Olszewski-Kubilius, & Worrell, 2011). These definitions emphasize that giftedness in young children is evidence of their potential for outstanding levels of achievement in a given domain; however, as individuals move from childhood to adolescence, the emphasis shifts to “achievement and high levels of motivation in the domain as the primary characteristics of their giftedness” (NAGC, 2010, para. 5). The developmental trajectory of these learners, however, needs further examination. McCoach, Kehle, Bray, and Siegle (2001) have reported that the academic achievement of some gifted learners may diminish over time. Too many examples can be found of those who demonstrated great potential as children yet failed to translate this potential into high achievement as adults. As argued by Subotnik et al. (2011), educators need evidence-based benchmarks for each developmental stage across different gifted and talented areas to promote healthy progression for all gifted learners. Such benchmarks would also allow educators to know when to intervene in a timely and targeted fashion.
While numerous explanations have been put forth as to why such gifted potential may remain dormant or not fully expressed, one possibility gaining notice is the failure to identify and address additional exceptionalities impeding achievement. Twice-exceptional learners, those who are both academically gifted and have a disability as defined by IDEIA 2004 or Section 504/Title II, would particularly benefit from a better understanding of gifted developmental trajectories and early benchmarking. Estimates of learners who are twice-exceptional approximate 300,000 (Baum & Owen, 2004); this estimate may be low when the “masking effect” is taken into consideration. This effect occurs when students’ giftedness enables them to compensate to the point that their disabilities are not diagnosed and yet their disabilities interfere enough with their achievement that their giftedness is not identified either. A greater understanding of how typical gifted children function over time could assist in providing direction for early intervention or accommodation for gifted children with dual exceptionalities.
Baseline cognitive, behavioral, and neurological benchmarks for development in typical gifted students can be established by studying a sample of young gifted children identified for their advanced reasoning capabilities (as determined through individual intellectual assessments). A sample of young children would allow for assessment prior to the detection of any school-related achievement difficulties. Additionally, baseline data can be established by distinguishing performance levels on specific cognitive, behavioral, and neurological factors that may later be potential indicators of twice exceptionality from those that may simply represent normal variation in the population of typical young gifted learners (Sweetland, Reina, & Tatti, 2006). As Sweetland et al. (2006) demonstrated in a general sample of gifted students, the presence of greater variation between verbal and nonverbal abilities in and of itself would not be unexpected with gifted children. Thus, empirical exploration of measures commonly used for gifted evaluation and for educational disability eligibility would greatly contribute to a better understanding of what could potentially represent risk of becoming a twice-exceptional learner and what is actually normal variation present among gifted individuals. Current empirical research in this area with young gifted students is scant, and such research will be an important step in developing a sound baseline for the comprehensive developmental definition of giftedness proposed by both NAGC (2010) and Subotnik et al. (2011).
Cognitive, Behavioral, and Neurological Benchmarks
The literature was reviewed to determine which cognitive, behavioral, and neurological benchmarks would be most beneficial to establish in young gifted children. In their empirical review, Foley Nicpon, Allmon, Sieck, and Stinson (2011) concluded that it would be important to include measures of executive function in assessments, with the consideration that gifted students may not show clinical levels on these measures to the same degree as the general population. Thus, for example, a developmental trajectory of how executive functioning and symptoms of attention deficit/hyperactivity disorder express themselves in the gifted population is needed.
Within the area of specific learning disability, Foley Nicpon et al. (2011) found no discernible singular cognitive profile pattern, though some studies suggested that stronger verbal skills might be present in gifted students (Assouline, Foley Nicpon, & Whiteman, 2010; Sweetland et al., 2006). Similar to previous findings (Assouline et al., 2010), the authors concluded that an inclusive and comprehensive battery is most informative when assessing these learners. Such a battery should include measures of ability and achievement as well as orthographic and phonological processing and executive functioning.
Orthographic processing has been defined as “using the visual aspect of the word, rather than just the phonemes, to decode” while reading (Holland, McIntosh, & Huffman, 2004, p. 235). The visual aspect of a word is often interpreted to mean that the reader is additionally processing letter clusters or a group of letters rather than exclusively reading at the individual letter-sound level (phonological processing). Orthographic processing is associated with the successful reading of irregular words and sight words, and with reading fluency (see Jenkins & O’Connor, 2002; Reid, 2009, for thorough discussions). Orthographic processing and its components have been explored in the general learning disability literature as a marker of reading ability and as an early-reading predictor. Holland and colleagues (2004) modeled word decoding on a sample of 6- to 12-year-olds using orthographic processing, rapid naming, and phonological processing. Interestingly, the best fitting model incorporated all three subskills simultaneously to predict word reading, and orthographic functioning was the best single predictor overall. A recent hierarchical regression study (Mesman & Kibby, 2011) found that in a general-population sample of ages 8 to 12, inclusive of children with reading disabilities and after controlling for vocabulary ability and phonological awareness, rapid automatic naming, print exposure, and visual processing contributed unique predictive variance. The authors reviewed the literature on visual processing and its controversial role in understanding reading development. They concluded that their positive findings indicate that visual processing skills are more of a useful marker than a source for intervention. Thus, visual processing, in addition to more traditional markers such as rapid automatized naming, may be of potential interest as an early-screening measure. To this end, Assouline et al. (2010) found that the mean performance on the Beery-Buktenica Developmental Test of Visual-Motor Integration–Fifth Edition (Beery, Buktenica, & Beery, 2004) in their sample of 14 gifted students with written expression specific learning disability, some of whom also had a concomitant reading disability, was a standard score of 90.1 despite a mean verbal comprehension index standard score on the Wechsler Intelligence Scale for Children–Fourth Edition (WISC-IV) of 129.64.
Executive functioning refers to the cognitive processes used to organize information and to adapt to the environment (regulation). A review of the literature suggests that benchmarks for executive functioning could facilitate a better understanding of the typical gifted and twice-exceptional populations (Crepeau-Hobson & Bianco, 2011), since these skills are associated with the attainment of preliteracy skills in the general population. Walcott, Scheemaker, and Bielski (2010) explored the relationship of attention issues and attainment of preliteracy skills in a general-population preschool and kindergarten sample and found that teacher ratings of inattention related to the important reading competency markers of phonemic awareness and letter naming and accounted for unique variance beyond the children’s previously measured language abilities. As discussed in a comprehensive review by Shaywitz and Shaywitz (2008), the newer neuropsychological research points to a much stronger link between attention and reading than was previously thought to exist. Marcin (2010) explored the relationship between common early-reading screeners and executive function by using the Dynamic Indicators of Basic Early Literacy Skills (DIBELS; Good & Kaminski, 2002) and three Developmental NEuroPSYchological Assessment–Second Edition (NEPSY-II; Korkman, Kirk, & Kemp, 2007) subtests in a general-population kindergarten sample. She found that Speeded Naming and Phonological Processing from the neuropsychological NEPSY-II measure might help fill in screening information and contribute beyond DIBELS probes in identifying those at risk for learning problems. As no current data are available on the development of executive functioning skills in typical young gifted children, such research would assist in establishing developmental expectations.
Given the lack of benchmark data for young gifted students on measures of cognitive, behavioral, or neurological functioning, the primary goal of the present study was to report these baseline data. Understanding typical early functioning in the gifted population is critical for several reasons. Understanding what represents normal variation at this age in gifted students is of value in distinguishing normally occurring difference from disorder (Sweetland et al., 2006). The establishment of benchmarks will assist in future research exploring the notion of giftedness as a developmental process, as suggested by Subotnik et al. (2011). Additionally, the establishment of benchmarks for typical young gifted learners may also facilitate the early identification of additional exceptionalities; gifted students who do not meet the benchmarks may be referred for more in-depth testing for specific learning disabilities, attention disorders, or executive functioning disorders. Finally, benchmarks may also aid in the development of possible interventions that may be effective in curbing the development of a disability, ameliorating its expression, or altering the learning environment for the gifted learner to better accommodate individual differences and strengths. Of concern would be to identify whether the explored measures have limited diagnostic utility in a Response to Intervention (RtI) context for young gifted students due to ceiling effects (Brown, 2012).
To these ends, a secondary goal of the present article is to further clarify the general findings of Mesman and Kibby (2011) and those in the twice-exceptional sample of Assouline et al. (2010) by extending the earlier work to a young gifted sample. The present study explores several orthographic, neurological language subtests; a visual–motor processing measure; and ratings of inattention and executive functioning as a screener to gain understanding of baseline functioning in the young gifted population. The variables are analyzed in conceptually related variate sets to see whether and how the conceptually related sets are correlated with one another. The sets each represent a common construct, such as neuropsychological functioning and preliteracy correlates, executive functioning, and inattention, and were related to a set of achievement and early-literacy probes. This may be useful in the design of early comprehensive screening batteries for twice exceptionality and for developing an RtI framework better tailored to young gifted students. Thus, this study will contribute to the field of gifted education by providing the much-needed quantitative empirical research as called for in the literature (Assouline et al., 2010; Foley Nicpon et al., 2011; Lovett & Lewandowski, 2006). The measures utilized in this study would potentially represent quicker methods of screening and progress monitoring than those traditionally used in full evaluations.
Finally, a third goal of this study is to extend the work of Walcott et al. (2010) to a young gifted sample. Their study found that teacher ratings of inattention related to phonemic awareness and letter naming and accounted for unique variance beyond the children’s language abilities. In extending this research to a young gifted sample, we address the question of whether teacher and parent ratings of inattention provide unique variance on achievement and early-reading probes when controlling for ability. If so, early screening for inattention would have important implications for early intervention with young gifted students.
Method
Participants
Participants were recruited from a well-established independent school in a large midwestern city with a mission of identifying and serving academically gifted students from preschool through eighth grade. Students in the kindergarten classes had been identified for admission to the school through an individually administered intelligence test and had verbal and/or performance scales in the top 2% to 3% of the population. At the time of this study, the tests used by the school for admissions were the Wechsler Preschool and Primary Scale of Intelligence–Third Edition (WPPSI-III; 41of our 61 participants received this measure) or an alternate standardized, norm-referenced measure of cognitive ability. Licensed psychologists administered all the cognitive measures found in school records. In recognition of reliability issues in assessments for young children, if a student did not meet the admissions criteria but there was other strong contextual evidence to suggest that the student would be able to be successful in the program, the student might be admitted to the school’s kindergarten program.
Participants were recruited through a letter to the parents sent from the school describing the purpose of the research and school support of the study. Of the 83 potential kindergartners, 61 children (73.5%) were successfully recruited to participate in the study. Thus, the current data include 61 participants representing two different successive kindergarten cohorts (n = 28 and n = 33, respectively). Of the 61 students, 16 identified as other than Caucasian (7 Asian American, 1 African American, and 8 multiracial). The gender distribution was even, with 31 of the participants being female. Socioeconomic status was middle to high for all participants. Two thirds of the students had participated in the school’s preschool program prior to kindergarten. None of the participants were identified in the school records as twice-exceptional.
Procedure
Cognitive and neuropsychological measures, behavioral and executive functioning Parent and Teacher rating scales, and achievement measures were administered to each of the participants in the fall of the kindergarten year. Data were examined using canonical correlation, hierarchical regression, and descriptive analyses to provide baseline data for the eventual construction of the developmental trajectories of typical gifted and twice-exceptional learners as well as to explore the relationships among cognitive, academic, behavioral, and executive functioning.
For the purposes of the study, the participants were individually administered the assessments listed below in a quiet environment near the child’s classroom during a time deemed mutually convenient by the test administrators and the classroom teachers. At the request of the school, sessions for any individual child on a given day were kept brief, ranging from 5 to 20 minutes; in process, this resembled the benchmark and progress-monitoring data collection common at most schools. A faculty member gathered all the available archival cognitive ability results from the student records. Doctoral-level school psychology students trained in test administration, scoring, and interpretation administered all the other tests. Advanced graduate students and school psychology university faculty carefully monitored correct administration, scoring, and interpretation. Administrations usually involved completing one of the tests or subtests with all participants and returning for subsequent sessions on different days to complete other measures. This method, in addition to being less disruptive to the school, also ensured that all students received all measures in the same order and with the same amount of time between measures. The participants seemed relaxed, and the results were felt to be valid. Kindergarten Teacher and Parent rating scales were obtained for all participants during the fall.
Instrumentation
In this study, common measures and screeners were administered to enhance future potential utility for benchmarking with gifted populations. Some of the measures are currently widely used for RtI benchmarking in the general population and thus are familiar to most educators in the field.
Behavior Assessment System for Children–Second Edition
The Behavior Assessment System for Children–Second Edition (BASC-2; Reynolds & Kamphaus, 2004) includes rating scales completed by parents and/or teachers that provide a comprehensive picture of children’s behavioral and emotional functioning. Parents and teachers are asked to rate each child on questions indicating whether they never, sometimes, often, or almost always observe a given behavior. Adaptive and clinical behaviors are included. The BASC-2 generates T-scores (M = 50, SD = 10), in which scores between 41 and 59 are considered to be in the average range, scores between 60 and 69 indicate at-risk behavior, and those greater than 70 are clinically significant. The adaptive scales have a different scoring interpretation, where higher T-scores indicate more adaptive behavior.
Reliability and validity information suggests that the BASC-2 is a sound measure. Internal consistency, as measured through split-half reliability, ranges from .90 to .97 (Spies, Carlson, & Geisinger, 2010). Test–retest reliability ranges from .80 to .91 (Furlong & O’Brennan, 2010). Interrater reliability for Parent forms ranges from .82 to .83 and for Teacher forms, from .71 to .80 (Furlong & O’Brennan, 2010). The validity of the BASC-2 is shown through correlations with other screening measures: Achenbach System of Empirically Based Assessment measures, including the Caregiver-Teacher rating scale (r = .94), Teacher’s Report Form (r = .76), Child Behavior Checklist ages 1 to 5 (r = .71) and ages 6 to 18 (r = .76), and Youth Self-Report Form (r = .77); global scores from the Conner’s teacher (r = .78), parent (r = .62), and student (r = .51) forms; and Behavior Rating Inventory of Executive Functioning (BRIEF; r = .78; Furlong & O’Brennan, 2010). An assessment of the predictive validity suggested that Teacher and Parent forms could be used to predict future functioning (Furlong & O’Brennan, 2010).
The BASC-2 uses different rating scales based on the rater (i.e., teacher or parent) and the age of the child (i.e., Preschool or Child). Both Parent and Teacher rating scales were used for this study. The BASC-2 rating scales are customized for different age ranges: the Preschool form is designed for ages 2 to 5 years, and the Child form is designed for ages 6 to 11 years. For each participant, a parent and a teacher each completed the appropriate BASC-2 form based on the child’s age at the time the forms were distributed in the fall of the kindergarten year. There were 58 Parent forms completed (Preschool = 34, Child = 24) and 59 Teacher forms completed (Preschool = 38, Child = 21).
Attention problems
The BASC-2 Attention Problems scale describes the child’s ability to maintain the necessary levels of attention at home and at school. The Attention Problems T-scores from the Parent Preschool and Parent Child forms were combined, and the Attention Problems T-scores from the Teacher Preschool and Teacher Child forms were also combined, to create two new variables, Attention Problems Parent and Attention Problems Teacher, that include all the available Attention Problems participant data.
Behavior Rating Inventory of Executive Function
The BRIEF (Gioia, Isquith, Guy, & Kenworthy, 2000) is an assessment that uses rating scales to measure executive functioning in children aged 5 to 18 years. The Parent and Teacher rating scales were completed for this study. The BRIEF generates T-scores (M = 50, SD = 10); scores greater than or equal to 65 are considered to be clinically significant. Reliability and validity information is presented in the manual (Gioia et al., 2000) and is reported as follows. The internal consistency ranged from .80 to .98. The interrater reliability between parents and teachers was moderate, ranging from .30 to .50, which is reportedly likely due to differences in expectations between the home and school environments. The test–retest reliability ranged from .76 to .85 for the Teacher form and from .72 to .84 for the Parent form. The content validity for each item was evaluated and agreed on by 12 pediatric neuropsychologists, indicating that the item samples the intended executive function accurately. Convergent validity was established with other measures of inattention, impulsivity, and learning skills, and divergent validity was demonstrated against measures of emotional and behavioral functioning.
The BRIEF includes several subscales and composite scales, listed below. All subscales and composites for this measure generate T-scores (M = 50, SD = 10). The Inhibit subscale measures the ability to resist impulses and cease inappropriate behavior. The Shift subscale measures the ability to make transitions, tolerate change, and switch or alternate one’s attention from one focus or topic to another. The Emotional Control subscale measures the influence of the executive functions on the expression and regulation of emotions. The Initiate subscale measures the ability to begin a task or activity without being prompted to do so. The Working Memory subscale measures the capacity to hold information in the mind in order to complete a task, encode and store information, or generate goals. The Plan/Organize subscale measures the ability to set goals and determine the best way to reach those goals and the ability to bring order to information and to recognize main ideas or key concepts. The Monitor subscale measures the ability to check one’s own performance during or shortly after finishing a task to ensure that one has accurately or appropriately attained the desired goal. Self-monitoring reflects a child’s awareness of the effect that his or her behavior has on others. The Behavior Regulation Index is a composite scale that includes the Inhibit, Shift, and Emotional Control subscales. The Metacognition Index is a composite that includes the Initiate, Working Memory, Plan/Organize, Organization of Materials, and Monitor subscales. The Global Executive Functioning composite is an overall measure of executive functioning that includes all eight subscales: Inhibit, Shift, Emotional Control, Initiate, Working Memory, Plan/Organize, Organization of Materials, and Monitor.
The Beery-Buktenica Developmental Test of Visual-Motor Integration–Sixth Edition
The Beery-Buktenica Developmental Test of Visual-Motor Integration–Sixth Edition (VMI; Beery, Buktenica, & Beery, 2010) is an assessment of how well an individual (age 2 through adulthood) can reproduce via paper and pencil a developmentally sequenced series of geometric shapes. Results of the VMI can be an early indicator of difficulties with visual–motor integration, which may be indicative of academic problems. The VMI generates standard scores (M = 100, SD = 15), with scores between 90 and 109 considered to be in the average range. A discussion of reliability and validity from the manual for this measure follows (Beery et al., 2010). The split-half coefficient after 1 year was .88 across one age-group and .95 across all age-groups, the test–retest reliability coefficient was .88, and the interrater reliability coefficient was .93. The content validity of the VMI was reportedly strongly supported through an evaluation of the item construction and selection procedures and through item analysis. The concurrent validity is shown through correlations with other similar instruments, such as the Developmental Test of Visual Perception (.52), the Wide Range Assessment of Visual-Motor Abilities (.75), and the Bender-Gestalt (median correlation .56). The VMI manual addresses construct validity through testing the constructs underlying the test performance and verifying the hypothesis about the constructs with empirical data. The VMI has predictive validity in predicting school performance, with coefficients ranging from .49 to .88. This measure was individually administered to each participant.
Dynamic Indicators of Basic Early Literacy Skills–Sixth Edition
DIBELS (Good & Kaminski, 2002) is commonly used for benchmarking the components of early-reading skills. An independent review of DIBELS found evidence for acceptable psychometric properties (Shanahan, 2005). Two DIBELS measures were administered.
DIBELS Oral Reading Fluency (ORF) measures a child’s ability to read grade-level materials. Participants are asked to read three grade-level passages under a time constraint. After reading each passage, the participants are asked to recall what they read. The median score from the three passages is retained as the final score. The Total Correct score reflects the total number of words read correctly. The Total score reflects the total number of words read correctly (Total Correct) minus the total number of errors. The Retell Total reflects the total number of words recalled.
DIBELS Word Use Fluency (WUF) is a measure of vocabulary and oral language. Participants are asked to create sentences from words read aloud, under a time constraint. The score reflects the total number of words used in each sentence that correctly uses the target word.
Developmental NEuroPSYchological Assessment
The NEPSY-II (Korkman et al., 2007) is the revised and updated version of a series of standardized and normed neuropsychological subtests for children in six functional domains. This measure generates scaled scores (M = 10, SD = 3) for which scores 8 through 12 are considered to be in the average range. Reliability and validity information suggests that NEPSY-II has adequate psychometric properties. The measure’s authors assessed reliability using split-half and alpha coefficients and test–retest methods. Coefficients for the subtests utilized in the current study were reported to be above .70 (D’Amato & Titley, 2010). Furthermore, there is sufficient evidence of content, construct, and concurrent validity provided in the clinical and interpretive manual (D’Amato & Titley, 2010). The content validity is determined based in part on expert consultation (Korkman et al., 2007). Construct validity is demonstrated through correlations between the tasks, which were moderate (.53) and expected based on how the subtests were established to measure distinct abilities within the same domain (Korkman et al., 2007). Concurrent validity for NEPSY-II is shown by an investigation of the relationship between NEPSY-II scores and other measures of general cognitive ability, academic achievement, neuropsychological functioning, and behavior, as well as supporting the validity in clinical groups of children (Korkman et al., 2007).
For the purposes of this study, selected subtests from the Language domain were utilized. The Oromotor Sequences subtest measures oromotor coordination by asking the child to repeat articulatory sequences, such as alliterative phrases. The Phonological Processing subtest is a measure of phonemic awareness in which participants are asked to orally manipulate word segments (syllables) and letter sounds (phonemes). The Repetition of Nonsense Words subtest assesses phonological encoding and decoding ability by asking the participant to repeat nonsense words presented aloud. The Speeded Naming subtest measures rapid access to language. The child is shown an array of colors, shapes, and sizes and is asked to name them in order as quickly as possible. The Word Generation subtest measures the ability to quickly generate vocabulary. Participants are asked to name as many items as possible within a certain category under a time constraint.
Woodcock Johnson–III Tests of Achievement
The Woodcock Johnson–III Tests of Achievement (WJ-III ACH and the subsequent Normative Update; Woodcock, McGrew, & Mathers, 2007) is a commonly used measure of academic achievement. This measure generates standard scores (M = 100,SD = 15). A score falling from 90 to 109 is considered to be in the average range. An independent reviewer (Cizek, 2003) determined that the WJ-III ACH is an adequately valid and reliable measure. Reliability is shown through internal consistencies ranging from the .80s to .90s for subtests, and test–retest reliability over 1 year is indicated by coefficients ranging from the .80s to .90s (Cizek, 2003). Internal validity is demonstrated through fundamental correlational analysis and exploratory and confirmatory factor analysis (Cizek, 2003). Three subtests from the WJ-III ACH were administered. All subtests for this measure generate standard scores (M = 100, SD = 15). The Letter Word Identification subtest is a measure of reading ability in which participants read a list of words of increasing difficulty. The Calculation subtest is a measure of mathematics ability in which participants are asked to solve increasingly difficult calculation problems. The Spelling subtest is a measure of spelling ability in which participants are asked to write words read aloud by the examiner.
Wechsler Preschool and Primary Scale of Intelligence–Third Edition
The WPPSI-III (Wechsler, 2002) was administered to some participants prior to their entering kindergarten as part of the school admissions process. It was not administered as part of the current study, but scores were obtained with parents’ permission from each student’s school record when available. This measure generates standard scores (M = 100, SD = 15); scores from 90 to 109 are considered to be in the average range. Reliability and validity information for this measure is within the acceptable range (Madle, 2005). Split-half reliability coefficients ranged from .83 to .95, the internal consistency coefficient was .96 for the Full Scale score and between .90 and .95 for the Verbal composite, and the test–retest reliability was between .86 and .92 (Madle, 2005). Internal validity and confirmation of the test structure were shown through exploratory factor analysis and through comparisons with other similar measures, with the obtained coefficients ranging from .80 to .89 (Madle, 2005).
This study utilized the Verbal IQ composite (M = 100,SD = 15; Wechsler, 2002) in analyses requiring a language baseline, as performed similarly in some of the studies we hope to extend (see Mesman & Kibby, 2011, who used the WISC-III Vocabulary subtest; see also Walcott and colleagues, 2010, who used the Developmental Indicators for the Assessment of Learning, Third Edition [DAIL-3] for a similar purpose).
The WPPSI-III Verbal IQ composite score represents an estimate of specific language skills, such as verbal reasoning and comprehension, acquired knowledge, and attention to verbal stimuli. This composite score includes the following WPPSI-III subtests: Information (general information), Vocabulary (naming pictures and defining words), and Word Reasoning (identifying concepts based on increasingly specific clues).
Results
Descriptive Statistics
Descriptive information for the whole sample is provided in Table 1, prior to the provision of more detailed information for the subsamples used in the statistical analyses in Tables 3 and 6. As can be seen in Table 1, the participants had intelligence quotient scores in the very superior range (standard scores greater than 130; Wechsler, 2002) for the full scale (M = 131.36, SD = 6.832) as well as on the verbal composite (M = 133.57, SD = 6.946). The Academic Skills composite on the WJ-III achievement measure (M = 130.77, SD = 15.637) and the Letter Word Identification subtest (M = 131.78, SD = 17.759) also produced superior scores, but their span was far more varied, ranging from approximately average to the upper bounds of the measure. Spelling and Calculation scores varied from the average to superior range and overall were in the high-average range. On the VMI, the mean score was in the average range (M = 108.58, SD = 11.860), and individual scores ranged from average to superior. T-scores for all Parent and Teacher BASC-2 Attention Problems scores and BRIEF Parent and Teacher rating scales were at the average level and had typical standard deviations when compared with the general population (Gioia et al., 2000; Reynolds & Kamphaus, 2004). On the BASC-2 Attention Problems scale, when looking at the range of scores obtained, it is important to note that some participants were rated in the at-risk range (T-scores between 60 and 69; five children for Parent ratings and two children for Teacher ratings). On the BRIEF, T-scores greater than 65 are considered clinically significant; and again, observing the ranges obtained for those scores in the sample, each set of subscale scores included children who were rated by their parent and/or teacher in the clinically significant range, some highly so. In this gifted young sample, there is a considerable range of executive functioning skill levels present.
Participant Descriptive Information.
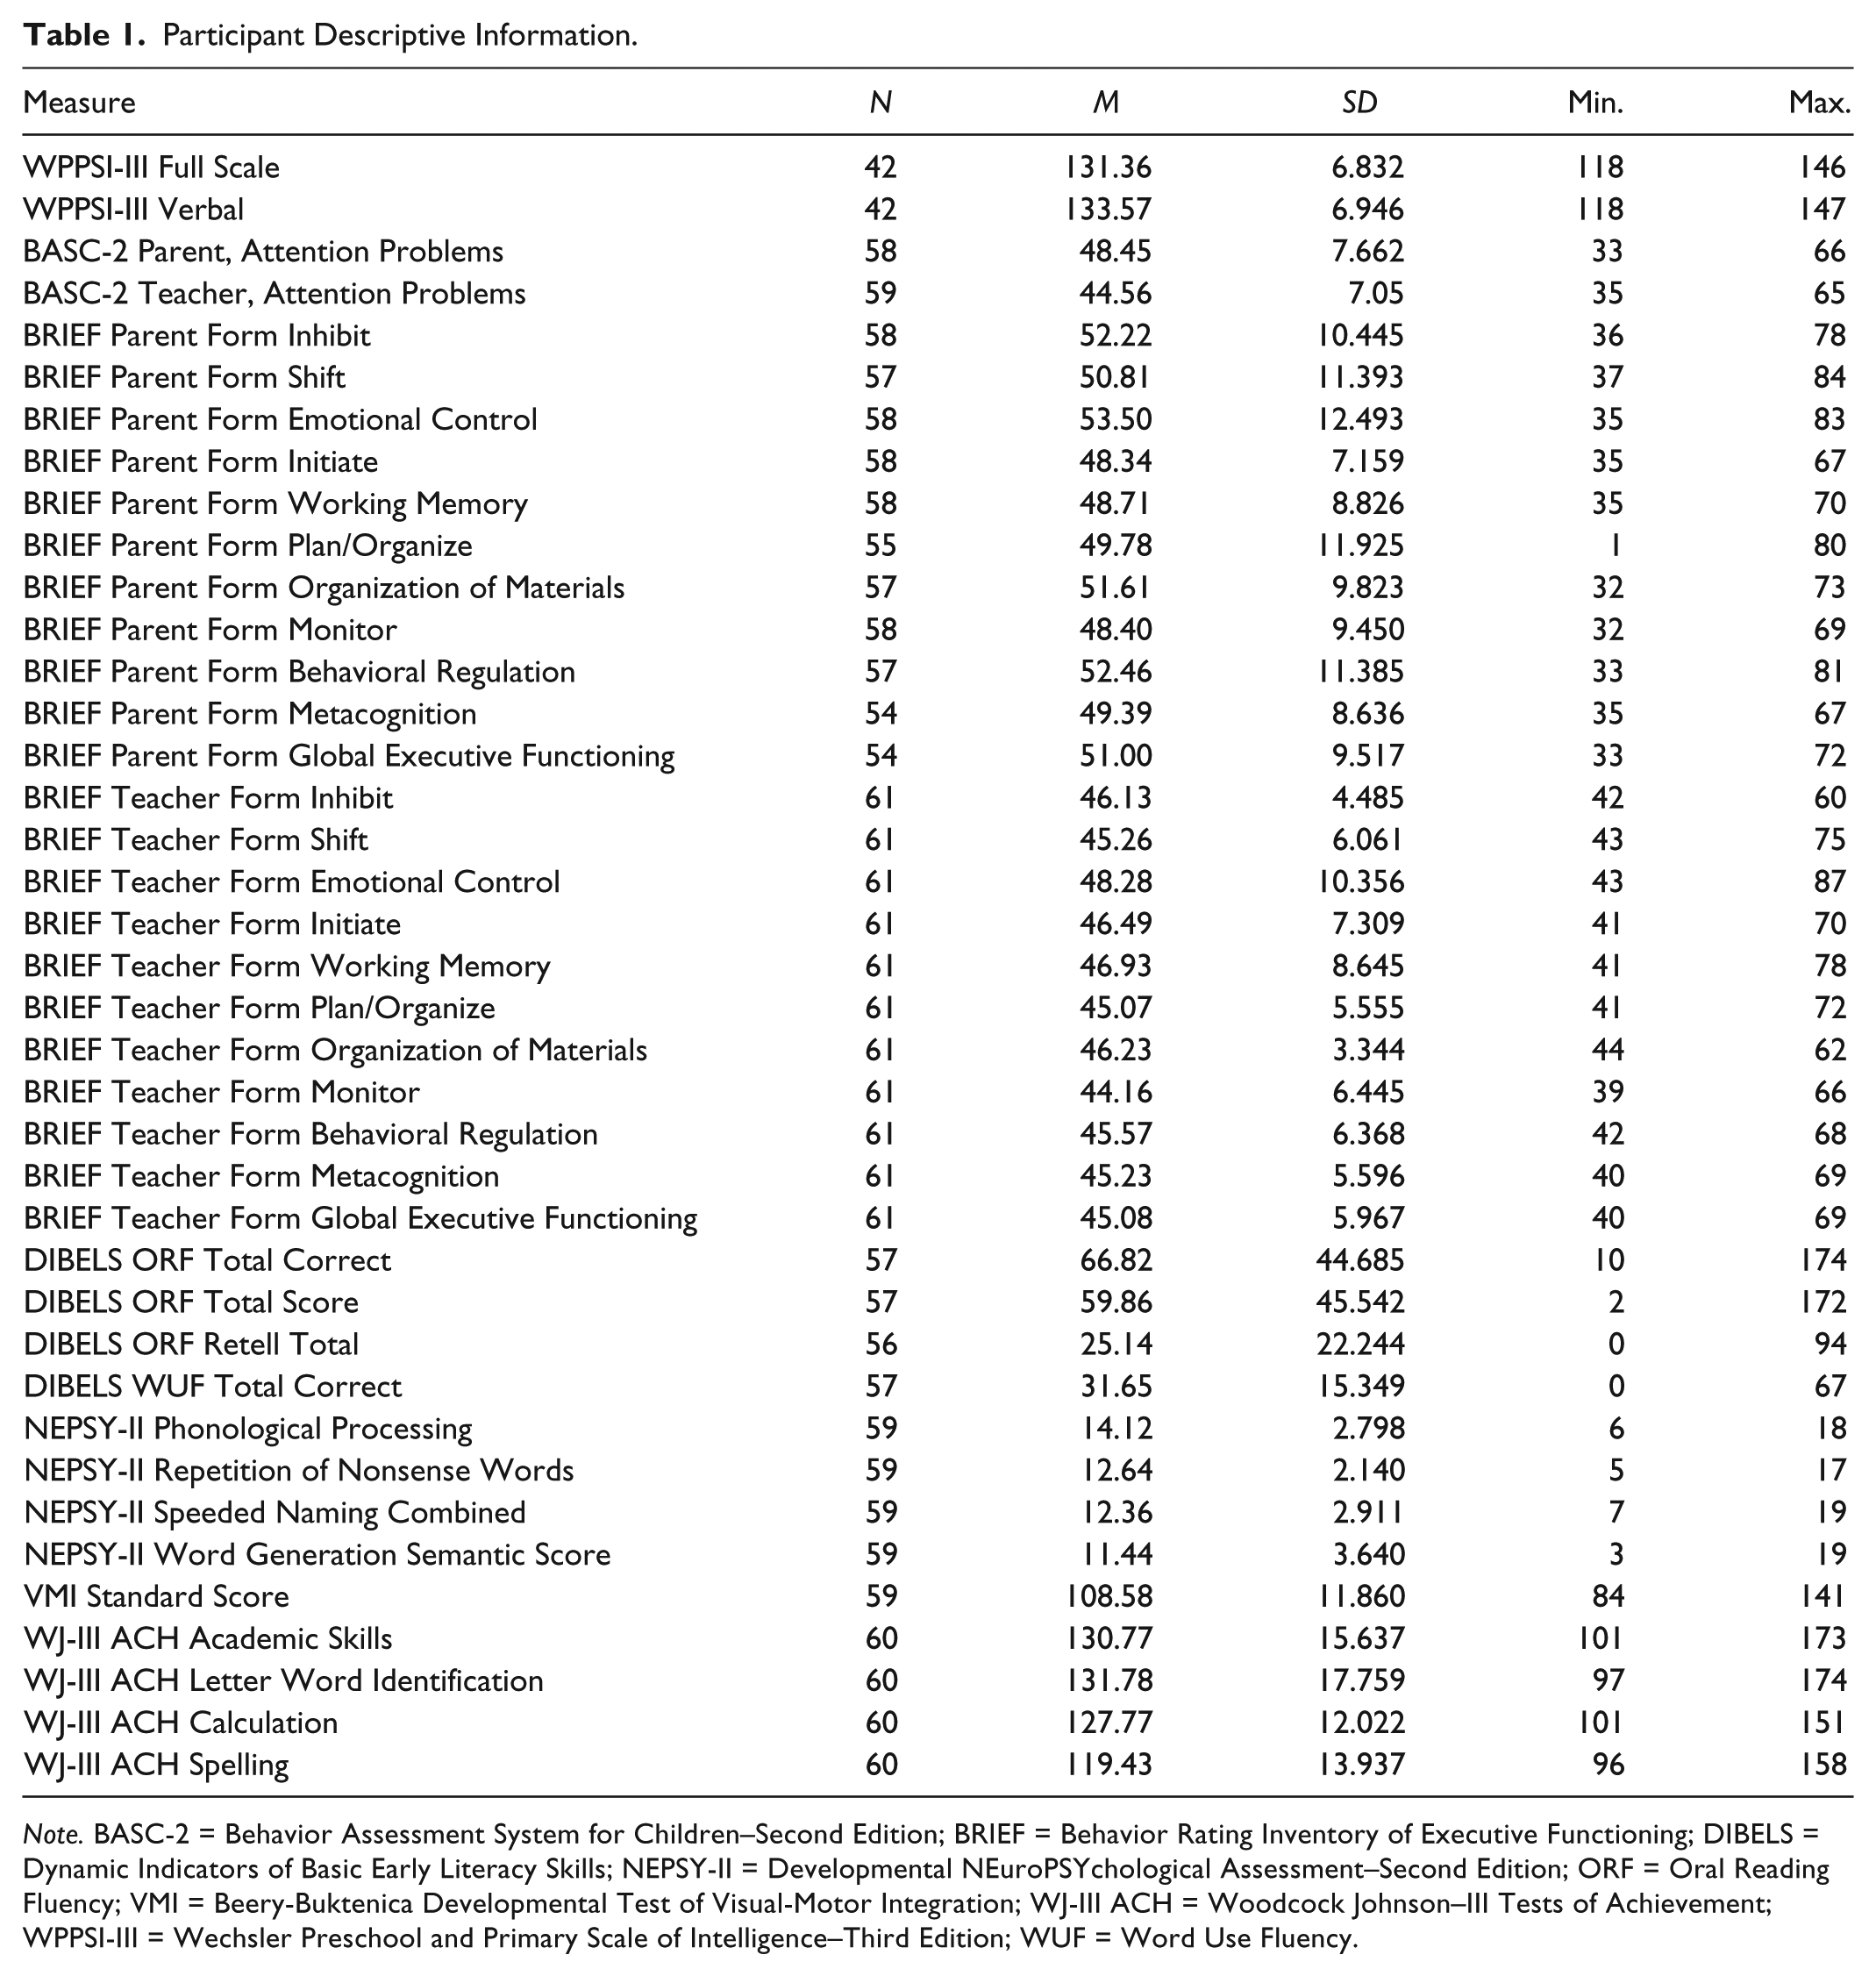
Note. BASC-2 = Behavior Assessment System for Children–Second Edition; BRIEF = Behavior Rating Inventory of Executive Functioning; DIBELS = Dynamic Indicators of Basic Early Literacy Skills; NEPSY-II = Developmental NEuroPSYchological Assessment–Second Edition; ORF = Oral Reading Fluency; VMI = Beery-Buktenica Developmental Test of Visual-Motor Integration; WJ-III ACH = Woodcock Johnson–III Tests of Achievement; WPPSI-III = Wechsler Preschool and Primary Scale of Intelligence–Third Edition; WUF = Word Use Fluency.
In Table 1, more variability is present in all DIBELS and NEPSY-II scores measuring preliteracy/reading aptitude than was apparent in the WPPSI-III, which measured intelligence, with some children scoring in the low and below-average ranges all the way to the upper bounds of each subtest. Thus, both of these measures may be capturing more detailed functional information and more nuanced processing data for these young highly gifted individuals beyond what was captured in standard or more traditional cognitive and achievement measures, where more restricted ranges of performance are observed. For the NEPSY-II language subscales and the DIBELS, the young gifted individuals did not uniformly perform exceptionally well or even in the average range. Table 2 provides descriptive bivariate correlations for the full sample.
Bivariate Correlations of Variables Used in the Analyses.

Note. BASC-2 = Behavior Assessment System for Children–Second Edition; BRIEF = Behavior Rating Inventory of Executive Functioning; DIBELS = Dynamic Indicators of Basic Early Literacy Skills; NEPSY-II = Developmental NEuroPSYchological Assessment–Second Edition; ORF = Oral Reading Fluency; VMI = Beery-Buktenica Developmental Test of Visual-Motor Integration; WJ-III ACH = Woodcock Johnson–III Tests of Achievement; WPPSI-III = Wechsler Preschool and Primary Scale of Intelligence–Third Edition; WUF = Word Use Fluency.
Correlation is significant at the .05 level (2-tailed). **Correlation is significant at the .01 level (2-tailed).
Canonical Correlations
To address the second goal of the study—gaining a deeper understanding of how sets of variables may be related to each other—a series of canonical correlations were calculated. As noted above, canonical correlation measures the relationship between two sets of variables. Each set consists of conceptually related measures, and the resulting correlation coefficients express the degree to which the two sets are related to one another, in much the same way that Pearson’s r is used to measure the relationship between pairs of individual variables. Thus, for example, in the first canonical correlation analysis in this study, the neuropsychological measures (the VMI and the language subtests from NEPSY-II) form one set of conceptually related variables (neurological functioning), which are correlated with the second set, consisting of the achievement subtests and DIBELS probes (n = 50). In other words, the canonical correlation analysis in this case yielded a correlation coefficient expressing the strength and direction of the relationship between neuropsychological functioning (as measured by the VMI and NEPSY-II) and achievement. In addition, the results of the canonical correlation also provided information regarding the role played by each individual variable in the relationship between the two sets of variables. SPSS Version 19 (IBM Corp., 2010) was used to perform all the analyses. First, descriptive statistics are provided in Table 3 for the subset of the sample that had no missing data for any of the measures included in the canonical correlations.
Descriptive Information for Participants Included in Canonical Correlations.
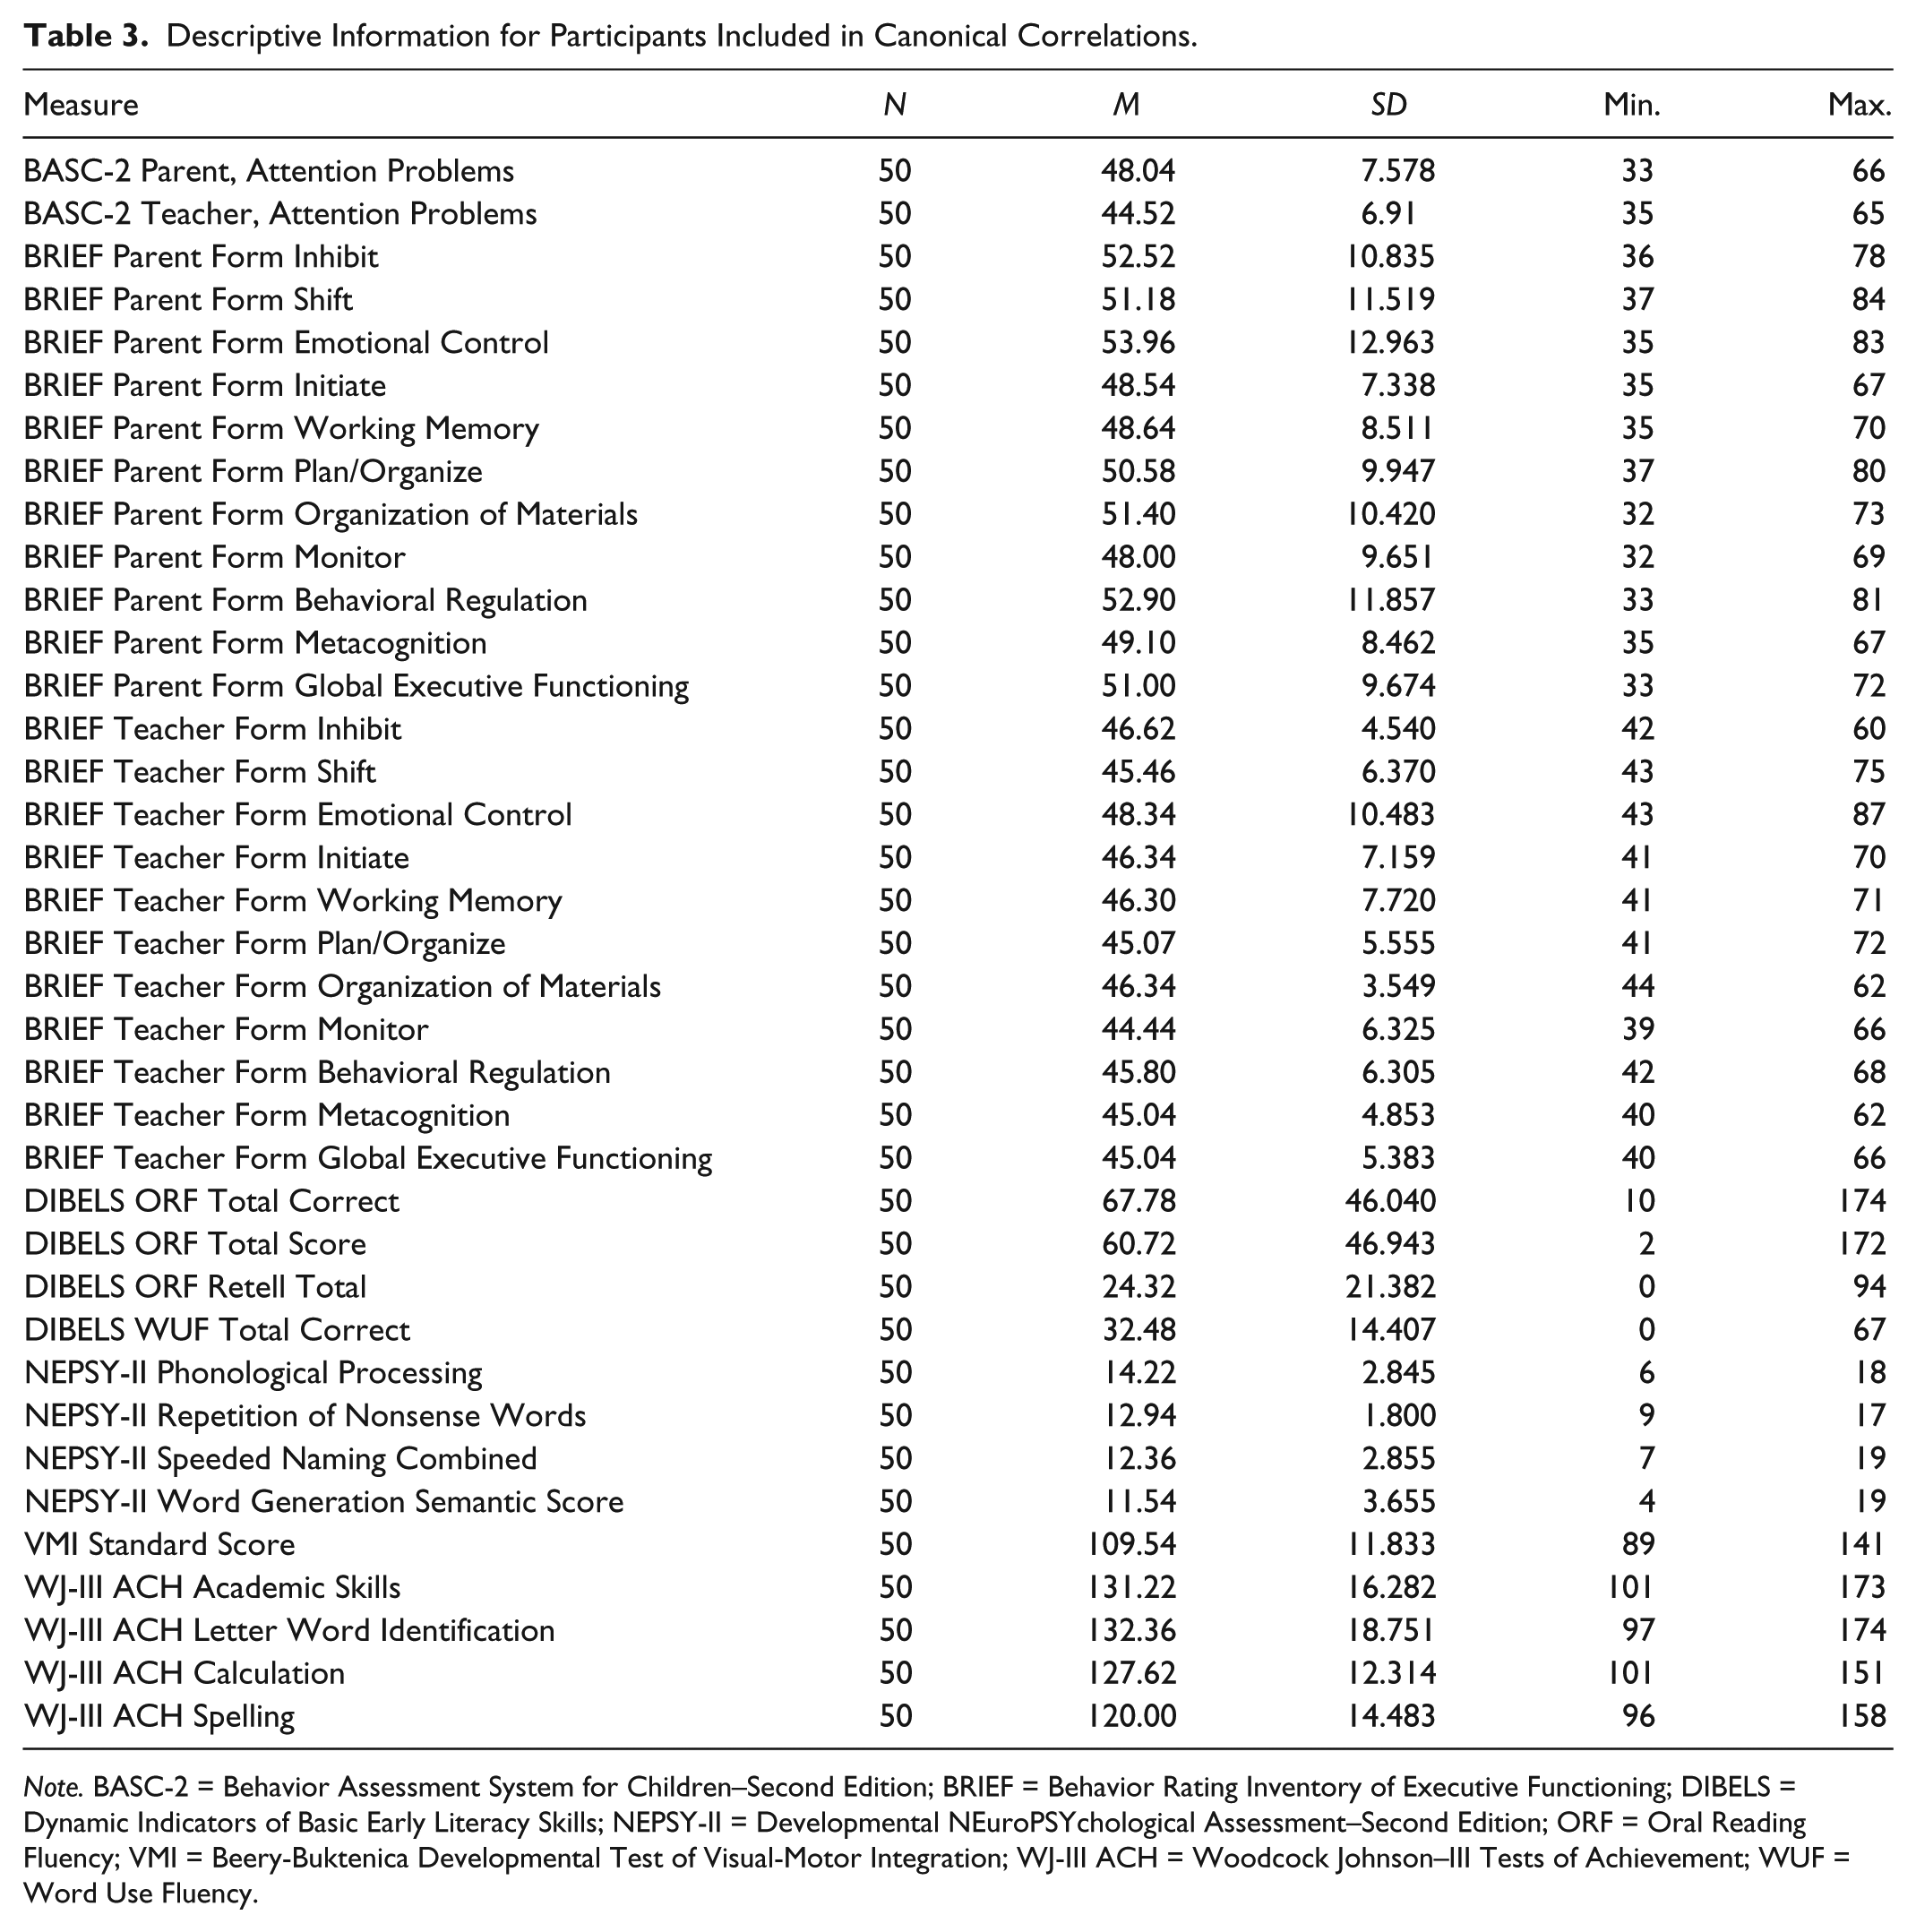
Note. BASC-2 = Behavior Assessment System for Children–Second Edition; BRIEF = Behavior Rating Inventory of Executive Functioning; DIBELS = Dynamic Indicators of Basic Early Literacy Skills; NEPSY-II = Developmental NEuroPSYchological Assessment–Second Edition; ORF = Oral Reading Fluency; VMI = Beery-Buktenica Developmental Test of Visual-Motor Integration; WJ-III ACH = Woodcock Johnson–III Tests of Achievement; WUF = Word Use Fluency.
NEPSY-II/VMI Set and WJ-III/DIBELS Set Results
Six canonical correlations for this pair of sets were estimated, with only the first being statistically significant (r = .653, p = .017). The canonical loadings for the NEPSY-II/VMI and DIBELS/WJ-III sets appear in Table 4.
Canonical Loadings for NEPSY-II/VMI and DIBELS/WJ-III.
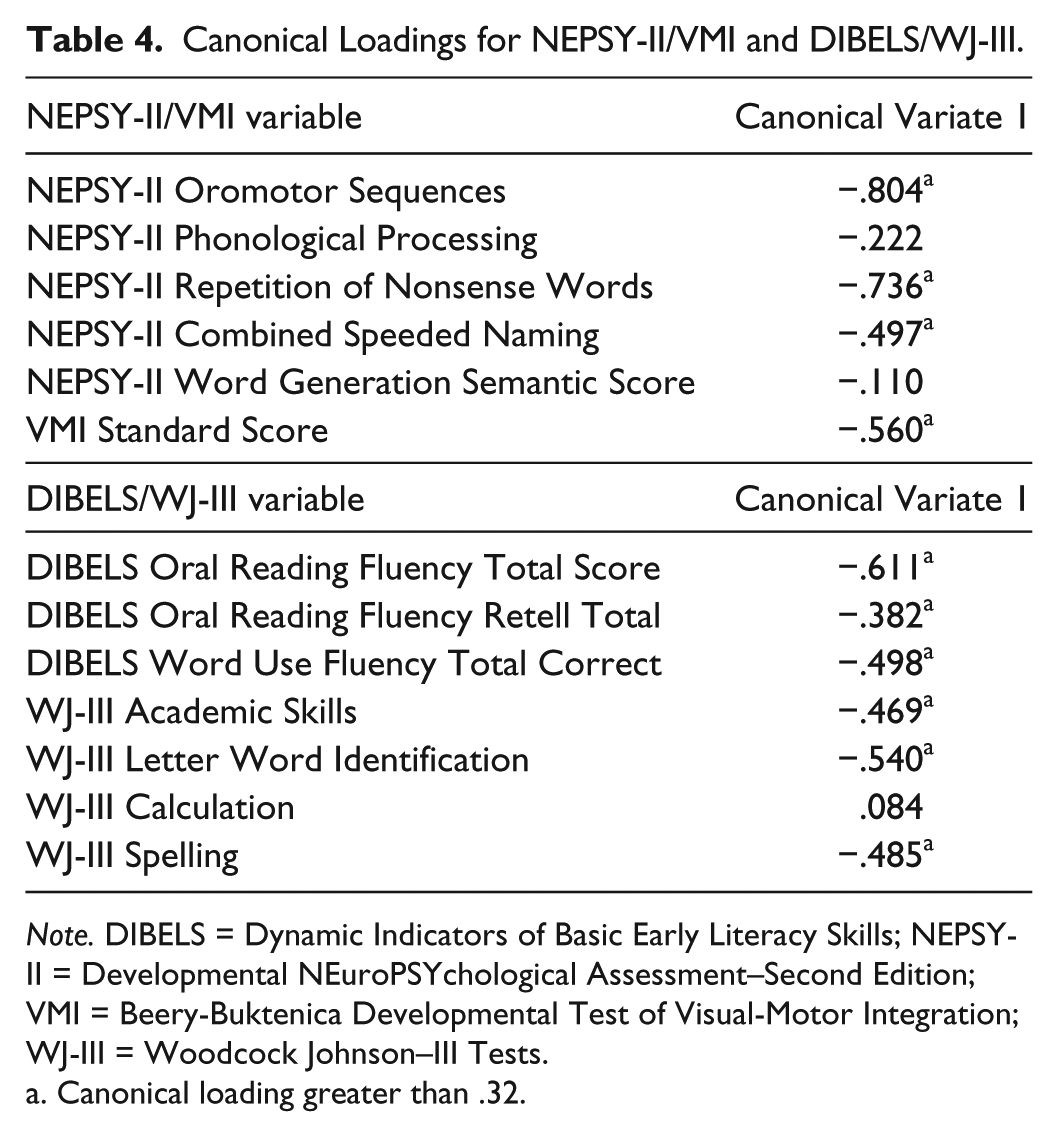
Note. DIBELS = Dynamic Indicators of Basic Early Literacy Skills; NEPSY-II = Developmental NEuroPSYchological Assessment–Second Edition; VMI = Beery-Buktenica Developmental Test of Visual-Motor Integration; WJ-III = Woodcock Johnson–III Tests.
Canonical loading greater than .32.
To establish which variables in each set were associated with the significant canonical correlation, canonical loadings were examined. Loadings with a value greater than .32 (Tabachnick & Fidell, 2006) were deemed to identify “important” variables in determining the correlation. For the NEPSY-II/VMI set, Oromotor Sequences Total Score (loading = −.804) and Repetition of Nonsense Words (loading = −.736) were the most salient variables, while VMI (loading = −.560), and Combined Speeded Naming (loading = −.497) also contributed to the correlation, based on the .32 standard. Conversely, neither Phonological Processing (loading = −.222) nor Word Generation (loading = −.110) contributed to the correlation. For the WJ-III achievement subtests and the DIBELS probes (based on the .32 standard), DIBELS Oral Reading Fluency Total Score (loading = −.611) and WJ-III Letter Word Identification (loading = −.540), followed by DIBELS Word Use Fluency Total Correct (loading = −.498), WJ-III Spelling (loading = −.485), WJ-III Academic Skills (loading = −.469), and DIBELS Oral Reading Fluency Retell Total (loading = −.382) also contributed to the correlation. WJ-III Calculation (loading = .084) did not contribute to the correlation.
BRIEF Set and WJ-III/DIBELS Set Results
Teacher BRIEF
To determine whether the teacher BRIEF report scores were correlated with the WJ-III and DIBELS, a canonical correlation analysis was also conducted. The set combination for the BRIEF included Behavior Regulation and Metacognition Indices as well as the Global Executive Functioning score. The WJ-III/DIBELS set was identical to that described in the previous analysis. With respect to the teacher BRIEF reports, no canonical correlations were found to be statistically significant (α = .05).
Parent BRIEF
A canonical correlation analysis using the parent BRIEF report measures and the WJ-III/DIBELS set was also conducted. For the parent BRIEF, parent scores corresponding to the teacher ratings described above were used. No canonical correlations were found to be statistically significant in this case either (α = .05).
BASC-2 Set and WJ-III/DIBELS Set Results
Canonical correlation analysis was also conducted using the BASC-2 Parent and Teacher Attention Problems Scales to form one variable set, with the WJ-III achievement subtests and DIBELS probes forming the other. Two canonical correlations were estimated, and only the first was statistically significant (r = .609, p = .048). The canonical loadings for the BASC-2 and DIBELS/WJ-III achievement sets appear in Table 5.
Canonical Loadings for BASC-2 and WJ-III/DIBELS.
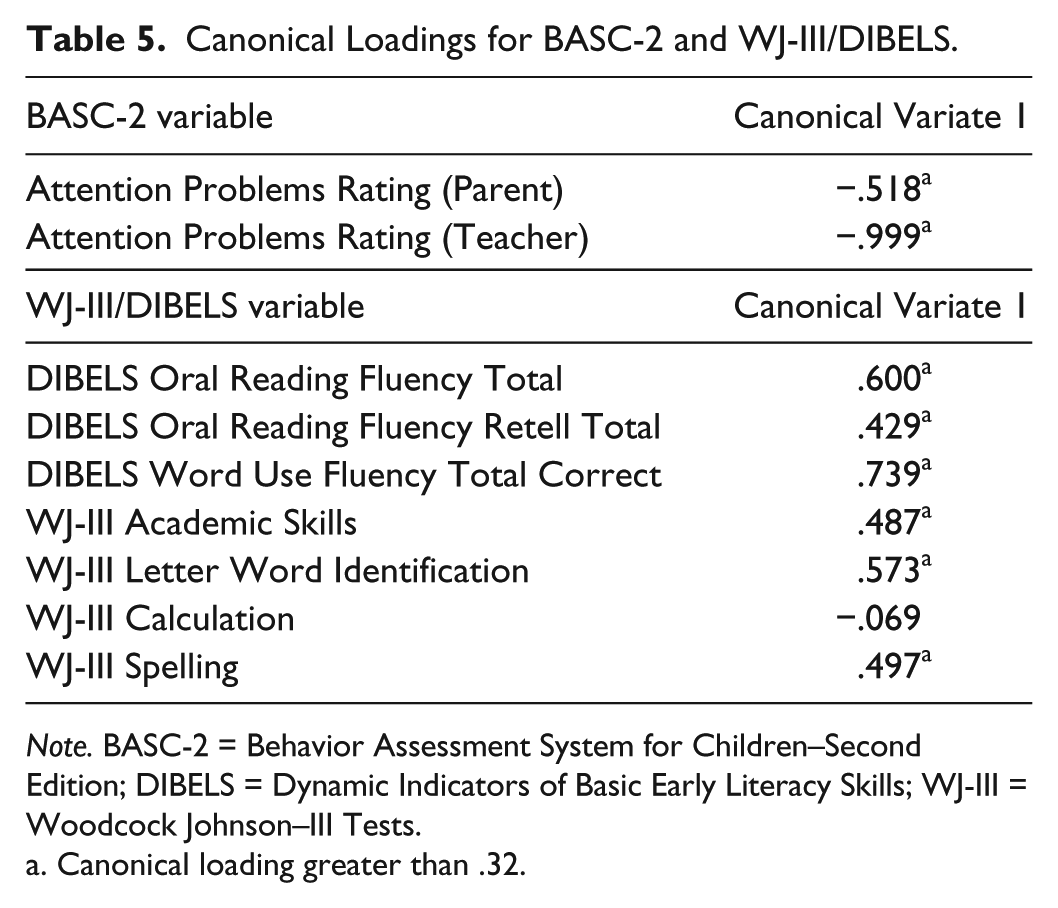
Note. BASC-2 = Behavior Assessment System for Children–Second Edition; DIBELS = Dynamic Indicators of Basic Early Literacy Skills; WJ-III = Woodcock Johnson–III Tests.
Canonical loading greater than .32.
For the BASC-2, the Teacher Attention Problems rating contributed most strongly to the correlation (loading = −.999), with the Parent Attention Problems rating contributing (loading = −.518) to the correlation as well. For the WJ-III achievement subtests and DIBELS set, based on the .32 standard for importance (Tabachnick & Fidell, 2006), DIBELS Word Use Fluency Total Correct (loading = .739), DIBELS Oral Reading Fluency Total (loading = .600), and WJ-III Letter Word Identification (loading = .573), followed by WJ-III Spelling (loading = .497), WJ-III Academic Skills (loading = .487), and DIBELS Oral Reading Fluency Retell Total (loading = .429) were also contributing to the correlation. Calculation (loading = −.069) did not contribute to the correlation.
Hierarchical Regression
To address the third goal of the study (to extend the earlier work by Walcott et al., 2010, to a gifted sample), hierarchical regression analyses were conducted. The BASC-2 Attention Problems Teacher and Parent ratings scales served as the independent variables of primary focus, while the WJ-III achievement measures, DIBELS probes, and Speeded Naming were the dependent variables. The primary goal of these analyses was to determine the amount of variation in these outcomes that was explained by Attention Problems ratings, after the variation associated with language ability was taken into account. Hierarchical regression (Pedhazur, 1997) was employed in the current study, just as it was in the Walcott et al. (2010) study. In the Walcott et al. (2010) work, the DAIL-3 was used in the first step to control for language ability, while in the current study the WPPSI-III Verbal composite was used in the first step of all hierarchical regressions. The BASC-2 Teacher and Parent Attention Problems ratings were entered in the second and third steps of all analyses, respectively. For all hierarchical regressions, n = 36, or the number of participants who had WPPSI-III Verbal scores available in school records and had all other measures completed, with no missing data for any of the measures included in the regressions. Table 6 provides all the descriptive results for this subsample. Table 7 contains the hierarchical regression series results.
Descriptive Information for Participants Included in Hierarchical Regressions.
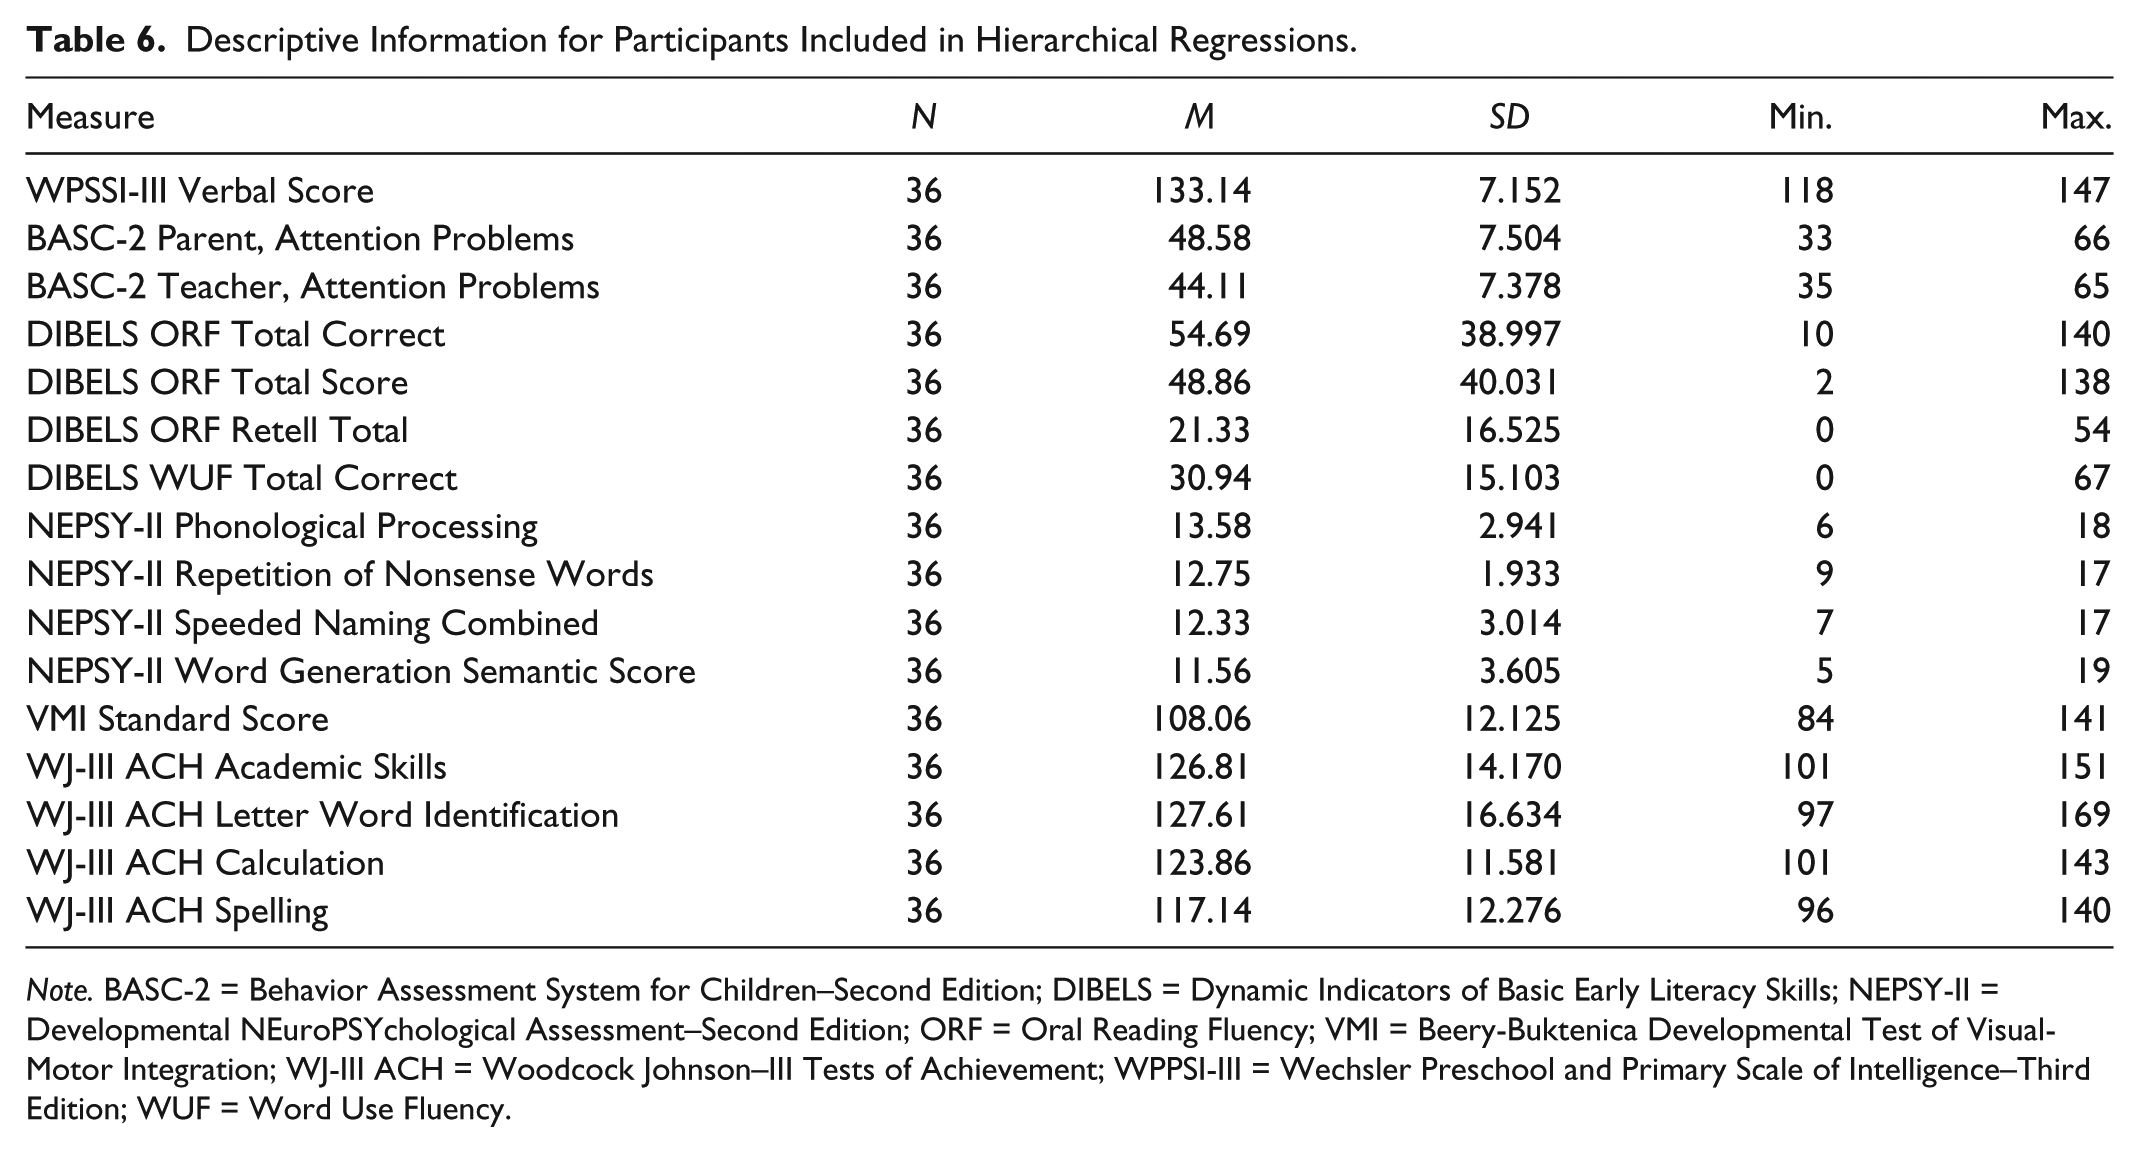
Note. BASC-2 = Behavior Assessment System for Children–Second Edition; DIBELS = Dynamic Indicators of Basic Early Literacy Skills; NEPSY-II = Developmental NEuroPSYchological Assessment–Second Edition; ORF = Oral Reading Fluency; VMI = Beery-Buktenica Developmental Test of Visual-Motor Integration; WJ-III ACH = Woodcock Johnson–III Tests of Achievement; WPPSI-III = Wechsler Preschool and Primary Scale of Intelligence–Third Edition; WUF = Word Use Fluency.
Hierarchical Regression Results Predicting WJ-III Achievement Measures and DIBELS Probes With Language (WPPSI-III Verbal) and Attention Problems (BASC-2 Teacher and BASC-2 Parent).
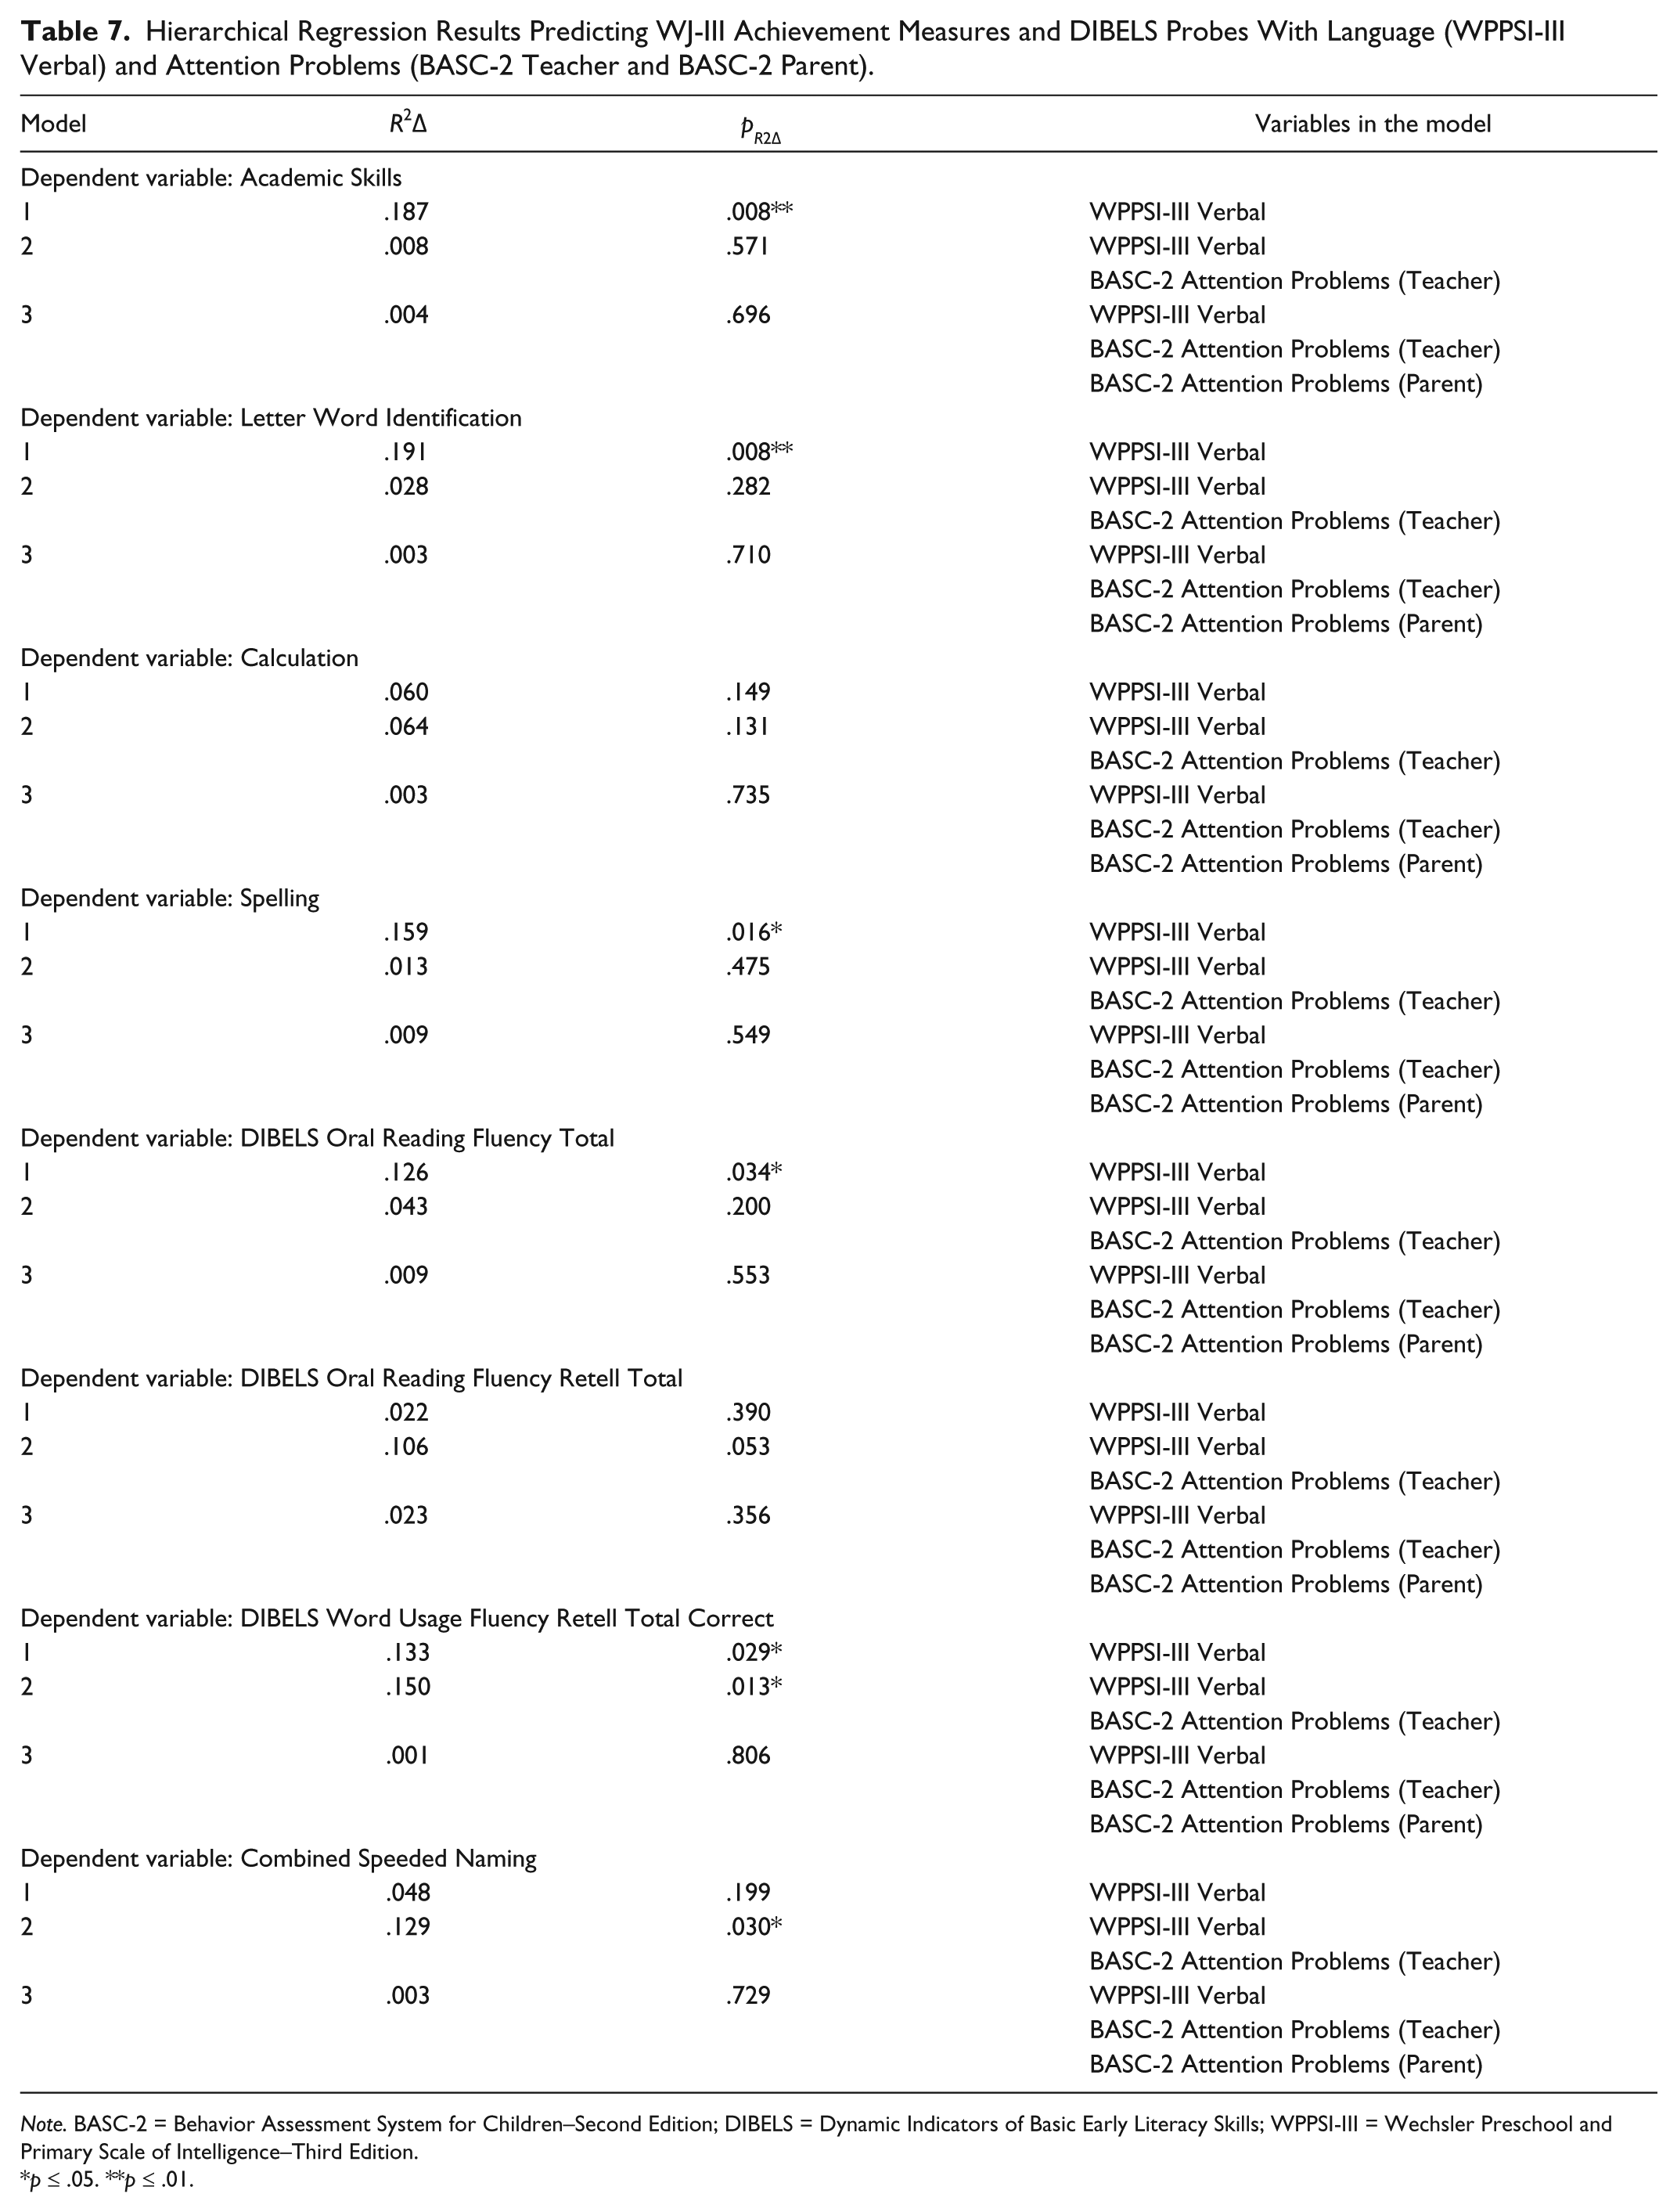
Note. BASC-2 = Behavior Assessment System for Children–Second Edition; DIBELS = Dynamic Indicators of Basic Early Literacy Skills; WPPSI-III = Wechsler Preschool and Primary Scale of Intelligence–Third Edition.
p ≤ .05. **p ≤ .01.
The WJ-III Academic Skills composite and three WJ-III Achievement measures were regressed on Attention Problems Teacher and Parent. The WPPSI-III Verbal composite was significantly positively related (b = 0.857, SE = .306, p = .008) to the Academic Skills composite. As could be expected, children with higher verbal ability performed better on the academic skills assessment. However, neither attention measure significantly explained the additional variance (R2Δ = .008 [Teacher] and .004 [Parent]). Academic Skills includes only subtests that are untimed.
The WPPSI-III Verbal composite was significantly positively related (b = 1.017, SE = .359, p = .008) to Letter Word Identification, while once again neither attention measure contributed significant additional variance (R2Δ = .028 [Teacher] and .003 [Parent]). None of the independent variables were significantly related to the Calculation assessment score, including the WPSSI-III Verbal in the first step. The WPPSI-III Verbal composite was significantly positively related (b = 0.684, SE = .270, p = .016) to the Spelling achievement score, and neither attention measure contributed significant additional variance to the outcome (R2Δ = .013 [Teacher] and .009 [Parent]). No additional variance in the outcome with Spelling as the dependent variable was explained by either Teacher or Parent attention variables.
DIBELS probes were serially regressed on Attention Problems Teacher and Parent. In Step 1, the WPPSI-III Verbal composite was significantly related (b =1.986, SE = .897, p = .034) to Oral Reading Fluency, with neither attention measure contributing significant additional variance (R2Δ = .043 [Teacher] and .009 [Parent]). The WPPSI-III Verbal composite was not significantly related to the DIBELS Retell score in Step 1 of the hierarchical regression. In contrast, the Teacher Attention Problems measure did contribute significant additional variance to the outcome, but the parent ratings for Attention Problems did not (R2Δ = .106, p = .05 [Teacher] and .023 [Parent]). The relationship between the Teacher Attention Problems score and the DIBELS Retell score was negative (b = −0.799, SE = .398, p = .05), such that higher ratings from the teacher of student attention problems were associated with lower retell scores.
DIBELS Word Use Fluency was regressed on Attention Problems Teacher and Parent. The WPPSI-III Verbal composite was significantly positively related to the DIBELS Word Use Fluency Total Correct score in the first step (b = 0.769, SE = .337, p = .029) but was not significant in subsequent steps when the Attention Problems variables were entered into the models. In addition, teacher ratings of Attention Problems significantly contributed additional explained variance to the outcome (R2Δ = .150, p = .013), beyond that associated with verbal ability. However, the parent rating did not contribute any additional variance (R2Δ = .001). The relationship between the teacher rating and the Word Fluency Total Correct score was negative (b = −0.868, SE = .330, p = .013), indicating that a higher teacher rating of student attention problems was associated with a lower Word Use Fluency DIBELS score.
The NEPSY-II Combined Speeded Naming was regressed on Attention Problems Teacher and Parent. The WPPSI-III Verbal composite was not significantly related to the NEPSY-II Combined Speeded Naming score in Step 1. However, in Step 2, the BASC-2 teacher rating of student attention problems did contribute significant variance to the outcome (R2Δ = .129, p = .03), whereas the comparable parent rating did not in Step 3 (R2Δ = .003). The relationship between the teacher ratings of Attention Problems and the NEPSY-II Combined Speeded Naming score was negative (b = −0.160, SE = .071, p = .03), indicating that higher teacher ratings of Attention Problems were associated with lower Speeded Naming test scores.
Discussion
The primary goal of this study was to report baseline data on cognitive, academic, and executive functioning to assist researchers with future studies designed to establish developmental trajectories for young gifted learners. To address this goal, young gifted students’ performance was gauged on both traditional assessment measures of cognitive ability and achievement as well as benchmarking measures widely used in most schools with early–elementary age pupils. The performance of young gifted learners on common child neuropsychological tests associated with preliteracy and the early-reading learning process was also analyzed, as were measures of inattention and executive functioning.
This kindergarten gifted sample had intelligence quotient scores in the very superior range, with smaller standard deviations than are seen in the overall population (Wechsler, 2002) and generally high means on traditional achievement measures. However, much greater variability was observed on the benchmarking measures (DIBELS) and the language subtests of the neuropsychological measure (NEPSY-II). Only an average mean score on a visual–motor processing neuropsychological measure (VMI) was obtained. The benchmarking and neuropsychological measures may provide more nuanced information about individual young gifted learners that could potentially supplement traditional assessments to provide richer information for earlier intervention. These results are similar to Marcin’s (2010) conclusions centered on demonstrating the value of using DIBELS and NEPSY-II for screening with a young general sample. Gifted educators and scholars have called for a strengths-based approach to RtI with gifted learners (Coleman & Hughes, 2009; Crepeau-Hobson & Bianco, 2011). Though concern has been expressed that gifted learners may demonstrate ceiling effects on achievement measures (see Brown, 2012), the issue was not noted with this sample for the benchmarking and typical RtI measures. Thus, the important issue of progress monitoring in the strengths-based approach to gifted RtI could potentially be facilitated by some of the measures explored in this study.
The finding that gifted children show considerable variability in early-achievement benchmarking measures offers support for the recent calls for giftedness to be defined as a developmental process (NAGC, 2010; Subotnik et al., 2011), with the definition of giftedness in young children focusing on their potential for outstanding levels of achievement, as measured by aptitude tests such as the WPPSI-III, used in the current study. In other words, gifted potential may not be demonstrated through uniformly high scores on early academic benchmarking measures. Thus, this finding also has direct implications for the identification processes endorsed by school districts. Districts may rely on teachers to refer students for screening and identification. As such, teachers who consider only results from common benchmark tests (e.g., DIBELS) may fail to recognize and refer students who have the potential for outstanding achievement yet who do not have correspondingly high scores on these benchmark tests. Teachers will need additional support for ascertaining markers of giftedness, as tremendous variability was observed on benchmark measures in the already identified gifted students in this sample. Consequently, it may not be valid to consider such benchmarking data in isolation in the screening process for identifying gifted children. Replication of the observed pattern of functioning with larger and diverse samples of young gifted individuals is needed before conclusions can be drawn with certainty. Longitudinal studies that consider actual outcomes and placement decisions would also lend validity to focusing on markers of gifted potential rather than on common benchmarking screening measures when making referrals for gifted identification.
A secondary goal of this study was to clarify the general findings of Mesman and Kibby (2011) and those in the twice-exceptional sample of Assouline et al. (2010) by extending the earlier work to a young gifted sample. The present study explicitly addressed how other specific groups of assessments (variate sets) relate to each other to elucidate the nature of the reading acquisition and intervention processes in young gifted students. When considering a set of neuropsychological measures including the NEPSY-II language subtests and the VMI in relation to a set of our traditional achievement measures and DIBELS reading probes, NEPSY-II Oromotor Sequencing and Repetition of Nonsense Words were the most important followed by VMI results and Speeded Naming. Neither Phonological Processing nor Word Generation produced important loadings for this sample despite the importance that the letter-sound level (see Holland et al., 2004) and vocabulary (see Mesman & Kibby, 2011) have traditionally been accorded. All but Calculation on the achievement/DIBELS set for this series had important loadings, with DIBELS Oral Reading Fluency and WJ-III Letter Word Identification contributing the most to the significant canonical correlation. Similar to the findings of Mesman and Kibby (2011) and Holland et al. (2004), both with general-population subjects, visual processing skills and language-based preliteracy skills are both important in the academic progress of young gifted children. Assouline and colleagues’ (2010) assertion that comprehensive assessment is imperative is also supported.
These emerging data suggest that NEPSY-II measures potentially could be used effectively to screen for early-reading difficulties in young gifted children. Neuropsychological tests such as these are quick to administer (an important consideration with younger children), and any of the subtests can also be administered and scored as a stand-alone measure. The measures, with further validation with larger gifted samples and factor analysis, also would have the potential of “unmasking” disabilities at an earlier point in their development. Tiers 1 and 2 of an RtI three-tier model have been described as particularly difficult to implement with gifted learners due to masking effects, and the use of neuropsychological measures has been recommended as a solution to masking at these tiers (Crepeau-Hobson & Bianco, 2011). Our findings lend preliminary support to these recommendations. Readers are also encouraged to consider the promising “third method” approaches to RtI and specific learning disability identification, which incorporate the use of cognitive and neuropsychological measures and related subtests earlier into the RtI and assessment processes (see Flanagan, Fiorello, & Ortiz, 2010).
A third goal of this study was to extend the work of Walcott et al. (2010) in ascertaining what role, if any, inattention may play in preliteracy attainment for young gifted students. First, canonical analyses were conducted with a set of BASC-2 Attention Problems ratings and a set of achievement/DIBELS results. For the BASC-2, the Teacher Attention Problems rating was highly important, with the Parent Attention Problems rating also contributing to the correlation. For the WJ-III achievement subtests and DIBELS set, DIBELS Word Use Fluency Total, DIBELS Oral Reading Fluency Total, and WJ-III Letter Word Identification were all important. Based on our findings, the higher the degree of attention problems noted in kindergarten age gifted students (particularly by their teachers), the greater is the difficulty with academic and preliteracy tasks that these students may demonstrate. Hierarchical regression was conducted to discern the unique variance inattention might contribute to academic and preliteracy skills, beyond what is accounted for by language ability (Walcott et al., 2010). In these analyses, teacher ratings of attention problems contributed negative unique variance to Word Use Fluency and especially to Speeded Naming. Both of these tests have time constraints. The Speeded Naming result is in contrast with Walcott and colleagues’ (2010) nonsignificant findings in a general-population sample and with a different measure of rapid automatized naming. The earlier work evaluated the relationship longitudinally. This, in addition to the different measures of verbal ability in the first step and our use of NEPSY-II to look at the construct of rapid automatized naming, may account for the differences in the findings.
The canonical and hierarchical regression results for ratings of attention problems in young gifted children support the assertions of some researchers who call for more comprehensive and contextual information to be provided in assessments for gifted children (Assouline et al., 2010; Foley Nicpon et al., 2011). Also supported are the conclusions of Shaywitz and Shaywitz (2008) that the reading process and attention may be more related than was previously thought. Teacher ratings of early inattention could be useful in screening for academic concerns. Additionally, strategies to help improve sustained attention may be useful in improving a gifted student’s reading prognosis.
Limitations and Future Research
This is a preliminary exploratory study for a larger longitudinal study. The current sample is not large; this factor, in concert with the lack of empirical information on young gifted children, restricts the types of statistical analyses that are appropriate to conduct at this time. For example, our statistical power to find relationships in the data is reduced due to the relatively small sample size. With a larger sample, the risk of erroneously nonsignificant findings could potentially be reduced (Cohen, 1988). Further replication of the findings with larger samples is needed before firm conclusions can be drawn. As such, the findings should be interpreted only as offering emerging patterns and baseline data to consider with regard to developmental trajectories of giftedness in young children. Additionally, the sample consisted only of participants from middle and upper socioeconomic status families, and as such, it is not representative of the general population. However, variability among many of the reading and preliteracy probes and neuropsychological measures was observed despite the very similar opportunities afforded to the participants. Nevertheless, for a more thorough understanding of these constructs as they relate to the general population of gifted learners, future studies should include participants from lower socioeconomic status families and other underrepresented populations.
The findings of the present study indicate the presence of early markers of inattentiveness and executive functioning concerns in gifted kindergarteners. It would be interesting to replicate this study with preschoolers who have been identified as gifted in order to determine if such indicators could be detected in gifted children at an even younger age than kindergarten. Additionally, further research is needed to ascertain how the significant variables observed in this study can be used to develop empirically supported interventions and differentiation in the classroom. We will conduct further longitudinal work to this end and call on other researchers to do so as well to determine if the observed early variability and unique variance is predictive of any later learning difficulties and disabilities.
Although preliminary in nature, the present study offers an emerging understanding of typical functioning in the young gifted population on measures of orthographic processing, neurological language subtests (refer to NEPSY-II in the Results), a visual–motor processing measure, and ratings of inattention and executive functioning. These baseline findings offer the much-needed quantitative empirical research on this population of learners. It is hoped that the findings will contribute, first, to the early detection of specific learning difficulties within gifted children and, second, to the development of targeted interventions that will facilitate the development of their potential. The present results also call into question the use of high scores on early benchmarking measures such as DIBELS as referral indicators in the gifted assessment nomination process. However, the results are suggestive of how RtI may be approached with young gifted learners in Tiers I and II by expanding the potential screening, benchmarking, and progress-monitoring tools that can be used with this population. The current findings suggest that the higher the degree of attention problems noted in kindergarten age gifted students, the greater is the difficulty with academic and preliteracy tasks that these students may demonstrate. The value of early inattention screening is paramount.
Footnotes
Declaration of Conflicting Interests
The author(s) declared no potential conflicts of interest with respect to the research, authorship, and/or publication of this article.
Funding
The author(s) received no financial support for the research, authorship, and/or publication of this article.