
Abstract
The Adolescent and Adult Time Inventory–Time Attitude Scales (AATI-TA) were used to examine the association between time attitudes and self-reported academic and social–emotional outcomes in 967 academically talented adolescents (M age = 14.27, SD = 1.42) attending a summer educational program. The AATI-TA consists of six subscales assessing positive and negative attitudes toward the past, present, and future. Bivariate associations between AATI-TA subscales scores and outcomes were small. Cluster analyses of AATI-TA scores yielded several profiles, labeled Pessimists, Negatives, Ambivalents, and Positives. Students with Positive and Ambivalent profiles reported greater course enjoyment, higher perceived academic rank, and higher expected summer GPA than their peers with the Negative profile, even though the groups did not differ on how challenging they perceived the courses to be, time spent on homework, and studying. In keeping with previous research using the AATI-TA, Positives reported the most favorable outcomes, Negatives the least, and Ambivalent and Pessimistic adolescents fell between these two groups. Future research on time attitudes should include measures of actual academic performance.
Keywords
Time constructs have been implicated in human functioning for many decades. As early as 1939, Frank argued that time perspective has a pervasive impact on human behavior. Lewin (1951, p. 75) stated that an individual’s behavior “does not depend entirely on his present situation” but “is deeply affected by his hopes and wishes and by his views of his own past,” and he defined time perspective as “the totality of an individual’s views of his psychological future and psychological past existing at a given time.” Erikson (1950, 1968) incorporated this view into his psychosocial stage theory, contending that the successful resolution of trust versus mistrust in infancy (Stage 1) manifests as time perspective in adolescence. Although some researchers treat time perspective as an integrated, albeit multidimensional, construct (e.g., Zimbardo & Boyd, 1999), other scholars (e.g., Mello & Worrell, 2015; Shipp et al., 2009; Worrell et al., 2013) contend that time perspective is an umbrella term that incorporates several different time constructs.
Dixson et al. (2017) grouped time constructs with the growing set of perception-based, psychosocial variables (e.g., grit, growth mind-set) that have been implicated in adolescent well-being and academic functioning (Yeager & Walton, 2011). Many time-perspective constructs that were initially the focus of research assessed the future. These include future orientation (Nurmi, 1991), hope (Snyder et al., 1991, 1997), optimism (Scheier & Carver, 1985), perceived life chances (Jessor et al., 1990), and possible selves (Oyserman & Markus, 1990), among others. More recent conceptualizations of time include assessments of all three time periods, because as Zimbardo and Boyd noted, scoring low on the past or present provides no indication of how you will score on the future, for example. In other words, all three time periods have to be assessed in order to understand their contributions to an individual’s overarching time perspective.
To date, there are several multidimensional models that deal with time perspective, including temporal focus (Shipp et al., 2009), temporal satisfaction with life (Pavot et al., 1998), and time perspective (Mello & Worrell, 2015; Zimbardo & Boyd, 1999, 2008). The Mello model of time perspective (Mello & Worrell, 2015) is composed of time meaning, time orientation, time frequency, time relation, and time attitudes. Time attitudes, the construct of interest in the current study, are defined as emotional and evaluative feelings toward the past, the present, and the future (Andretta et al., 2013). Time attitude scores were chosen as the variables for use in this study because they have extensive psychometric evidence in the extant literature (McKay et al., 2020; Worrell & Andretta, 2019; Worrell et al., 2018).
Recent studies of time attitudes in adolescents and young adults have indicated substantial associations with alcohol use (e.g., McKay et al., 2014), psychological functioning (e.g., Andretta et al., 2014; Buhl & Lindner, 2009; Worrell & Mello, 2009), educational outcomes (e.g., Alansari et al., 2013; Andretta et al., 2014), and even cultural constructs such as perceived discrimination (Worrell & Andretta, 2019). To the extent that psychosocial variables play an important role in maximizing talent (see Olszewski-Kubilius et al., 2015; Subotnik et al., 2011), time attitudes and other time constructs also may be important factors in the functioning of gifted and talented students. Thus, in the current study, we examined the association between time attitudes and several academic and social–emotional outcomes in a sample of academically talented students. In addition to seeing if time attitude profiles exist in this sample—this was the first study of time attitudes in a gifted and talented sample—we also wanted to see if time attitudes would predict outcomes in a situation where the range of achievement is restricted.
Time Constructs in Gifted and Talented Samples
Studies Comparing Gifted and Nongifted Students
Much of the early research on time constructs in gifted students involved comparisons of gifted and talented youth to youth not classified as gifted. For example, students in regular and gifted education were compared on optimistic and pessimistic attitudes in two studies conducted 20 years apart (George & Gallagher, 1978; George & Scheft, 1998) at the same school. Attitudes were assessed based on scenarios about 50 years in the future. In the 1978 study, 52% of the gifted students and 28% of the regular education students reported pessimistic attitudes; in the subsequent study, 62% of the gifted students and 40% of the regular education students reported pessimistic attitudes. The high levels of pessimism were attributed, in part, to negative news in the media, which the authors speculated high-achieving students may have been more attuned to.
In a 1999 study, Worrell et al. compared 33 academically and behaviorally at-risk students attending a continuation high school, 20 at-risk students deemed resilient because they opted into attending an optional mentoring program, and 50 academically talented students attending a summer program on self-esteem and perceived life chances. Perceived life chances is a composite time perspective variable based on the probability of attaining 10 positive future outcomes (e.g., graduation from high school, going to college, having a job you enjoy, being respected in your community). The three groups did not differ on self-esteem (g ≤ 0.21), but the resilient at-risk group (g = 0.73) and the talented group (g = 1.01) reported significantly (p < .005) and meaningfully higher perceived life chances than the academically and behaviorally at-risk group; moreover, the resilient at-risk group and academically talented group did not differ on perceived life chances (g = 0.02). Worrell et al. (1999) suggested that perceived life chances was a promotive factor for academically talented students and a protective factor for at-risk students.
Worrell (2007) reported a similar pattern of findings in a study comparing 23 academically talented students to 27 at-risk high school graduates. The groups differed significantly (p < .004) on risk factors (e.g., number of days truant, number of middle schools attended, engaging in problem behaviors) and academic variables (e.g., grade point average [GPA], perceived importance of college attendance). In contrast, no differences were observed on hope in the future or the expectation of having a good job by age 30 years. In another study, Worrell et al. (2003) compared 76 students elected to the National Honors Society to 33 at-risk graduates and 31 at-risk dropouts on the perceived importance of going to college. Ninety-six percent of the honors students viewed college attendance as important or essential compared with 63% of the at-risk graduates and 40% of the at-risk dropouts.
Although the results of the two earlier studies suggest that gifted and talented youth are more pessimistic than their nongifted peers (e.g., George & Gallagher, 1978; George & Scheft, 1998), in other studies, gifted and talented students have reported higher levels of hope, perceived life chances, and educational expectations than nongifted peers (e.g., Worrell, 2007; Worrell et al., 1999, 2003). Further still, the results of several studies indicate that future-oriented constructs act as protective factors for academically and behaviorally at-risk youth (e.g., Worrell & Hale, 2001; Wyman et al., 1993) and promotive factors for youth who are not at risk (e.g., Dixson et al., 2017). One hypothesis is that positive expectations for the future lead to increases in adaptive behaviors and decreases in problematic behaviors among at-risk youth, leading to more positive outcomes such as graduating from high school.
Studies of Time Constructs in Gifted and Talented Students
In their megamodel of talent development, Subotnik et al. (2011) singled out psychosocial variables as enhancers of talent development, and their discussion of these variables included several future-oriented constructs (e.g., goal orientation, motivation, self-efficacy, task commitment). Hoekman et al. (2005) examined motivation in a sample of 402 intellectually gifted, seventh-grade students in Australia. They used structural equation modeling to examine the associations among several constructs, including trait and state anxiety, intrinsic and extrinsic motivation, optimism, satisfaction with school, and strain on coping resources, a measure of emotional exhaustion. Hoekman et al. (2005) found that the absence of trait anxiety predicted optimism (β = .74), which, in turn, had positive associations with intrinsic motivation (β = .33), extrinsic motivation (β = .35), and satisfaction with school (β = .54), and a negative association with strain on coping resources (β = −.48). Thus, optimism was an important mediator in the model, which had an excellent fit (goodness of fit index = 0.96, adjusted goodness of fit index = 0.98, root mean square error of approximation [RMSEA] = 0.04).
In a study using the Zimbardo Time Perspective Inventory (Zimbardo & Boyd, 1999), Mello and Worrell (2006) reported that Present Fatalistic and Future Positive scores were negatively (β = −.16) and positively (β = .13) related to academic achievement, respectively, in a sample of academically talented students. More recently, Dixson et al. (2016) found that hope was associated with perceived ability (β = .15) in a sample of 609 academically talented students. In sum, research has substantiated the hypothesis that time constructs are correlates of outcomes in gifted and talented students. Although many of the coefficients are modest, this outcome is in keeping with the restriction of range in achievement scores in students with high achievement.
Time Attitudes
Time Attitude Correlates
Time attitudes are operationalized with the Adolescent and Adult Time Inventory−Time Attitude Scales (AATI-TA 1 ; Mello & Worrell, 2007), a group of six subscales assessing positive and negative attitudes toward the past, the present, and the future: (a) Past Positive, (b) Past Negative, (c) Present Positive, (d) Present Negative, (e) Future Positive, and (f) Future Negative. Psychometric studies have indicated that scores on the six AATI-TA subscales are internally consistent (alphas generally in the .70 to .90 range) and structurally valid (acceptable fit indices) in adolescent samples across multiple national contexts, including Germany (Buhl & Lindner, 2009), Japan (Chishima et al., 2019), New Zealand (Alansari et al., 2013), Slovenia (Juriševič et al., 2017), Spain (Konowalczyk et al., 2018), Turkey (Şahin-Baltacı et al., 2017), the United Kingdom (McKay et al., 2015; Worrell et al., 2018), and the United States (Worrell et al., 2013). See McKay et al. (2020), for a meta-analytic summary. Concurrent validity of AATI-TA scores has been established with several constructs, including hope (|.38| to |.52|), optimism (|.44| to |.62|), perceived life chances (|.27| to |.51|), and self-esteem (|.44| to |.63|), as well as Zimbardo Time Perspective Inventory scores (Konowalczyk et al., 2018; McKay et al., 2018; Worrell & Mello, 2009).
Scores on the AATI-TA subscales typically have had more modest correlations with academic achievement. Alansari et al. (2013) examined the relationship between time attitudes and self-reported achievement in a sample of 579 students attending an all-female, high decile (i.e., high socioeconomicstatus) school in New Zealand. They reported correlations between time attitude scores and scores on self-reported school marks ranging from |.06 to |.25|, Mdn = |.15|. In an American sample of 300 middle and high school students from several rural, urban, and suburban school districts, Andretta et al. (2014) reported similar findings for the association between time attitude scores and self-reported academic achievement (|.04| ≤ r ≤ |.25|, Mdn = |.14|). In a third study, Prow et al. (2016) examined the association between GPA taken from school records and time attitude scores in a sample of 1,491 adolescents attending an urban high school and reported slightly larger correlations: Past Positive (.20), Past Negative (−.29), Present Positive (.24), Present Negative (−.25), Future Positive (.17), and Future Negative (−.29). Thus, correlations between time attitudes and academic achievement are typically in the modest to moderate range.
Time attitudes also are correlated with constructs that predict academic achievement. Alansari et al. (2013) reported that time attitudes were moderately related to attitudes toward school (Mdn = .36) and attitudes toward teachers (Mdn = .28), with valence of the correlations matching the valence of the time attitudes. In samples of adolescents in Scotland and Northern Ireland, McKay et al. (2016) found correlations in the .20 to .30 range between time attitude scores and academic, social, and emotional self-efficacy. Similar results have been reported for valuing education (Mdn = .17), school belonging (Mdn = .27), perceived barriers to attending college (Mdn = .24), abstract attitudes toward education (Mdn = .24), and concrete attitudes toward education (Mdn = .25; Worrell & Andretta, 2019). In sum, time attitudes have low to moderate bivariate associations with several variables related to academic achievement.
Time Attitude Profiles
Much of the research on time constructs has used variable-centered analyses, such as correlations or regressions, which involve comparisons of variables (e.g., looking at the associations between time constructs and other constructs, such as self-efficacy and attitudes toward school). Researchers have also begun to use person-centered analyses (e.g., cluster analysis, latent profile analysis) to study time constructs. Cluster analyses and latent profile analyses group individuals who are similar to each other on designated variables into a more parsimonious set of profiles or clusters. Person-centered analyses are particularly important in the study of time attitudes, as they allow researchers to create profiles based on the six time attitudes, such that individuals within a profile “have multiple co-occurring time attitudes that are as similar as possible” but also as “dissimilar as possible” from individuals in other profiles (McKay et al., 2016, pp. 203-204). Thus, each profile takes into account individuals’ positive and negative attitudes toward the three time periods.
Whereas one expects the factor structure of a well-constructed scale to be stable in each sample in which it is assessed, the results of cluster analyses and latent profile analyses are entirely dependent on the sample being examined. Thus, whereas replication is important in research generally, replication in person-centered analyses are crucial for results to have meaning. To date, time attitude profiles have been identified in five countries (see Table 1). In the first of these studies, Buhl and Lindner (2009) used latent class analysis to group 1,691 German adolescents into six distinct time attitude profiles based on their AATI-TA scores.
Profiles Reported Across Samples.
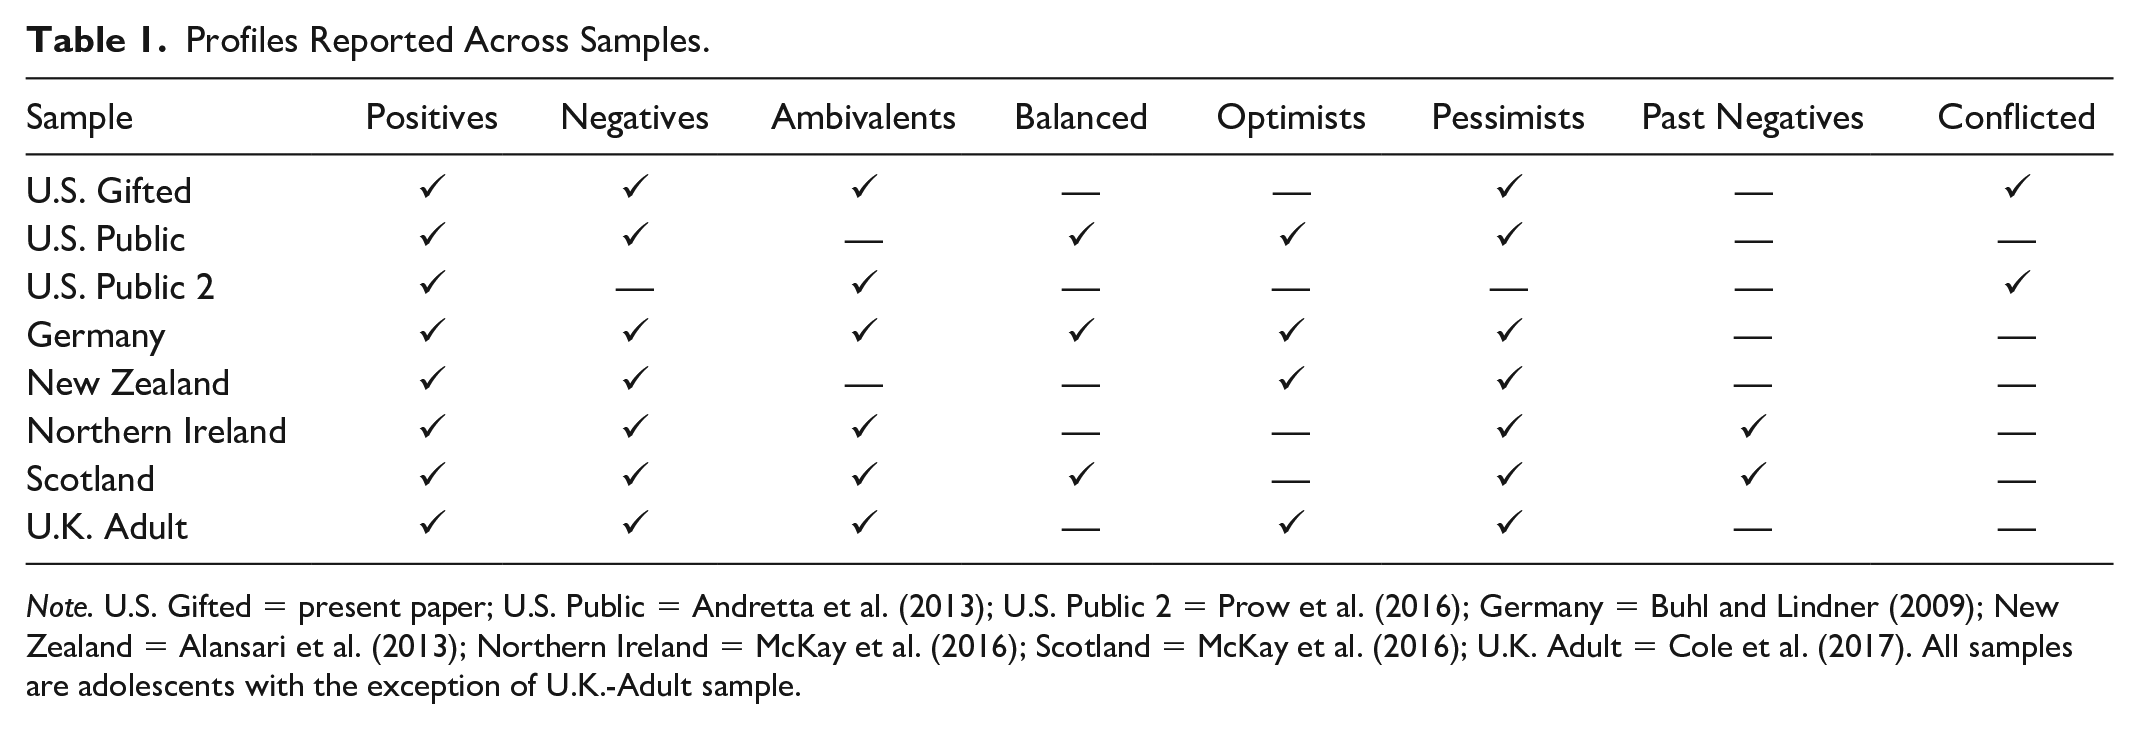
Note. U.S. Gifted = present paper; U.S. Public = Andretta et al. (2013); U.S. Public 2 = Prow et al. (2016); Germany = Buhl and Lindner (2009); New Zealand = Alansari et al. (2013); Northern Ireland = McKay et al. (2016); Scotland = McKay et al. (2016); U.K. Adult = Cole et al. (2017). All samples are adolescents with the exception of U.K.-Adult sample.
Balanced (37.3%) adolescents were characterized by slightly higher positive than negative attitudes toward each time period and the means on all six of the time attitudes were similar to the sample’s mean scores. Positive (30.4%) adolescents (labeled Optimistic by Buhl & Lindner, 2009) reported substantially higher scores for positive than negative attitudes across all three time periods. Pessimistic (15.3%) adolescents had meaningfully lower positive scores and meaningfully higher negative scores than sample mean scores, with Present Negative scores being highest. A fourth cluster of adolescents (8.6%) reported higher negative than positive attitudes toward the past and higher positive than negative attitudes toward the future and were called Optimistic (labeled Past Pessimistic/Future Optimistic by Buhl & Lindner, 2009). The fifth cluster (5.7%) reported similar average scores for both positive and negative attitudes toward all three time periods and were called Ambivalent. The sixth and smallest cluster, called Negatives (and Pessimistic by Buhl & Lindner, 2009) consisted of only 2.7% of the sample. These adolescents reported very high negative attitudes and very low positive attitudes toward the past, the present, and the future relative to peers. Buhl and Lindner (2009) reported that indicators of well-being differed meaningfully across the six profiles, with the most substantial differences occurring between Positives and Negatives. Positives reported the highest levels of life satisfaction, school self-efficacy, positive relationships with teachers, perceived support, and social responsibility in school.
Andretta et al.’s (2014) cluster analysis of AATI-TA scores in a sample of 300 American adolescents yielded five profiles that were similar to those in the Buhl and Lindner (2009) study: (a) Balanced (29%), (b) Pessimists (23%), (c) Positives (28%), (d) Negatives (10%), and (e) Optimists (10%). In keeping with Buhl and Lindner’s findings, Positives reported the highest levels of self-esteem and the lowest levels of perceived stress, whereas Negatives reported the lowest levels of self-esteem and the highest levels of perceived stress. Scores for the Balanced, Optimists, and Pessimists fell between the Positives and Negatives. A meaningful difference in self-reported GPA was only found between Positives and Pessimists with the former reporting higher scores (d = 0.56). Positives and Optimists expected the highest levels of educational attainment with > 80% expecting to attend a 4-year university and > 60% expecting a graduate degree. Twenty-four percent of Pessimists expected to attain only a high school diploma, whereas less than 10% in every other cluster expected to attain only a high school diploma.
Alansari et al. (2013) found four profiles in their sample, all of which had been found in the other two studies: (a) a Negative profile (22%), (b) a Pessimist profile (19%), an Optimist profile (21%), and a Positive profile (40%). Individuals with the Positive and Optimist profiles reported higher levels of academic self-ranking, positive attitudes toward school and teachers, and academic achievement than peers with Negative and Pessimist profiles. Furthermore, adolescents with Negative profiles reported cutting school more frequently than their Positive peers. In a more recent study, Prow et al. (2016) identified three profiles in a sample of more than 1,000 students attending an urban high school in the United States. The majority of the participants were classified as having Ambivalent (n = 1,120, 75%) or Positive (n = 252, 17%) profiles. Students in the third profile, labeled Conflicted (n = 119, 8%), had the high scores on negative time attitudes typically associated with the Negative profile, but their positive time attitude scores were at or slightly above the sample mean. Prow et al. (2016) found that the Positive group had higher GPAs (based on school records) than the Ambivalent (d = 0.75) and Conflicted (d = 1.27) groups, and the Ambivalent group had a higher GPA than the Conflicted (d = 0.36) group.
The Present Study
As reviewed above, there is a now a substantial body of research highlighting the importance of time constructs in adolescent samples. Time attitude profiles, more specifically, have been associated with both educational outcomes and psychological well-being in adolescents (Alansari et al., 2013; Andretta et al., 2014; Buhl & Lindner, 2009; Prow et al., 2016), and positive time attitude profiles (e.g., Positives, Optimists, and Balanced) are associated with higher levels of adaptive functioning than negative profiles (e.g., Pessimists, Negatives). The goal of the present study was to examine time attitude profiles in a sample of academically talented adolescents.
First, we applied cluster analysis to AATI-TA scores to see if interpretable profiles emerged in this talented sample. We hypothesized that some of the more common profiles (e.g., Positives) would emerge. Second, we examined differences among profiles on seven self-reported educational outcomes: (a) time spent completing homework, (b) time spent studying beyond homework completion, (c) perceived level of challenge in their academic course, (d) level of enjoyment in their academic course, (e) students’ academic self-ranking relative to students in their home school, (f) students’ academic self-ranking relative to students in the gifted program, and (g) students’ expected GPA in the summer program.
Higher levels of academic achievement and more positive attitudes to school have been observed in students with positive time attitude profiles compared with peers with negative time attitude profiles (Alansari et al., 2013; Andretta et al., 2014). However, as our sample consisted of academically talented students chosen specifically on the basis of high academic performance, thereby restricting the range of scores on achievement-related outcomes, it was not clear that substantial between group differences would be observed. Thus, we hypothesized that any differences found would be in keeping with directions found in previous research—that is, more positive outcomes for individuals in positive relative to negative profiles—but would have small effect sizes.
Method
Participants
Participants included 967 adolescents (45.90% male, 52.7% female, 1.3% missing) ranging in age from 11 to 19 (M = 14.27, SD = 1.42) attending a 6-week summer educational program for the academically talented adolescents at a major research university in a Western state. These students represented 87% of the students attending the program participants. Students apply for entrance to the program, and the program uses multiple criteria for admission, including academic achievement based on the student’s report card, standardized test scores, and a work product that the student is proud of, as well as a teacher recommendation and a statement of interest in the subject matter from the student. Students in whole-year accelerated mathematics classes must provide a recommendation from their current mathematics teacher and also obtain a passing score on a diagnostic mathematics test designed to assess the students’ readiness for the class they have applied for. The sample’s average self-reported GPA at their home schools was 3.87 (SD = 0.27), which is in keeping with the average GPA from the program database.
Adolescents self-identified with several ethnic–racial groups: American Indian/Alaskan Native/Pacific Islander (n = 10, 1.03%), Black/African American (n = 24, 2.48%), Chicano/Latino/Other Hispanic (n = 86, 8.89%), White/European American/Middle Eastern (n = 90, 9.31%), Chinese Americans (n = 441, 45.60%), and Other Asian American (including East Indian/Pakistani, Japanese American, Korean American, Filipino American, Other Asian American; n = 193, 19.96%). Several students endorsed more than one designation (i.e., Multiethnic; n = 89, 9.20%), and 34 (3.52%) participants chose Other or did not respond to this question. Asian American and European American students are generally overrepresented in gifted and talented education programs and selective colleges and universities (Worrell & Dixson, 2018). In the context of California with its large Asian American population, Asian Americans are the largest group at the most selective University of California campuses (Ashkenas et al., 2017), just as they are in gifted and talented education programs.
Procedure
All of the questions were self-report and included on the program evaluation questionnaire that students are invited to complete at the end of the program. Students and their parents are e-mailed a link to the survey in the penultimate week of the program, which is left open for 2 weeks, and teachers also remind students that the survey is open. The survey is completed anonymously, and reminders are sent periodically to students. The questions on the variables used in this study are administered at the end of the program each summer, and the time attitude questions were included at the end of the questionnaire for one summer. In addition to the variables used in this study and AATI-TA items, the survey contained several questions that were not used in the present study (e.g., evaluations of the instructor effectiveness). The use of the program evaluation survey data for research was approved by the institutional review board of the institution at which the program is housed.
Measures
Time Attitudes
Time attitudes were assessed using the AATI-TA (Mello & Worrell, 2007; Worrell et al., 2013), a 30-item measure with six 5-item subscales: Past Positive, Past Negative, Present Positive, Present Negative, Future Positive, Future Negative. Respondents rate each item on a 5-point Likert-type scale (1= strongly disagree, 5 = strongly agree), and no items are reverse-coded. In previous studies, AATI-TA scores have yielded strong internal consistency estimates (αs in the .70 to .90 range) and evidence of discriminant, convergent, and structural validity in adolescent samples (Buhl & Lindner, 2009; Chishima et al., 2019; Worrell et al., 2013, 2018; Worrell & Mello, 2009). Stability coefficients for AATI-TA scores are in the .40 to .60 range over a 12-month period and in the .33 to .50 range over 24 months, and parallel stability coefficients for the Big Five personality traits (i.e., extraversion, agreeableness, openness, conscientiousness, and neuroticism) in adolescent samples (Worrell et al., 2018).
Reliability estimates for scores in this study and sample items from each subscale are as follows: (a) Past Positive (α = .88, 95% confidence interval [CI] ≥ .87; “I have happy thoughts about my past”), (b) Past Negative (α = .90, 95% CI ≥ .89; I wish that I did not have the past that I had”), (c) Present Positive (α = .89, 95% CI ≥ .87; “Overall, I feel happy about what I am doing right now”), (d) Present Negative (α = .87, 95% CI ≥ .85; “I am not satisfied with my life right now”), (e) Future Positive (α = .92, 95% CI ≥ .90; “I am excited about my future”), (f) Future Negative (α = .84, 95% CI ≥ .82; “Thinking about my future makes me sad”). Confirmatory factor analyses supported the six-factor structure as the best-fitting model in this sample (comparative fit index [CFI] = .963, nonnormed fit index [NNFI] = .959, RMSEA = .037), with the fit indices for a two-factor structure (CFI = .754, NNFI = .736, RMSEA = .094) based on valence and a three-factor structure (CFI = .824, NNFI = .810, RMSEA = .079) based on time period falling far short of acceptable (Manjunath et al., 2013). Factor coefficients for the 30 items ranged from .61 to .88.
Outcome Variables
The outcome variables consisted of a series of single-item questions: (a) How many hours per class do you spend on homework assignments (i.e., during the summer course)? (b) How many hours per class do you study after completing homework (i.e., during the summer course)? (c) How challenging was this course for you (not challenging [1] to extremely challenging [5])? (d) How much did you enjoy taking this course (not at all [1] to a great deal [5])? (e) Rate yourself in academic standing compared with others in this course (among poorest [1] to among best [5]); (f) rate yourself in academic ability compared with students in your grade at your home school (among poorest [1] to among best [5]).
The final question asked students to indicate what grade they expected to receive in their summer program course. Students were given eight options of letter grades that they anticipated receiving, with options ranging from A+ to No Pass. Students who obtain a grade of B– or higher have the option of the grade being sent to their home school for credit; this option is not available for grades of Pass (equivalent to a C) or No Pass (equivalent to an F). The letter grade options were converted to GPA scale as follows: A+ = 4.3, A = 4.0, A– = 3.7, B+ = 3.3, B = 3.0, B– = 2.7, Pass = 2.0, and No Pass = 0. The mean expected GPA was 3.54 (SD = 0.67).
Results
Preliminary Analyses
Descriptive statistics and intercorrelations among variables are provided in Table 2, where most scores were shown to be neither skewed nor kurtotic. However, hours on homework, hours studying, and to some extent, expected GPA were negatively skewed and leptokurtic. As would be expected in an academically talented sample, adolescents reported high academic achievement scores: the modal expected GPA was 4.0, reported by 41% of the sample. Most students spent 3 to 5 hours on homework and 2 to 3 hours studying beyond homework. Mean AATI-TA scores for positive time attitudes were higher than negative time attitudes across all three time periods as in the extant literature, and correlations among time attitude scores were also in keeping with theory and previous research.
Correlations of Adolescent and Adult Time Inventory–Time Attitude Subscales With Continuous Variables.
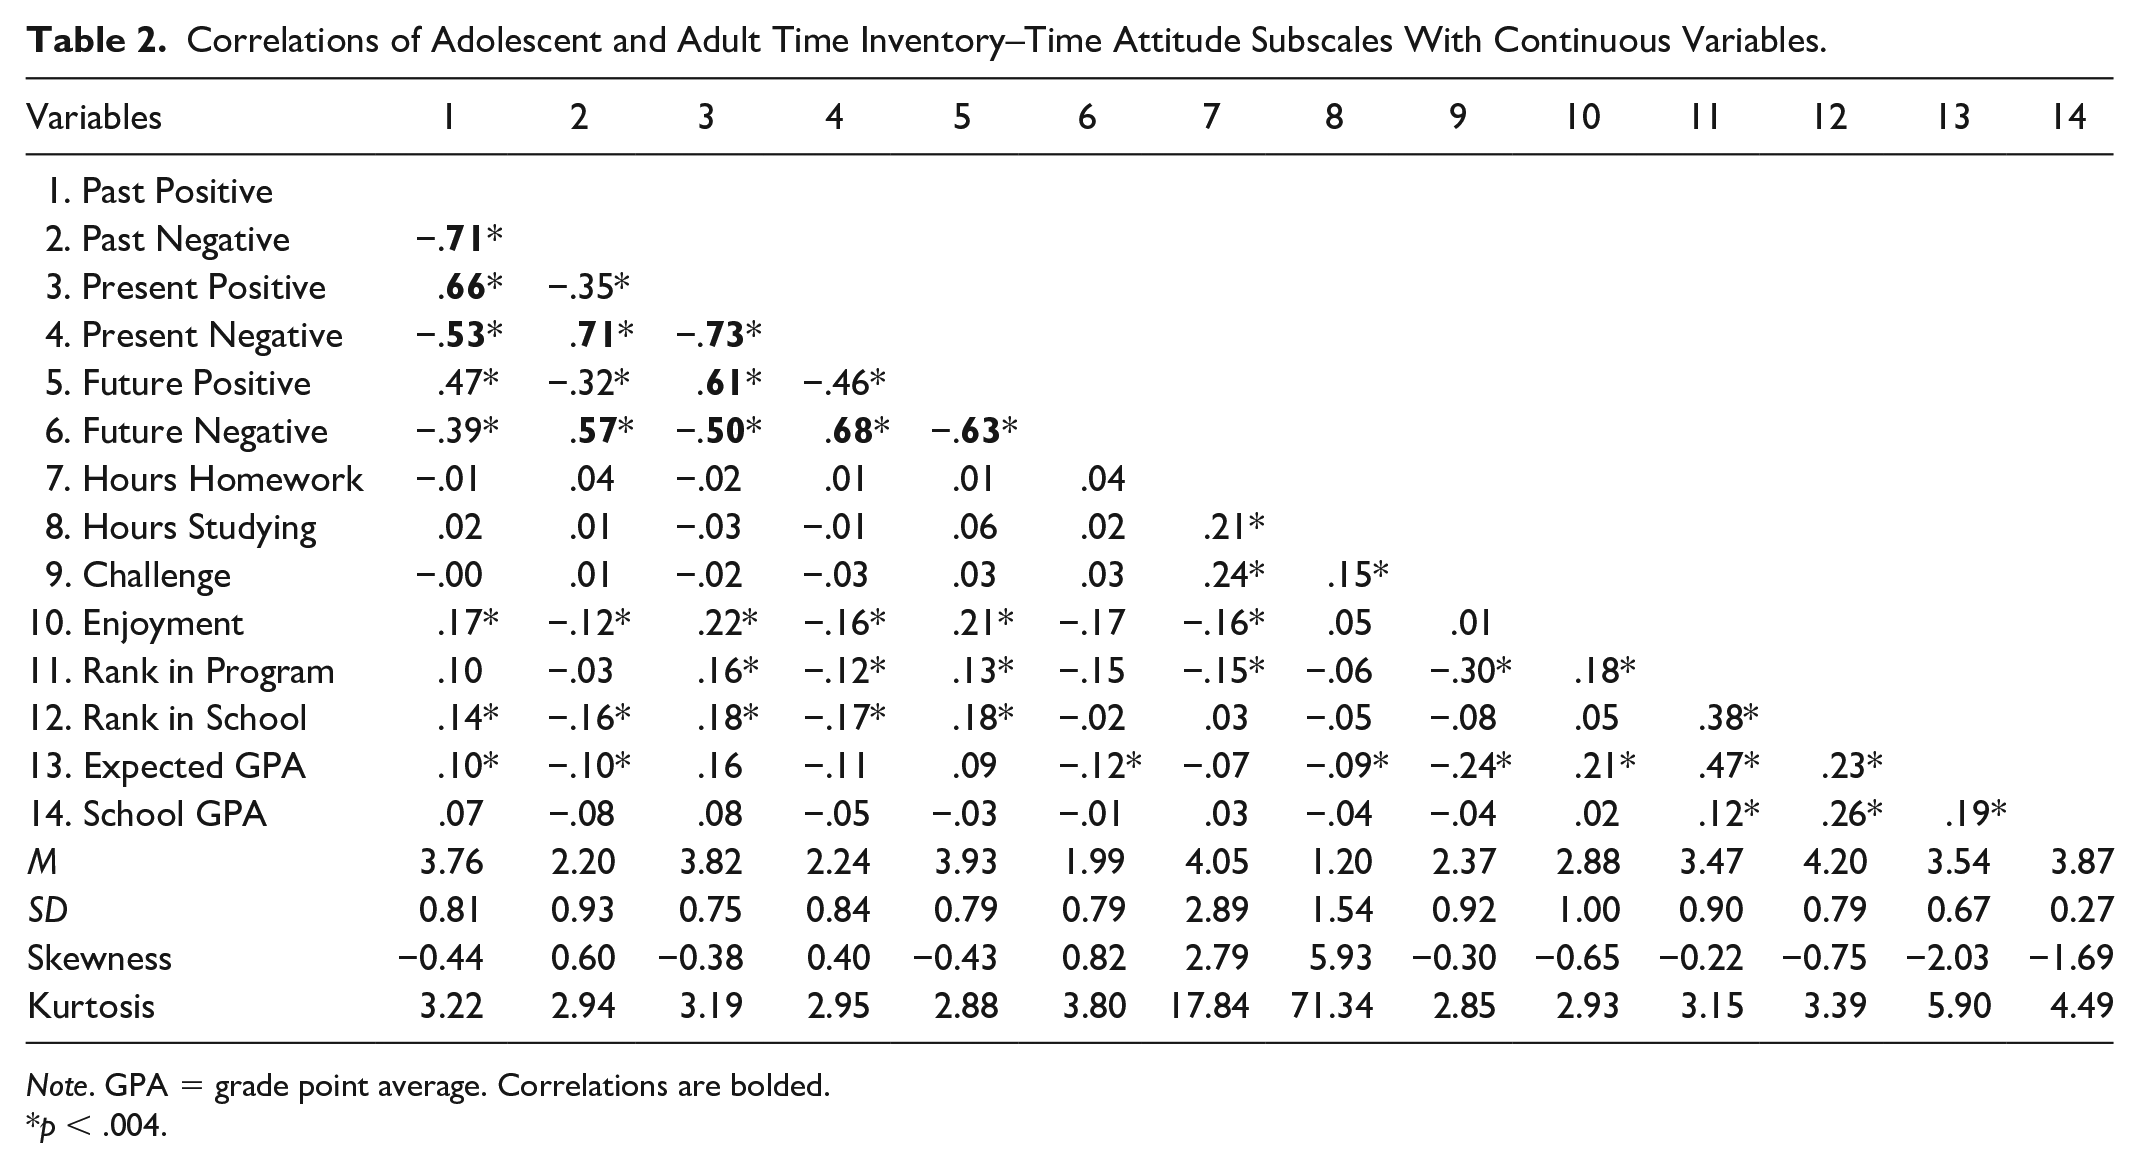
Note. GPA = grade point average. Correlations are bolded.
p < .004.
Correlations between time attitudes and outcomes were generally small and nonmeaningful, and only correlations that met Ferguson’s (2009) recommended minimum effect size estimates of 0.20 for associations were interpreted (see Table 2). These associations, which would be expected given the constructs under study, provided evidence in support of the nomological network (Cronbach & Meehl, 1955). Two of the time attitudes—Present Positive and Future Positive—had correlations in the low 0.20 range with Enjoyment. Hours spent on homework was positively correlated with hours spent studying beyond homework and the level of challenge the course posed. Challenge was negatively related to students’ perceived rank in the program and expected GPA. Perceived rank at home school was positively associated with self-reported GPA at home school and expected GPA in the program, whereas perceived rank in the program was strongly associated with expected GPA in the program and not related to self-reported GPA at home school. Students’ mean perceived ranking at their home school was significantly and meaningfully higher than their perceived ranking in the talent development program (p < .001, g = 0.86); the same pattern was found for achievement, with self-reported GPA at home school significantly higher than expected GPA in the program (p < .001, g = 0.65).
Cluster Analyses
Identifying the Clusters
Only AATI-TA scores were used in the clustering procedure. Before clustering, AATI-TA mean scores were calculated for each subscale by averaging responses to the five items, and then each subscale mean score was converted to T-scores (i.e., M = 50, SD = 10). Standardization of scores before clustering is recommended so that the clusters are not biased by differences in means and standard deviations of the variables being clustered. Clustering was conducted in four stages (Huberty et al., 1997). As recommended by Huberty et al. (1997), we applied Ward’s hierarchical, agglomerative clustering first, followed by K-means iterative partitioning. Because Ward’s is a bottom-up approach that yields both a dendrogram and an agglomerative schedule, results yield a range of potential solutions. In the present study, results pointed to four potential cluster solutions, including a three-, four-, five-, or six-cluster solution.
In the second stage, K-means iterative partitioning was used to further test the four solutions suggested by Ward’s procedure. K-means begins by separating a prescribed number of most discrepant individuals—these individuals constitute the initial clusters. Then, the individuals most similar to each of the most discrepant are assigned to the clusters. The centroid of each of clusters is calculated, and then individuals are reassigned based on their scores in relation to the centroids (Bergman et al., 2003). The centroid is then recalculated and reassignments are made in an ongoing iterative process. The K-means partitioning validated the five-cluster solution with 69% similarity in cluster assignments. The four-cluster solution (64%) also had a high similarity index. The three- (26%) and six-cluster (60%) solutions had lower levels of similarity in cluster assignments.
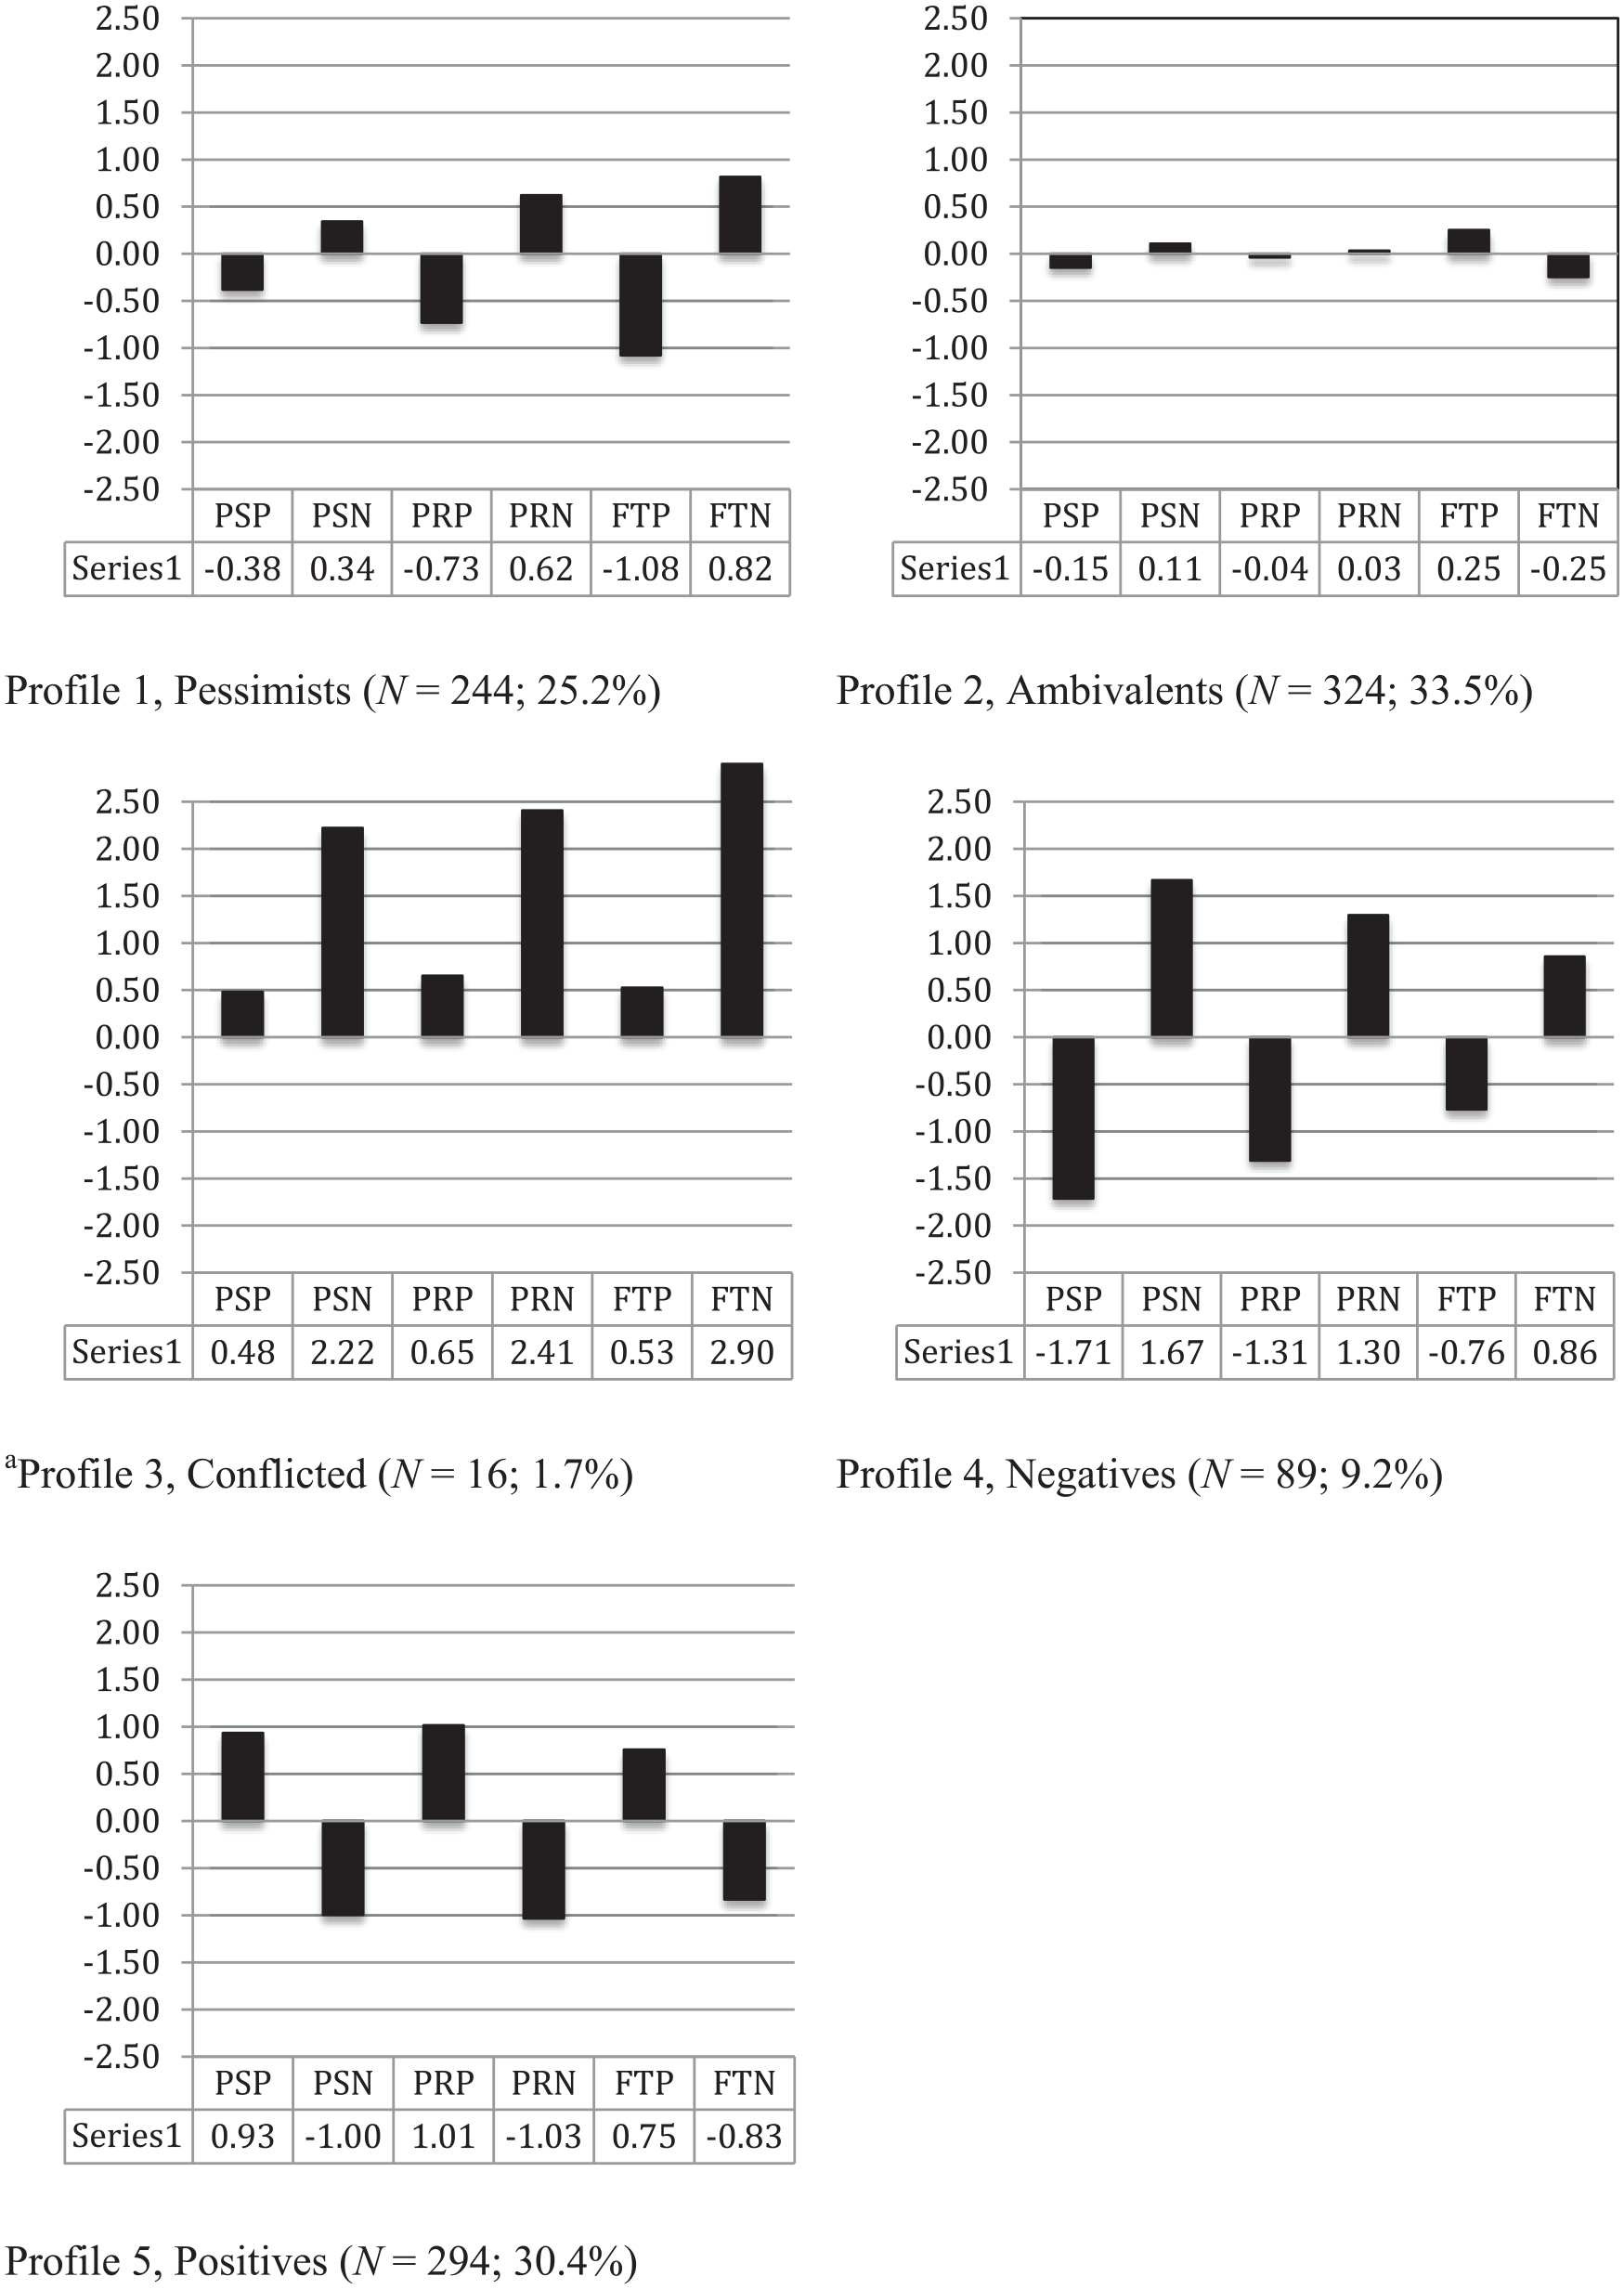
The third stage involved an examination of cluster homogeneity. Bergman et al.’s (2003, p. 99) algorithm—EV = 100 × (Et − Ec)/Et—was used to calculate the percentage of the total error sum of squares of AATI-TA scores explained by the clustering procedure for both the four- and five-cluster solutions. The four-cluster solution included a large group with a lower than recommended level of homogeneity (i.e., n = 112, EV = 60; Bergman et al., 2003). Therefore, this solution was rejected. All of the clusters in the five-cluster solution had acceptable levels of homogeneity (i.e., EV ≥ 67): (a) Profile 1 (EV = 74), (b) Profile 2 (EV = 69), (c) Profile 3 (EV = 98), (d) Profile 4 (EV = 81), and Profile 5 (EV = 77). The five profiles are shown in Figure 1, which also shows standardized scores on all of the outcome variables (zero represents the mean of 50). Table 3 shows statistically and practically significant differences in AATI-TA scores across and between time attitude profiles (η2 ≥ 0.54). Only 4 of the 36 values of Cohen’s d were below 0.70.
Time Attitude Profiles Plotted Using T-Scores.
Differences in Time Attitudes Raw Scores Among Profiles.

Naming the Clusters
Cluster names were based on the mean scores on the cluster variables relative to the sample, with greater weight given to means that are 0.40 SDs higher or lower than the sample mean. The clusters are presented in Figure 1, with the T-score units above or below the mean for each time attitude listed below the bar representing that time attitude. One quarter of the sample was accounted for in the first profile, and as can be seen in Figure 1, this profile was characterized by higher negative than positive attitudes, with the differences increasing from past to present to future. This profile, labeled Pessimists, had substantial above average negative attitudes (> 0.8 SDs) and far below average positive attitudes (< −1.0 SDs) toward the future; above average scores for negative attitudes (> 0.5 SDs), and below average scores for positive attitudes (< −0.5 SDs) toward the present; and scores closer to the mean for attitudes toward the past, but in the same direction. The second profile made up a third of the sample and included adolescents who reported scores on all six AATI-TA subscales that were very close to the mean (< |0.30| SDs) and not meaningfully different from each other. In keeping with previous studies, this profile was labeled Ambivalent. The third profile was similar to a profile found by Prow et al. (2016), with the extremely high negative scores (in the 2 to 3 SD range) and above average positive scores (in the 0.50 SD range) and was labeled Conflicted. As this profile had fewer than 20 individuals (< 2% of the sample), it was not included in subsequent analyses.
The fourth profile was labeled Negatives. These students reported high scores for negative attitudes toward the three time periods as well (> 0.8 SDs) and the lowest scores for positive attitudes toward the past and the present (< −0.7 SDs); only Pessimists reported lower future positive scores. Negatives were a relatively small group, representing just under 10% of the sample. The fifth profile included adolescents with time attitudes that were polar opposite to Negatives and made up almost one third of the sample. These adolescents were labeled Positives because they reported the highest scores for positive attitudes (> 0.7 SDs) and the lowest scores for negative attitudes (< −0.8 SDs).
Demographic Differences Across Time Attitude Profiles
Before outcome variables were compared across time attitude profiles, we examined the profiles’ association with racial/ethnic group membership, gender, and age. The differences among profiles across racial/ethnic groups, χ2(20) = 30.35, p = .064, Cramér’s V = 0.092, gender, χ2(3) = 6.69, p = .08, Cramér’s V = 0.08, and age, F(3, 941) = 0.55, p = .65, partial η2 = 0.002, were neither statistically nor practically significant. Therefore, these demographic variables were not used in subsequent analyses.
Academic Outcomes Across Time Attitude Profiles
As with the correlations, effect size estimates were used for the interpretation of differences among clusters. Based on recommendations by Ferguson (2009) and Hattie (2009), values of g ≥ 0.41 were interpreted as practically significant or meaningful. Analyses of variance (ANOVAs) were run to examine differences in educational outcomes across the four, substantial time attitude profiles (see Table 4). Results of these analyses were mixed. No statistically or practically significant differences were found among adolescents with different time attitude profiles in (a) time spent doing homework, (b) hours studying, or (c) the degree to which the course was perceived as challenging. However, differences among profiles for course enjoyment were statistically significant, F(3, 938) = 13.40, p < .001, and subsequent analyses revealed several differences between groups with effect sizes > 0.40. In line with our hypotheses, adolescents in the Positive profile reported meaningfully higher levels of course enjoyment than peers in the Pessimist and Negative profiles. Ambivalents also reported higher course enjoyment than Pessimists or Negatives and lower course enjoyment than Positives, but the effect sizes were < 0.40.
Differences in Educational Outcomes Across and Between Profiles.
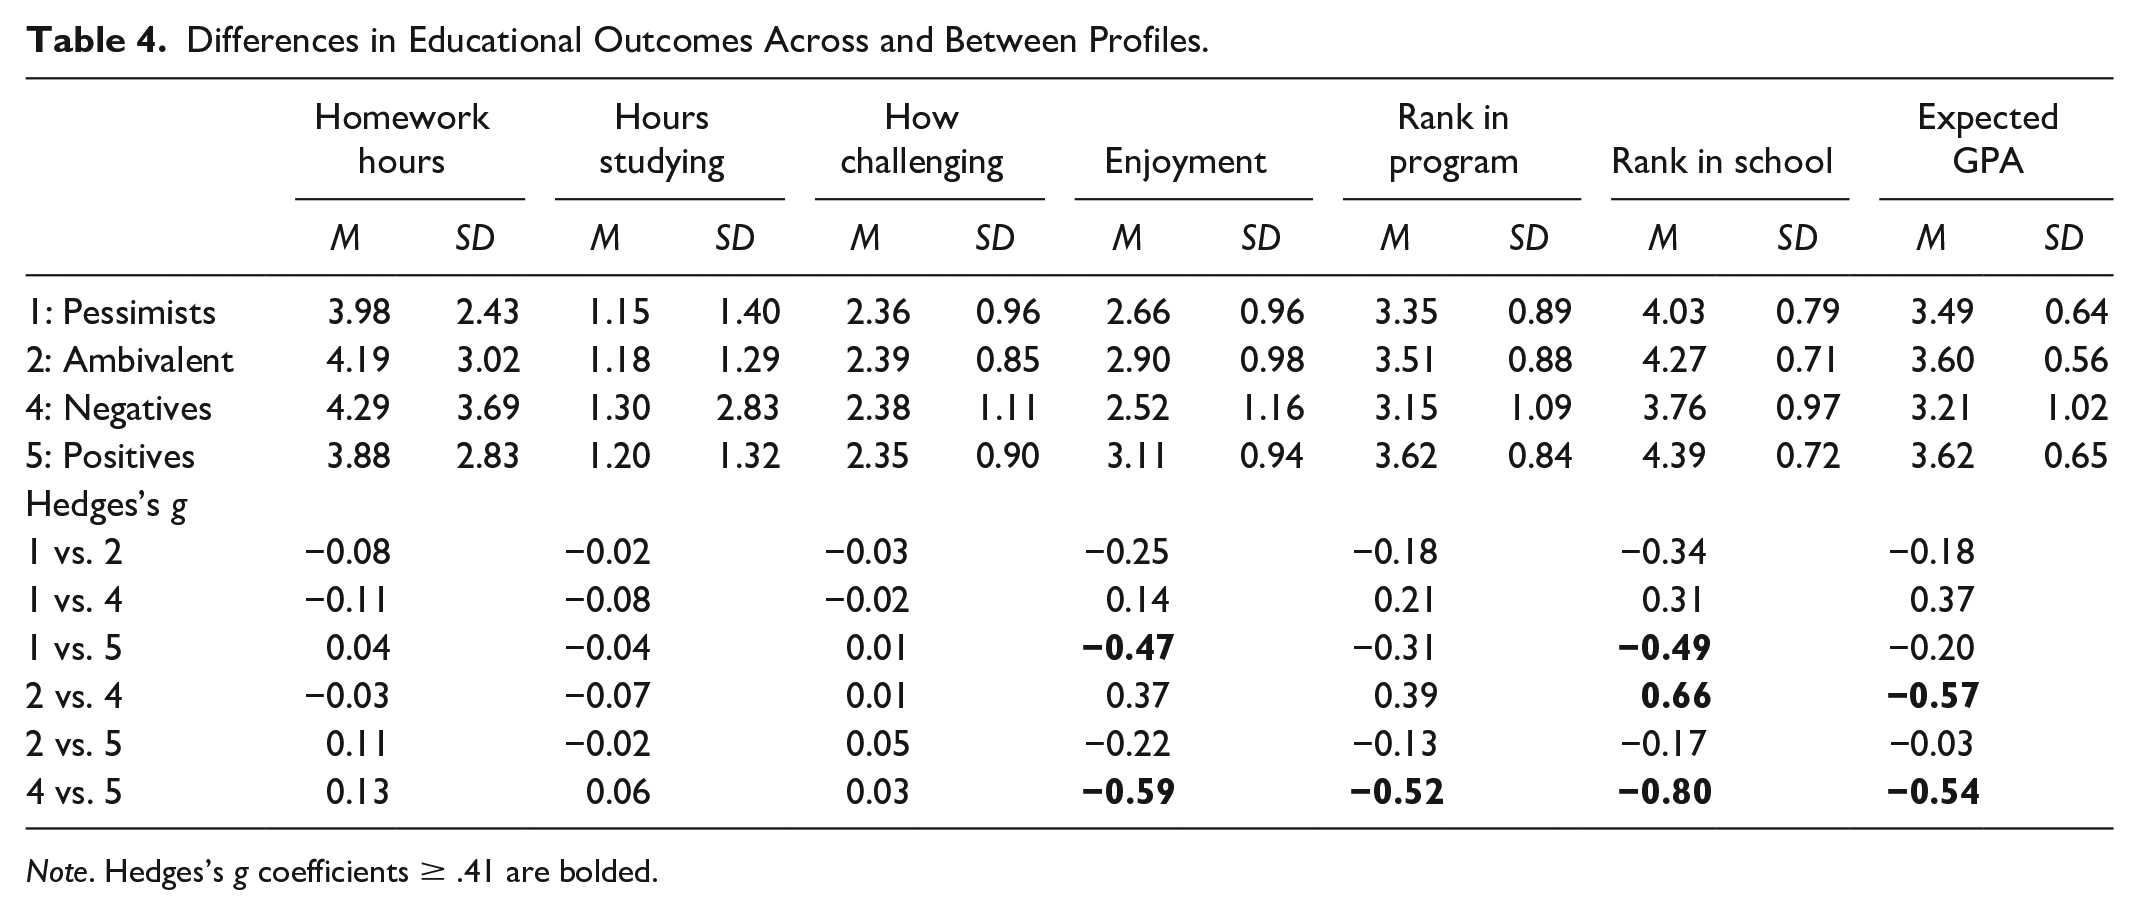
Note. Hedges’s g coefficients ≥ .41 are bolded.
ANOVAs also revealed statistically significant differences among time profile groups for self-ranking of ability in the talent development program, F(3, 940) = 8.50, p < .001, self-ranking of ability in the home school, F(3, 940) = 20.68, p < .001, and expected GPA, F(3, 930) = 4.42, p < .001. Positives ranked themselves higher than Negatives in terms of program rank (see Table 4). With regard to rank in comparison to home school, Positives ranked themselves higher than Negatives and Pessimists, and Ambivalents also ranked themselves higher than Negatives. Expected GPA was the last educational outcome examined across and between time attitude profiles. Contrary to our hypothesis, two differences were practically significant (i.e., g ≥ 0.41): Positives and Ambivalents ranked themselves higher than Negatives. As with other outcomes, Positives reported the highest expected GPAs, followed by Ambivalents, Pessimists, and Negatives in that order.
Given the differences in expected GPA and the assumption that time attitudes represent a way of looking at the world that preceded the participants’ enrollment in the summer program, we conducted a post hoc analysis looking at self-reported school GPA differences by cluster. Although this ANOVA was statistically significant, F(3, 829) = 4.00, p = .008, three of the clusters (Positives, Ambivalents, and Pessimists) reported GPAs of 3.89. Negatives reported a GPA (3.77) that was meaningfully lower than the GPAs of Ambivalents (g = 0.41) and Pessimists (g = 0.41), but not Positives (g = 0.38), given a larger SD in that group.
Discussion
In this study, we examined time attitude scores in an academically talented sample to see (a) if they would yield interpretable profiles as in previous studies and (b) if the profile members would differ meaningfully on variables related to academic performance. As hypothesized, bivariate correlations between AATI-TA scores and academic outcomes were small, although the substantial sample size resulted in statistical significance for some of these associations. Cluster analyses yielded five interpretable profiles—Pessimists, Ambivalents, Negatives, Positives, and Conflicted—the first four of which were compared in the current study. These four profile groups did not differ meaningfully on variables representing workload (i.e., hours of homework, hours studying beyond homework, and on level of challenge in the course). However, there were meaningful differences among some profiles on how much cluster members enjoyed the courses, as well as cluster members’ self-ranking at their home school and in the talent development program, and their expected GPA and self-reported school GPA. There were no cluster differences by demographic subgroups. We discuss these findings below.
Utility of Person-Centered Analyses in Time Perspective Research
As shown in Table 1, time attitude profiles have been identified in the United States, New Zealand, Germany, and the United Kingdom, and some of the profiles appear to be more generalizable than others. The four profiles examined in current study were all found in previous studies: (a) Positives (seven previous samples), (b) Negatives (six previous samples), (c) Pessimists (six previous samples), and (d) Ambivalents (five previous samples). Also, as in previous studies, the effect size estimates reported for academic differences among time attitude profiles met the threshold for interpretation (Ferguson, 2009), whereas the estimates for the associations between academic outcomes and individual time attitudes did not. Also as hypothesized and in keeping with findings in previous studies among students in regular education settings (e.g., Alansari et al., 2013; Andretta et al., 2013; Buhl & Lindner, 2009), Positives and Negatives reported the most and least favorable outcomes, respectively, with outcomes for the Ambivalent and Pessimistic adolescents falling between these two groups.
Given the select nature of the sample—that is, students designated as academically talented on the basis of high academic achievement—we hypothesized that the differences among the profiles in this sample would have small effect sizes. However, this hypothesis was not supported for several variables, including self-reported course enjoyment, rank in school, rank in program, and expected GPA. Positives reported the highest scores on these variables, and it would be easy to conclude that the Positive group consisted of stronger students. However, that explanation is not supported by several other patterns in the data. In addition to the fact that all of the students in this program are high achievers, Ambivalents and Pessimists reported the same self-reported school GPA as Positives, and the groups did not differ meaningfully on the amount of effort they reported putting into the courses or on how challenging they perceived their courses to be.
An alternative explanation, which will need to be examined in experimental studies, is that Positives are “seeing” the world differently. Enjoyment is a variable associated with intrinsic motivation, and to the extent that Positives are enjoying their classes more, this enjoyment may translate into higher achievement, even in the face of similar amounts of effort. In other words, time attitudes may be more predictive of the quality of studying rather than the time spent studying. Positives in the Prow et al. (2016) study had a meaningfully higher GPA than the other two profiles (Ambivalent and Conflicted), although the Positives’ GPA in that study (3.4) was lower than the GPA of the lowest group in this study, which was 3.77. In the Andretta et al. (2014) study, Positives reported the highest GPAs alongside the highest self-esteem scores and the lowest perceived stress; both perceived stress and general self-esteem are modestly related to academic performance. These findings are also similar to findings in studies of hope, with students who are higher in hope reporting higher academic achievement, academic investment, school belonging, and educational expectations than those lower in hope (see Dixson et al., 2017). Given the similarity of findings across samples of students with different achievement levels and different time constructs, these findings suggest that the associations among academic achievement and time constructs should be examined further.
In their megamodel of talent development, Subotnik et al.’s (2011) proposed two types of psychosocial factors related to outstanding performance: delimiters and enhancers. Delimiters included low motivation, unproductive mind-sets, and poor social skills. Enhancers included optimal motivation, productive mind-sets, strong social skills, and the willingness to take advantage of opportunities provided. Many of these delimiters and enhancers have been called “perception-based constructs” (Dixson et al., 2017, p. 56), which have been hypothesized to “exert influence on behavior within the school environment” (p. 62). The results of the time attitude studies suggest that time attitude profiles may be among the perception-based constructs that act as delimiters or enhancers as well.
If this hypothesis is supported in future research, positive time attitude profiles may be useful for teachers and coaches to cultivate in gifted students. The extant literature on talent development in sport and music suggests that mental toughness, a psychosocial construct, is as important as domain specific abilities, with positive associations found in tennis (Landin & Hebert, 1999), water polo (Hatzigeorgiadis et al., 2004), and orchestra musicians (MacNamara & Collins, 2009; MacNamara et al., 2008). In one of the few studies of psychological fortitude and time perspective in the gifted, Nicholls et al. (2008) reported that mental toughness constructs (seeing challenge as an opportunity, commitment, life control, and confidence in ability) were positively correlated with Optimism (0.38 ≤ r ≥ 0.56) and negatively correlated with Pessimism (−0.31 ≤ r ≥ −0.49) in talented athletes. Research has also shown that mental toughness is coachable in talented populations (Jarvin & Subotnik, 2010). Therefore, it will be important to ascertain if time attitudes are sensitive to coaching, and if changes in time attitude profiles will lead to higher achievement outcomes in gifted and talented students. Oyserman et al. (2002) coached African American middle school students to be more optimistic in a yearlong, school-based program. Results showed substantive increases in school engagement and decreases in problematic behavior among participants. Studies of this type are needed in samples of gifted and talented youth.
Broader Implications of the Findings
There were a number of takeaways in the present study. First, the AATI-TA is proving to be a powerful index of time perspective in adolescents. Specifically, the psychometric integrity of AATI-TA scores has been demonstrated in other international and domestic samples of regular education students and this study extends these findings to academically talented students. Second, results contribute to a growing body of literature supporting person-centered rather than variable-centered approaches to the study of time attitude—that is, profiles from person-centered analyses revealed stronger associations with outcomes. Third, no gender differences in time attitude profiles were found (see also, Andretta et al., 2013).
There were also no statistically or practically significant ethnic or racial group differences in profile membership in this study. In a previous study, Andretta et al. (2013) found higher percentages of European and Latino Americans in the Positive and Optimistic clusters than African and Asian Americans; African Americans and Asian Americans were overrepresented in Negative and Pessimist clusters. Similarly, Prow et al. (2016) found statistically significant ethnic−racial differences, albeit with small effect sizes. In that study, Asian Americans were underrepresented in the Conflicted and Positive profiles, African Americans were overrepresented in the Conflicted profile and underrepresented in the Positive profile, and Latinx students were distributed equally across profiles. Thus, findings to date are mixed, although it is worth noting that the differences reported by Andretta et al. (2013) and Prow et al. (2016) more closely align with the traditional pattern of underrepresented groups having less favorable outcomes.
Although the findings in this study suggest that positive time attitudes are potentially useful to academically talented students, it would be premature to provide definitive suggestions for practice for several reasons. The first is that this is the only study of time attitudes in academically talented youth and replication of the findings are necessary. Second, although longitudinal studies indicate that time attitude profiles change over time and are therefore malleable (Morgan et al., 2017), interventions to change time attitude profiles have not yet been developed. Third, the AATI-TA is a research instrument and there are no normative scores on which to compare students. Nonetheless, results of the present study provide counselors interested in helping gifted youth cultivate the psychosocial skills that support talent development with a potentially fruitful target. Conversations about an individual’s feelings toward, and evaluation of, the time periods might elucidate possible risk for underachievement (e.g., reporting an overly negative assessment of the past, present, or future) and suggest a direction for counseling interventions.
Limitations and Conclusion
The present study had several limitations. First, the sample was self-selected and select (i.e., students who applied for and were accepted into a university-based academic talent development program). Thus, the findings would not typically be expected to generalize to less elite samples. In this case, the sample was chosen specifically to examine if findings in less select samples would replicate in this more selective one. Second, although the sample was substantial in size, it is also limited to one region of one state. Although there are several other studies of time attitudes in the United States and beyond, these do not consist entirely of academically talented students and findings will need to be replicated using gifted students identified by different methods (e.g., IQ scores). Third, as noted in the Method section, the outcomes are all self-report, raising questions of method bias in the findings. In future studies, researchers should include outcomes that are independent of the grouped participants (e.g., grades from the program, such as in the Prow et al. [2016] study or ratings from instructors). Fourth, the findings are cross-sectional, so although time perspective theories (e.g., Mello & Worrell, 2015; Zimbardo & Boyd, 2008) imply that time perspective precedes these outcomes, causal inferences cannot be drawn. We do know that time attitude profiles vary in adolescence across a 24-month period, and that staying in or moving to the Positive profile is associated with higher self-efficacy (Wells, McKay, et al., 2018) and less problematic drinking (i.e., abstaining or lower likelihood of unsupervised drinking) in adolescence (Wells, Morgan, et al., 2018).
Finally, it is possible that because the AATI-TA was administered in conjunction with an evaluation of the program, the scores were influenced by the students’ reflections on their experiences during the summer program. No study to date has examined the effect of survey instrument ordering on AATI-TA scores. In contrast, studies on adolescents have shown that the ordering of instruments in a survey can have a substantial impact on self-report scores of cultural identity (e.g., Andretta et al., 2015). Future studies should manipulate the ordering of surveys that include the AATI-TA to ascertain if order effects introduce error variance to the scores.
Limitations notwithstanding, these findings are interesting and provide guidance for future research. The results establish that time attitude profiles exist in academically talented populations and that being academically talented does not preclude you from having a negative time attitude profile. Second, and perhaps most surprising were the substantial differences in the academic rank variables and self-reported achievement in a sample with such high achievement, especially as there were no differences in variables related to effort expended and perceived challenge. An important question for future research is to what extent are the differences in achievement driven by the differences in enjoyment. In other words, does one’s time attitude profile result in a different motivational framework in approaching academic tasks, previous academic competence notwithstanding. These findings suggest, at a minimum, that time attitude profiles are a potentially important variable to examine in gifted and talented adolescents.
Footnotes
Declaration of Conflicting Interests
The author(s) declared no potential conflicts of interest with respect to the research, authorship, and/or publication of this article.
Funding
The author(s) disclosed receipt of the following financial support for the research, authorship, and/or publication of this article: This study was supported by the Academic Talent Development Program at UC Berkeley.
Open Science Disclosure Statements
The data and code used in this study can be obtained from the authors.