
Abstract
The Torrance Test of Creative Thinking-Figural (TTCT-F) is the most extensively used creativity measure in U.S. schools, especially for gifted identification. TTCT-F has been thought to be culturally fair across ethnicities and genders, although this belief has rarely been empirically tested. Our study examined the latent structure of the TTCT-F scales: Fluency, Originality, Elaboration, Abstractness of Titles (AT), and Resistance to Premature Closure (RPC), and then investigated measurement invariance across overrepresented and underrepresented ethnicities and across genders. Using data obtained from 379 U.S. elementary school students, we identified that the Innovative-Adaptive model, with an additional cross-loading for the RPC scale, was the best fit. We also found that this two-factor model was invariant across underrepresented and overrepresented ethnicities at configural, metric, and scalar levels. In contrast, even configural invariance did not hold across both boys and girls, suggesting that additional research is needed to understand creative thinking across gender.
Plain Language Summary
The Torrance Test of Creative Thinking-Figural measures two attributes of creative thinking, which can be understood and interpreted similarly across ethnic groups but not across genders
The Torrance Test of Creative Thinking-Figural is the most influential creativity measure in U.S. schools, especially for gifted identification. This test has been thought to be culturally fair across different ethnicities and genders, thus contributing to more equal representation in gifted and talented services. However, little is known about whether this test measures creative thinking similarly across different ethnicities and genders. So, our research team identified which attributes of creative thinking were measured through the Torrance Test of Creative Thinking-Figural, and whether they could be understood and interpreted in the same way across different subgroups among the U.S. elementary student population (n = 379). In our paper, we found that this test assessed two attributes of creative thinking, known as “Innovative” and “Adaptive” factors. Innovative capacity refers to the ability to generate original ideas quickly, whereas Adaptive skill is considered to be deep and detailed thinking. We also demonstrated that this test measures Innovative and Adaptive capacities similarly across ethnicities (White/European American and Asian students together as those who are overrepresented in U.S. gifted and talented programs; and Black/African American and Hispanic/Latinx students as those who are underrepresented), indicating creative thinking manifests similarly across these groups. However, we found that these two attributes of creative thinking are not assessed in the same way across boys and girls, implying differences in creative thinking patterns across different genders. Relatedly, there was a greater trade-off between the quantity and quality of ideas for boys than for girls. In addition, creating an imaginative and metaphorical title for each drawing was a distinct ability from generating many ideas in girls, while they were more interconnected in the boys’ group. Therefore, our team recommends that the Torrance Test of Creative Thinking-Figural scores not be directly compared between boys and girls.
Keywords
For over five decades, the Torrance Test of Creative Thinking (TTCT; Torrance, 1966) has been the most influential and extensively used creative thinking measure in U.S. schools, especially for gifted identification (Acar et al., 2023; Kaufman et al., 2012; Kim, 2011). Believed to be culturally fair across diverse ethnicities, genders, socioeconomic statuses, and languages, the TTCT is considered to play a vital role in promoting equitable access to gifted services, thereby including a wide range of students from diverse cultural backgrounds (Bart et al., 2017; Kim et al., 2006; Lee et al., 2024).
With the understanding that creative thinking should not be limited to divergent thinking, the earlier versions of the TTCT-F were thought to be insufficient in capturing the breadth of creative thinking, which led to the inclusion of additional scoring methods and scale: Abstractness of the Titles (AT), Resistance to Premature Closure (RPC), and the creative strengths checklist (Ball & Torrance, 1984; Hebert et al., 2002). Also, flexibility was removed due to its high overlap with fluency scores, which is known as the fluency confound (Clark & Mirels, 1970; Forthmann et al., 2020). At the same time, a criterion-referenced subscale that captures 13 creative strengths was added into the scoring system in the 1984 revision (Ball & Torrance, 1984; Kim, 2006). While the current scoring scales are considered to feature a broad scope of creative thinking and the research has addressed how the TTCT-F measures the latent constructs of creative thinking (Acar et al., 2023; Said-Metwaly et al., 2018), less is known about how educators and school administrators can interpret these scores for educational purposes. Although there is a consensus that the TTCT-F scores tend to be better represented by the two latent factors rather than one general factor (Bart et al., 2017; Hahm et al., 2019), the single Creativity Index composite score, which aggregates the subscale scores, continues to be used for gifted identification without considering how young students’ creative thinking could be validly measured and identified (Acar et al., 2023). If the Creativity Index score does not validly capture students’ creative thinking and is therefore not reliable for gifted identification purposes, using the TTCT-F scores to determine eligibility based on the creativity criteria might not be justified, even when used alongside the other criteria, such as academic achievement and motivation.
On the contrary, measurement invariance (MI) has been one fundamental goal in educational and psychological testing (American Educational Research Association et al., 2014; Dong & Dumas, 2020; Engelhard, 2008), because it ensures that a measure is unbiased and fair (Engelhard, 1989). MI refers to the statistical concept that latent constructs, assessed through a measurement, are understood and interpreted in the same way across identifiable subgroups, such as different genders, races/ethnicities, and ages/grades (Schmitt & Kuljanin, 2008). Without establishing MI, high-stakes decisions such as gifted identification based on the test scores might disadvantage specific groups, leading to unintended outcomes (Millsap & Kwok, 2004). For example, lack of MI might result in overrepresentation or underrepresentation of particular ethnic or gender groups, thereby threatening the fairness of the educational testing. In this regard, establishing MI of the TTCT-F also lays the groundwork for making equitable and ethical decisions as part of evaluating students’ eligibility for gifted education services (Kim et al., 2006). However, beyond the previous findings that there tend to be no significant score differences in the TTCT-F scales across ethnicities and genders (Krumm et al., 2016; Torrance, 1971), little is known about whether the TTCT-F measures creative thinking in the same way across these groups. To ensure fairness and strengthen the statistical robustness of the TTCT-F scoring and interpretation procedures, MI needs to be examined across different subgroups. So, for this study, we focused on investigating the latent structures of creative thinking, measured by the TTCT-F, among elementary students, and whether these structures are measured similarly across different ethnicities and genders.
TTCT-F and Gifted Identification
Torrance advocated for including creativity tests as one of the multiple criteria in gifted identification (Torrance, 2004), believing it could bring equity benefits for access to gifted and talented programs and services by students from culturally diverse backgrounds (Grantham, 2013; Lee et al., 2024; Torrance, 1971). He suggested that, as creativity is less influenced by demographics, students who may otherwise be missed can be identified using the TTCT-F (Torrance, 2004). Beyond merely using IQ tests and standardized academic achievement tests, which can be biased against marginalized students (Hodges et al., 2018; Lohman & Foley Nicpon, 2012), the inclusion of the creativity assessments has been found to improve underrepresentation of Culturally, Linguistically, and Economically Diverse (CLED) students (Kaufman et al., 2012; Luria et al., 2016). Among the creativity assessments used for gifted and talented programs including divergent thinking tests (e.g., Wallach-Kogan Creativity Test; Wallach & Kogan, 1965; TTCT; Torrance, 2017), domain-specific creative products (e.g., Consensual Assessment Technique [CAT]; Amabile, 1996), performance-based problem-solving assessments (e.g., Discovering Intellectual Strengths and Capabilities while Observing Varied Ethnic Responses [DISCOVER]; Maker, 2005), and creativity rating subscales (e.g., Scales for Rating the Behavioral Characteristics of Superior Students [SRBCSS]; Renzulli, 2010), the TTCT-F is the most widely used norm-referenced creative thinking test covering populations from preschool to adulthood (Kaufman et al., 2009, 2012; Lee et al., 2024). Given that the TTCT-F is the standardized test possessing grade and age norms representing U.S. populations, the TTCT-F could provide a good rationale for making high-stake decisions like determining eligibility for gifted programs (Kim, 2006). The TTCT-F consists of two parallel forms A and B, and includes activities of Picture Construction, Picture Completion, and Line/Circles, which might be accessible and engaging particularly for elementary-age children (Kim, 2017). Also, because domain-specific creativity emerges over the course of schooling within particular domains and is closely linked to domain knowledge and expertise (Baer, 2015; Dumas et al., 2024), a domain-general creative thinking assessment like the TTCT-F may be more suitable for younger students who have not yet sufficiently developed domain-specific knowledge.
Despite Torrance’s (1966, 1974) warning against treating the TTCT scores as a single factor, the single Creativity Index composite score has been frequently used for gifted identification in educational settings (Acar et al., 2023; Kim et al., 2006; Lee et al., 2024). The Creativity Index score is obtained by the average of the standardized scores for the five subscales (Fluency, Originality, Elaboration, AT, and RPC), where standardized means (M) of 100 and standard deviations (SD) of 20 were utilized (Torrance, 2017). For instance, in the state of Georgia, the Creativity Index composite score at or above 90th percentile on the TTCT-F is considered eligible for gifted education services (the cutoff score is around 125 depending on the distribution), within the students’ grade level or age (Georgia Department of Education, 2024).
However, using the single Creativity Index scores for judging gifted eligibility may yield a limited understanding of creative thinking as expressed through the TTCT-F (Kim, 2006; Torrance, 1966, 1974). Solely depending on a composite score may not provide the granularity that is needed for an accurate assessment of an individual’s creative thinking, as it oversimplifies the complex structure of the constructs. Once a student is identified as gifted, the Creativity Index fails to deliver any detailed information to support their individualized learning in developing creative thinking. Given that one of the main purposes of conducting the creativity tests is to identify a student’s creative strengths and areas needing improvement (Cramond, 1994; Torrance, 1974), educators and school administrators might benefit by interpreting the scores in a way that fully illustrates creative thinking that is expressed through the TTCT-F.
Gifted Identification Across Ethnicities and Genders
Underrepresentation of Black/African American, Hispanic/Latinx, and Native American students in gifted identification has been an important issue that needs to be addressed in the field of gifted education (Daniels, 1998; Ford et al., 2001; Ford & Harris, 1994; S. Y. Yoon & Gentry, 2009). In contrast, Asian and White/European American students have been overrepresented in gifted and talented education services, especially Asian students, identified even at a higher rate than their White peers (Lee et al., 2024; Peters et al., 2019). Notably, the TTCT-F does seem to have a positive influence on this issue, because this identification gap tends to become larger when creativity assessment is not used, and only other identification methods such as IQ measures and standardized achievement tests are used (Hodges et al., 2018). This may be because disadvantaged students lack the opportunities to fully develop their potential or to develop the abilities assessed on identification tests and therefore are not likely to be identified as gifted, despite having high learning potential (Dumas et al., 2020; Pfeiffer, 2012).
To address the unequal representation issue, a wider set of identification methods such as nonverbal assessments, creative thinking tests, and recommendations from teachers or peers are used for identifying the talents and abilities that might otherwise be unrecognized through IQ measures and standardized achievement tests (Lohman & Foley Nicpon, 2012). Because it is simultaneously focused on creative thinking, and within a nonverbal modality, the TTCT-F is considered to be an especially useful measure for this purpose (Bart et al., 2017; Cramond, 1994; Torrance, 1971). Black/African American students even tended to perform better than, or at least similar to, their White peers in the early studies using the earlier version of TTCT-F (Covington, 1968; Torrance, 1967, 1971). However, few studies have investigated whether the TTCT-F shows less bias in gifted identification, except for one recent study that revealed the inclusion of the TTCT-F did not significantly improve the underrepresentation of Black/African American, Hispanic/Latinx, and Native American students (Lee et al., 2024). Hence, the field of gifted and talented education needs to further investigate whether the TTCT-F measures creative thinking similarly across different ethnicities.
On the contrary, in terms of gender, there tends to be no disproportional representation of males or females in gifted identification (Crombie et al., 1992; Petersen, 2013). However, boys were more likely to be identified than girls when only IQ measures and standardized achievement tests were used for determining eligibility, suggesting that this form of identification methods might be possibly biased against girls (Petersen, 2013). This may indicate that including the TTCT-F in the identification processes contributes to equal gender representation in gifted and talented services.
Concerning TTCT-F scores, it has been difficult to conclude the presence of either male or female advantages on this test, with some samples showing higher scores for one group, and other samples showing the opposite (Baer & Kaufman, 2008; Saeki et al., 2001). Including TTCT-F scores might contribute to proportional representation in gifted identification in terms of gender, if those sample-specific differences indicate equality in the population. Yet, males appear more likely to be represented in adulthood creative achievements than females. This might be due to different socialization experiences and gender stereotypes (Bian et al., 2017; Cole & Zuckerman, 1987; Helson & Picano, 1990). Considering that school environments may be more supportive of creative expressions from boys than from girls (McVey, 2003), there may be a possibility that girls and boys respond to the creativity tests in a different way. At this point in time, as the student populations in the United States continues to grow more diverse (U.S. Department of Education, 2020), achieving proportional identification of different ethnicities and genders through unbiased assessments is becoming increasingly important.
The Structure of the TTCT-F
Examining the latent factor structure of a measure is one useful way to understand the underlying psychological constructs that the measure is assessing within the sample population (Kim et al., 2006; Wiebe et al., 2008). Although Torrance (1966, 1974) suggested that each subscale of the TTCT-F has an independent meaning, and therefore the test scores should not be aggregated to a single score, researchers have been likely to believe that the structure of the TTCT-F, like other divergent thinking tests, might comprise one overall creative thinking attribute (Abernathy Tannehill, 1997; Chase, 1985). In this regard, some previous studies have shown that the TTCT-F scores consist of one general factor (Clapham, 1998; Heausler & Thompson, 1988), indicating that these scales may measure a similar construct. These findings were primarily due to high correlations between Fluency and Originality as well as Fluency and Flexibility (Clapham, 1998; Cramond et al., 2005), especially in the older versions of TTCT-F and TTCT-Verbal.
However, the current streamlined scoring system of the TTCT-F, which reflects the five norm-referenced scales (Fluency, Originality, Elaboration, AT, and RPC) along with 13 creative strengths, is distinct from the earlier version that was regarded as composed of a singular factor. With the current version of the scales, the literature largely agrees that the TTCT-F consists of two factors rather than one general factor (Acar et al., 2023; Bart et al., 2017; Hahm et al., 2019; Humble et al., 2018; Kim et al., 2006; Krumm et al., 2014, 2016; Said-Metwaly et al., 2018; Xu et al., 2025; Yoon, 2017). These two latent factors were called “Innovative” and “Adaptive,” which were derived from Kirton’s (1976, 1978, 1989) Innovator and Adaptor distinctions. The model suggests that the Innovative factor pertains to the ability to generate novel ideas quickly, whereas the Adaptive factor reflects the capacity for deep and detailed thinking (Kim et al., 2006). Relatedly, Fluency and Originality loaded onto the Innovative factor, and Elaboration and AT loaded onto the Adaptive factor consistently in the two-factor models (Acar et al., 2023; Said-Metwaly et al., 2018). These findings gave implications in terms of understanding and interpreting two disparate cognitive functions of creative thinking expressed through the TTCT-F (Alabbasi et al., 2022; Kim et al., 2006).
There has been an inconsistency regarding which factor RPC fell into, because RPC either loaded onto Innovative or Adaptive factors, or cross-loaded onto both (see Figure 1). This inconsistency might stem from the nature of RPC, which refers to the cognitive capability to keep one’s mind open and defer judgment while considering available alternatives to the solutions (Torrance, 1984, 1990, 1998). Given the meaning of RPC, it appears to be closely linked to both Innovative and Adaptive factors (Acar et al., 2023; Kim, 2006; Lubart & Zenasni, 2010). To elaborate, RPC might be a good mind-set to reach originality by continuously producing multiple ideas (i.e., load on the Innovative factor), and it also might help in adding details and giving imaginative titles to those generated ideas through persistent commitment to the task (i.e., load on the Adaptive factor). Taking these past findings together, the theoretically and empirically plausible two-factor models as well as a general one-factor model are presented in Figure 1. Previous meta-CFA studies (Acar et al., 2023; Said-Metwaly et al., 2018) demonstrated that the optimal two-factor model involved RPC loading onto the Adaptive factor, while another model with the cross-loading of RPC was identified as the second best fit. Considering that the best-fitting model manifested differently depending on the characteristics of the samples used in the previous studies (Bart et al., 2017; Humble et al., 2018; Kim et al., 2006; Krumm et al., 2014, 2016; Şahin, 2015; Xu et al., 2025), the factor structures of the TTCT-F scales could potentially vary across culturally different groups, particularly among younger students, and may not align with the most commonly accepted best-fitting models. Thus, there is a need to examine the latent factor structure of the TTCT-F in younger students, as they are the most common population of interest for gifted identification.
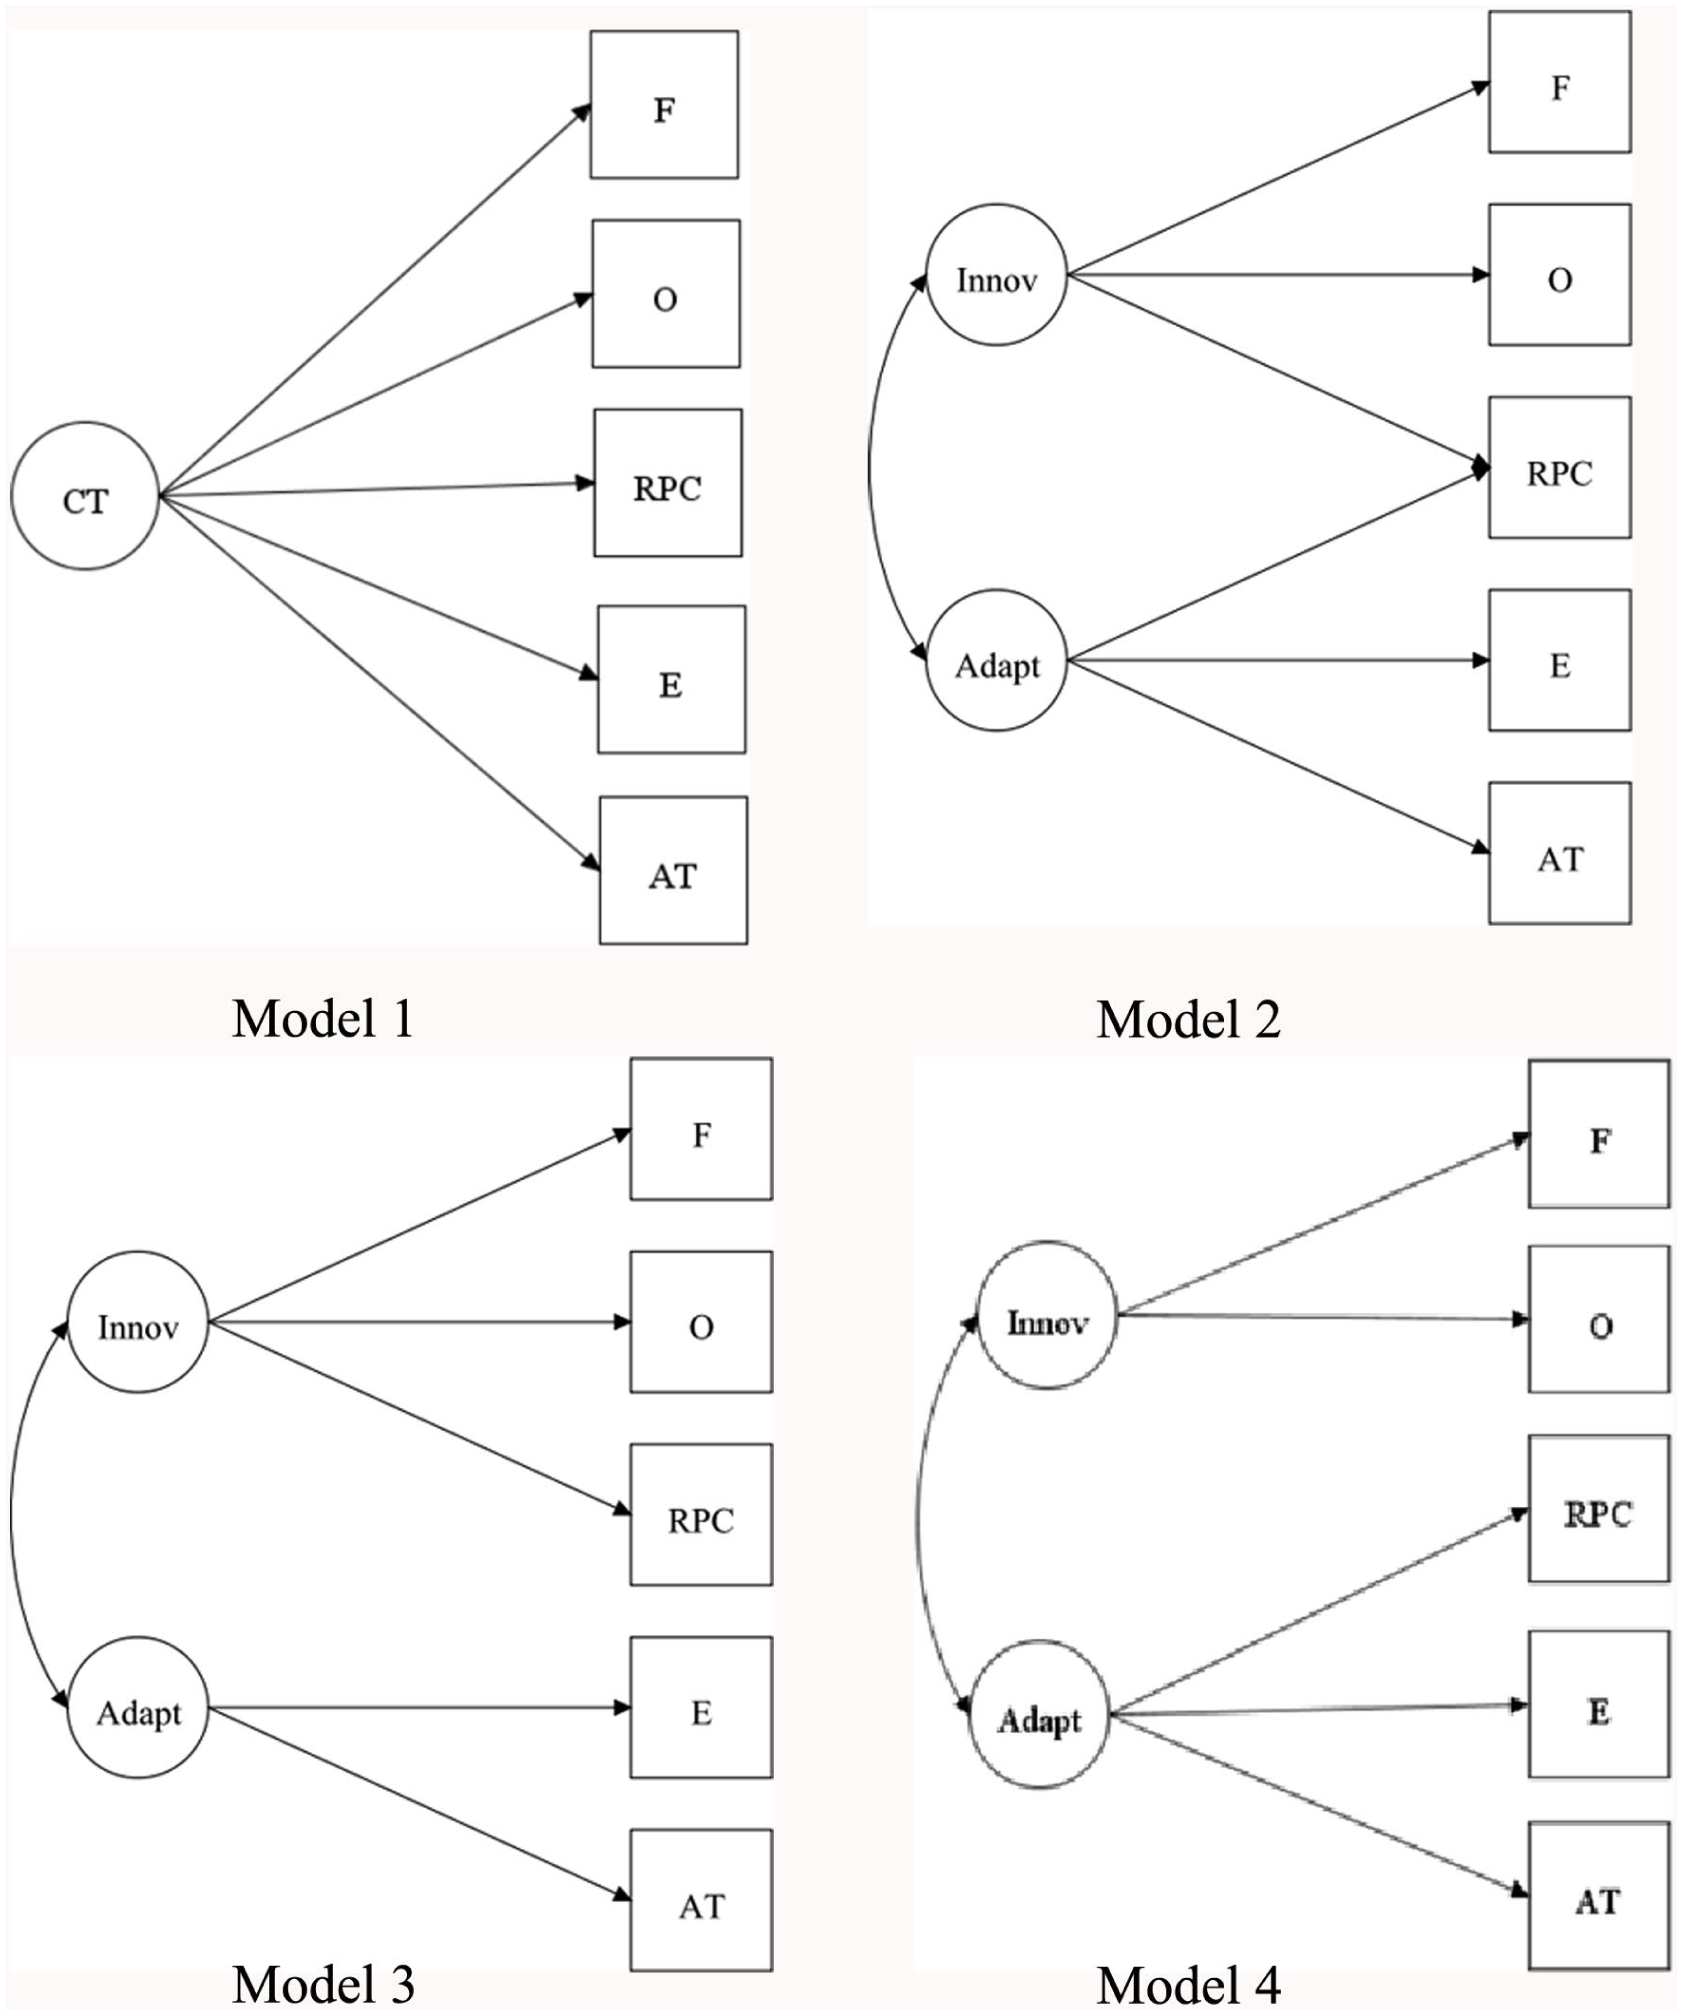
Theoretically Plausible Factor Models That Were Fit.
Does the Structure of the TTCT-F Hold Across Ethnicities and Gender?
The TTCT-F has been generally thought to measure creative thinking in the same way across gender (Kim, 2006; Torrance, 1977) and ethnic groups (Cramond et al., 2005; Torrance & Torrance, 1972). Despite the importance of establishing the fairness of the TTCT-F across ethnicities to ensure equal representation in gifted identification (Kim et al., 2006; Lee et al., 2024), no single study exists that investigated whether the factor structure of the TTCT-F holds invariantly across overrepresented and underrepresented ethnicities. This might be due to limited access to sociodemographic data when scoring the TTCT-F, given that the testing company scoring the test does not collect private information, or probably due to the difficulty of collecting a sufficiently large number of TTCT-F responses from various ethnic groups.
On the contrary, prior studies were likely to report that the latent structure of the TTCT-F was invariant across genders (Krumm et al., 2014, 2016; Xu et al., 2025) but not across grades or ages (Kim et al., 2006), suggesting that more careful interpretation may be needed when comparing the TTCT-F scores from different age groups. Even among the studies that revealed the TTCT-F was fair in terms of gender (Kim et al., 2006; Krumm et al., 2014, 2016; Xu et al., 2025), two studies have identified significant mean differences in Innovative or Adaptive factors and some of the scales (Fluency, Originality, or Elaboration) between boys and girls, where girls’ scores for these scales were consistently higher than boys’ (Krumm et al., 2014; Xu et al., 2025). Especially, girls’ advantages on the RPC, Elaboration, and AT scales (i.e., Adaptive factor) have been highlighted across genders (Bart et al., 2017). This might suggest that there is a gender discrepancy on the TTCT-F scales, indicating that the expression of creative thinking could vary by gender, particularly in younger populations. Combining insights from the studies on ethnicity and gender related to the TTCT-F structures, it is necessary to examine the structures of the TTCT-F across underrepresented and overrepresented ethnicities as well as genders. Investigating the MI of the TTCT across different ethnic and gender groups could uncover whether the use of the TTCT-F for determining the eligibility in gifted identification allows for a fair comparison across students from varying subgroups.
Goals of Current Study
This study examines the factor structure of the TTCT-F scales: Fluency, Originality, Elaboration, AT, and RPC, and then investigates MI across ethnicities (White/European American and Asian students together as those who are overrepresented in U.S. gifted and talented programs; and Black/African American and Hispanic/Latinx students as those who are underrepresented) and genders (boys, girls). Specifically, we explored (a) four theoretically plausible models, including three different two-factor models and a one-factor model through confirmatory factor analysis (CFA), and (b) the measurement invariance across underrepresented and overrepresented ethnicities as well as genders (boys and girls) by conducting multigroup CFA.
In the present investigation, we addressed the following research questions:
Method
Participants
This study was a part of a larger federally funded project that aimed to develop and validate cost-effective creativity assessments utilizing automated scoring methods. Elementary school students (N = 379) from grades 3, 4, and 5 in the United States (Mage = 9.33, SD = 0.97) participated in this study. The sample was collected from five schools within a large public charter school network located in Texas. These schools serve diverse students across five different cities but under a unified charter system and were selected based on accessibility using a convenience sampling method. The sample was composed of 137 (36.1%) third grade, 130 (34.3%) fourth grade, and 112 (29.6%) fifth grade students. Of the total sample, there were 178 (47.0%) male and 201 (53.0%) female students. With respect to race and ethnicity, 125 (33.0%) were Hispanic or Latinx; 112 (29.6%) Black or African American; 68 (17.9%) Asian; 60 (15.8%) White or European American; 8 (2.1%) Multi-ethnic identities; and 3 (0.8%) American Indian or Alaska Native identity. Moreover, 131 (34.6%) were English Language Learners (ELLs), 49 (12.9%) receiving special education (SPED) services; and 60 (15.8%) identified as gifted and talented (GT).
Focal Measure: TTCT-F
The TTCT-F Form A (Torrance, 1998), which is composed of three activities, was administered in this study. The first activity, Picture Construction, required augmenting an abstract shape and titling the resulting drawing. The second activity, Picture Completion, consisted of 10 incomplete figures and instructed participants to add additional detail to compose a drawing around those figures, and students also provided a title for their drawing. The third activity, Lines, required completing a drawing using the same pair of parallel lines as many times as possible, as well as adding titles for each drawing (Torrance, 1966, 1974, 1990). Students were given 10 min per activity to both draw and title their drawings. Across these three activities, the TTCT-F quantifies creative thinking through five norm-referenced scores which are each explained below.
Fluency
Because all participants received the same amount of time on each task, Fluency was operationalized as the quantity of ideas posited during that time. If participants conveyed an idea through drawing using the provided figures in Activities 2 and 3, they received 1 point for each drawing. However, duplicates, unrecognizable, and abstract doodles were not counted toward fluency, resulting in 0 points. In the TTCT-F scoring procedure, fluency is scored first before the other dimensions, and drawings are only scored for the other dimensions if they counted toward the fluency score. Fluency was scored on Activities 2 and 3 but not on Activity 1 because there was only one item in this activity and therefore multiple ideas are not possible.
Originality
Originality indicates the number of unusual ideas, focusing on how the provided figures are used in each response. Originality was scored based on the zero-originality list for each activity, which functioned as criteria for judging originality of the idea. The responses listed in the zero-originality list received 0 points, and those not listed were scored 1. In addition, bonus points were granted when their drawing contained two or more figures across the items. Originality was scored for all the activities, but bonus originality scores were granted just for Activities 2 and 3.
Resistance to Premature Closure
RPC measured the ability to delay closing the parallel lines in Activity 2, implying how open-minded or curious they were. Zero points were awarded if the incomplete figure in each item was entirely closed or used as the response itself. Two points were granted if the figure was never closed or closed incidentally to convey an idea. If the level of closure was somewhat between entirely closed and opened, they received 1 point, following the scoring guidelines. RPC was only scored for Activity 2.
Elaboration
Elaboration represents how many details were added to the basic idea expressed in the drawing. Additional ideas were counted by the number of shadings, decorations, and so forth, and elaboration was scored on an interval scale ranging from 0 to 6 depending on how many details the responses had. All three activities were scored for Elaboration.
Abstractness of the Titles
AT is defined as making a title that goes beyond the obvious description of the idea in the drawing (Torrance et al., 2008). This represents finding and communicating the essential story in the drawing. AT was scored for Activities 1 and 2 on a scale ranging from 0 to 3, according to the level of abstractness and imaginativeness.
Data Collection Procedures
TTCT-F Form A (Torrance, 1998) was given in groups (less than 20 children in each group) following the administration guidelines. The groups were formed depending on the timing of parental consent. Before conducting the study, we obtained the participants’ verbal assent. Students completed the TTCT-F along with the other creative thinking tests and several questionnaires on the same day. There were a few exceptions where some participants took the TTCT-F on another day, depending on what their school schedule required. Students received a toy gift as compensation for their participation. The data was collected during normal school hours from five different branches of the same public-school network located in Texas. The TTCT response booklets were sent to Scholastic Testing Service to obtain scores from a certified TTCT-F rater.
Data Analysis Overview
Bivariate correlations between the TTCT scores were assessed to investigate how and to what extent they were related. Then, CFA was conducted for the entire sample to test which model was the best-fit among the theoretically plausible two-factor models as well as a one-factor model of the TTCT-F scores. Then, multigroup CFA was conducted to compare the factor structure of the TTCT-F across ethnicities (underrepresented and overrepresented in U.S. gifted and talented programs) and gender (boys and girls) with the best-fitting model.
Results
Bivariate Correlations Among TTCT-F Scores
Correlations were calculated to analyze the relations among the TTCT-F scores. Bivariate correlations are reported in Table 1. Notably, Fluency and Originality were highly correlated (r = .77, p < .01), indicating that those participants who generated many ideas also produced more original ideas (sometimes referred to as fluency confound; Forthmann et al., 2020; Hocevar, 1979). Fluency showed a moderate positive correlation with RPC (r = .58, p < .01), and a small correlation with Elaboration (r = .28, p < .01). Interestingly, Fluency showed the least positive association with AT (r = .10, p < .05). Originality was moderately correlated with RPC (r = .57, p < .01) and Elaboration (r = .37, p < .01), while showing a weaker positive correlation with AT (r = .10, p < .05). Elaboration was moderately associated with AT (r = .48, p < .01) and RPC (r = .32, p < .01). AT showed a small positive correlation with RPC (r = .28, p < .01). What stood out in the correlation table was that AT showed a relatively weaker correlation with the other scores except Elaboration. Also, Elaboration showed the strongest positive association with AT while being less strongly correlated with the other scores. This pattern demonstrates a close relationship between Fluency and Originality, just as AT and Elaboration were tightly intertwined. With these findings in mind, we carried out CFA.
Bivariate Correlations Among the TTCT-F Scales for the Entire Sample.
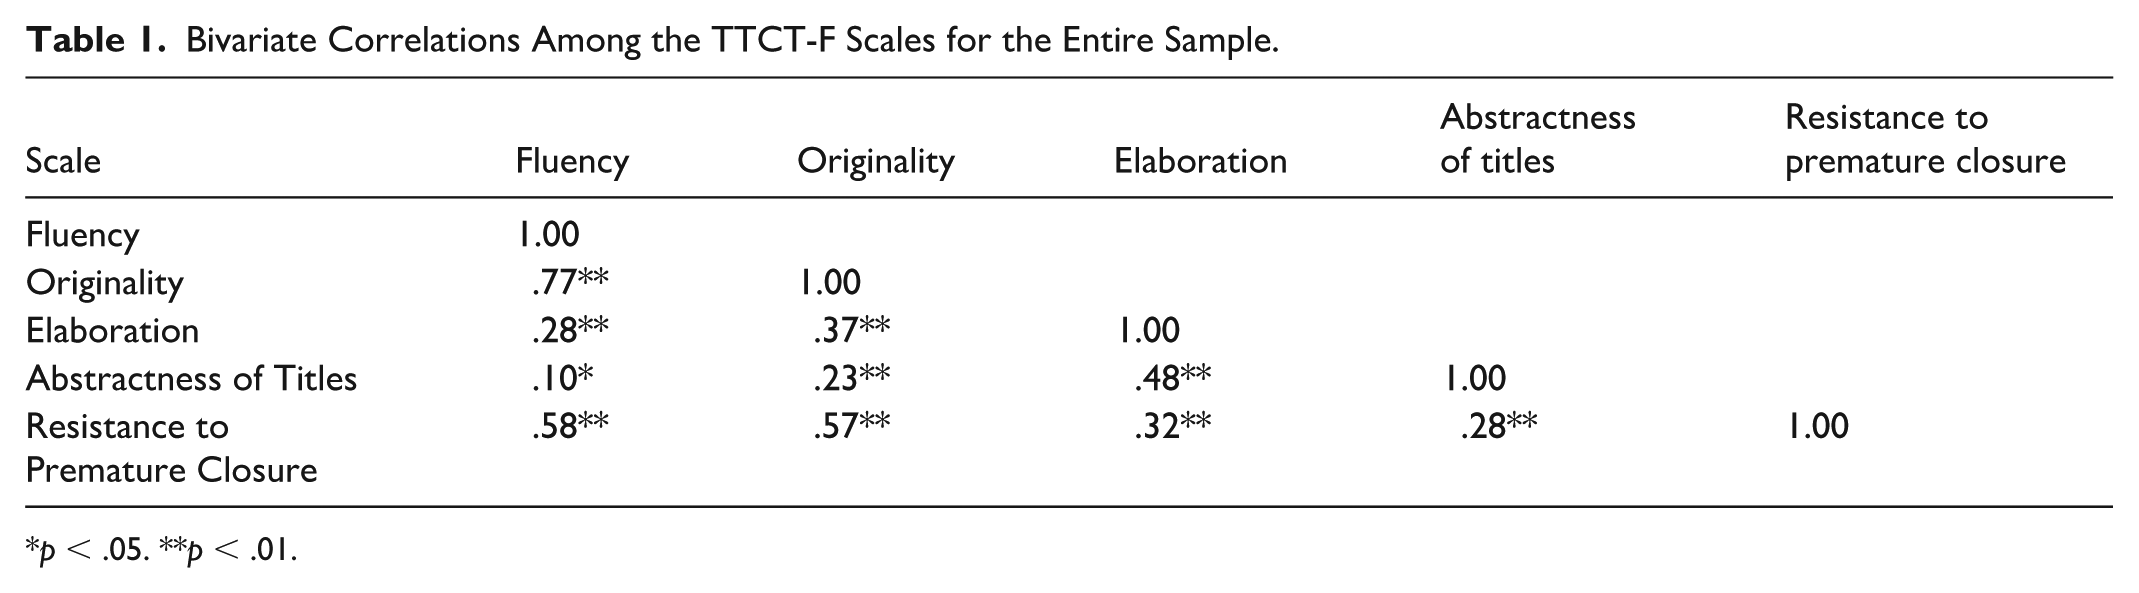
p < .05. **p < .01.
Fitting CFA Models to All Student Data
Model Configuration
Four theoretically plausible and empirically supported two-factor models and the one-factor model were fit to the data from all participants. The compared models (see Figure 1) were: (a) Model 1—One-factor model; (b) Model 2—Innovative (Fluency, Originality, RPC) and Adaptive (Elaboration, RPC, AT); (c) Model 3—Innovative (Fluency, Originality, RPC) and Adaptive (Elaboration, AT); and (d) Model 4—Innovative (Fluency, Originality) and Adaptive (RPC, Elaboration, AT).
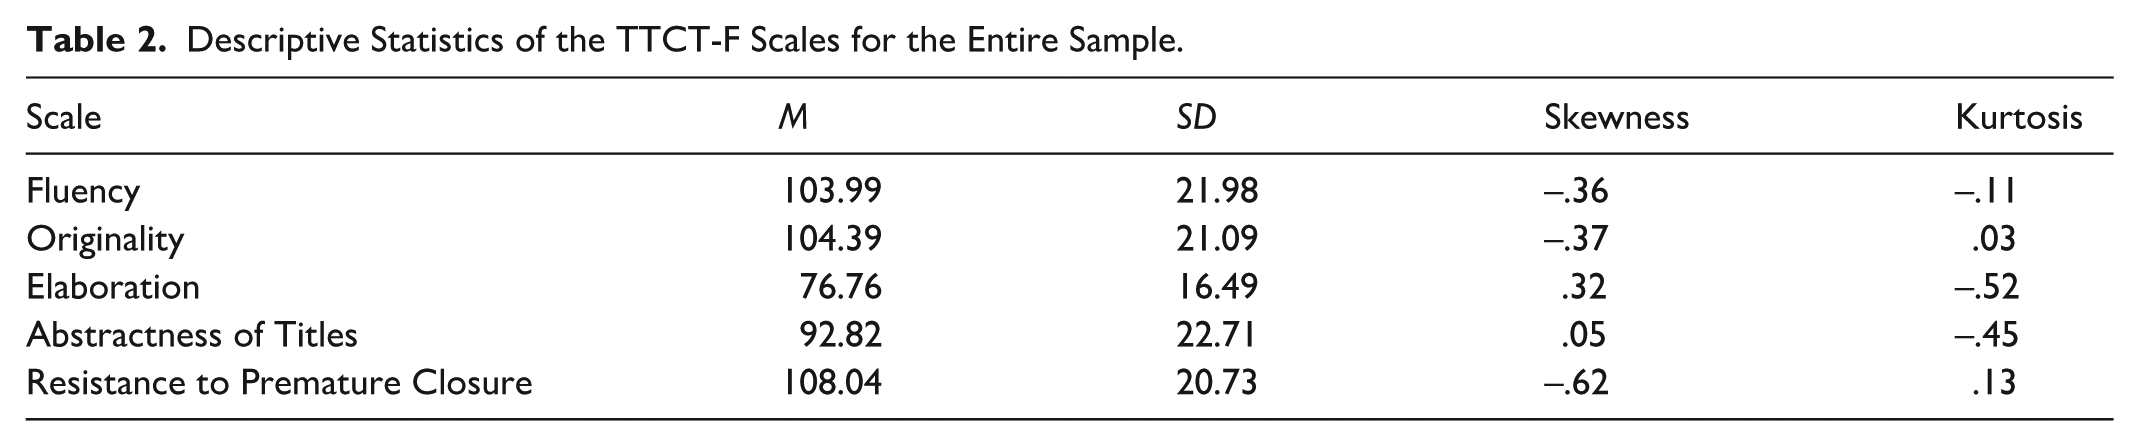
CFA was carried out for the entire sample using Mplus 8.0 software (Muthén & Muthén, 2017) to test which model was the best-fit among the four different factor models of the TTCT-F scales. As the skewness and kurtosis values for these scales were all within the range of normal distribution (see Table 2), maximum likelihood estimation was utilized for producing fit indices and model parameters. The variance of the Innovative and Adaptive factors was set to 1 for model identification and standardization. To determine the best-fitting model for the whole sample, the chi-square test and fit indices were used. The fit indexes used for the CFA were the comparative fit index (CFI), the Tucker–Lewis index (TLI), root mean square error of approximation (RMSEA), and standardized root mean square residual (SRMR). The cutoff criteria for indicating a good model-data fit were a value of .90 or above for CFI and TLI, .08 as an upper boundary for RMSEA, and .10 or less for SRMR (Cordon & Finney, 2008; Vandenberg & Lance, 2000).
Descriptive Statistics of the TTCT-F Scales for the Entire Sample.
The model fit was not acceptable for any of the models and therefore modification indices were used to check if additional parameters were needed in the model to substantially improve model data fit. These modification indices suggested the need to correlate some item error variances in Models 2, 3, and 4: the error covariances between Fluency and AT as well as between Originality and Elaboration. Adding the path of residual covariance between Fluency and AT was also justified by the well-established finding about a trade-off between idea quantity and quality in the field of creativity research (Forthmann et al., 2018), given that producing many drawings might have negatively influenced creating reflective titles in the limited time. The residuals of Originality and Elaboration were also allowed to covary in each of the models, which we believed made theoretical sense given the way the scoring procedures for Elaboration may also have identified aspects of drawings that made them more Original.
Comparison of Model Fit
To determine which model obtained the best-fit, the chi-square test and other fit indices were compared. The chi-square values and fit indices for the models are provided in Table 3. Model 1 (One-factor) demonstrated a significant chi-square value, χ2 (5) = 107.20, p < .001, CFI and TLI values less than .90, and RMSEA value greater than .08, suggesting a poor fit. The fit indices indicated that Model 2, consisting of Innovative (Fluency, Originality, and RPC) and Adaptive (RPC, Elaboration, and AT) with the residual covariances, was the best-fitting model among the four. The chi-square value of Model 2 was not significant, χ2(1) = .04, p > .05, and the fit indices were very good, as shown by the fact that the CFI and TLI were above .95, and RMSEA and SRMR were less than .05. In Model 2, the residual covariances of Fluency and AT as well as Originality and Elaboration were added. Although Model 3 with the residual covariances showed a significant chi-square value of 6.02 (df = 2, p < .01), it was necessary to pair with other fit indices, given that chi-square value is sensitive to large sample size (Meade et al., 2008). Overall, the fit indices for Model 3 (CFI = .99, TLI = .97, RMSEA = .07, SRMR = .02) indicated an acceptable fit. Model 4 showed a poor fit even with the residual covariances added, as shown by a significantly greater chi-square value, χ2(2) = 58.50, < .001, with the CFI and TLI below acceptable ranges and the RMSEA far above .08.
Model Comparison via Fit Indices.
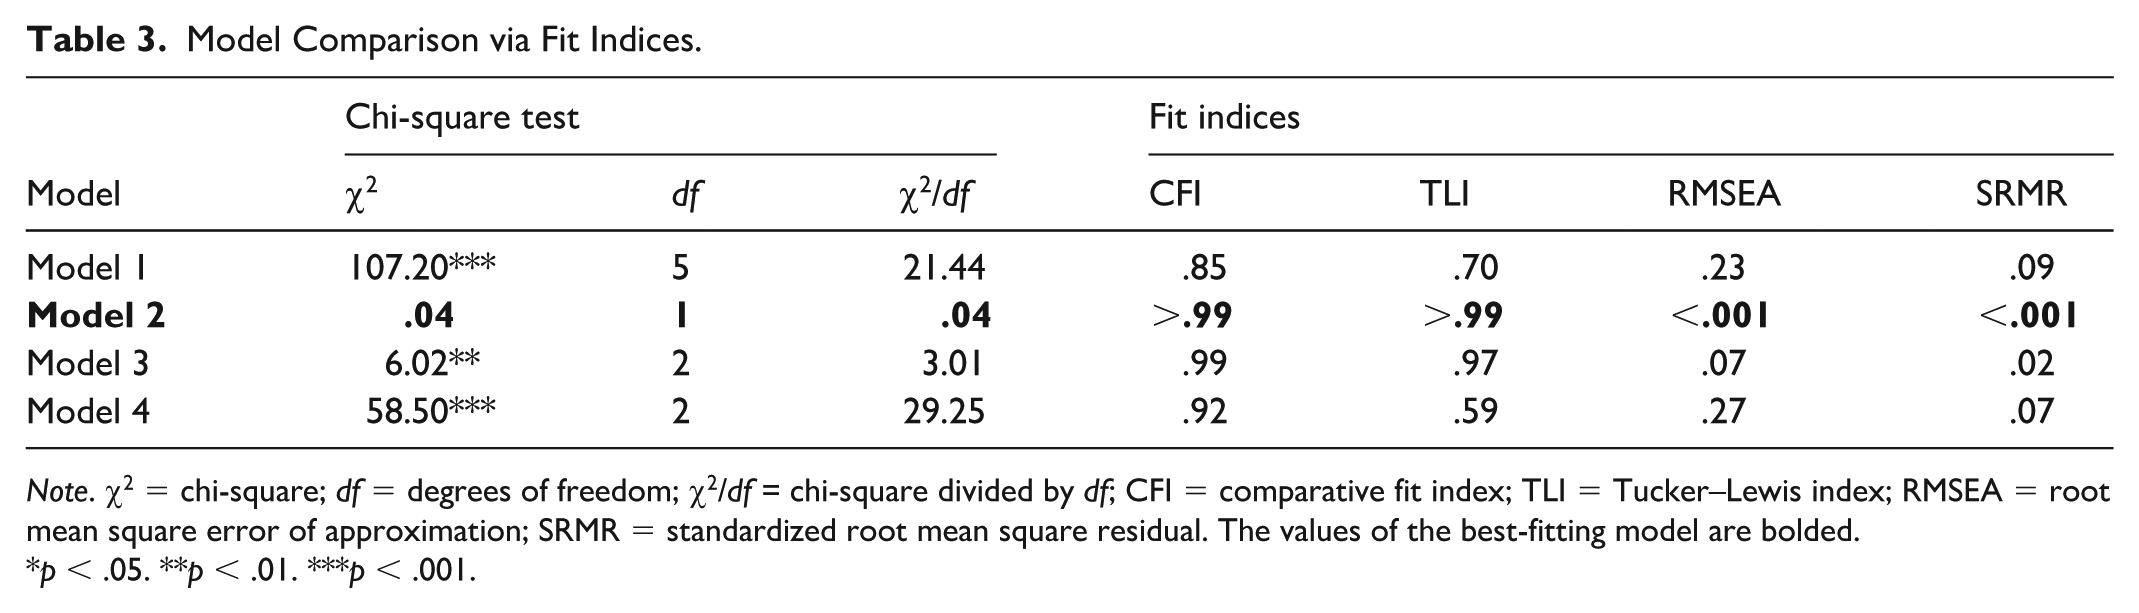
Note. χ2 = chi-square; df = degrees of freedom; χ2/df = chi-square divided by df; CFI = comparative fit index; TLI = Tucker–Lewis index; RMSEA = root mean square error of approximation; SRMR = standardized root mean square residual. The values of the best-fitting model are bolded.
p < .05. **p < .01. ***p < .001.
To determine whether Model 2 was more optimal than Model 3 since they both achieved acceptable fit, a Chi-square difference test was carried out to compare the model fit of Model 2 and 3. As a result, Model 2 showed a significantly better fit than Model 3, Δχ2(1)
Interpreting Model Coefficients
The standardized path coefficients in the CFA model were examined to compare the strength of the relations between the latent constructs and the indicator variables (see Figure 2). Innovative and Adaptive factors showed a moderately strong latent correlation (r = .41, p < .01), indicating a positive relationship while still being separable.
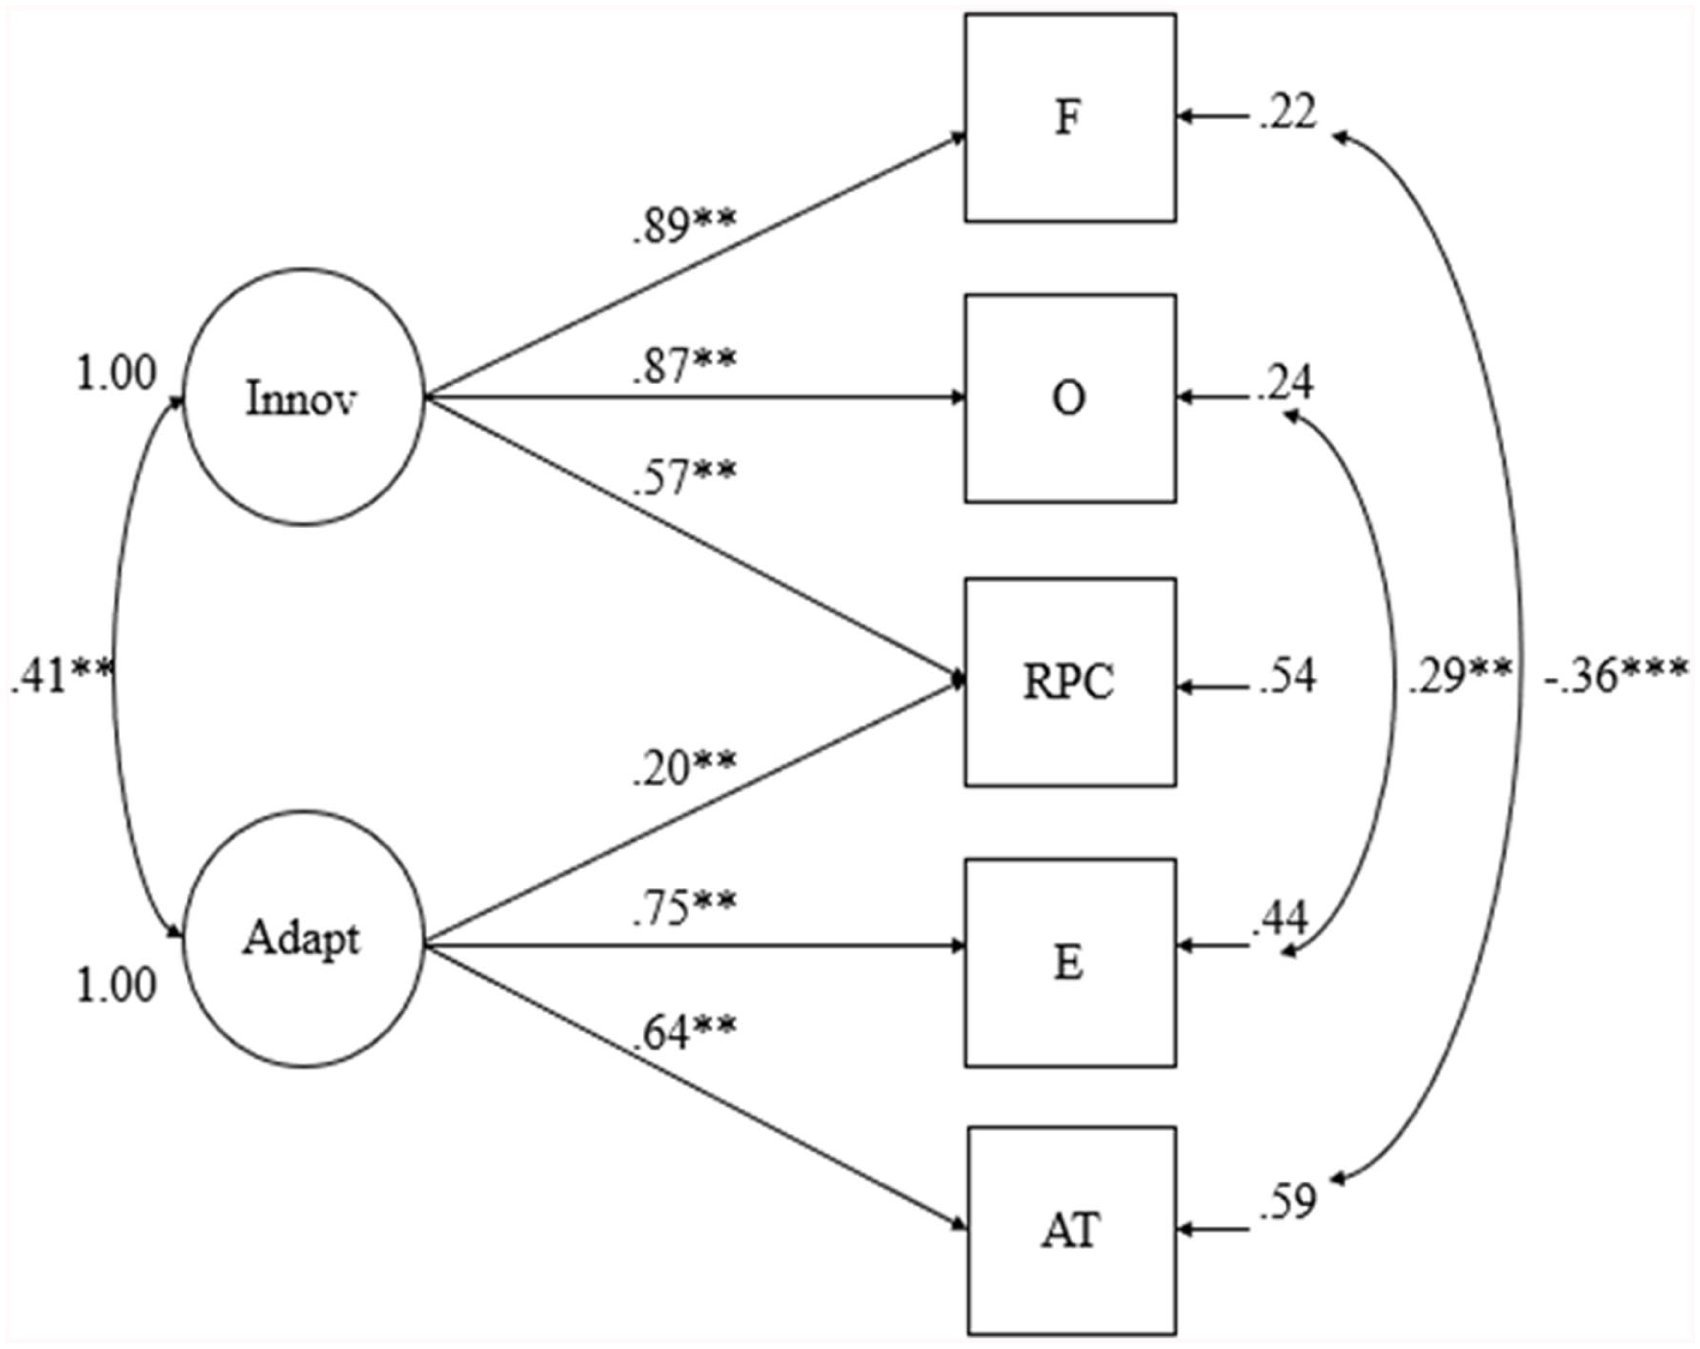
The Best-Fitting Model for the Entire Elementary Student Sample, With Standardized Coefficients.
Concerning the Innovative factor, Fluency loaded onto the factor with the highest coefficient (β = .89, p < .01), Originality the second highest (β = .87, p < .01), and RPC the lowest (β = .57, p < .01). Interestingly, RPC relatively weakly cross-loaded onto the Adaptive factor (β = .20, p < .01) in this study, while RPC tended to load onto the Adaptive factor higher than onto Innovative in prior studies (Krumm et al., 2014; Said-Metwaly et al., 2018). Adaptive was strongly loaded onto by Elaboration (β = .75, p < .01), and AT (β = .64, p < .01), suggesting that these indicators represent the Adaptive factor.
The residual correlations were as follows: Fluency with AT (r = −.36, p <. 001), Originality with Elaboration (r = .29, p < .01). These factor coefficients indicated that there may be a negative association between Fluency and AT and a positive association between Originality and Elaboration after accounting for the shared variance explained by the two latent factors.
Multi-Group CFA Models for Measurement Invariance
Based on the best-fit model (Model 2) we identified, multigroup CFA was conducted to compare the factor structure of the TTCT-F across ethnicities (underrepresented, overrepresented in U.S. gifted and talented programs) and genders (boys, girls).
Underrepresented and Overrepresented Ethnicities
Because the sample size within each ethnicity (i.e., Black/African American, Asian, Hispanic, and White/European American for consistency, American Indian, and Multi-Ethnic) was not large enough to accommodate a full comparison of the measurement parameters across each individual group, they were combined in theoretically and practically informed ways to accomplish this analysis. Specifically, the Hispanic and Black/African American students were combined into the group Underrepresented, because of their underrepresentation in U.S. gifted and talented programs. White/European American and Asian students were also combined into the group Overrepresented, because of their overrepresentation in U.S. gifted and talented programs (Erwin & Worrell, 2012; Lee et al., 2024; Peters et al., 2019; Yoon & Gentry, 2009). Prior studies (e.g., Masters-Waage et al., 2024) have used this categorization approach to address the issues of inequitable access, as suggested by the Underrepresented Minority (URM) frameworks (Bhatti, 2021; National Science Foundation, National Center for Science and Engineering Statistics, 2019).
To assess the Measurement Invariance of the Innovative-Adaptive model, we started by fitting a configurally invariant multigroup CFA model, in which the same two-factor configuration was present across the groups but no other parameters were constrained to be equal. Then, the loadings in that multigroup model were constrained to be equal, resulting in a metric invariance model. Third, the item intercepts were constrained to be equal across the groups, resulting in a scalar invariance model. Comparison of fit indices across these models allowed for inferences about the invariance of the Innovative-Adaptive model across overrepresented and underrepresented groups (Cordon & Finney, 2008; Rodriguez & Shaffer, 2020).
The multigroup CFA showed that measurement invariance was established at configural, metric, and scalar levels across overrepresented and underrepresented ethnic groups (see Table 4), which implies that the Innovative-Adaptive model functioned in a similar way across the different ethnicity groups. In Step 1, configural invariance was tested by fitting without any equality constraints. This model demonstrated a non-significant chi-square value, χ2(2) = 1.00, p > .05, CFI and TLI values greater than .90, and RMSEA value almost near zero, indicating an excellent fit. The good fit suggested that the overall factor configuration held across groups. In Step 2, metric invariance was assessed by placing equality constraints on the factor loadings. Metric invariance was supported, as indicated by the fit indices in Table 4. Though there was a noticeable increase in RMSEA from the configural model (ΔRMSEA = .052), RMSEA was still acceptable (RMSEA = .052). Thus, the metric model did not practically worsen the fit statistics than the configural model, suggesting that Innovative and Adaptive factors were indicated similarly by the scales across the underrepresented and overrepresented ethnic groups. In step 3, scalar invariance was tested by constraining the intercepts to be equal across these groups. Also, scalar invariance was established as represented by the fit indices in Table 4. There were only slight changes in CFI, TLI, RMSEA, and SRMR from the metric to scalar model, suggesting that adding the constraints to the intercepts did not significantly worsen the model fit. This means that group mean differences in the scales are consistent with group mean differences in latent Innovative and Adaptive factors. As scalar invariance was achieved, comparing mean differences of the TTCT scales between the underrepresented and overrepresented ethnicities would be considered valid.
Measurement Invariance Fit Comparisons Across Overrepresented and Underrepresented Ethnicities.
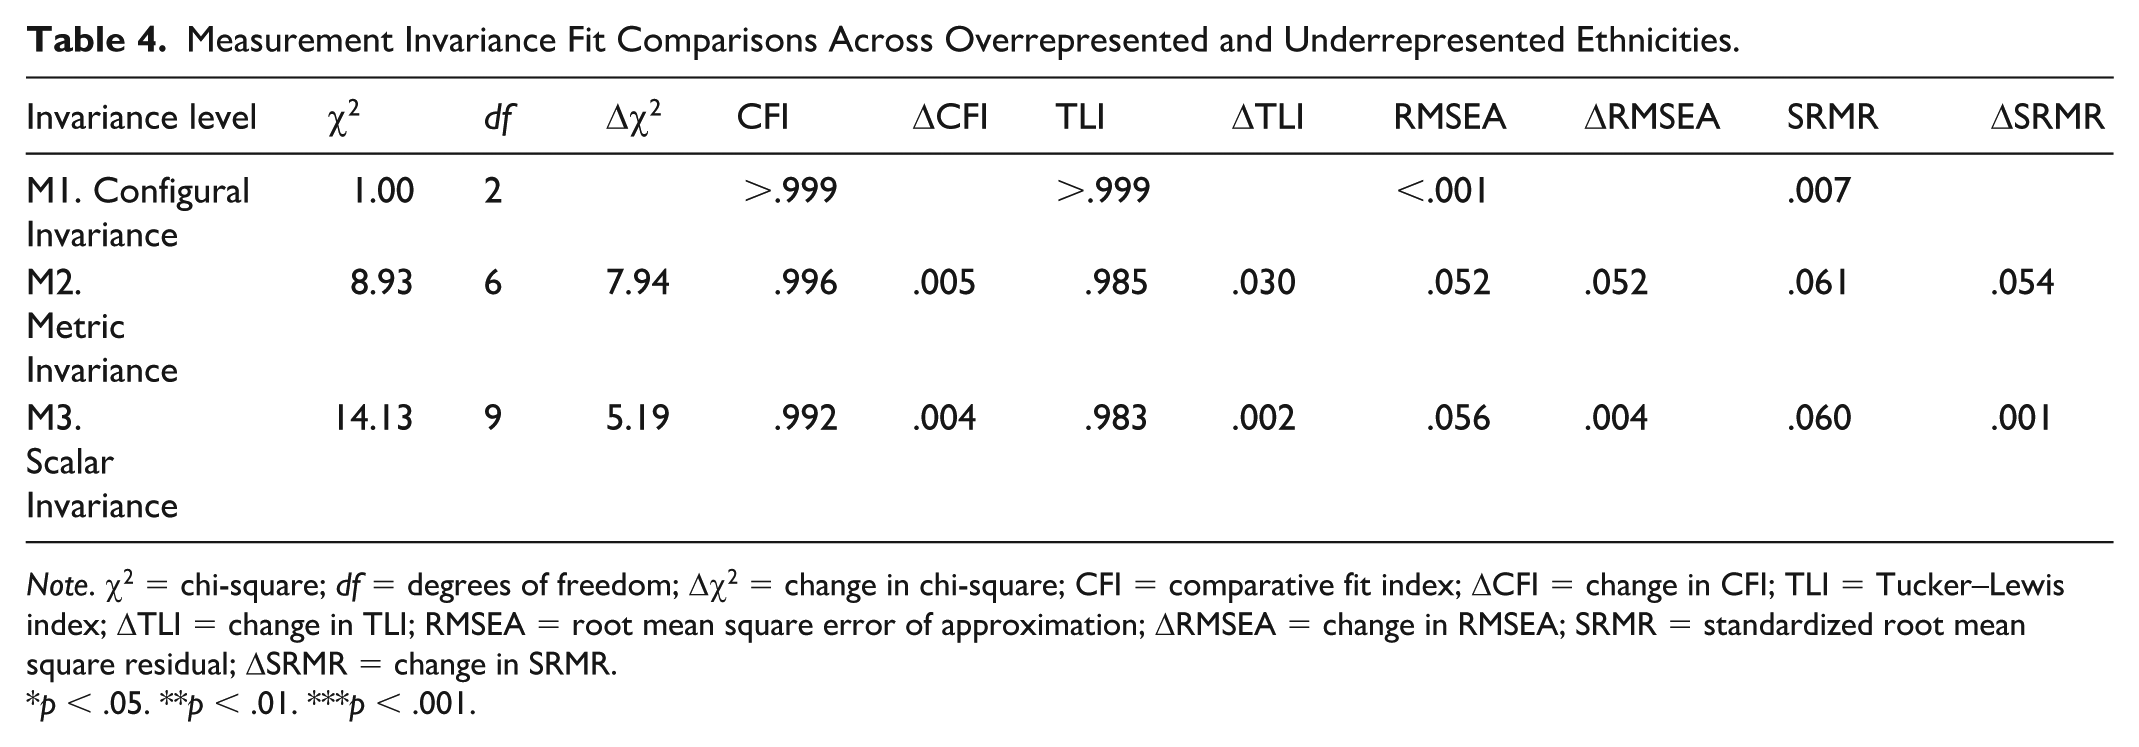
Note. χ2 = chi-square; df = degrees of freedom; Δχ2 = change in chi-square; CFI = comparative fit index; ΔCFI = change in CFI; TLI = Tucker–Lewis index; ΔTLI = change in TLI; RMSEA = root mean square error of approximation; ΔRMSEA = change in RMSEA; SRMR = standardized root mean square residual; ΔSRMR = change in SRMR.
p < .05. **p < .01. ***p < .001.
Gender
Multigroup CFA across gender was carried out following the same procedures as with ethnicity above. However, in the case of gender, the configurally invariant model failed to converge. We attempted many changes to estimation settings in Mplus, including constraining the residual variance-covariance matrix to be positive, removing outliers from the data, and increasing the number of model iterations, but none of these strategies were able to make the configurally invariant model converge. This failure to converge suggests that the latent structure of the TTCT-F implied by the Innovative-Adaptive model did not hold across both boys and girls in this dataset, and therefore the multigroup model was not able to be fit. To more fully examine this finding, we closely investigated the differences in the intercorrelations among the TTCT scores across genders below.
Delving Into Bivariate Correlation Across Genders
To investigate how the scores were similarly or differently correlated in boys and girls, a Fisher’s Z-test was used to examine if there were significant differences between the correlation coefficients across those groups. Table 5 presents descriptive statistics of the TTCT-F scales by gender and Table 6 presents bivariate correlations across genders. Notably, the correlation between Fluency and Originality was significantly larger in girls (r = .86, p < .001) than in boys (r = .68, p < .001): z = −4.45, p < .001. These findings suggest that producing more ideas very consistently led to greater originality for girls, while boys did not as consistently show increased originality despite generating many ideas.
Means and Standard Deviations of the TTCT-F Scales by Gender.
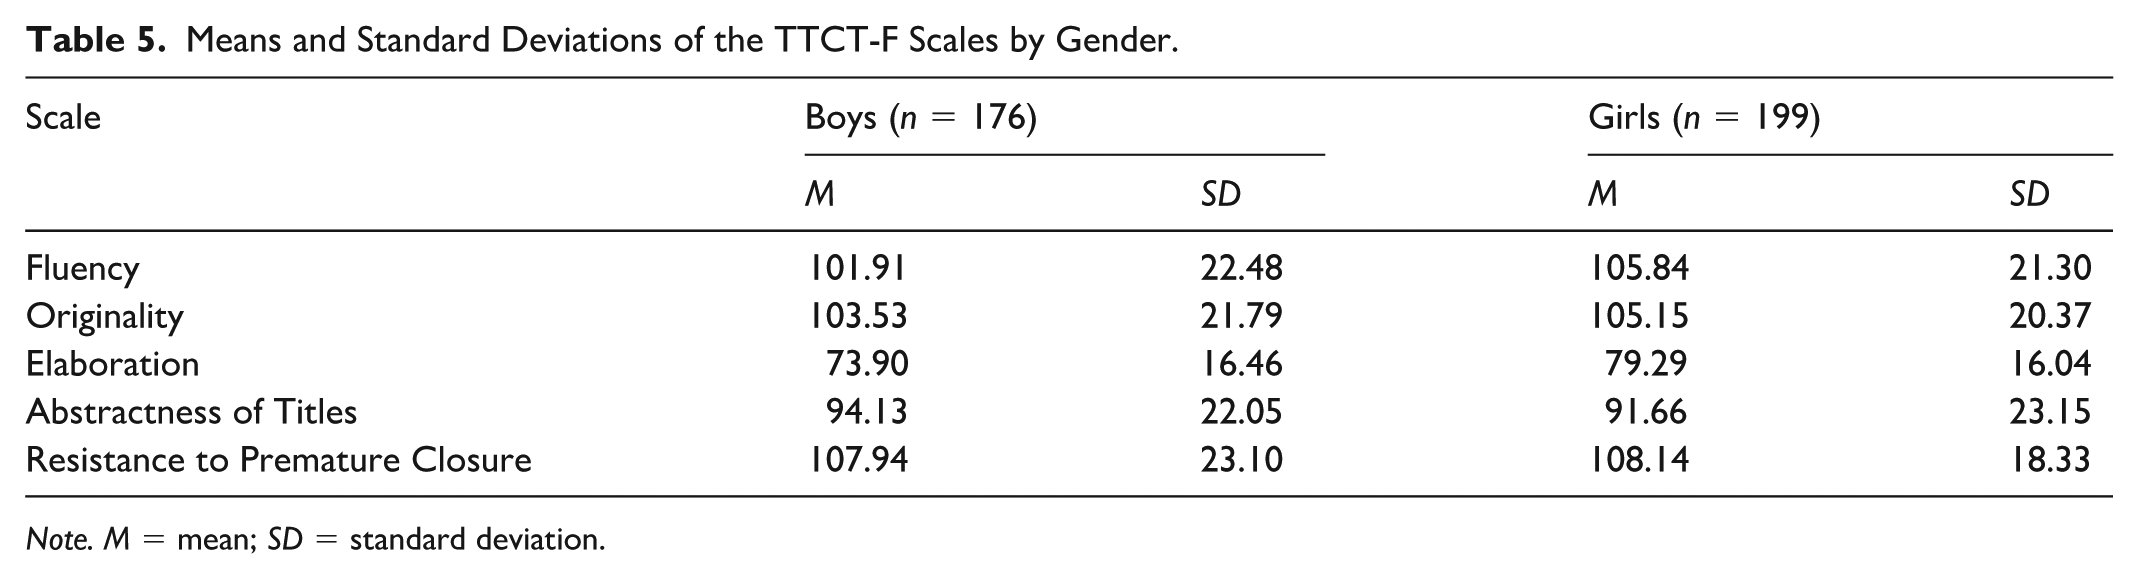
Note. M = mean; SD = standard deviation.
Correlations Between the TTCT-F Scales for Gender Groups.
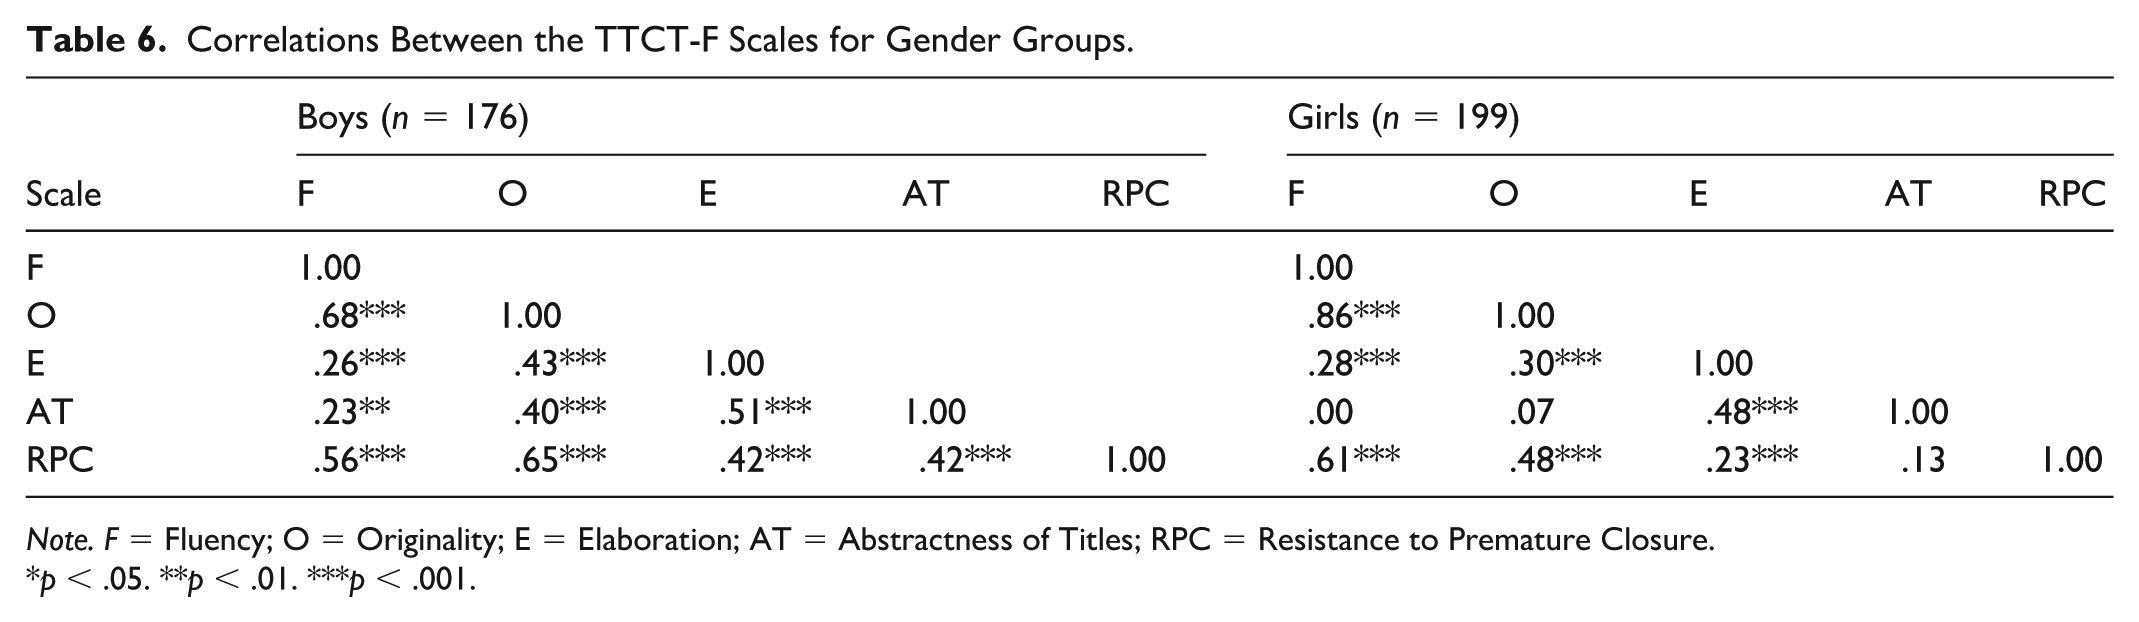
Note. F = Fluency; O = Originality; E = Elaboration; AT = Abstractness of Titles; RPC = Resistance to Premature Closure.
p < .05. **p < .01. ***p < .001.
On the contrary, Fluency and AT showed a significantly weaker correlation in girls (r = .001, p = .997) than in boys (r = .23, p < .001), z = 2.24, p < .05, indicating that there was a relatively weak but positive association between these variables for boys, while no relationship was found for girls. These correlations suggest that girls may be capable of generating abstract and imaginative titles without being influenced by the number of ideas, whereas boys may tend to create more abstract titles when they have more ideas. As seen by Tables 5 and 6, boys also demonstrated a descriptively stronger relationship between AT and Originality, Elaboration, and RPC when compared with girls, but these differences were not statistically significant.
Discussion
In this discussion, we begin with key findings from the empirical investigation, before moving to practical implications for gifted identification, and then positing future directions in this line of work.
Key Findings
An Innovative-Adaptive Two-Factor Model Was the Best-Fitting Model
The Innovative-Adaptive two-factor model with a cross-loading for RPC (Model 2), was the best fitting to the overall sample of elementary student TTCT-F responses. Our findings with the overall sample are therefore entirely aligned with past empirical work that established the Innovative-Adaptive two-factor model of the TTCT scales (i.e., Kim et al., 2006), which revealed that the latent structure of creative thinking was most accurately represented by the two-factor model with a cross-loading for RPC. This model suggests that keeping open-minded and delaying judgment (i.e., RPC) might be a foundational psychological attribute for producing multiple original ideas quickly (i.e., Innovative factor), as well as adding details and giving imaginative but relevant titles to each drawing (i.e., Adaptive factor) in elementary students. Given that the Innovative-Adaptive two-factor model showed a considerably better fit compared with the one-factor model, the TTCT-F might provide richer information about students’ creative strengths and areas needing improvement if the scores are interpreted based on these Innovative and Adaptive constructs, rather than a single overall score, as might be used in school-based practice. For instance, an elementary student might be relatively proficient in quickly coming up with novel ideas (Innovative factor) yet need to work on refining those ideas with additional details and distinctive titles (Adaptive factor): nuance that would be lost if a single overall score were used.
In contrast to previous studies (Acar et al., 2023; Bart et al., 2017; Kim et al., 2006; Krumm et al., 2014, 2016; Yoon, 2017), residual covariances between Fluency and AT as well as Originality and Elaboration were needed to make the model fit for the entire sample in this study. The negative residual correlation between Fluency and AT might imply that, after the variance for the latent Innovative and Adaptive factors is accounted for, these two scales might show a trade-off. Existing work on a trade-off between quantity and quality of ideas has been fruitful in creativity research (Forthmann et al., 2020; Gonthier & Besançon, 2024), and perhaps this line of inquiry could benefit from a closer look at the TTCT-F in the future, especially because quantity-quality relations in creativity could be different in samples of children than they are in adults. In addition, the positive residual correlation between Originality and Elaboration suggests that the scoring procedures for Elaboration might also tap cognitive process involved in Originality. For instance, the students might need to add details to their drawings to effectively communicate an unusual or unconventional idea to the judges. This relation was not clearly explored or understood in earlier TTCT-F factor structure studies, making it interesting for future investigation.
The Two-Factor Model Was Invariant Across Underrepresented and Overrepresented Ethnicities
The Innovative-Adaptive two-factor structure of creative thinking in the TTCT-F held invariantly across underrepresented and overrepresented ethnicities. These results show that the TTCT-F scales appear to be accurately characterized by the Innovative-Adaptive two-factor structure, and this latent structure is consistently represented across both underrepresented and overrepresented ethnic groups. More practically, it means that scores on the Innovative or Adaptive factors of the TTCT-F could be interpreted the same way—and therefore compared directly— across these ethnic groups. So, based on these results, utilizing the two latent mean scores of Innovative and Adaptive factors for gifted identification or for understanding creative strengths and weaknesses might not be biased against underrepresented ethnicities such as Black/African American and Hispanic/Latinx students. This finding is in line with Torrance and his colleagues’ arguments (Cramond, 1994; Torrance, 1971) which emphasized the fairness of the TTCT-F across ethnicities in terms of equal representation in gifted and talented services. It also adds nuance to the equity benefits of the TTCT-F by highlighting the importance of using the Innovative-Adaptive two-factor scores in educational settings.
The Two-Factor Model Was Not Invariant Across Genders
Interestingly, our findings did not align with earlier empirical work which found that the two-factor structure of the TTCT-F across genders was invariant (Kim et al., 2006; Krumm et al., 2014, 2016). A significantly weaker correlation between Fluency and Originality in boys compared with girls implied that generating many ideas may not be as effective in ensuring high idea quality for boys as it does for girls. Put another way, it might be that the quantity of boys’ ideas showed more of a trade-off with the originality of those ideas. This finding suggests that elementary students of different genders might use different cognitive or metacognitive strategies when engaging with creative thinking assessments. Considering that the detailed instructions for each activity spanned from 5 to 8 lines, which appear to be possibly too long and wordy for younger students, it might be hypothesized that boys may have been less attentive to the instructions and prioritized completing more items, therefore producing a more discernible trade-off between quantity and quality of ideas. On the contrary, we might hypothesize that girls perhaps followed the directions more carefully and, therefore, were still able to produce original and interesting ideas while coming up with multiple ideas. These hypotheses align with existing sustained attention studies which have shown that boys tend to aim to be as fast as possible whereas girls tend to focus more on avoiding errors (Efrat & Orna, 2022; Venker et al., 2007).
In addition, a significantly larger correlation between Fluency and AT in boys than in girls was a new finding in studies of the TTCT. In particular, the zero correlation between these scales in girls suggests that creating imaginative and meaningful titles is an entirely discrete capability from generating many ideas, at least when there is a time constraint. However, a positive correlation between Fluency and AT in boys implies that boys might be more capable of making abstract titles when they also have more ideas. This could possibly be due to boys’ higher risk-taking tendency compared with girls on average (Harris & Jenkins, 2006), which might explain why boys are more willing to share the abstract titles of their drawings, as they appear less concerned about facing criticism, whereas girls might be more reluctant on average and worried about negative outcomes. Taken together, the Innovative-Adaptive two-factor model does not appear to ensure the invariance of the TTCT-F factors across genders in elementary students.
Practical Implications for Gifted Identification
Although the TTCT-F has been generally believed to provide equal affordances to students of diverse ethnicities and genders (Cramond et al., 2005; Kim, 2006; Lee et al., 2024), the way in which this test should be utilized for proportional representation in gifted identification remains uncertain. Relatedly, our findings can give practical guidance for gifted administrators or school psychologists who implement the TTCT-F to assess the creative thinking of elementary school students from different ethnicities and genders for academic purposes. First, the Innovative-Adaptive two-factor scores seem to accurately represent the domain-general creativity of elementary students from diverse backgrounds, and therefore, it is recommended that we shift toward using two-factor scores for gifted identification, rather than sticking with the single overall score that has been the typical practice. Torrance’s suggestion was to not entirely rely on a singular score on the TTCT, as it might fail to capture essential educational information (Torrance, 1966, 1974). Thus, gifted administrators should consider focusing on how to use the two-factor scores in more informed ways. For instance, a student who demonstrates high potential in producing multiple original ideas (i.e., high on Innovative) but who is relatively weaker on the elaboration of ideas and creation of imaginative titles (i.e., relatively low on Adaptive), or vice versa, might still be considered for gifted identification. Using the two separate factor scores will allow gifted administrators to identify students who show creative strengths in different latent traits. Such a flexible approach might offer gifted administrators the chance to recognize students with diverse creative profiles in the gifted identification process. Furthermore, the Innovative-Adaptive two-factor scores could deliver detailed information to support gifted students’ individualized learning for developing creative ideas in school settings. Even after the gifted identification process is completed, gifted educators might interpret these scores in a way that could provide information about students’ creative strengths and areas needing improvement (Cramond, 1994; Torrance, 1974). In addition, students with different profiles on each factor (e.g., high on Innovative but relatively low on Adaptive) might be able to receive individualized instruction, by supporting their strengths and improving weaknesses. Given that gifted and talented services tend to be primarily curriculum-based, TTCT-F scores based on the Innovative-Adaptive model could be more useful when they inform the instruction of creative thinking within a domain-specific curriculum (e.g., math). For example, one option for curriculum and instruction in gifted and talented education includes greater depth and complexity of curriculum (Kaplan, 2013), where creative thinking could be part of the problem-finding and problem-solving process in the specific content areas being taught. Using a strengths-based approach, students with a stronger Innovative capacity may then be tasked to generate many and new math problems and those with Adaptive skills can contribute to refining, improving, and detailing these questions. Ultimately, these scores might inform teachers and gifted coordinators about effective teamwork to support mathematical creativity.
Another practical implication is that the application of the Innovative-Adaptive two-factor scores appears to facilitate the proportional representation of the ethnicities that are underrepresented in U.S. gifted and talented programs, through invariant psychometric properties. Given that the simple addition of the TTCT-F in the identification process did not guarantee equal representation of ethnicities in recent work (i.e., Lee et al., 2024), using the two-factor scores might give more access to gifted and talented services for Black/African American and Hispanic/Latinx students. However, before applying the Innovative-Adaptive two-factor model for gifted identification, it is important to carefully examine and consider how creative thinking is exhibited differently by elementary students of different genders. Therefore, gifted administrators and educators should be aware of this and be flexible in their interpretation of the TTCT-F results when evaluating boys and girls together. For example, school administrators might consider the limitations of these scores across gender groups, as girls’ and boys’ responses covaried in markedly different patterns, producing different factor structures, and therefore different psychological meaning to their scores. Moreover, given that boys’ scores showed more of a trade-off between Fluency and Originality, a boy and a girl with the same score on the Innovative factor might show different strengths (as one empirically supported possibility: a girl with highly original ideas but a relatively smaller number of ideas, and a boy with many ideas but relatively fewer original ideas), and therefore, school administrators may not only rely on the two-factor scores but could delve yet deeper into each individual’s subscale scores. Overall, based on our results here, our team must suggest that TTCT-F scores not be directly compared across genders: girls scores can be compared with those of other girls, but should not be directly compared with boys. This study did not show measurement invariance of the Innovative-Adaptive factors across genders, and the model was specifically not able to be fit to girls’ responses. This finding calls into question whether the Innovative-Adaptive scoring model can be validly applied to girls’ responses to the TTCT-F and suggests a need for future work specifically with girls’ data, to improve their measurement.
The Innovative-Adaptive two-factor scores may not be easily accessible to school administrators, however, without necessary assistance. To facilitate the practical use of the two-factor scores in actual school settings, we recommend providing additional training modules for school administrators on how to create and interpret these factor scores for gifted placement decisions. In addition, we suggest that the Scholastic Testing Service consider incorporating interpretative guidance into the TTCT-F results report. In this manner, this scoring system, based on the two-factor model, could be effectively put into practice.
Limitations and Future Directions
Recruiting more diverse samples is one important mission in the field of educational psychology research to better understand the underlying mechanisms that manifest across different cultures and contexts (Matthews & López, 2020). Future work can extend our study, which relied on demographic details provided by schools, to include increasingly disaggregated categories of ethnicities (e.g., different subgroups within the Asian category, such as Chinese, Koreans, and Indians), socioeconomic status, and twice-exceptionality, which were not part of our analysis because the demographic details provided by the schools, and the sample size, were not sufficient for this purpose. Future research could replicate the current CFA and multigroup CFAs across a broader range of these demographic subgroups. Furthermore, the intersectionality of the demographic variables (e.g., Hispanic/Latinx females, Black/African American males) was unable to be examined in this study, as the limited sample size did not allow for a multigroup CFA among the specific intersecting groups. The results might have been different, had we been able to consider the disaggregated categories of race/ethnicities or the intersectionality of the ethnicities and genders.
Another potential limitation is that the Checklist of Creative Strengths scale was not included in this study, because this scale is based on 13 criterion-referenced measures and uses different scoring methods (Kim et al., 2006). Qualitative studies (e.g., case studies, content analysis of TTCT responses) could also be conducted in the future to explore how creative thinking is expressed differently across the Checklist of Creative Strengths scale among the different groups.
Although our study revealed gender differences in the strength of the associations among the TTCT-F scales (e.g., larger positive correlation between Fluency and Originality in girls than in boys), we were not able to fully investigate the underlying psychological reasons behind these differences. Given that the TTCT-F Form A scores were obtained as a part of the larger federally funded project, we were incapable of conducting follow-up studies that could closely examine intra-individual creative processes while engaging in the TTCT-F test. Previous interview studies with children clearly have been helpful in revealing the psychological processes behind their idea generation (e.g., Berthiaume et al., 2024). Therefore, conducting interviews with these children might yield a deeper understanding of how students of different genders use cognitive and metacognitive strategies in a different way. Finally, given that only the TTCT-F Form A was employed in this study, the results might have been different if the Form B had been used. To broaden our findings, replicating studies with the TTCT-F Form B is essential, to determine whether our findings would hold across different TTCT stimuli.
Investigating the fairness of the TTCT-F across ELL and non-ELL groups could be a fruitful direction for future measurement invariance studies. Given that the TTCT-F also includes complex written instructions spanning 5 to 8 lines for each activity, and requires creating a title for each drawing, there is a possibility that ELL students could be disadvantaged by these language proficiency demands. Accordingly, replicating the current measurement invariance studies with English proficiency status as a grouping variable could address another important underrepresentation issue in gifted identification.
Conclusion
In our TTCT-F dataset, which was obtained from 379 U.S. elementary students representing a range of ethnic groups, the Innovative-Adaptive two-factor model did appear to be the best latent structure to explain the TTCT-F scales. Although this model held invariantly across overrepresented and underrepresented ethnicities, it did not hold across genders. Our findings run counter to past empirical work where the two-factor model functioned similarly across boys and girls (Kim et al., 2006; Krumm et al., 2014, 2016). Differences in the way that creative thinking might manifest across elementary students of different gender therefore requires additional research to be better understood.
Footnotes
Ethical Considerations
Ethical approval for this study was obtained from the Institutional Review Board at the University of North Texas (approval no. IRB # 20-337) on December 23, 2020.
Funding
The authors disclosed receipt of the following financial support for the research, authorship, and/or publication of this article: This research was funded by a grant from the U.S. Department of Education’s Institute for Education Sciences Grant (#R305A200199) to Selcuk Acar, Denis Dumas, and Peter Organisciak.
Conflicting Interests
The authors declared no potential conflicts of interest with respect to the research, authorship, and/or publication of this article.
Open Science Disclosure Statement
The data analyzed in this study are available upon request for purposes of reproducing the results. The code or protocol used to generate the findings reported in the article are available upon request for purposes of reproducing the results or replicating the study. There are no other newly created, unique materials used to conduct the research.
Artificial Intelligence Use
The authors confirm that no generative AI tools were used in the development of this article.