
Abstract
Objective:
False news about vaccination shared in digital spaces is a major problem that harms informed health choices. Drawing from processing fluency theory, we propose that an infographic – a visual representation of information – reduces cognitive load, thereby helping people retain and process the necessary information to discern truth from falsehood in health news.
Design:
Web-administered experiment.
Setting:
US web-based experiment on Qualtrics.
Method:
A national sample of participants was randomly assigned to one of the three conditions: a news literacy infographic, the same information but text-only, or a control group (a blank page). After the short intervention, study participants were shown false news about vaccinations and asked to make judgements about this news.
Results:
Our study found that people in the infographic condition were better able to verify false news than others. They also showed lower trust in false news articles and higher confidence in their judgement than those in the control condition.
Conclusion:
Findings further our understanding of how visuals accompanied by text, such as an infographic, can improve the quality of health education. During the current problem of digital spaces filled with misinformation, using a short intervention with visuals can help audiences determine the credibility of information they encounter about vaccines.
As news moves from a physical to a mainly digital environment, complications can arise with the prevalence of misinformation. Misinformation presents a problem that permeates several areas of society, including health, politics, social justice and the efficacy of people seeking information (Lewandowsky et al., 2017). Social media is quickly becoming a breeding ground for false information, but also allows for interventions and educational materials to advance mitigation strategies to combat this problem (Walter et al., 2020). News literacy (a set of critical thinking skills to understand news and its function in society) is one way to combat this problem and has shown to be effective in digital settings, especially in matters of health (Pennycook et al., 2020; Tully et al., 2020). Increasing news literacy is a major step in helping negate some of the negative influences of misinformation on health.
The ease with which misinformation can spread is evident in information surrounding vaccination. The digital environment gives voice to people who oppose vaccinations, or ‘anti-vaxxers’, who spread inaccurate sources of health information (Ghebreyesus, 2019). While verifying information (discerning whether information is accurate and true or not) from news is difficult enough, this process is even more complicated with social media, where comments from online friends may convolute the credibility of information even more (Del Vicario et al., 2016; Edgerly et al., 2020). Any unreliable person can create a message with many of the trappings of journalistic integrity, yet omit the very principles that make real journalists trustworthy, including verifying their sources, conveying accurate information and maintaining objectivity as much as possible (Igoe, 2020). Furthermore, navigating a digital environment with multiple sources of information requires a high cognitive load, which can diminish the motivation to critically evaluate the information provided (Dominick et al., 2009; Iyengar and Lepper, 2000; Low et al., 2011). Thus, it is important to help audiences verify whether news about vaccines is false or true for their informed decision-making (Jackson et al., 2010).
Traditional education methods offer one effective approach to increasing news literacy (Fleming, 2015; Hobbs, 2010), but are not sufficient to meet the needs of mass audiences in online digital environments. Many news literacy interventions require energy and time, including multiple classes over weeks (Jeong et al., 2012; Maksl et al., 2017). While it would be ideal to enrol every person into such an intervention, not everyone has the ability or opportunity to expend such resources.
In this paper, we propose an infographic that offers news literacy skills as a new way to discern false news and examine its effect in the child vaccination context. This alternative to classroom interventions requires low cognitive load and is necessary to meet the needs of the large populations receiving news in a digital environment through simpler mass distribution (Lewandowsky et al., 2012; Smiciklas, 2012). Drawing from processing fluency theory, we test whether an infographic has an effect on participant’s news literacy skills, through decreasing cognitive load and increasing their ability to recognise cues from false news (Lazard and Atkinson, 2015; Majooni et al., 2018). This has implications for helping audiences navigate a complex and misinformation-filled digital environment while quickly offering skills to verify news stories heuristically to assist in health decision-making in the future. Given the present problem of the COVID-19 pandemic, research has shown that misinformation has increased and leads to detrimental consequences including fear, uncertainty and even death (World Health Organization, 2021). Stopping a virus requires increased vaccination rates, but this can only happen if people can make health decisions based on credible, reliable information, meaning verifying misinformation is more important now, more than ever.
Vaccine misinformation
Vaccine misinformation is a major threat to the health of individuals around the world, according to the World Health Organization, one that could be a detriment to the progress made by scientists and health professionals for decades (Ghebreyesus, 2019). In 2019, measles cases surged across the USA. While hundreds suffered from the disease, 89% of the cases did not receive their vaccinations or their vaccination status was unknown (Centers for Diseases Control and Prevention [CDC], 2019). Many of the cases in the CDC report occurred in states where the law allows people to opt out of vaccines for personal, religious or philosophical reasons. As people seek to gain control over their own health through online information, they risk being led astray by the many voices vying for their attention, especially misinformed peers in their social networks (Wang et al., 2019). Social media is especially detrimental to those who self-select vaccine information without the skills to verify sources and may increase hesitancy through confirmation bias and the influence of anti-vaccination messaging impersonating credible information (Puri et al., 2020).
The suspect quality of vaccine information online from different sources has led to increased hesitancy about the subject among some parents and a need for increased understanding about vaccines in digital spaces (Dib et al., 2021). Eskola et al. (2015) reviewed what is needed to combat this problem and came up with three suggestions for future researchers, including increasing understanding of what causes vaccine hesitancy, research on improving the structure and organisation of increasing vaccine acceptance at different levels, and sharing effective strategies through the development, validation and implementation of tools that can help overcome different aspects that lead to hesitancy. When misinformation is diminished, hesitancy decreases (Geoghegan et al., 2020). This study sought to help develop a tool that may help people in verifying whether an article contains vaccine misinformation, thereby mitigating hesitancy.
Infographics and news literacy
From an educational standpoint, teaching skills to verify misinformation are important to communicate with learners in digital environments where they are overwhelmed by information and decision-making, which constrains their working memory, also known as cognitive load (Low et al., 2011). Reducing cognitive load is necessary for information to ‘stick’, and effective learning requires a task to align with a person’s level of expertise (Schnotz and Kürschner, 2007).
Processing fluency theory posits that the ease with which a stimulus is processed can improve its evaluation and increase comprehension, especially through the use of aesthetic appeal and design (Reber et al., 2004; Winkielman et al., 2003). Infographics are an educational tool that uses a combination of text and visuals to graphically display information and can improve processing fluency (Majooni et al., 2018; Smiciklas, 2012). The speed and accuracy of information processing from a stimulus improve through the use of aesthetics and ease of use (Reber et al., 2004). Many studies have shown that infographics can help individuals understand complicated information by reducing cognitive load. One experiment found that readers preferred infographics for summarising medical information, and that they reduced their cognitive load more than a text-only condition (Martin et al., 2019). This idea has been further explored in another study, where the use of infographics showed increased engagement and improved information processing over traditional methods of communicating health information in a digital environment (Comello et al., 2016). An assessment of several hundred health-related infographics found that those based on credible information with a clear purpose can greatly assist in the dissemination of information as part of public health campaigns (Jahan et al., 2020). Infographics serve as an effective tool in accomplishing the goal of visually informing audiences and simplifying the message.
The effectiveness of infographics to distil complex information in a clear way works well in a news literacy context. As it relates to this context, news literacy involves using critical thinking skills to judge the reliability or credibility of news (Maksl et al., 2017; Tully et al., 2020 Vraga and Tully, 2016). Although most people know how to find digital information, an individual’s news literacy education will often determine how well they navigate information critically, with reminders such as short interventions activating those skills to look out for signs of misinformation (Vraga and Tully, 2016). Dixon et al. (2015) suggest infographics as a way of utilising the variety of online and visual storytelling techniques to combat misinformation and communicate these skills. Breaking down news literacy principles directly related to verifying misinformation through the heuristic cues provided on an infographic can educate audiences about the fundamentals without overwhelming them (Lazard and Atkinson, 2015; Majooni et al., 2018). Therefore, the hypothesis to be investigated here was as follows.
H1. Participants exposed to an infographic-based media literacy message will show better judgement on false news articles than others exposed to text-based or no messages. Specifically, participants in the infographic condition will (a) verify false news better and (b) show lower trust in false news articles than others in text or control conditions.
Certainty and confidence
Malik et al. (2013) explain that the goal of news literacy is to empower citizens to understand the role of news in society, to critically evaluate news and to recognise credible sources. Media literacy, as the tree from which the branch of news literacy grows, has gradually moved towards an empowerment perspective, whereby people learn the principles to become active citizens, rather than simply the informed consumers of media (Hobbs and Jensen, 2009). Perceived self-efficacy, or the belief in one’s ability to successfully perform a task, is related to empowerment, as it is concerned with a person’s confidence in their ability to influence things that affect their life, such as the news or other media (Bandura, 1986, 2010). If a person does not believe their actions can make a difference, they will not be empowered through confidence to take an actionable step, such as verifying misinformation (Bandura, 2010).
As stated before, infographics can be utilised to better communicate principles of news literacy by combining visual and text messages (Farmer, 2019; Lester, 2013). An individual’s confidence in their ability, or in this case their perceived news literacy, can be different from actual ability. Verifying misinformation requires news literacy skills to accompany confidence in order to be successful (Austin et al., 2012). Those participants educated with news literacy skills through an infographic should be more confident in their ability to verify misinformation. If confidence is high and the participant’s discernment is correct, then the news literacy intervention is working correctly and their confidence becomes reflective of their newfound skillset (Tully et al., 2020). The intervention should therefore educate in skills that can easily be understood so that participants can gain balance between confidence and successful implementation.
Based on this logic, the confidence in a participant’s decision should be higher for the infographic condition compared to other conditions, with correct verification scores that correlate appropriately. Therefore, a second hypothesis to be investigated was as follows:
H2. Participants exposed to an infographic-based media literacy message will show higher confidence in their judgements than others exposed to text-based or no messages.
Methods
Sample
A total of 205 participants in the USA were recruited through MTurk, which is a web-based survey participation recruitment service provided by Amazon. Research suggests MTurk samples are generally more representative and more attentive than in-person convenience samples, although their use has some limitations (Berinsky et al., 2012; Goodman et al., 2013). Each participant who completed the study was offered US$1 token compensation for their participation.
In a pilot test for timing estimation, four graduate students were recruited to read all the news articles and answer questions. The average time taken to complete the study was 8.12 minutes, with the standard deviation of 1.29. Due to the nature of the study, we excluded participants who spent less than 6.83 minutes (mean−1 SD) to complete it. The final sample size included in the analysis is 153. According to the power analysis, this sample size is large enough to obtain a power of .75 with a moderate effect size (.25) and a significance level of .05.
Our sample comprised 41.2% women (N = 63) and 57.5% men (N = 88). Their ages ranging from 20 to 72 years with a mean of 42.64 years (SD = 13.55). With regard to income range, 26.1% of participants (N = 40) reported less than US$20,000, 22.9% (N = 35) reported US$40,000–US$59,999 and 20.9% (32) reported US$20,000–US$39,999. In terms of education, 78.4% of participants (N = 120) reported they received a bachelor’s degree or similar and 15.0% (N = 23) of them reported they earned a graduate degree or above.
Procedure
The web-administered experiment started with an informed consent form which introduced participants briefly introduced to the study. After participants agreed to participate in the experiment, the survey system randomly placed them in one of the three conditions: the infographic (containing the skills needed for verifying misinformation), the text-only (comprising the text from the infographic without visual or graphic elements) or the control (no stimuli, only a message telling them to click next) conditions. Next, they were asked to read three false news articles about vaccination and to make judgements about the articles. The three articles were shown in random order.
Stimuli and design
The infographic was designed by the researchers based on news literacy research with suggestions for ways to verify misinformation (Lazer et al., 2017; News Literacy Project, 2021; Ridout and Fowler, 2018). After receiving feedback from pilot studies, the infographic was refined into that used in the final study (see Figure 1). The text-only condition used the same text in the infographic but did not contain any of the graphical elements (see Figure 2). The participants in the control condition viewed a blank page with a ‘click next’ message before reading three news articles, but did not see any stimuli about verifying false news.
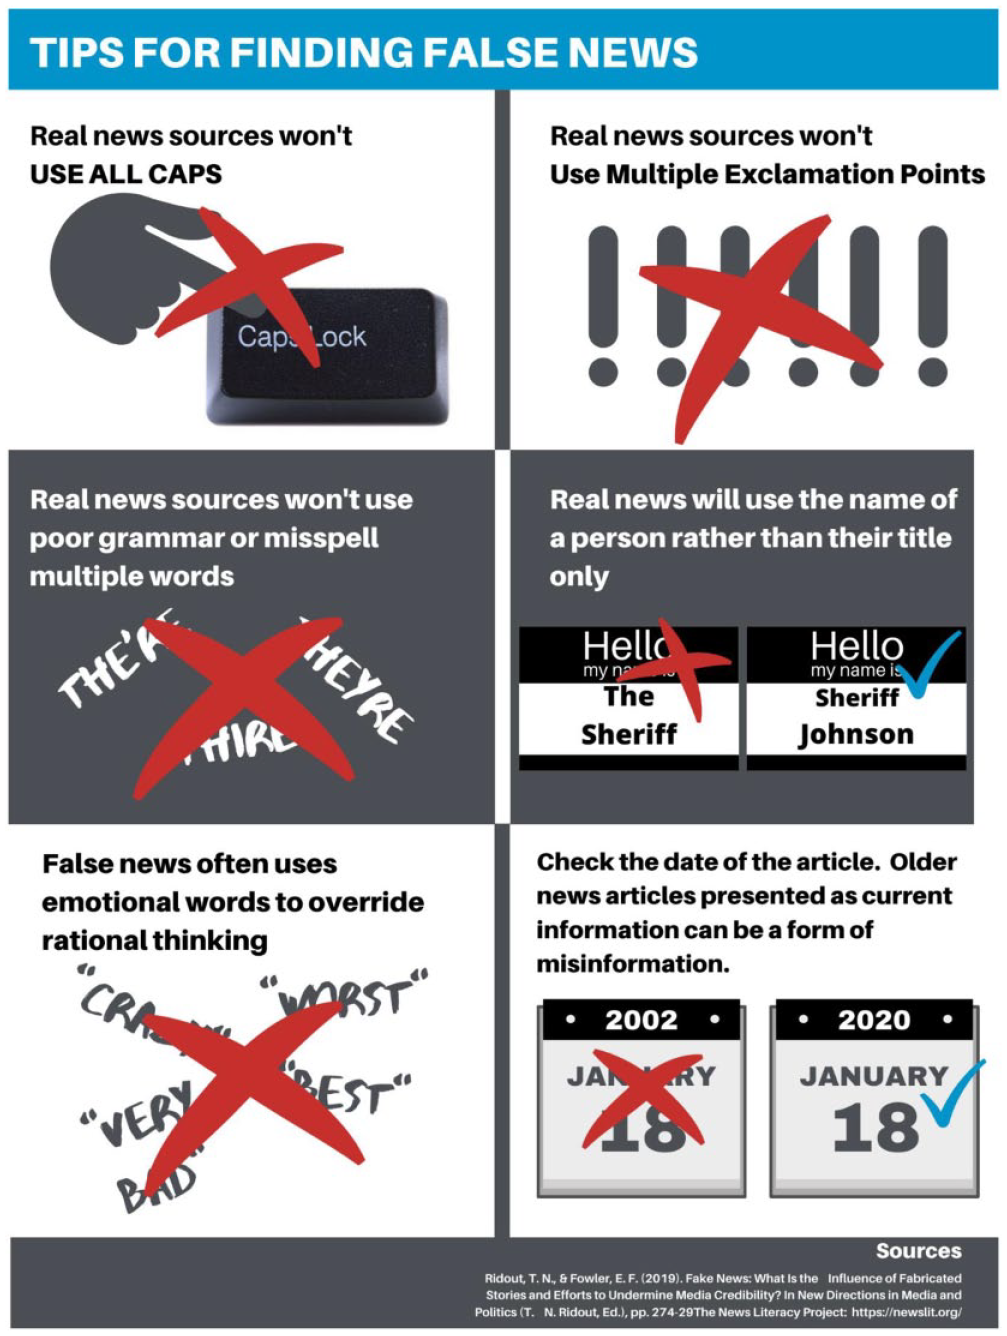
Infographic stimulus.
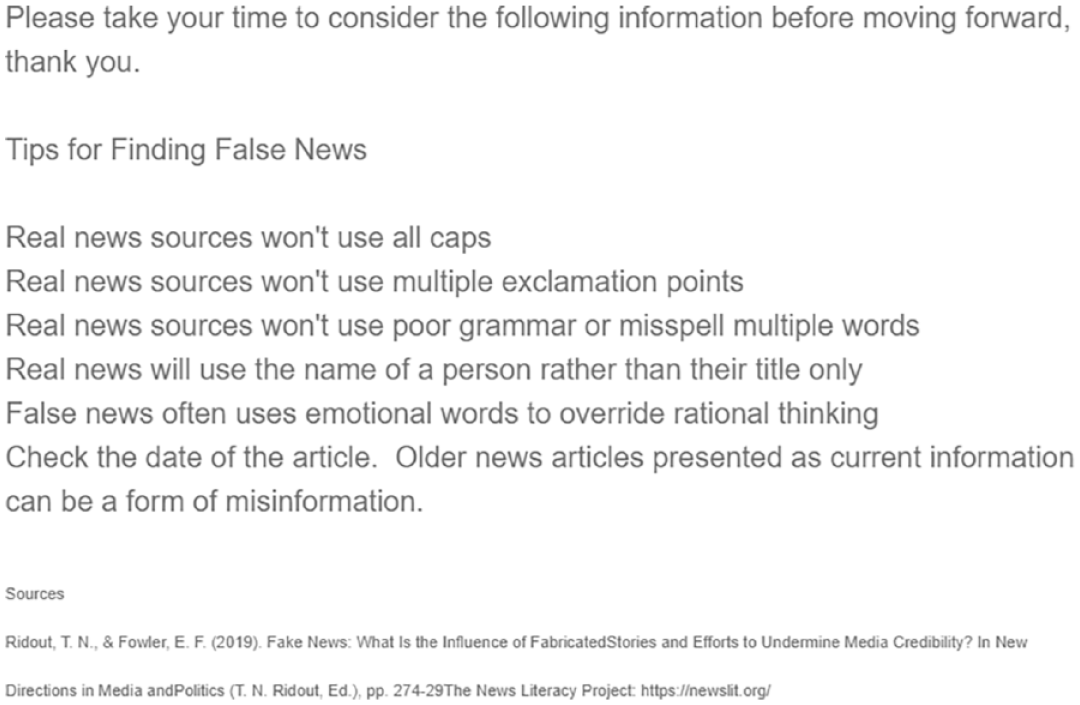
Text-only stimulus.
The three false news articles used in the experiment were selected through the following process: First, several news articles about vaccines were identified from sources such as Snopes.com, Factcheck.org., The Guardian and USA today. Among them, stories that were similar in length, not overly controversial and politically unbiased were selected and edited to reflect the style of grammar and tone contained in misinformation according to news literacy research (Lazer et al., 2017; News Literacy Project, 2021; Ridout and Fowler, 2018). In particular, some of the misinformation elements pointed out in the infographic and text information were used in combination in each false news article, with at least three elements in each. We then conducted a series of pilot studies to select three false news articles that are perceived to be consistent in terms of level of trustworthiness. These pilot studies were small, convenience samples from undergraduate classes taught by the researcher, with both qualitative and quantitative feedback about the stimuli and news articles. Each pilot test varied between 20 and 100 participants who were given extra credit for their participation. The final pilot study, mentioned in the Sample section above with graduate students, also gave an estimation of the minimum time to complete the experiment. The final false news articles used in the study are presented in a supplemental online file.
This experiment was approved by the institutional review board (IRB) at Washington State University, and all participants were shown a message at the end telling them the articles they read contained misinformation, that getting vaccinated is a good health decision and where they could find credible information about vaccination (e.g. on the websites of the World Health Organization and the US CDC).
Measures
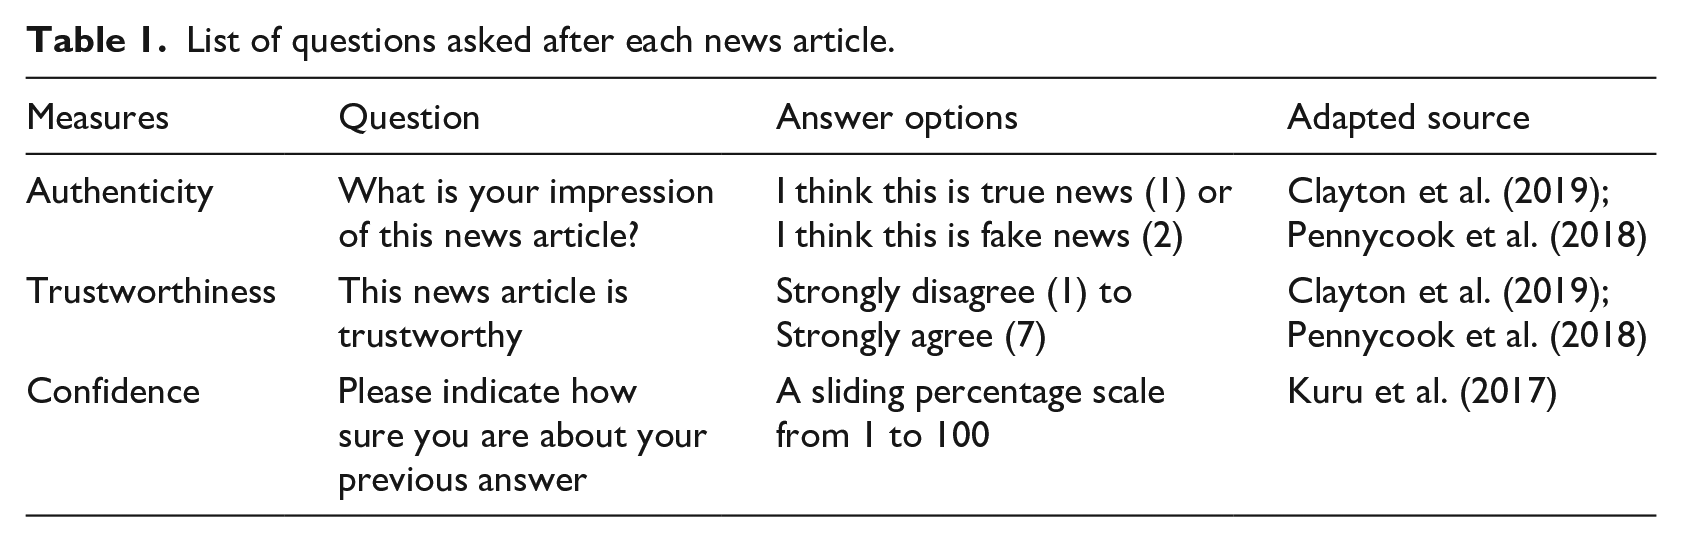
For each of the three articles, participants were asked three questions about the article. First, they were asked how much they agreed on a statement that the article was trustworthy. Next, they had to state whether or not they believed the article was authentic. The final question asked participants to rate how sure they were about their previous answer. Table 1 details the question items used in the study.
List of questions asked after each news article.
After all the news articles were complete, participants in the infographic and text conditions were asked to rate the perceived usefulness of the stimulus to see whether they acknowledged its effectiveness. Two questions with seven-point Likert-type scale were used and combined for analysis: ‘How useful was the information to answer questions in the study?’ and ‘How useful do you think the information is for you to detect fake news in the future?’ (α = .893). The control condition had the usefulness questions omitted from the questionnaire, with all others being the same across conditions. Following these questions, demographic information was obtained, including gender, age, education and income.
Analysis
In order to test our hypotheses, a chi-square test, a t-test and a series of analysis of variance (ANOVA) were employed using SPSS. Alpha level was set as .05.
Results
The first hypothesis proposed that participants in the infographic condition would be able to verify a news article better than the text-only and the control conditions. A chi-square test showed that correct judgement in the infographic condition was observed more than expected, while correct judgements in other conditions were observed less than expected, χ2
(2, 153) = 6.452, p = .040). In particular, 34.6% of participants in the infographic condition recognised the three false stories as all false, whereas only 21.8% of those in the text-only condition and 13.0% of those in the control condition reported all of them were false (see Table 2). Thus, H1a was supported.
Rates of correct judgements in each condition.
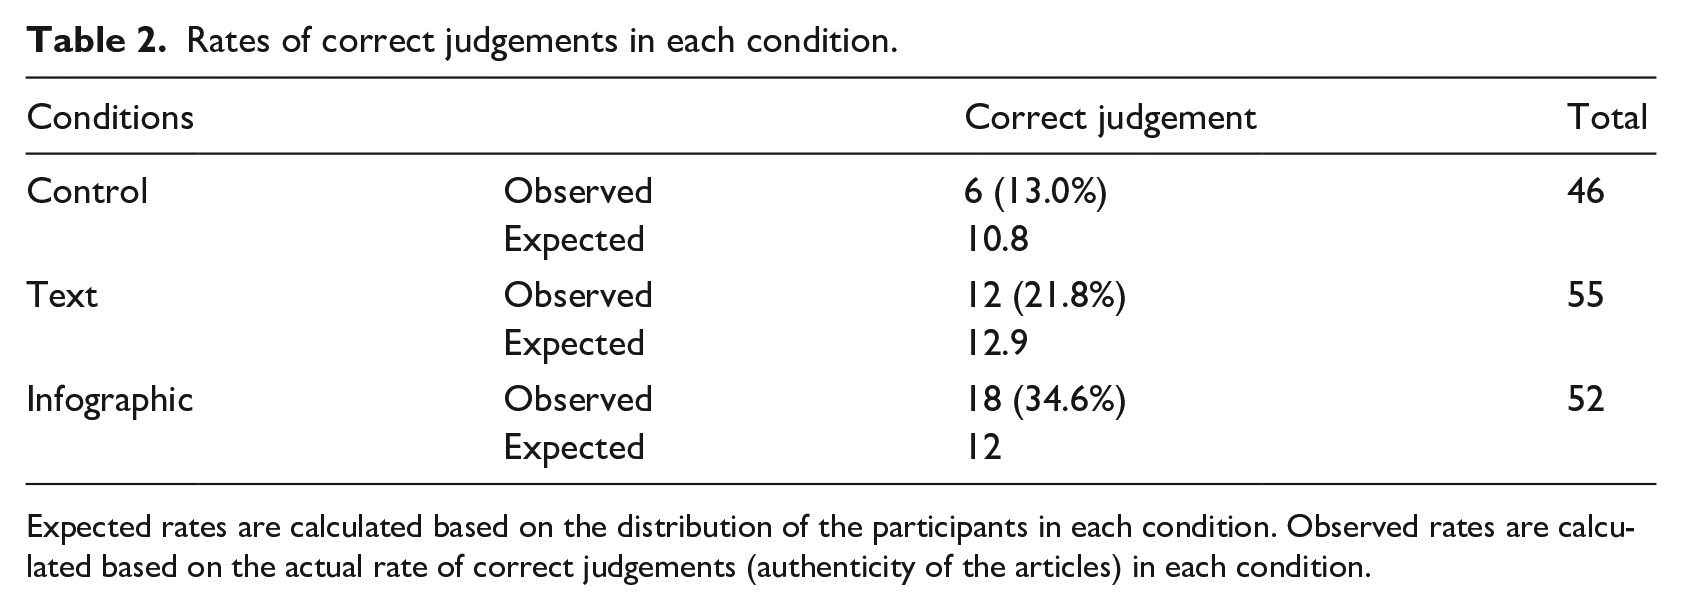
Expected rates are calculated based on the distribution of the participants in each condition. Observed rates are calculated based on the actual rate of correct judgements (authenticity of the articles) in each condition.
With regard to trustworthiness, the ANOVA test revealed significant differences between conditions, F(2, 153) = 3.502, p = .033. However, the post hoc test revealed that only the infographic (M = 3.26, SD = 1.42) and the control (M = 3.98, SD = 1.15) conditions were statistically different. In other words, participants in the infographic condition had lower trust in the false news articles than those in the control condition. The text condition (M = 3.56, SD = 1.42) did not differ from the infographic or control conditions. Thus, H1b was partially supported.
The second hypothesis posited that participants in the infographic condition would show higher confidence in their judgements than others. The ANOVA test showed that there was a significant effect of the intervention on confidence in being able to verify false news, F(2, 153) = 5.247, p = .006. In particular, the post hoc test showed that compared to the control condition, participants in the infographic condition showed significantly more confidence (see Table 3). However, the text-only condition did not significantly differ from the other conditions. Thus, H2 was partially supported.
Means of confidence in each condition.
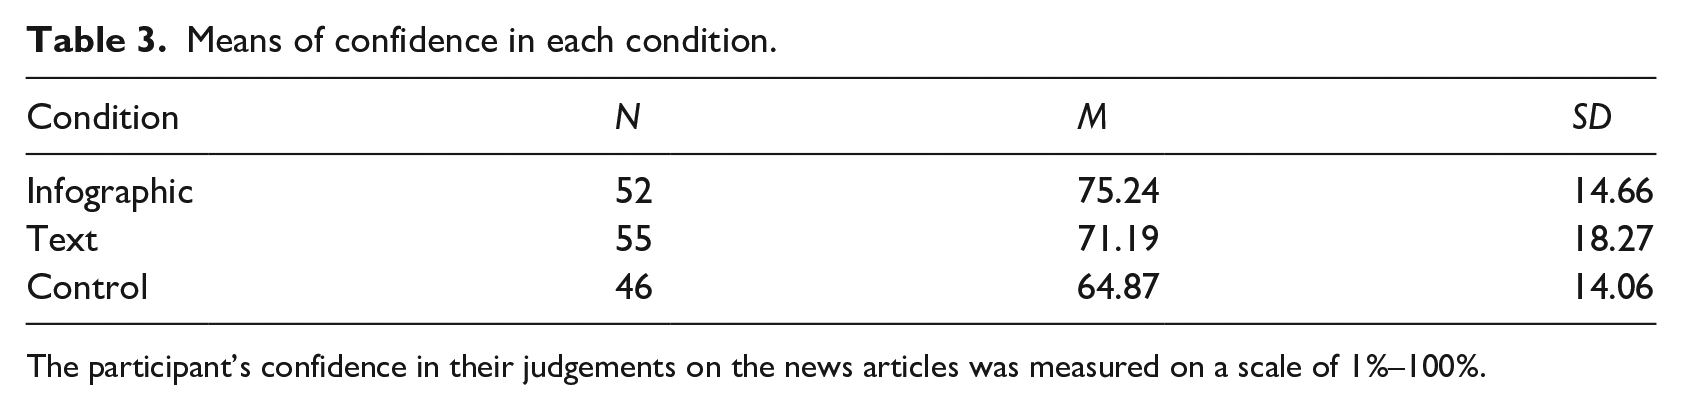
The participant’s confidence in their judgements on the news articles was measured on a scale of 1%–100%.
With regard to perceived usefulness, the participants in the infographic (M = 5.61, SD = 1.17) and the text (M = 5.56, SD = 1.39) condition did not show significant differences, t(95) = .204, p > .01.
Discussion
During this time of an ‘infodemic’ as well as the ongoing COVID-19 pandemic, misinformation about health issues needs to be verified, and our research shows that an infographic can be an effective way of enhancing news literacy skills in a digital environment to help in this endeavour. Participants in the infographic condition showed significantly better ability to verify false news about vaccinations than the text-only and control groups. Those in the infographic group also showed lower trust in the false news articles than the control group. Although the data show the majority of people not being able to verify misinformation, these align with previous studies stating misinformation is difficult to verify for US audiences, and those in our infographic condition align with those who display a higher ability than others to do so (Stecula, 2017; Wineburg et al., 2016). These results imply that visual cues can positively affect cognitive processes during the verification of vaccine news articles.
The visual cues from the infographic allowed participants for better retention of news literacy skill implementation while reading vaccine news articles (Lazard and Atkinson, 2015). This coincides well with processing fluency theory, where the ease of use of an educational message can improve the speed of evaluation and comprehension using visual design (Winkielman et al., 2003). In particular, in an online environment where many pieces of information are presented, an educational message without visual cues may not be well-comprehended due to a lack of attention and limited capacity. It is important to note that those in the infographic and the text condition did not statistically differ in terms of trustworthiness and perceived usefulness of the information. Given the infographic condition’s better ability to verify false news, it is reasonable to infer that they implemented news literacy skills more than in the other conditions. This supports the heuristic effects of visual cues.
This study also found that participants in the infographic condition showed significantly higher confidence than those in the control condition in terms of their judgements about vaccine news articles. This is in line with previous studies that found increased self-efficacy as a result of media literacy interventions, with self-efficacy facilitating healthy behaviours (Austin et al., 2012, 2005). Similarly, confidence to discern good information from bad can also motivate mindful news reading about health issues, which in turn affects informed decision-making (Dominick et al., 2009; Vraga and Tully, 2016).
Furthermore, in the process of increasing self-efficacy concerning news literacy, there is a balance to be struck between confidence and the actual ability to verify whether information is true or not. Overconfidence can lead to being too sceptical of information that is true or may cultivate complacency that can compromise decision-making (Austin et al., 2012). Participants in the infographic condition were significantly better at verifying information than the other two conditions and had higher confidence in their decisions than the other conditions. This result shows that the intervention was effective at both instilling news literacy skills and confidence in participants. It is important to note, however, that confidence in participant’s verification of the articles did not significantly differ between text and infographic conditions, although it was significant over the control condition.
Our study suggests that a text-only intervention having positive outcomes could be beneficial in some situations. Yet, it contributes more to the theoretical understanding of processing fluency by showing that visual messaging accompanied by text improved the process of false news verification best. Our infographic used aesthetically pleasing design (i.e. symmetry and contrast) and the repetition of information, which could lead to familiarity and retention of information. Visual messaging facilitated processing fluency, which in turn made the news literacy skills seem more credible and truthful (Reber et al., 2004). While this study used the infographic to help participants to verify articles concerning vaccination, the infographic itself is not vaccine specific. Vaccine hesitancy has many contributory factors, and misinformation plays a large role in that process. Our study, therefore, is a first step in preventing the sharing of false information surrounding vaccines by recognising it as not credible and therefore mitigating its influence on social groups in digital environments (Dib et al., 2021; Geoghegan et al., 2020). While it was not within the scope of our study, correcting misinformation is important, but our hope is that verification can play a role in preventing vaccine misinformation from affecting others. At the same time, misinformation has multiple facets, and this infographic has been shown to be effective in the area of vaccines. The tactics used in creating this infographic were scientifically based and could be adapted easily. This short intervention offers an alternative to people who may not have the time or resources to receive a full class worth of news literacy education and, therefore, may better be able to reach large audiences (Vraga and Tully, 2016).
Future research could build on these principles by creating infographics to convey helpful, scientifically based information to convey messages in a more effective way in other fields. These could communicate scientific findings, health tips and guidelines, or other ways to combat misinformation. The most pressing matter, and the most easily transferrable, lies in using this same design in regard to COVID-19 misinformation. Researchers can build studies that stop the spread of false information by testing other similar interventions in the form of advertisements, memes or other visually rich messages that could help people navigate digital spaces. This can provide credible and reliable information that will help people make better health decisions, such as improving vaccination rates around the world (World Health Organization, 2021).
Limitations
While this study shows promise in the use of infographics to combat misinformation, especially concerning vaccinations, it comes with some limitations. First, our online experimental setting may not replicate the digital environment that participants are accustomed to and therefore does not fully imitate the ways in which people may normally encounter misinformation. For example, in the everyday digital environment, there may be other visual distractions such as advertisements or embedded images in news articles. Second, although we asked participants not to use the Internet to search for information outside the experiment to control the setting, it is possible that some may have done so during the course of the study. A similar limitation is that while checking sources is an important skill in news literacy, it was difficult to implement in our experimental setting and was therefore omitted from the intervention as a variable for consideration. Third, our study tested the immediate effects of an infographic in verifying false vaccine news, and we were unable to determine the longitudinal effects of the intervention. Finally, the findings of our study cannot be generalised to a very much wider population. Although MTurk samples are known to be more representative than in-person convenience samples (Berinsky et al., 2012), they are generally more educated (Goodman et al., 2013). In our sample, most participants have a bachelor’s degree or higher, and there were slightly more men than women. Future studies can test replication using different sampling methods.
Conclusion
This study furthers an understanding of how visuals accompanied by text, such as an infographic, can help in combating misinformation through news literacy education. Simply sharing this intervention in digital spaces may have an important effect on stopping the spread of false articles from being shared, thereby decreasing vaccine hesitancy. Our findings build on past research and seek to empower individuals by educating them to verify information, helping them navigate digital environments and improve their health decisions.
Supplemental Material
sj-pdf-1-hej-10.1177_00178969211038750 – Supplemental material for Combating misinformation: The effects of infographics in verifying false vaccine news
Supplemental material, sj-pdf-1-hej-10.1177_00178969211038750 for Combating misinformation: The effects of infographics in verifying false vaccine news by Shawn Domgaard and Mina Park in Health Education Journal
Footnotes
References
Supplementary Material
Please find the following supplemental material available below.
For Open Access articles published under a Creative Commons License, all supplemental material carries the same license as the article it is associated with.
For non-Open Access articles published, all supplemental material carries a non-exclusive license, and permission requests for re-use of supplemental material or any part of supplemental material shall be sent directly to the copyright owner as specified in the copyright notice associated with the article.