






Abstract
Objectives:
This study assessed food label reading habits and understanding of nutrition information on food labels by higher income adults in India.
Design:
It involved a cross-sectional study using non-probability purposive sampling.
Setting:
Data were collected by mixed methods approach between March 2019 and February 2020. Adults were selected from housing colonies in four geographical zones of Delhi, India.
Method:
A total of 589 adults (20–40 years) belonging to upper middle-income and high-income groups were selected. Associations between gender, family income, age, marital status, and label reading habits were assessed using Chi-square tests. Demographic predictors of food label reading habits were identified using binary logistic regression with a level of significance set at p < .05.
Results:
Participants read the food labels (79%) and noticed the nutrient claims (76%) on food labels. Female participants were more likely to understand nutrition information as compared with male participants (odds ratio [OR] = 1.52, p = .04). Female participants were also more likely to notice the nutrient claims on the packet of food products (OR = 1.99, p < .01) as compared with male participants. The majority of participants found the ‘traffic light scheme’ format easy to understand.
Conclusion:
Consumers look for nutrition information on food labels. They value healthier food alternatives but most are unable to decipher the nutrition labels. Food labels should communicate the healthfulness of products in a straightforward manner to enable better food choices.
Keywords
Introduction
The growth of the food industry in India has resulted in increased consumption of ultra-processed and packaged foods (Popkin, 2017). In Delhi, an estimated 45% of adults purchase ultra-processed foods once weekly and one-fifth buy them every day (Vemula et al., 2014). According to the NOVA classification, ‘ultra-processed foods’ are formulations of ingredients made by use of industrial processes and equipment, such as packaged snacks, drinks and ready to eat meals (Monteiro et al., 2019). Many of these foods are high in fat, salt and sugar, and regular consumption can increase the risk of non-communicable diseases (Jones et al., 2019).
The food labels on packaged foods are designed to enable healthier food selection by communicating nutrition information to consumers (Kleef and Dagevos, 2015). A food label design helps in product differentiation by communicating about the product’s quality, which facilitates purchase decisions by consumers (Kapoor and Kumar, 2019). India has mandatory nutrition labelling regulations, whereby food products must comply with the quality standard guidelines provided by Food Safety and Standards Authority of India (FSSAI). According to the FSSAI regulations, it is mandatory to display the energy content, protein, carbohydrate, total and added sugars, fat, saturated fat, trans fat and sodium content per 100 g or per serving size of the food product (FSSAI, 2020). According to the FSSAI, it is also mandatory to display the energy content of dishes on menu cards to help consumers make informed food choices. In addition, information about other nutrients (protein, carbohydrates including sugars, fat) in the food product should be offered in the form of a booklet and provided to consumers upon request (FSSAI, 2022b). Understanding and interpreting nutritional information can become a challenge to consumers depending on how nutritional information is displayed on the food product (Baxter et al., 2018; Persoskie et al., 2017). Studies have shown that understanding of food labels is better when the participants have some knowledge about nutrients and their health benefits (Moore et al., 2018; Van Der Horst et al., 2019). Utilising colourful pictures with nutritional information has been shown to be a more effective way of facilitating understanding of food labels (Gavaravarapu et al., 2016).
The present study was conducted to assess whether higher income adults read food labels before purchasing food products and whether they understood and used the nutrition information given on labels. Only adults from a higher income group were selected as they were likely to be better educated and would have fewer financial constraints in purchasing packaged food products.
Materials and methods
Study design
The study adopted a cross-sectional survey design with non-probability purposive sampling. Multistage non-probability sampling was used, whereby residential colonies were selected from each city zone by purposive sampling and participants in each selected colony were selected by snowball sampling. The city of Delhi was geographically divided into four zones: north, south, east and west. A total of 23 housing colonies from four geographical zones of the city, north (6), south (6), east (5) and west (6) were purposively selected depending on ease of accessibility and permission from Resident Welfare Associations. Colonies representing the upper middle- and high-income groups were chosen based on the categorisation given by the city’s municipal corporation (Muncipal Corporation of Delhi, 2014).
Sampling criteria for participants
A total of 589 adults in the age group 20–40 years who engaged in food purchase were selected. This study was part of a larger investigation looking at the diet quality and ultra-processed food intake of adults with a sample size of 589 adults, a number decided upon by the proportion of adults with low fruit and vegetable consumption (74%), since this was one of the parameters measured in the study. The online supplemental material provides details of sample size calculation.
A modified version of Kuppuswamy’s Socio-Economic Scale (Singh et al., 2017) was used to categorise participants into income groups based on family income, that is, upper middle-income and high-income groups. Key informants from the Resident Welfare Associations of colonies were contacted, and they helped in identifying other households with adults who met the desired sampling criteria. Thereafter, snowball sampling was used to identify other participants.
Data collection
Data were collected using a mixed methods approach. A pretested questionnaire was used to collect information on sociodemographic characteristics, food label reading habits and participants’ understanding of nutrition information. Participants were asked whether they read the information on the food labels and what kind of information was mostly read by them. They were also asked whether the health claims made on food labels or in advertisements, for example, ‘good for heart, lowers cholesterol, makes bones stronger and so on’, influenced the selection and purchase of food products.
We were also interested to see whether nutrient claims such as ‘high in fibre, zero trans fats and so on’ influenced the choice and purchase of food products. Participants were asked if the presence of a nutrient claim on a packaged food product would likely influence their purchase most of the time, sometimes or hardly ever. Most of the time and sometimes were coded as being influenced by nutrient claims. Similarly, participants were asked if they thought that they understood the nutrition information given on food labels, with responses given as yes or no.
In addition, a total of three focus group discussions (FGDs) were conducted in each of the four geographical zones of the city. In all, 12 FGDs were conducted in groups of six to eight participants (n = 74 participants) on themes such as reading and understanding food labels. The themes and probes were pilot tested on a subsample prior to actual data collection. They were pre-defined and structured to check for desirable responses.
Statistical analysis
The period of data collection lasted from March 2019 to February 2020. Quantitative data were entered in Microsoft Excel and analysed using SPSS software (Version 22). Statistical analysis was performed using Chi-square tests and logistic regression, with a level of significance set at p < .05. Qualitative data involving FGDs were audio recorded, and transcripts were analysed using ATLAS.ti (Version 8).
Ethical clearance
This study was approved by the Institutional Ethics Committee of Lady Irwin College, University of Delhi. Participants were informed about the purpose of the study, and written consent was obtained. Verbal consent from participants was witnessed and formally recorded.
Results
Sociodemographic profile
The sample comprised of equal proportion of men (50%) and women (50%). Participants were divided into two age groups: 20–30 years (76%) and 30–40 years (23%). There were 20% upper middle-income participants and 80% high-income participants using the classification given by the Modified Kuppuswamy’s Socio-Economic Scale, which is based on the monthly family income, education and occupation of the head of family.
Food label reading habits
Food label reading habits among participants (Table 1) showed that most (79%) read food labels, 76% noticed nutrient claims and 77% claimed to understand nutrition information on packaged foods. A higher proportion of women (81%) read food label information before purchasing than men (76%). A higher proportion (χ2 = 15.409, p < .001) of female participants (83%) noticed nutrient claims on packaged food as compared to men (69%). A higher proportion of participants (χ2 = 8.74, p = .003) in the younger age group (20–30 years, 79%) noticed nutrient claims on packaged food as compared to the 30–40-year olds (66%). A higher proportion (χ2 = 7.440, p = .006) of female participants (82%) claimed to understand the nutrition information provided on packaged food as compared to male (73%) participants. Women were more likely to notice nutrient claims on the packet of food products (odds ratio [OR] = 2.07, confidence interval [CI]: 1.38–3.10, p < .01) compared to men after adjusting for age, marital status and income group (Table 2).
Food label reading behaviour before making food purchases.
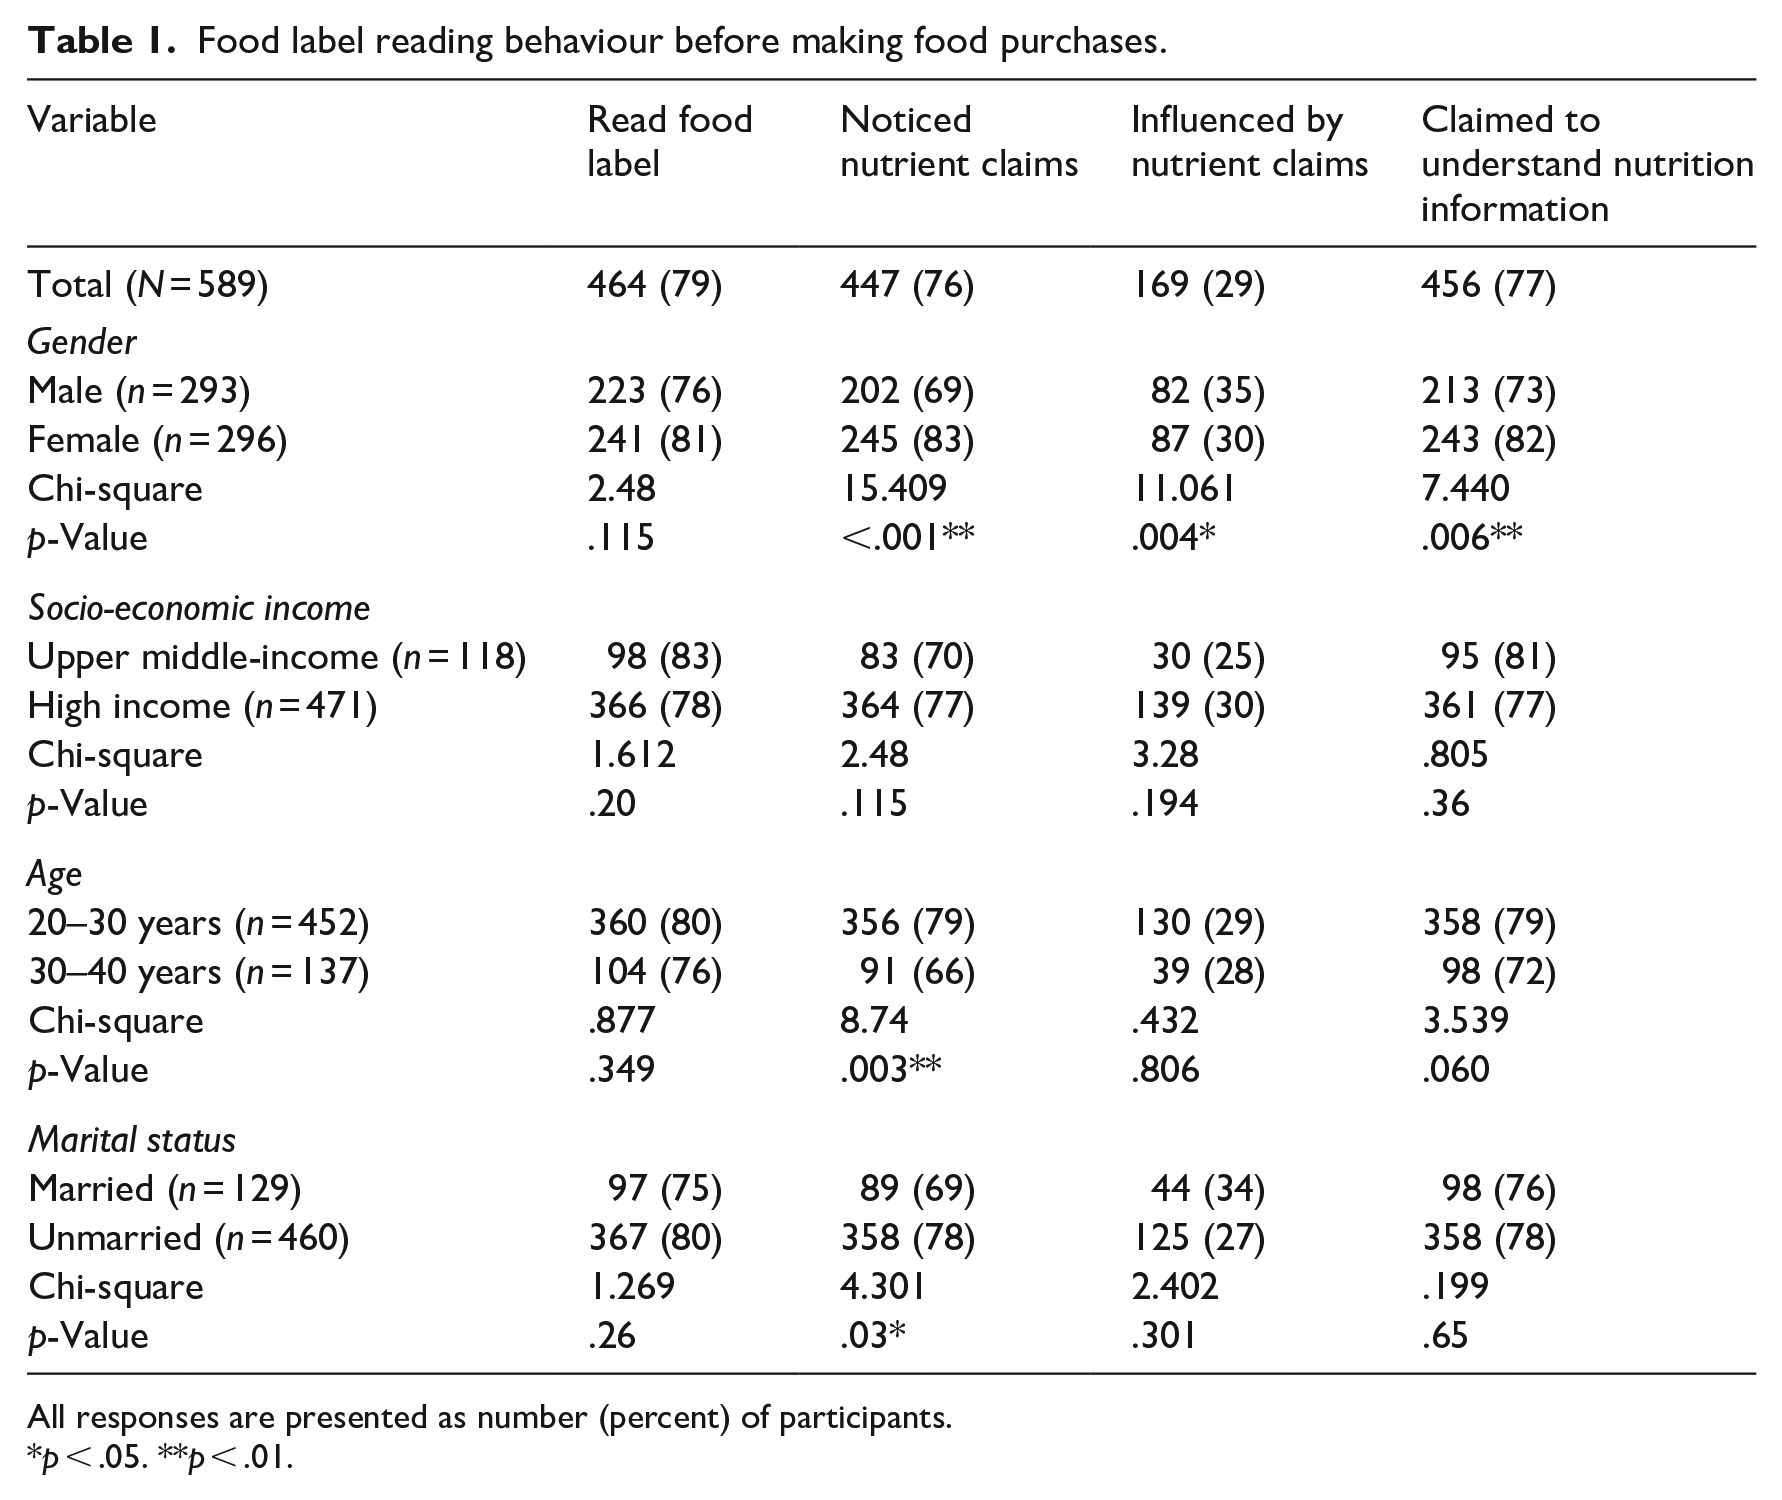
All responses are presented as number (percent) of participants.
p < .05. **p < .01.
Estimated association between noticing nutrient claims and demographic variables by logistic regression.
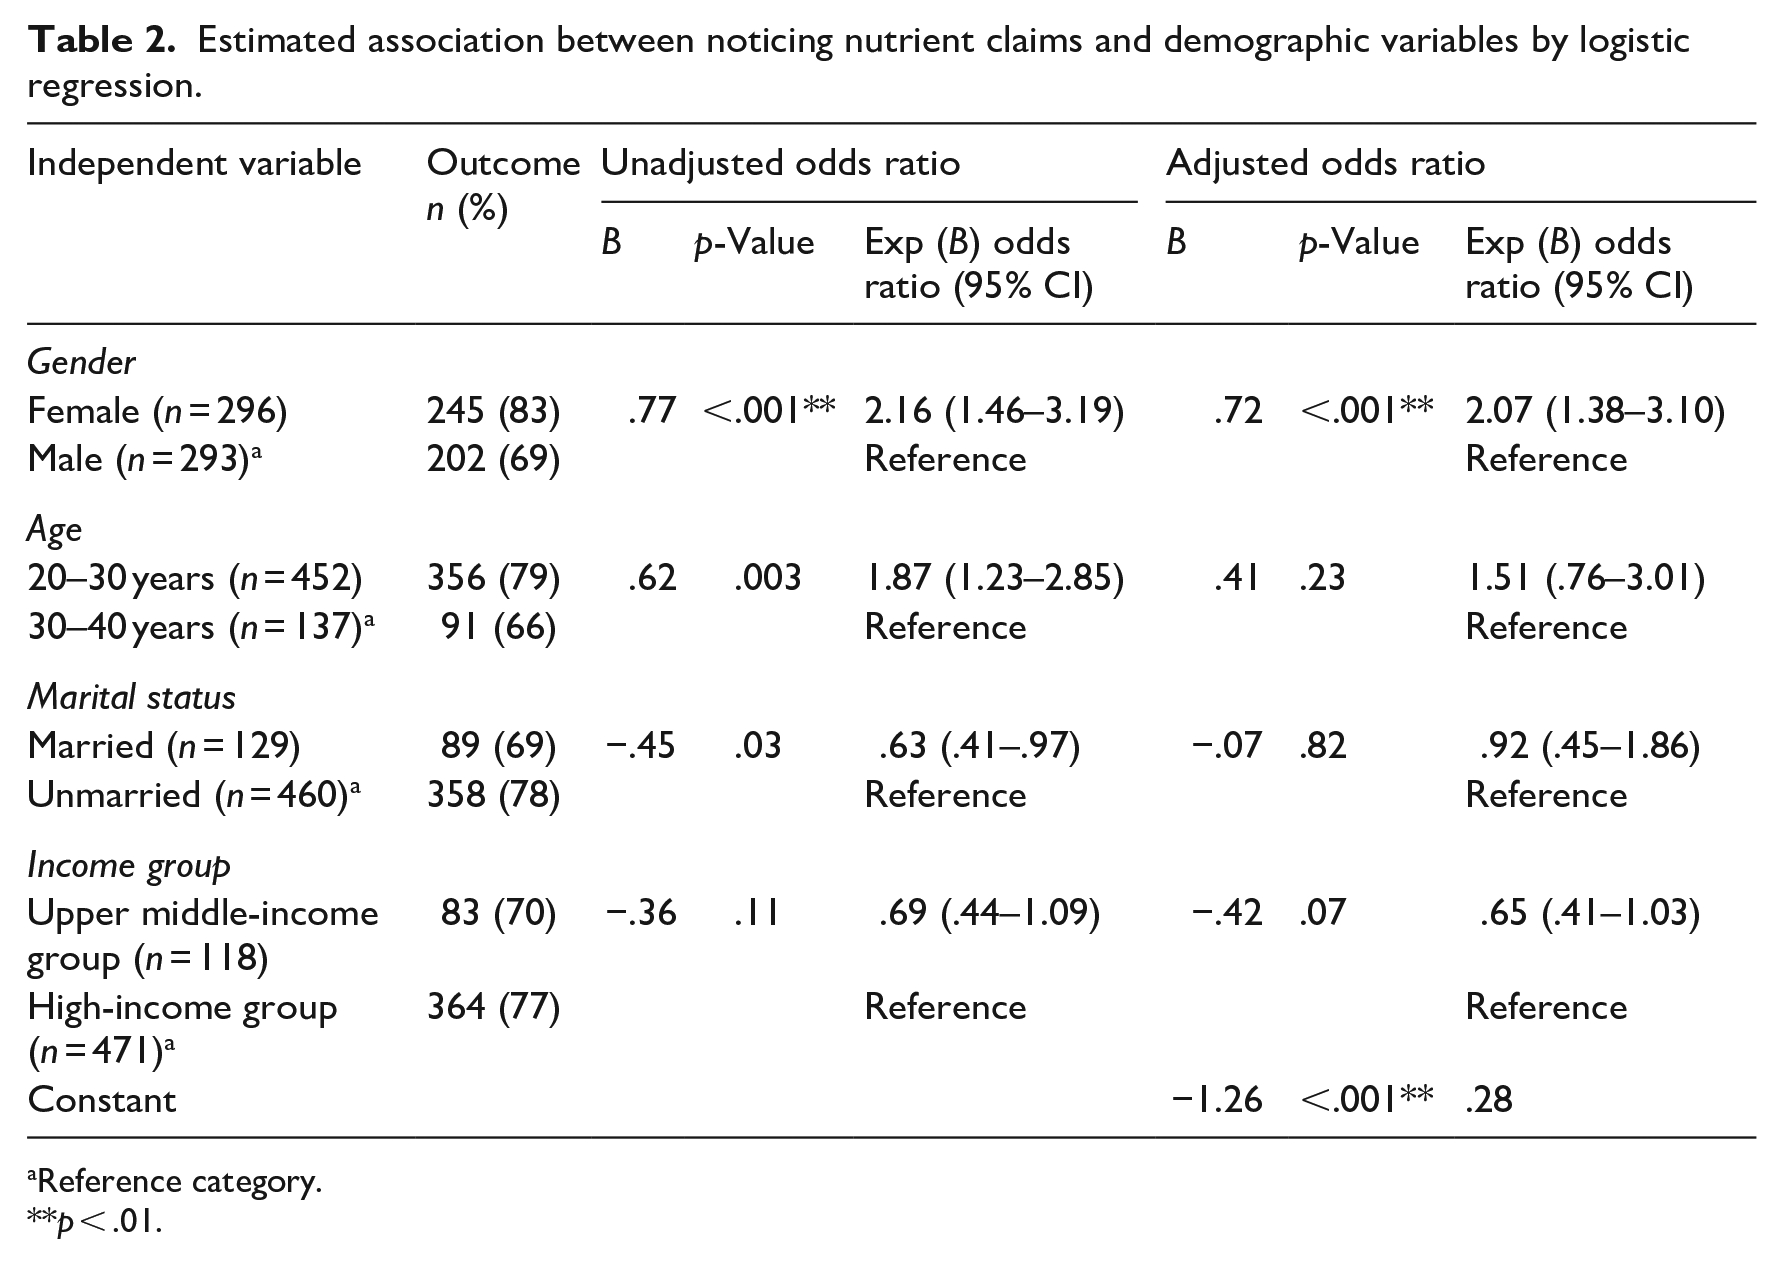
Reference category.
p < .01.
The kind of information viewed by participants is shown in Table 3. The majority of participants (n = 464) looked at the ‘best before date’ (75%). Only a few checked the nutrient content that is fat content (16%) and sugar content (6%). A very small portion of participants (3%) checked the ‘vegetarian/non-vegetarian’ logo on the food label. The kind of food quality symbols viewed by participants showed that some of the participants looked for the FSSAI logo (53%) and Bureau of Indian Standards (Indian Standards Institute [ISI]) logo (30%). A high percentage of participants have never seen the Hazard Analysis Critical Control Points (67%) and International Organization for Standardization logo (63%). Out of all the health claims noticed by participants, such as ‘good for heart, lowers cholesterol, makes bones stronger and diabetes friendly’, most participants (72%) reported being influenced by the health claim ‘lowers cholesterol’. A greater percentage of participants (81%) in the age group 20–30 years had been influenced by the ‘lower cholesterol’ health claim compared with 45% in the age group of 30–40 years as shown in Figure 1.
Food label reading behaviour before making food purchases.
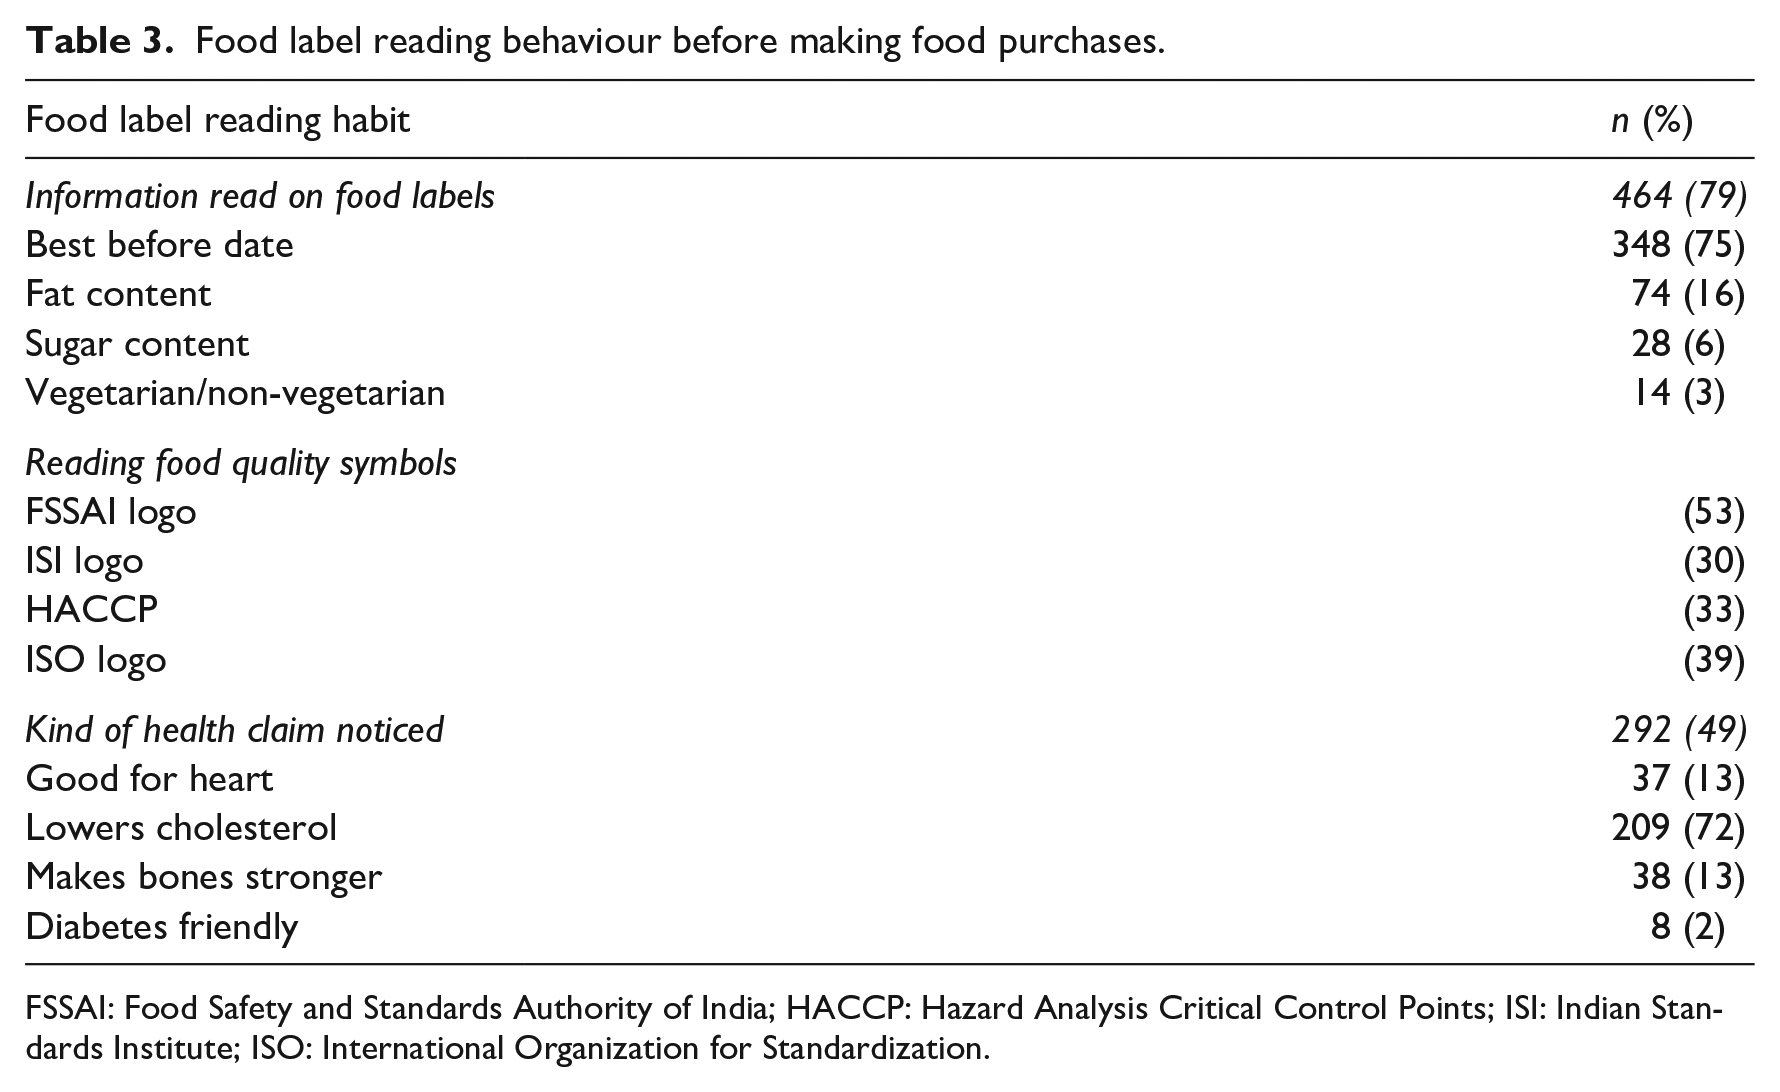
FSSAI: Food Safety and Standards Authority of India; HACCP: Hazard Analysis Critical Control Points; ISI: Indian Standards Institute; ISO: International Organization for Standardization.
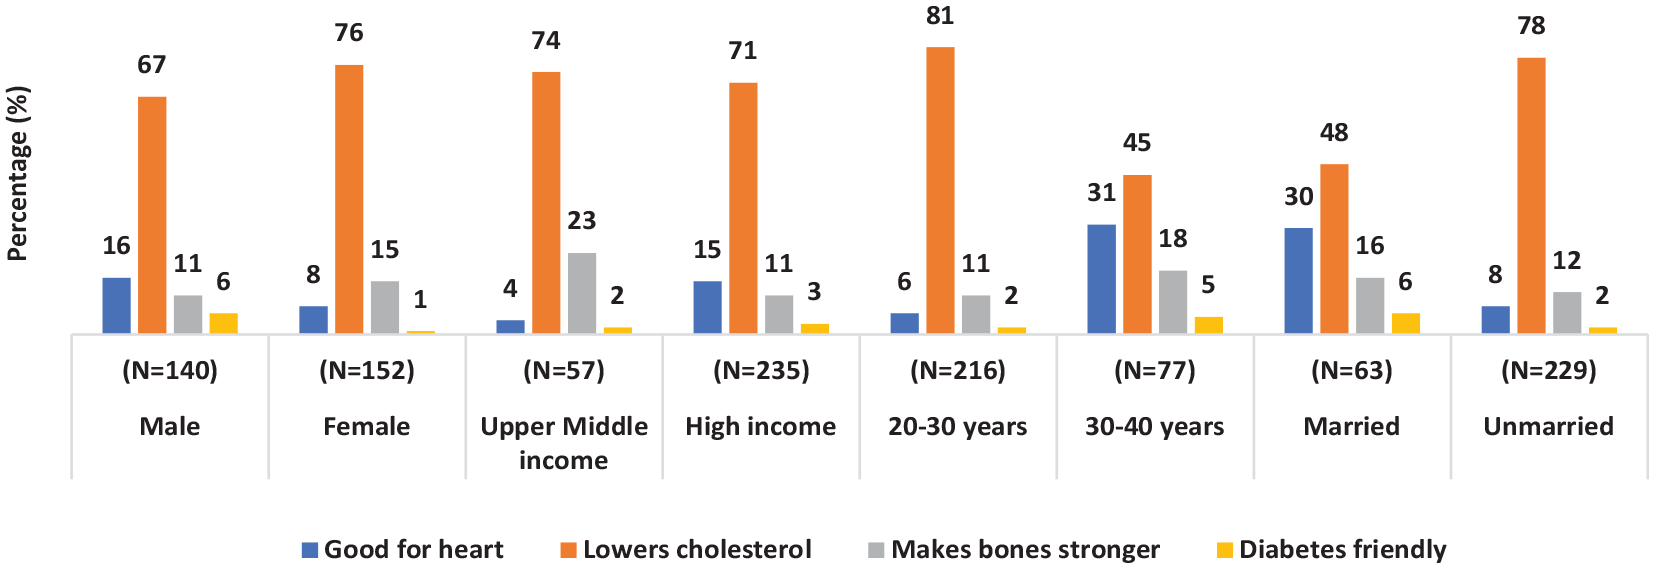
Type of health claims that influence purchase among participants.
Thematic analysis of the data from FGDs on what people read on food labels and what influences their food purchases showed that some participants read of food ingredients, nutrient and health claims and nutritional information because they wanted to know about fat, sugar and calorie content to help them reduce/maintain weight status. Participants had also mentioned that they looked for details about product allergens, but these were often written in very small text and often overlooked. Almost everyone stated they looked at the manufacturing date and expiry date. Two participants in the FGDs reported: I look at whether the product is plant based or animal based, the ingredients, the fat content, the sugar content and the nutritional value of the food product. (24-year-old female participant, East Delhi) I don’t understand much from the nutritional information table on the food packet, so I look at the nutrition claims on the packet to get an idea about the food quality and then purchase accordingly. (38-year-old male participant, West Delhi)
Understanding nutrition information on food labels
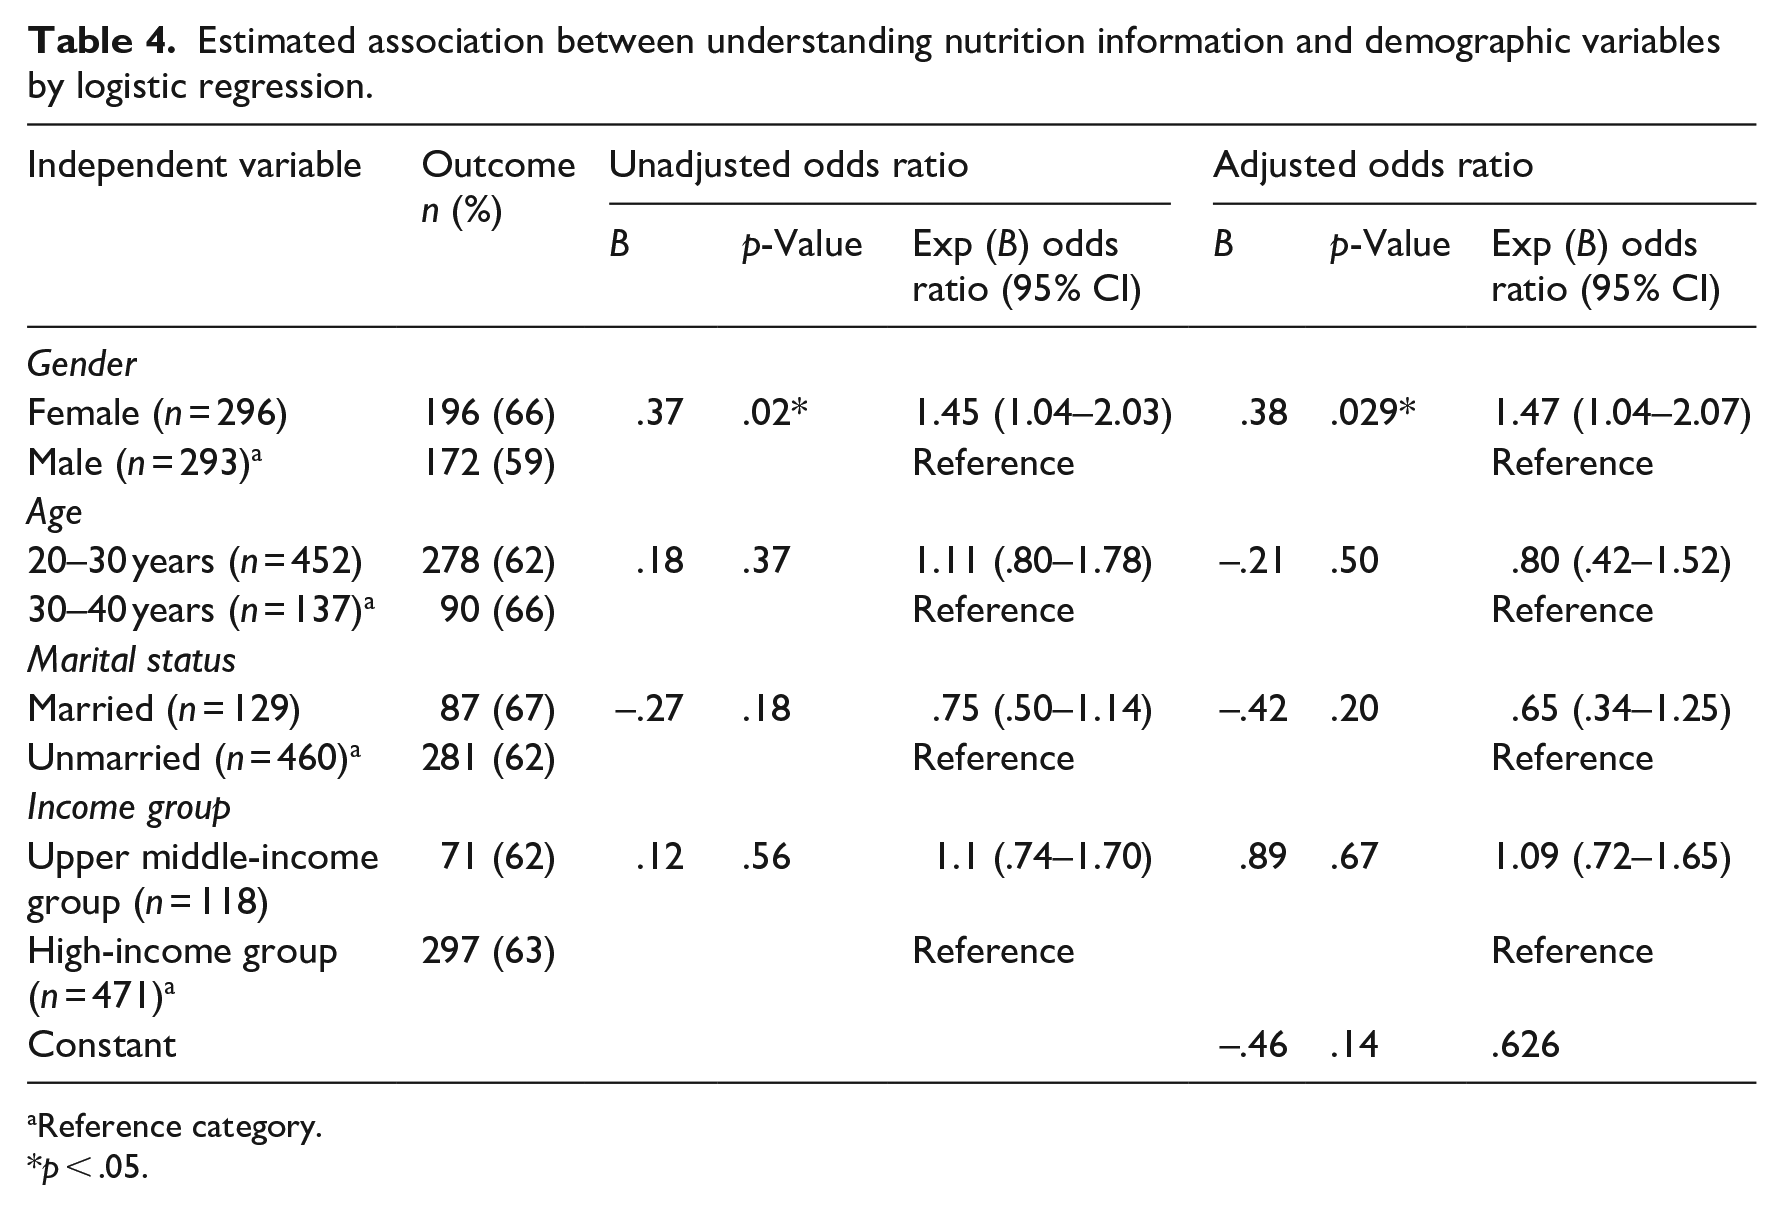
Most participants (77%) reported understanding the nutrition information provided on food labels. Table 4 shows the unadjusted and adjusted associations between understanding nutrition information and demographic variables. Female participants were more likely to report understanding of nutrition information (OR = 1.47, CI: 1.04–2.07, p = .029) compared to male participants after adjusting for age, marital status and income group. Participants were asked if they could identify whether a food product was high or low in a specific nutrient by looking at the nutritional information table on the food label. Most (63%) participants correctly identified a food product low in fat. Around one-third of participants (36%) correctly identified a fibre-rich food product, and only about one-quarter (26%) correctly identified an iron rich-food product. Although the majority of participants (77%) claimed to understand nutrition information, they were unable to identify whether foods were rich or low in specific nutrients such as fat, iron and fibre.
Estimated association between understanding nutrition information and demographic variables by logistic regression.
Reference category.
p < .05.
FGDs on understanding the nutrition information on food labels were facilitated by displaying picture cards of different nutrition labelling schemes such as the tick logo (green tick), the traffic light scheme (colour coding), guidance daily amount ([GDA] percentage of the daily recommended intake) and a nutritional information panel table, to assess which approach was best understood. The majority of the participants were not able to decide if a product was healthy and nutritious by just looking at the nutritional information table. They were not able to understand the nutritional values and percentages written on the packet of food product because of the small size of the text which took a lot of time to read and understand. They responded that the information was mostly written per 100 g and that it would take time to calculate the nutrient content consumed depending on the amount one had eaten. Participants were not able to interpret the information depicted in percentages on the nutritional information table as they did not know how much good or bad for them. Participants expressed the following views during the FGDs: We know that nutrition information is there, but we don’t understand it. For me, it’s just numbers written on the packet, I am not able to decide if it’s good for me or not. (34-year-old male participant, North Delhi) I don’t look at the nutritional information table since it’s in percentage as I won’t understand and don’t have enough time to go through all the nutrients. (36-year-old female participant, South Delhi)
The nutritional labelling scheme, such as the tick logo, was not understood by participants. They felt that while it saved the consumer’s time and gave quality assurance, it did not show the nutrients for which it was providing assurance. Nutritional labelling schemes such as the nutritional information panel and the GDA were liked by a few of the participants. They felt that the nutritional information panel contained rather a lot of information about nutrients, which caused confusion. They were unable to understand and make judgements regarding the healthfulness of a food product.
Some participants felt that GDA was easy to understand as the nutrition information was given in per serve sizes, so the intake of food products could be controlled by looking at the per serve nutrition information. However, out of all the nutrition labelling schemes, the traffic light scheme was the easiest to understand.
The GDA scheme is easy to understand, but the coded system is better, and I cannot understand anything from the traditional nutritional information panel and green tick. (32-year-old male participant, South Delhi)
Participants responded that a colour-coded grading system made it easier to decide if a product was healthy or not. They said it saved their time because they did not need to focus on other nutrients, and the nutrients that are high, medium and low in content, such as sugar, fat, and salt, were colour-coded. This helped one decide whether to purchase a food product or not. The majority of the participants found the traffic light scheme representation time saving and easiest to understand.
The product is colour-coded into low, medium, and high nutrients, so I just need to look at the label and can make the choice in a few seconds. (32-year-old male participant, South Delhi) A coded system is better as it is pictorial, colourful, and classifies foods into low, medium, or high nutrient content. It clearly defines how much the fat content should be and how much the sugar content should be. (27-year-old female participant, North Delhi)
Discussion
In this study, the majority (79%) of participants reported that they read food labels before purchasing food items. In an earlier study conducted in upper and middle-income neighbourhoods in Delhi, around 81% of adults reported using nutrient information only when the serving size was specified on the label (Singla, 2010). In another study conducted in New Delhi and Hyderabad, around 86% adults in the age group of 20–59 years reported checking the food label to ascertain the shelf life of food products. Also, nearly 41% adults looked at the nutritional information, particularly women who checked the fat and sugar content on the labels (Vemula et al., 2013). The findings of the present study also showed that some of the participants checked the label for total fat and sugar content. A higher percentage of female participants and young adults aged 20–30 years checked for nutrient claims on packaged food. In another study conducted among 18–39-year-old adults in Lucknow, a significantly higher percentage of women (83%) read food labels as compared with men (72%), since they were concerned about their body weight and habitually checked the fat and sugar content on the labels to choose low-fat and low-sugar foods (Kumar and Kapoor, 2017).
Most participants reported not reading the nutritional information because they could not understand it; however, they relied on nutrient and health claims that were linked to beneficial health outcomes. A nutrient claim on a food product highlights the nutritional characteristics of the product and describes the level of nutrient in that food product, like ‘high in’, ‘rich in’, ‘low in’ and also compares between two or more foods like ‘lesser than’, ‘more than’, ‘increased’. A food product health claim on the other hand shows the relationship between the ingredients of the food product and its positive contribution to health, like ‘reduction in’, ‘good for heart’ and ‘improves bone health’ (FSSAI, 2021).
In this study, most participants reported understanding the nutrition information given on food labels in the questionnaire. Most of them, however, were not able to interpret whether the product was rich or low in a particular nutrient. In the FGDs, participants reported that they were unable to identify healthier food options from the nutrition information. They relied on the presence of ingredients like oats, millet, whole grains and so on and nutrient claims mentioned on the label to select ‘healthy’ products. Graphical representations of nutrient profiling help consumers to understand the healthfulness of a product. Nutrient profiling model such as the ‘traffic light’ system was better understood by participants in this study. As the ‘tick’ logo did not provide any details, it was not found suitable by participants who were trying to reduce specific nutrients in their diet like fat or sugar. Studies elsewhere have shown that the traffic light labelling format helps consumers choose food products with lower total calorie, fat, sugar and salt better than the GDA labelling format because it is colour-coded (Babio et al., 2014; Finkelstein et al., 2019). A study conducted across 14 states among rural and urban Indians across all income groups showed that a ‘Warning’ label was the most preferred food label followed by a ‘Multiple Traffic Light label’ (Bhattacharya et al., 2022).
Food labels, specially front-of-pack labels, have been found to be effective in communicating the healthfulness of a food product (Hawley et al., 2013). The usefulness of a front-of-pack symbol may vary based on the degree to which it assists consumers in choosing healthy food items (Hodgkins et al., 2012). A non-directive system like the GDA scheme provides nutritional information per ‘portion size’ or per ‘100 g’ or as ‘percentage of the daily recommended intake’ (Arrúa et al., 2017). A semi-directive system like the traffic light displays nutrient content information by colour coding on the basis of a set threshold as red (high), yellow (medium) and green (low; Food Standards Agency [FSA], 2013). Directive symbols like the ‘tick logo’ display whether the product meets the set nutrient criteria but does not provide nutrient content information (Ducrot et al., 2015). In India, a front-of-pack labelling symbol has been proposed, called the Indian Nutrition Rating that has been developed with an aim to reduce the consumption of packaged foods which are high in fat, sugar and salt. It displays a ranking of food products out of 5 points, where 5 is the healthiest and .5 is the least healthy. Food products are given a composite score based on the nutrient content of energy, saturated fat, sugar, sodium, fruits and vegetables, nuts, legumes and millets, fibre and protein per 100 g/ml of solid or liquid food products (FSSAI, 2022a).
The over-consumption of packaged, ultra-processed foods that are generally high in sugar, salt, fat and energy can lead to increased risk of obesity and diet-related non-communicable diseases (Gopalan et al., 2018). In urban India, the prevalence of high blood sugar level is 17.9% among men and 16.3% in women, while rates of elevated blood pressure are 26.6% among men and 23.6% in women (NFHS -5, 2021). Policies that aim to reduce such diet-related non-communicable diseases have started utilising nutritional labelling schemes such as ‘front of pack’ to increase the visibility and understanding of the nutritional quality of the food product (Kleef and Dagevos, 2015). However, food labels need to be clear and simple in design so that consumers can easily understand them, with information being provided about nutrients such as total fat, sugar and salt (Roberto and Khandpur, 2014). A labelling format that is also colour-coded and designed in a simple manner can enable better selection of healthier food choices.
Limitations
A limitation of this study concerns the fact that participants’ responses were self-reported and we did observe their everyday practices. This study was conducted in Delhi and only on younger adults in the upper middle-income and high-income groups, which limits generalisation of the findings to other regions and to other income and age categories. Further studies on label design and nutrient profiling models that can improve consumer understanding of nutrition labels and ease the selection of healthier food options should be carried out.
Conclusion
The paper provides information on food label reading habits and understanding of nutrition information on labels among adults, relatively affluent consumers in the age group of 20–40 years. Food labels can be used as an effective tool to communicate healthier food choices among people. Most participants reported that they read nutrition labels (79%) and noticed nutrition claims (76%), and the majority said they understood nutritional information (77%). However, only a few could correctly identify an iron-rich (26%) and a fibre-rich (36%) food product. The problems faced in interpreting nutritional information in the current format were not being able to convert the nutrient content from per 100 g to the amount of the food product eaten and understanding the significance of the percentage recommended daily values given. Participants also felt that they did not have sufficient time to look at multiple food labels and compare the nutritional information on each. The most favoured nutrition labelling format took the form of ‘traffic lights’ as majority of the participants thought this approach was easiest to interpret due to its colour coding. Labelling regulations need to ensure that food labels are designed in a simple way to aid understanding and enable healthier food choices.
Supplemental Material
sj-docx-1-hej-10.1177_00178969231172131 – Supplemental material for Understanding of nutrition information on food labels among higher income adults in India
Supplemental material, sj-docx-1-hej-10.1177_00178969231172131 for Understanding of nutrition information on food labels among higher income adults in India by Srishti Mediratta and Pulkit Mathur in Health Education Journal
Footnotes
Funding
The author(s) disclosed receipt of the following financial support for the research, authorship, and/or publication of this article: the first author (SM) was in receipt of a senior research fellowship (ID-1509/NET -DEC.2015) from the University Grants Commission, India.
Availability of data and materials
The data described in the manuscript are available upon reasonable request to the corresponding author.

Supplemental material
Supplemental material for this article is available online.
References
Supplementary Material
Please find the following supplemental material available below.
For Open Access articles published under a Creative Commons License, all supplemental material carries the same license as the article it is associated with.
For non-Open Access articles published, all supplemental material carries a non-exclusive license, and permission requests for re-use of supplemental material or any part of supplemental material shall be sent directly to the copyright owner as specified in the copyright notice associated with the article.
