
Abstract
Introduction:
Fruit and vegetable (FV) consumption is low among adolescents, and waste of these foods is high in school cafeterias. The objective of this research was to determine the impact of behavioural economic strategies and structural lunchroom changes on FV selection and waste in high-school lunch programmes using the collaborative efforts of teachers, food service directors and students.
Methods:
A pre-post quasi-experimental design was used to collect plate waste data for 3 days in the autumn and 3 days in the spring semesters. Five high-school cafeterias from three rural and two urban counties in Montana participated. School Lunch Advisory Councils selected and implemented behavioural economic strategies that focused on increasing selection and decreasing waste of FVs served on the main service line and salad bar. Plate waste data were collected using direct weighing and the quarter-waste method. Preintervention to postintervention plate waste amounts were compared using descriptive statistics and the Mann-Whitney U test.
Results:
Vegetable selection at the salad bar significantly increased (p < .05). Vegetable waste significantly decreased at the main service line (p < .05). Fruit selection and waste did not significantly change.
Conclusion:
Changes in the lunchroom environment through behavioural economic strategies provide one avenue to increase selection and decrease waste of vegetables, ultimately influencing overall dietary quality among high-school students and creating more sustainable food systems.
Introduction
Intake of fruits and vegetables (FVs) among high-school-aged students remains low in the USA (Centres for Disease Control and Prevention [CDC], 2011a). Eating school meals has the potential to positively impact students’ FV intake and preferences (Cullen et al., 2009; Davis et al., 2009; Longacre et al., 2014). High-school students participating in the National School Lunch Program (NSLP) have access to a variety of FVs (Food and Nutrition Service, 2019). In 2010, the Healthy, Hunger-Free Kids Act updated meal patterns and nutrition standards for the NSLP (US Department of Agriculture (USDA), 2010).
According to the Healthy, Hunger-Free Kids Act, schools that participate in the NSLP must offer the following components for each meal: meat/meat alternative, vegetable, fruit, grain and milk. High schools are required to incorporate Offer versus Serve, a NSLP provision designed to reduce waste and allows students to select at least three meal components, with one or more components providing half a cup of a fruit or vegetable, from the main service line, salad bar or both (USDA, 2010).
Behavioural economics in lunchrooms aim to guide students towards better choices by changing environmental cues. The Smarter Lunchrooms Movement has been used as a model to apply behavioural economics in school cafeterias to ‘nudge’ (i.e., encourage movement towards) students to make healthier choices (Greene et al., 2017; Hanks et al., 2013; Just and Wansink, 2009). Researchers have suggested that involving community in the development and testing of interventions increases programme effectiveness and sustainability (Goh et al., 2009; Nollen et al., 2007). Specifically, previous studies demonstrate the value of participatory research in schools, showing that students are often able to express their needs and define opportunities otherwise unseen by researchers and policymakers (Asada et al., 2017; Goh et al., 2009; Spencer et al., 2019).
The lunchroom environment, defined as ‘when and where children obtain food and the types of options available during the school day’ (Welker et al., 2016), has also been used as intervention point to promote healthy behaviours among adolescents (CDC, 2011b; Wechsler et al., 2000). The lunchroom environment has shown to influence students’ eating habits (Hart et al., 2003; Power et al., 2010). However, there is limited evidence, and a call for more research about how the lunchroom environment impacts food choices, consumption and waste at the high-school level, specifically, is needed (Adams et al., 2015; Quinn et al., 2018). Furthermore, food waste research indicates that FVs are the most studied and most wasted meal components across the NSLP (Byker Shanks et al., 2017), and there are few studies that examine strategies to decrease FV waste in high-school populations.
Therefore, the current study aimed to test the impacts of implementing behavioural economic strategies selected by a School Lunch Advisory Council (SLAC) on increasing FV selection and decreasing FV waste at five high schools across Montana drawing upon data collected by participatory methods that included teachers, food service directors and students.
Methods
Design
Using a pre-post single-group experimental design, five high schools were recruited from three rural and two urban counties in Montana (Supplemental Table 1). One school had recently started Community Eligibility Provision. All the schools approached were recruited to participate, and no schools declined. Food service directors were approached to participate in a community-led behavioural economics intervention focused on lunchroom environment redesign to support increased selection and decreased waste of FVs served on the main service line and salad bar with concepts tested from the Smarter Lunchrooms Movement (Just and Wansink, 2009). Waste data for the study were collected before and after intervention implementation to determine students’ selection and wastage of school foods.
Student Lunch Advisory Council–led behavioural economics intervention
For the intervention, each school formed a SLAC that included a food service director, a teacher and several students who brought different strengths and perspectives to the development of the intervention. A food service director understands what is feasible to change on a structural level and manages the cafeteria food system; a teacher is a leader figure in the school and often has the trust of students and three to five students, who are directly affected by the lunchroom environment, have the lived experience of using the cafeteria and an understanding of their peers’ desires and behaviours.
The SLAC was provided with a standardised list through the scorecard (described below) of behavioural economic strategies, as well as lessons about each. They engaged in selecting at least three behavioural economic strategies that focused on FVs (see Table 1). SLAC teams were provided with training materials adapted from the Smarter Lunchrooms Movement and asked to meet at least four times before the intervention period to participate in training and identification of behavioural economic strategies (Just and Wansink, 2009). The training materials used are included in the Let’s Eat! Engaging Students in the Smarter Lunchrooms Curriculum Guide (Montana State University [MSU] Food and Health Lab et al., 2017).
Smarter lunchroom strategies selected by School Lunch Advisory Councils in five Montana high schools participating to increase selection and decrease waste of fruits and vegetables.
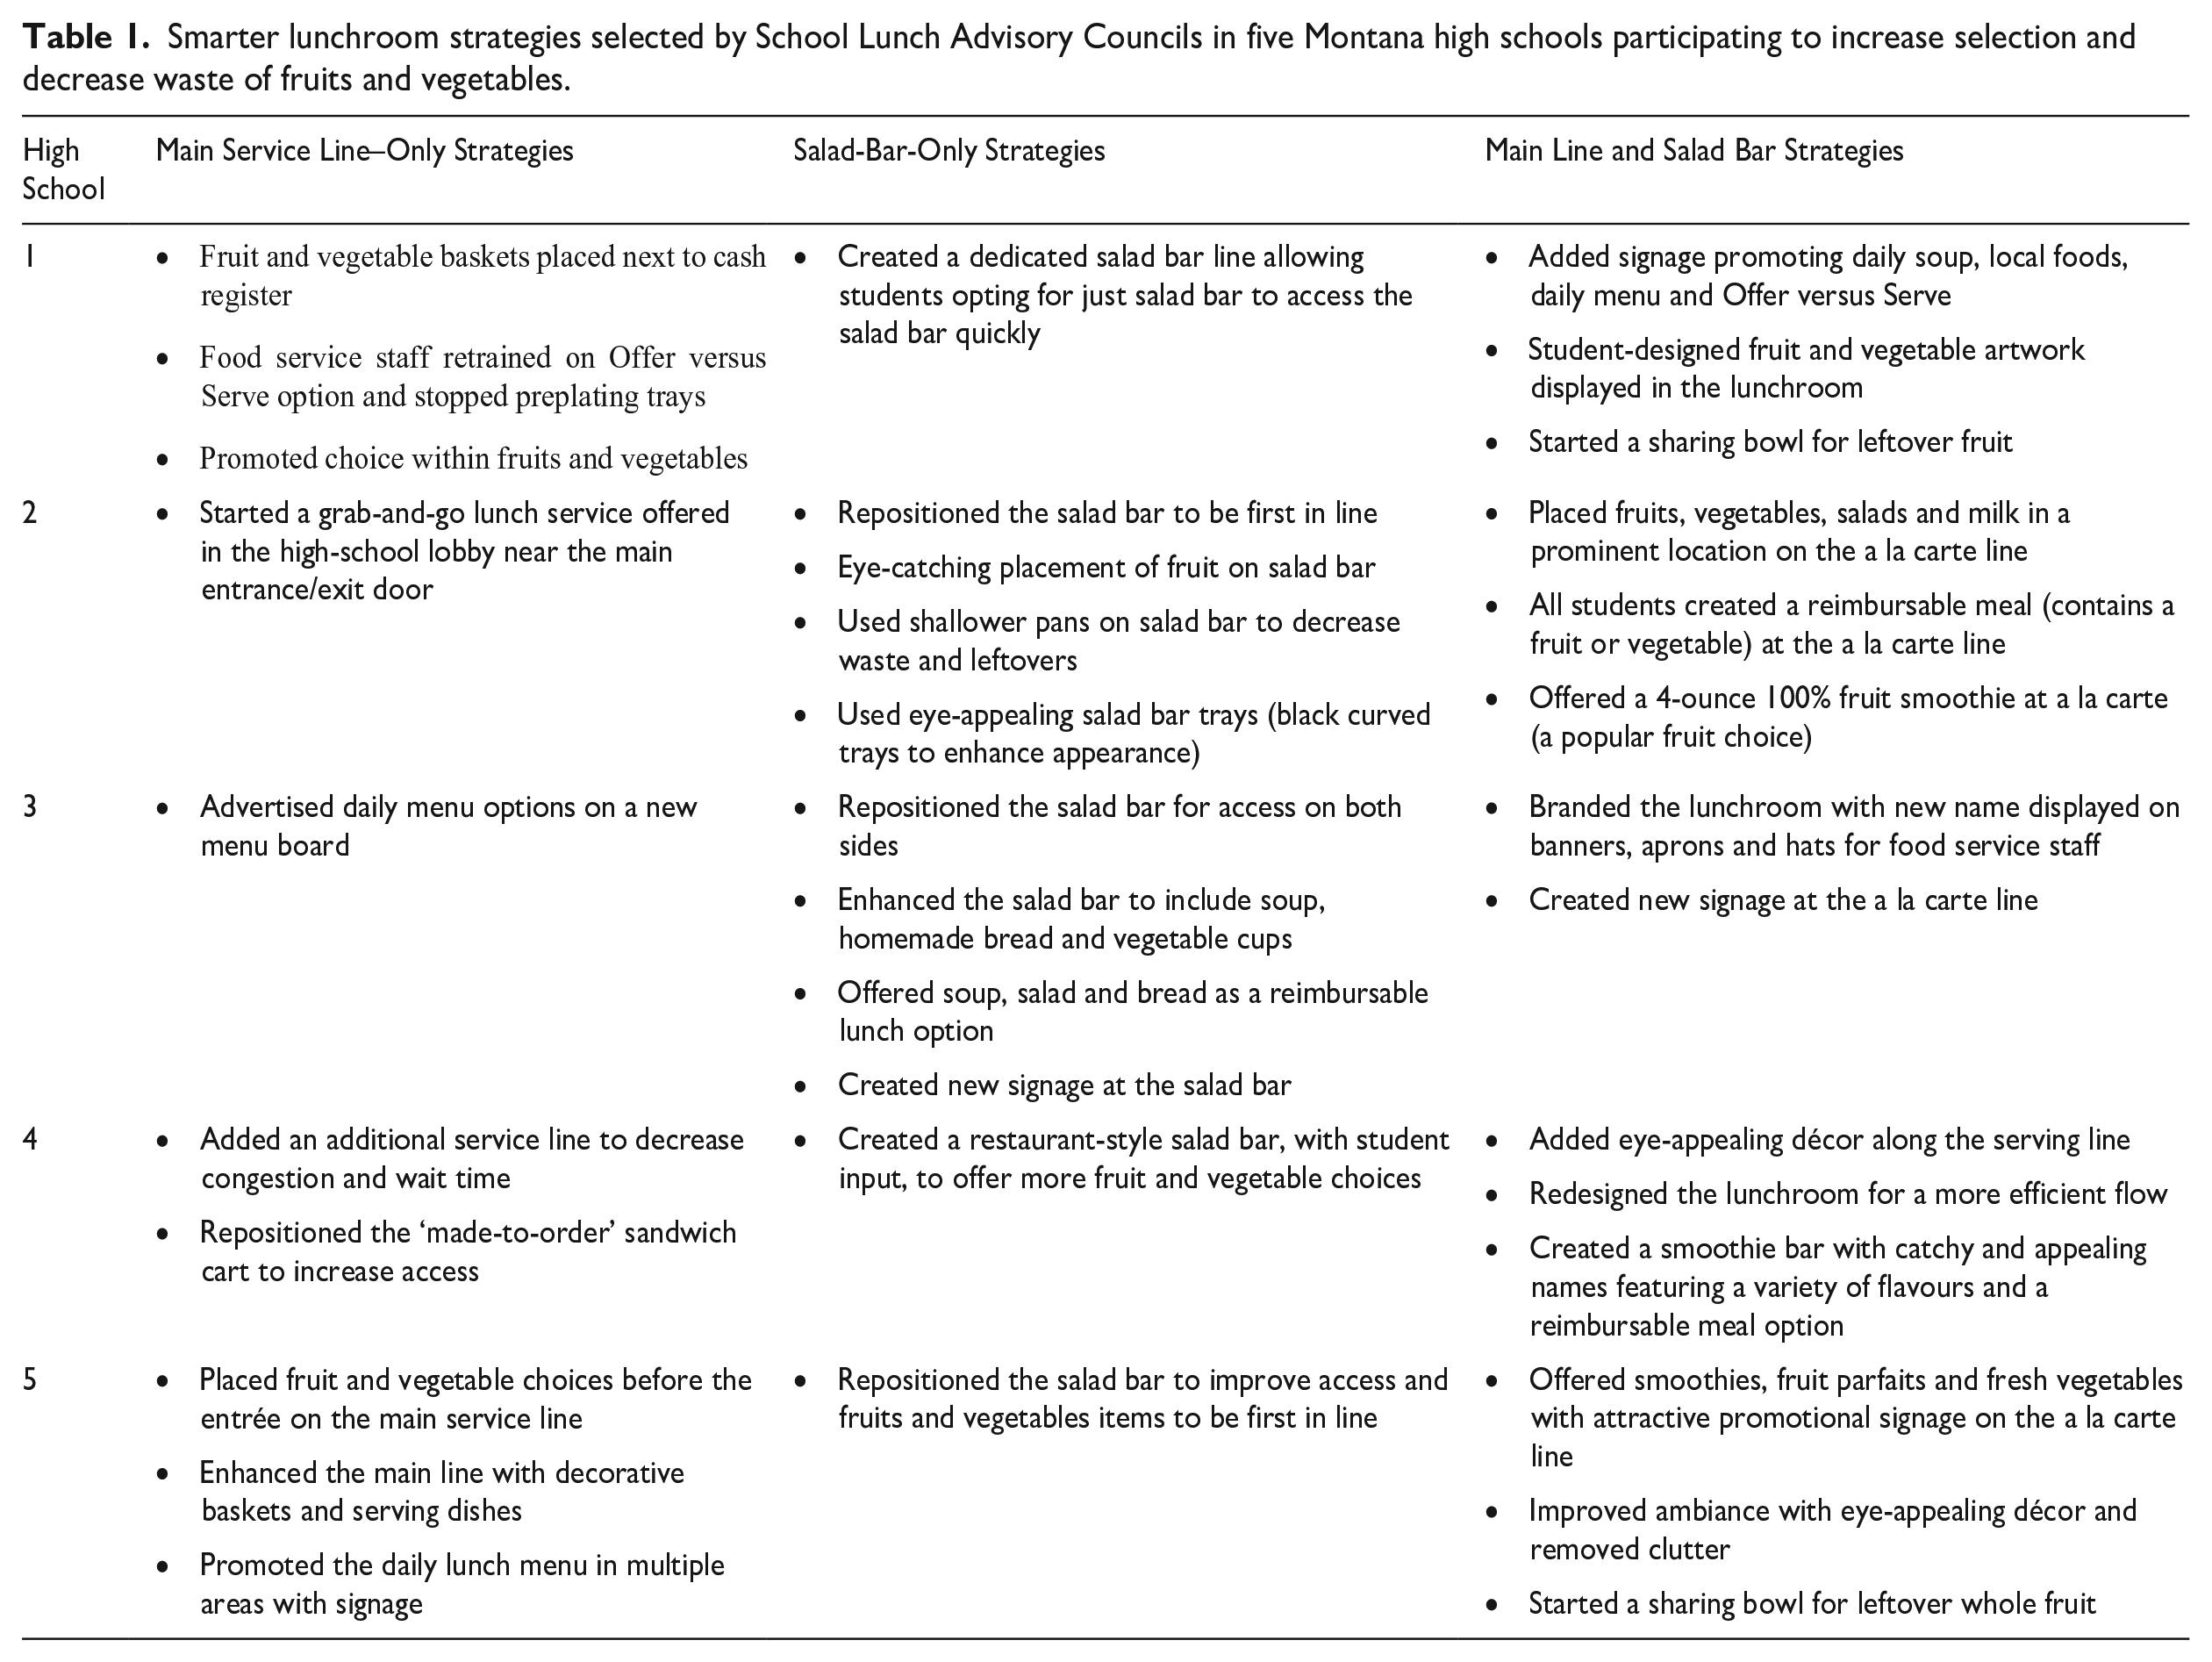
SLAC members conducted observations of their cafeteria using a Smarter Lunchrooms Self-Assessment Scorecard and took photos of their observations (Just and Wansink, 2009). The scorecard was designed as an evaluation tool to identify strengths and weaknesses in the following areas of the lunchroom environment: inclusion of fruit, vegetables and salad and milk; identify meal combinations eligible for inclusion in the NSLP; atmosphere; student involvement and school involvement. Using the results from the assessment, SLAC teams prioritised strategies that might increase students’ selection and decrease waste of FVs on the main serving line and in the salad bar. The strategies selected were based on the six principles of Smarter Lunchroom design, including manage portion sizes, make healthy choices more convenient, improve the visibility of healthier foods, enhance taste expectations, utilise suggestive selling (prompts) and use smart pricing and bundling strategies (Just and Wansink, 2009). Schools were guided to implement strategies simultaneously at least 1 month before. Postintervention waste data were collected to normalise, or allow students to get used to, the intervention.
Measurements
Data collection occurred for 3 days in the autumn, preintervention, and 3 days in the spring, postintervention, at each high school during the 2014–2015 academic year. Because the serving sizes are standardised for foods and beverages served through the NSLP, food waste studies that occur as part of the NSLP can measure the uneaten edible portion of the food or beverage served to an individual. That is, the uneaten edible portion of food or beverage can be subtracted from the standard serving size to calculate consumption.
The research team developed a food waste protocol, which utilised the quarter-waste method for the main service line and direct weighing for both the main service line and the salad bar (Hanks et al., 2013; MSU Food and Health Lab et al., 2017). The quarter-waste method is a rapid assessment tool that demonstrates high reliability and involves visually assessing if none, one-quarter, one-half, three-quarter or all of a food item has been eaten on a tray from the original serving size (Hanks et al., 2013). Data collectors included the project directors, students, staff and dietetic interns, all of whom were trained using the food waste protocol during training sessions. After the training session and before data collection, data collectors paired to practise the quarter-waste method and assess trays until three in a row were measured the same to establish interrater reliability (Hanks et al., 2013). This study was declared exempt by the Montana State University Institutional Review Board as no human subjects data were collected. School nutrition directors and principals at each high school approved this study.
Tray collection
As soon as the lunch service began, two researchers positioned themselves at the waste table, which was placed in front of the rubbish bins and tray returns at each school. After students had finished eating, researchers asked them to leave their tray or other lunch items (packed lunch, a la carte) on the data-collection table. Researchers conducted the quarter-waste method to assess meal components from the main service line and used direct weighing for milk waste and salad bar waste (Hanks et al., 2013). Milk waste was not a goal of this study, and the methods and results are published elsewhere (Byker Shanks et al., 2020). After data had been recorded, researchers discarded the meal components and returned the tray to the tray return.
Because food selection and waste from NSLP meals and salad bar were the focus of this study, foods brought from home or other locations and a la carte foods were collected but not assessed. Across the five schools, less than 10% of NSLP meals served were served to adults, and these trays were entered into the study for analysis to account for the amount selected on the main service line and salad bar.
Main service line
Schools were asked to serve the same meals at preintervention and postintervention, as much as possible, on the main service line, unless the behavioural economics intervention required a change in menu (Supplemental Table 2). Researchers worked with school food service staff to record all meal components offered, determine the appearance of a standard serving size, weigh each meal component four times to determine an average serving size weight and collect participation numbers at the end of lunch. Fruit returned to a share table were subtracted from food waste.
Salad bar
Before the lunch service, the total weight of each salad bar item placed on the salad bar was calculated. The researchers tared the scale with an empty container, weighed all salad bar items on the tared scale four times to ensure a consistent weight and recorded the weight. The number of students (and adults, when applicable) selecting food from the salad bar during each lunch period was recorded manually by one researcher with a hand clicker. The weight of salad bar waste on each student tray was measured. At the end of the lunch service, each leftover salad bar item was weighed. Fruits returned to a share table were subtracted from food waste.
Analysis
All weights were collected and recorded using ZIEIS (Z15-EZS; Apple Valley, MN, 2013) digital scales (accurate to 5 g) in grams, which were then converted to ounces using Microsoft Excel (version 14.0; Microsoft Corporation, Redmond, WA, 2010). Meal components and salad bar items were categorised into food types: fruit, vegetables, grain, meat/meat alternate, mixed food, fried potato products and unsure.
From the quarter-waste method data collected on the main service line, the percentage of food consumed and wasted was calculated by multiplying the amount consumed or wasted by the average weight of the standard serving size. From the weight data collected on the salad bar, the percentage of food selected and wasted at the salad bar was calculated by taking the weight of food wasted from the salad bar and student trays in grams and dividing it by the total food weight served in grams. The percentage of food selected, consumed or wasted was examined.
Preintervention and postintervention waste data were analysed for significant change with the Mann-Whitney U test given the small sample size. SPSS (Version 24; SPSS Inc., Chicago, IL) was used for statistical analysis.
Results
The five high schools averaged 36.5% student participation rates in the lunch programme, with 45.6% of students eligible for free and reduced school meals in autumn 2014. Four of the five schools had an open campus lunch policy, whereby students were allowed to leave campus during the lunch period to consume food. A school policy also allowed students at all schools to eat their meals outside the cafeteria.
SLACs met up to four times and selected five to eight strategies from their self-assessment and discussions of what was feasible to change and what was needed in their lunchrooms (Table 1). Schools implemented different behavioural economic strategies selected from a common set of Smarter Lunchroom approaches between 1 and 2 months before post-data collection. Many schools placed FVs near the cash register or in attractive containers, added a menu in the lunchroom, created signage to promote FVs, redesigned the flow of the lunch line and/or created more reimbursable meal options; all these were small, easy, structural changes made to the lunchroom environment.
To measure the effectiveness of the collective strategies selected by the SLACs, 4,673 school lunch trays were observed during the study period, which included observation of 9,880 separate food items. The number of trays observed daily at each school varied: school 1 (M = 185.50, SD = 35.44, trays per day, total = 1,113 trays), school 2 (M = 205.50, SD = 48.16, trays per day, total = 1,233 trays), school 3 (M = 67.83, SD = 11.79, trays per day, total = 407 trays), school 4 (M = 230.33, SD = 46.62, trays per day, total = 1,382 trays) and school 5 (M = 89.67, SD = 6.31, trays per day, total = 538 trays). In total, 5,720 food items were observed at preintervention, and 4,160 food items were observed at postintervention, with 1,789 trays containing salad bar food items at preintervention and 1,472 trays containing salad bar food items at postintervention. The total weight of food served per student was very similar when compared between the preintervention and postintervention time points (average weight at preintervention = 5.45 oz; postintervention = 5.97 oz).
When preintervention and postintervention values for the percentage of food wasted were compared by food category across all five schools, significant increases in waste were found for meat/meat alternates and mixed foods along with a significant decrease in waste of vegetables (p = .000) and total food (p = .008). School 4 served fried potato products at preintervention and postintervention on the main line, and a significant decrease was observed (p = .000). Table 2 displays the percentage of food wasted by food category from preintervention to postintervention.
Percentage of food wasted from main line – preintervention to postintervention behavioural economics study in five Montana high school lunchrooms.
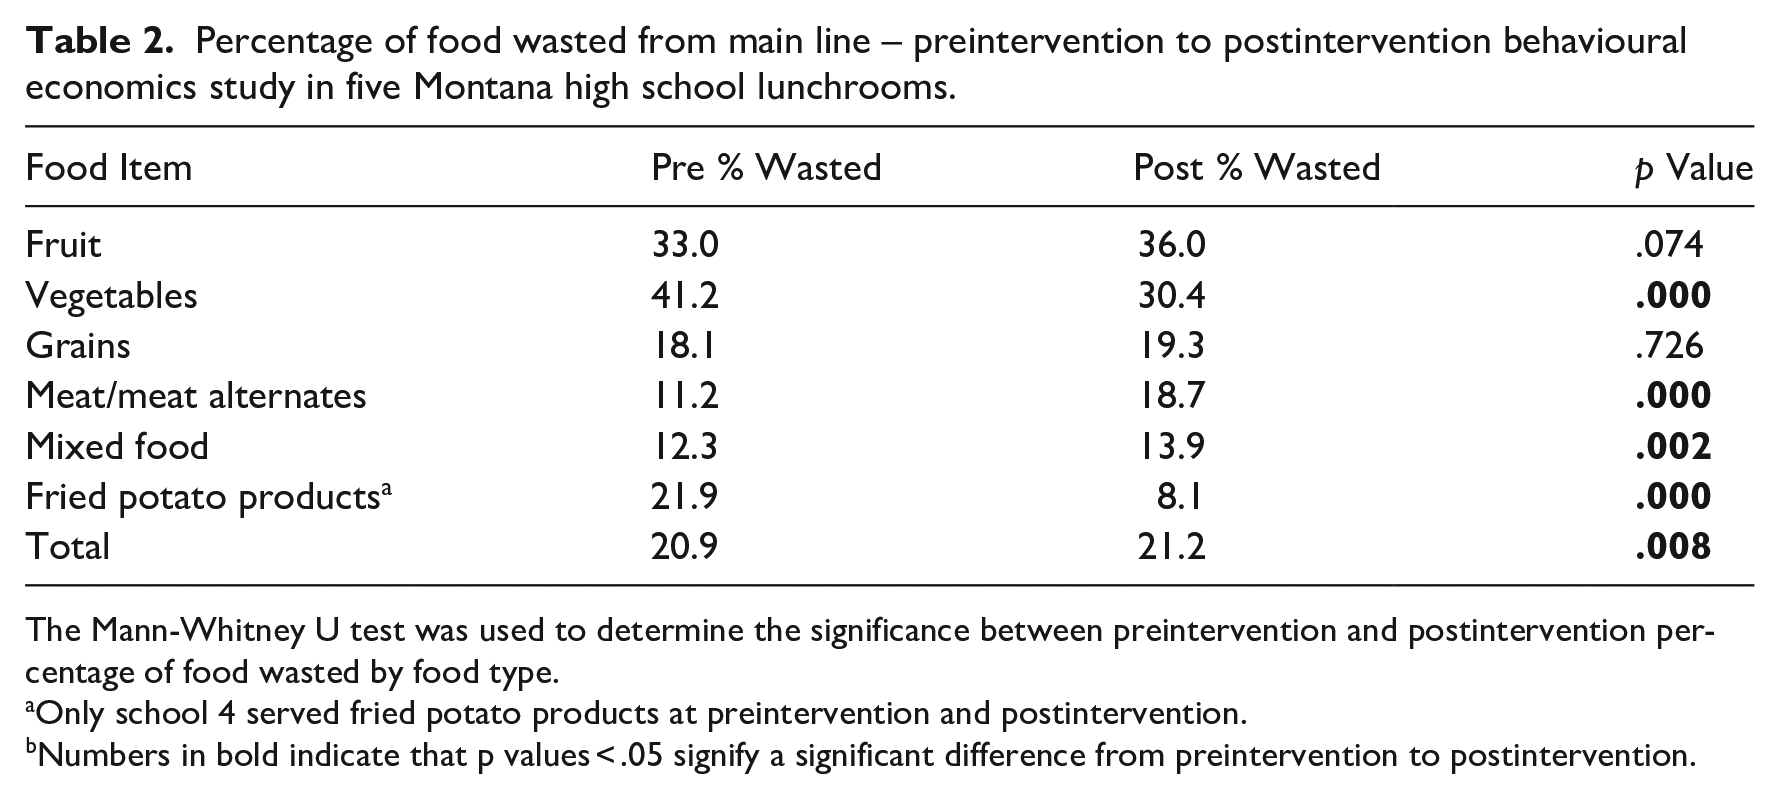
The Mann-Whitney U test was used to determine the significance between preintervention and postintervention percentage of food wasted by food type.
Only school 4 served fried potato products at preintervention and postintervention.
Numbers in bold indicate that p values < .05 signify a significant difference from preintervention to postintervention.
The results were compared individually for each school, and some variations were found for percentage of food waste by food category (Table 3). Three out of the five schools reported a decrease in waste of vegetables, and two out of five schools reported a decrease in food waste. Most notably, four out of the five schools showed an overall decrease in total percentage of food waste across food categories.
Difference in percentage of food wasted from preintervention to postintervention by food category associated with the behavioural economics intervention.
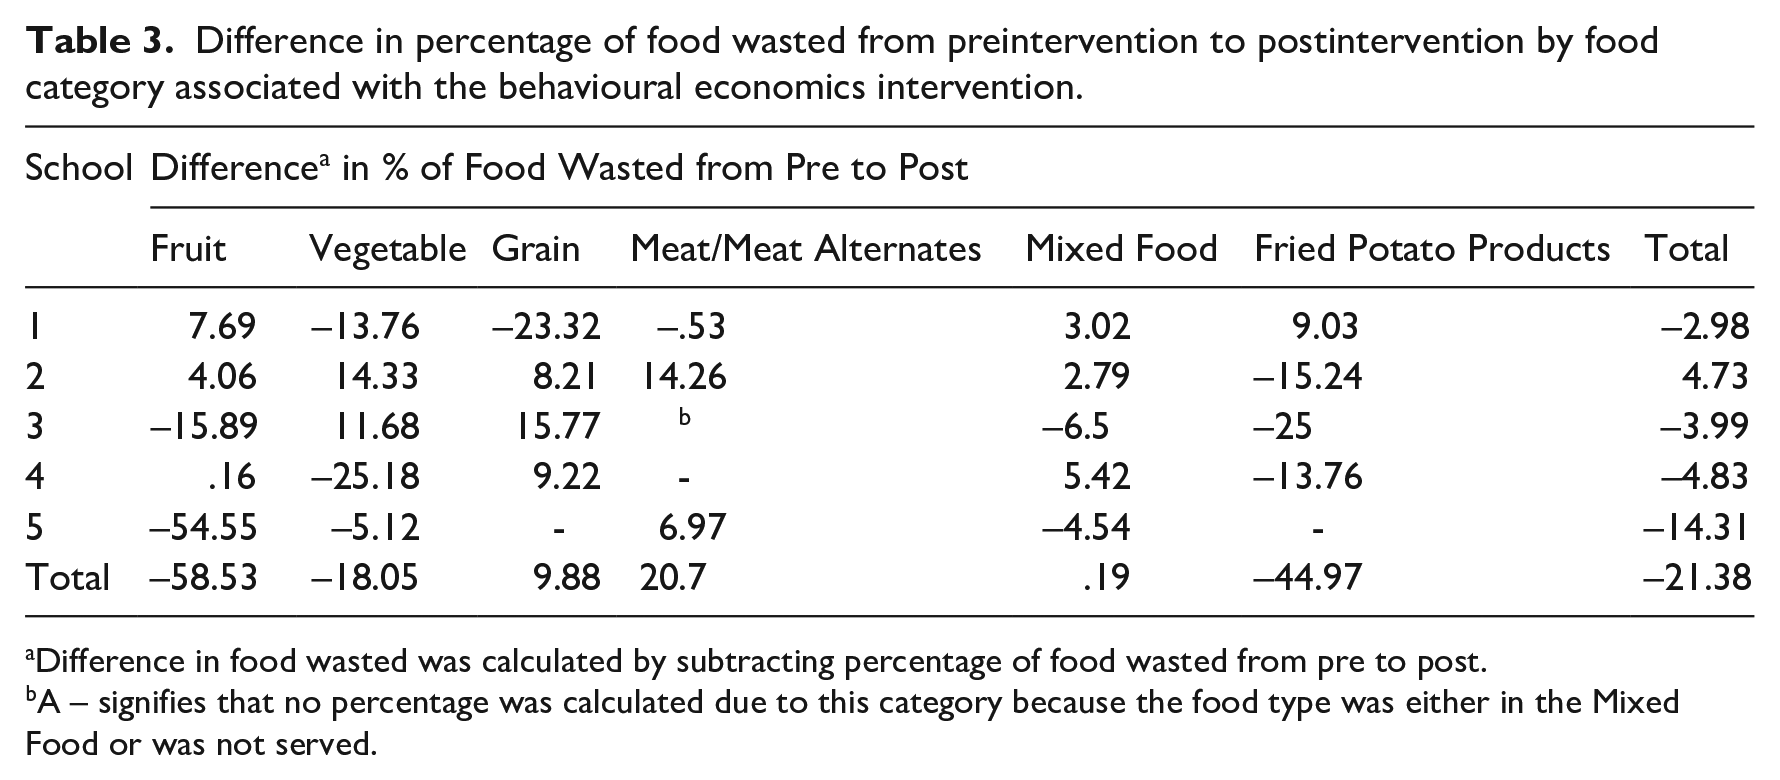
Difference in food wasted was calculated by subtracting percentage of food wasted from pre to post.
A – signifies that no percentage was calculated due to this category because the food type was either in the Mixed Food or was not served.
When preintervention and postintervention values for the percentage of food items selected per student at the salad bar across all five schools were compared, there was an increase in the percentage of vegetables selected by students. All other food categories (except mixed and other foods) showed an increase in the percentage of food selected from the salad bar between preintervention and postintervention. Table 4 displays the percentage of food items selected by food category between preintervention and postintervention at the salad bar. Fruit selection remained the same, while vegetable selection significantly increased per student (p = .014).
Percentage of food items selected at salad bar – preintervention to postintervention behavioural economics study in five Montana high school lunchrooms.
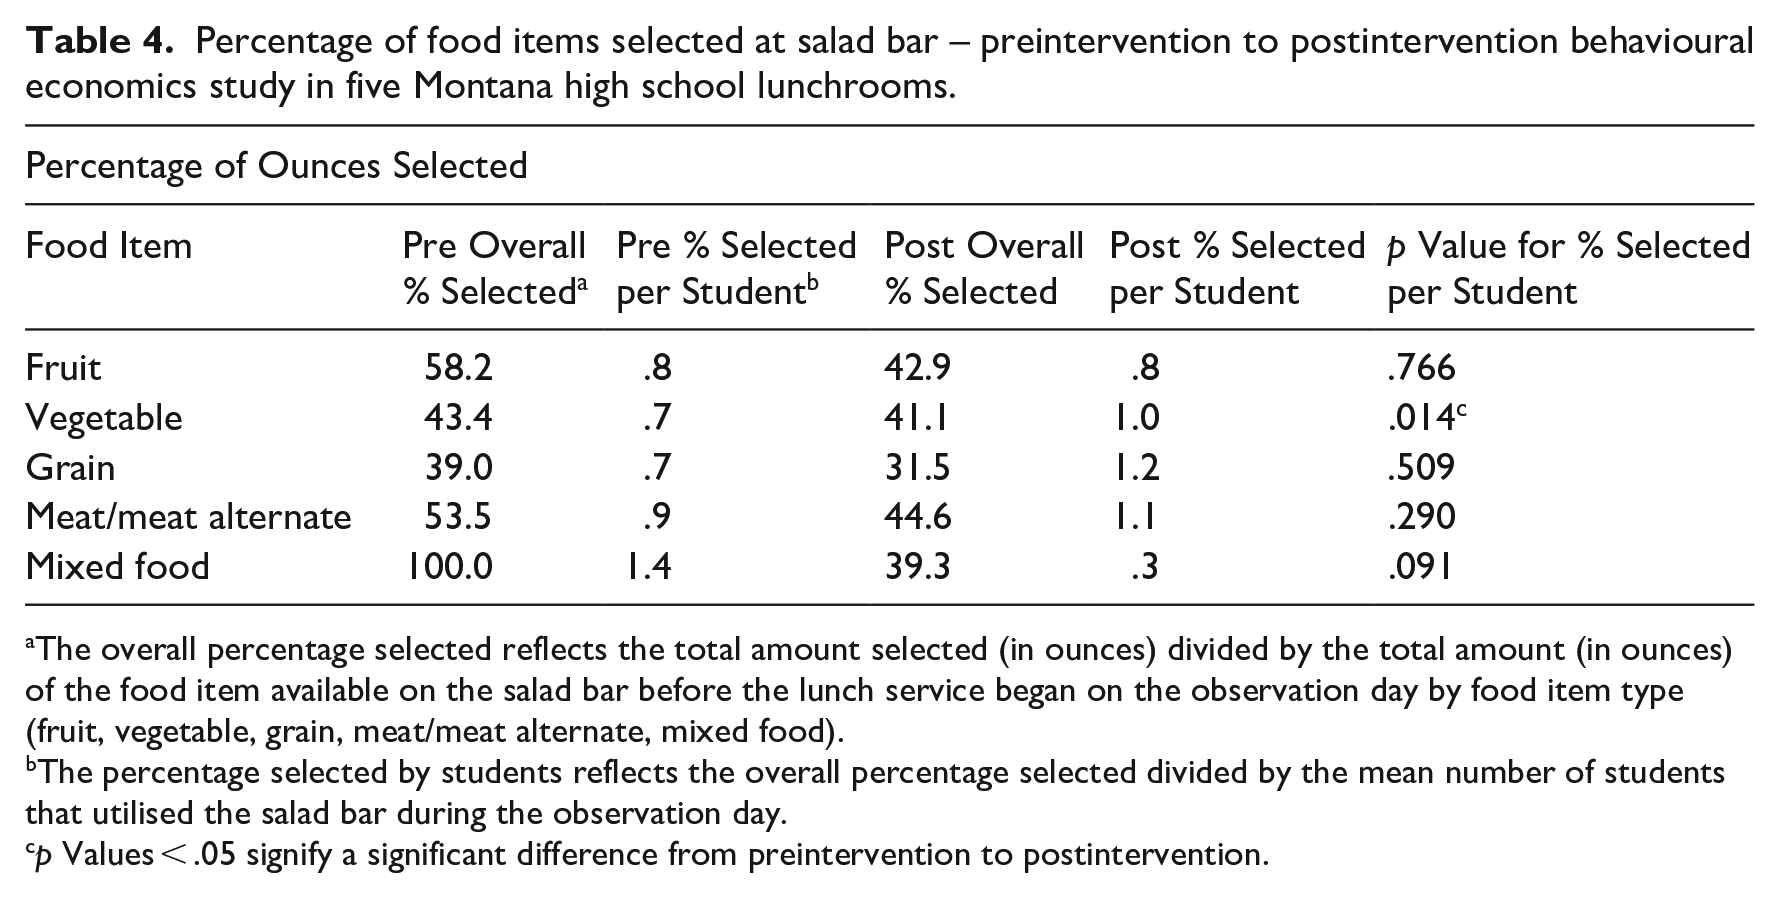
The overall percentage selected reflects the total amount selected (in ounces) divided by the total amount (in ounces) of the food item available on the salad bar before the lunch service began on the observation day by food item type (fruit, vegetable, grain, meat/meat alternate, mixed food).
The percentage selected by students reflects the overall percentage selected divided by the mean number of students that utilised the salad bar during the observation day.
p Values < .05 signify a significant difference from preintervention to postintervention.
Discussion
Five high schools in Montana implemented different behavioural economic strategies and cafeteria food environment changes that focused on FVs and were determined through a student-led approach. Each site developed a SLAC in which three to five students were directly involved with the assessment, planning and implementing of Smarter Lunchroom strategies. This approach may accommodate the complex school setting.
This study demonstrated a reduction in the percentage of total food wasted and total vegetables wasted across five schools. One school demonstrated a decrease in waste of fried potato products. Because all the school sites in this study focused on FVs using behavioural economic strategies, the decrease in wasted vegetables is promising. Reductions in food wasted within any category is a positive outcome of the behavioural economic strategies implemented, as food thrown away in school lunches contributes to loss of value from resources spent on food, food wasted from the US food supply, and missed nutrients for students (Spiker et al., 2017).
There was no significant change in fruit wasted on the main service line or selected on the salad bar across all schools. Children have a natural preference for fruit (Baxter and Thompson, 2002; Edwards and Hartwell, 2002), and selection and waste at preintervention and postintervention were relatively high, creating potential ceiling and floor effects, which have been seen in other Smarter Lunchrooms research studies (Thomas et al., 2016). In addition, an increase in the percentage of food wasted for meat/meat alternates and mixed food was found. Future research should examine if a decrease in vegetable waste, and therefore an increase in consumption, leads to satiety, thus effecting minimal change in fruit selection and waste and decreasing consumption of meat/meat alternates and mixed food. Milk waste, which was measured alongside this study, was found to be low at preintervention and postintervention (Byker Shanks et al., 2020). Future research should investigate the tradeoffs that occur in meal components when consumption of one food group increases during school meals.
Additional research should explore the feasibility and effectiveness of flexible portion sizes on selection, consumption and waste of meal components. Plate waste may be an indicator of excessive portion sizes (Buzby and Guthrie, 2002), and as long as policy exists that requires a specific serving portion, food waste may be a significant issue in schools. If school meals could be evaluated on offering a variety of FVs on service bars and main lines but had flexibility in portion size, there may be less waste (Liz Martins et al., 2020). Furthermore, studies have shown that excessive plate waste could indicate that students are not fully benefitting from the nutrients offered from school meals (Baik and Lee, 2009; Cohen et al., 2013; Smith and Cunningham-Sabo, 2014).
Limitations
This study is not without its limitations. The sample included five schools in one state, Montana, so may have limited generalisability. The findings may be most applicable to schools in other large rural states or similarly sized schools. However, the findings are fairly robust as each school underwent 3 days of preintervention and postintervention data collection. In addition, there was varied selection of Smarter Lunchrooms strategies implemented across the five schools, which were selected by the student-engaged advisory council based on the results of the scorecard. A systematic review of diverse Smarter Lunchrooms interventions demonstrates its positive impact of improved selection, higher consumption and reduced waste across food groups, including fruits and vegetables (Mumby et al., 2018). Drzal et al. (2020) point out that, although Smarter Lunchrooms strategies have been widely implemented, some but not all have been rigorously assessed in the school setting.
Future research should confirm which specific strategies lead to effectiveness, and this real-world testing of Smarter Lunchrooms strategies may have practical implications that can be further tested in more controlled studies in the future. All the schools included in the current study had open campus policies, meaning students were able to purchase food off-site if they preferred. This open campus policy may have impacted the results, potentially limiting the number of students that participated. In addition, there were some differences between preintervention and postintervention assessment in terms of the food items served and the number of trays served. Schools were encouraged to serve similar meals and amounts at both time points, but fluctuations naturally occurred as well as differences due to the behavioural economic strategies used.
Finally, the current study measured plate waste by USDA NSLP food category but did not assess the nutritional quality of the food items selected and wasted. Future efforts should be placed into developing a user-friendly method for assessing the nutritional quality of food consumed in a school lunchroom setting, perhaps using an established criterion such as the Healthy Eating Index (Schap et al., 2017).
Conclusion
The successful student-engaged approach to developing and implementing structural lunchroom changes with behavioural economic strategies used in this study helps build the growing literature highlighting the need for sustainable changes to improve the food environment (Quinn et al., 2018; Story et al., 2008). Findings demonstrated a reduction in waste of vegetables and total foods across five schools, as well as an increase in selection of vegetables from salad bars among some participating schools. The benefits of increased FV intake on physical health are well known, and increased FV intake has also been shown to result in short-term improvements in motivation and psychological well-being among young adults (Conner et al., 2017). Future studies should assess the impact of SLAC-led strategies versus non-SLAC-led strategies on selection, waste and other variables (e.g., school lunch participation). These are promising results that can be further tested in future studies and should be matched with testing specific strategies, consumption of foods as well as food waste (Quinn et al., 2018). Food waste is costly to schools’ challenged budgets and has broader public health impacts on food security, the environment and sustainable diets. Food waste in schools is a significant issue that should be addressed with urgency.
Supplemental Material
sj-docx-1-hej-10.1177_00178969231172727 – Supplemental material for School Lunch Advisory Councils’ use of behavioural economics influences vegetable selection and waste
Supplemental material, sj-docx-1-hej-10.1177_00178969231172727 for School Lunch Advisory Councils’ use of behavioural economics influences vegetable selection and waste by Carmen Byker Shanks, Molly Stenberg, Katie Bark, Betty Izumi, Casey Hoff and Courtney A Parks in Health Education Journal
Footnotes
Funding
The author(s) disclosed receipt of the following financial support for the research, authorship, and/or publication of this article: this research was partially supported by Cornell BEN Centre Grants Programme under the award number 77867-10660, a 2013 United States Department of Agriculture (USDA) Team Nutrition Training Grant awarded to the Montana Office of Public Instruction and the National Institute of General Medical Sciences of the National Institutes of Health under award numbers P20GM103474 and 5P20GM104417. The content is solely the responsibility of the authors and does not necessarily represent the official views of the Cornell BEN Centre, the USDA or the NIH.
Supplemental material
Supplemental material for this article is available online.
References
Supplementary Material
Please find the following supplemental material available below.
For Open Access articles published under a Creative Commons License, all supplemental material carries the same license as the article it is associated with.
For non-Open Access articles published, all supplemental material carries a non-exclusive license, and permission requests for re-use of supplemental material or any part of supplemental material shall be sent directly to the copyright owner as specified in the copyright notice associated with the article.